

Programmable DNA-based metafluorophores allow simultaneous tagging and imaging with more than 100 virtual colors.
Keywords: DNA nanotechnology, fluorescence microscopy, Metafluorophores, single molecule fluorescence, Multiplexed Imaging, Biophysics, self assembly
Abstract
Fluorescence microscopy allows specific target detection down to the level of single molecules and has become an enabling tool in biological research. To transduce the biological information to an imageable signal, we have developed a variety of fluorescent probes, such as organic dyes or fluorescent proteins with different colors. Despite their success, a limitation on constructing small fluorescent probes is the lack of a general framework to achieve precise and programmable control of critical optical properties, such as color and brightness. To address this challenge, we introduce metafluorophores, which are constructed as DNA nanostructure–based fluorescent probes with digitally tunable optical properties. Each metafluorophore is composed of multiple organic fluorophores, organized in a spatially controlled fashion in a compact sub–100-nm architecture using a DNA nanostructure scaffold. Using DNA origami with a size of 90 × 60 nm2, substantially smaller than the optical diffraction limit, we constructed small fluorescent probes with digitally tunable brightness, color, and photostability and demonstrated a palette of 124 virtual colors. Using these probes as fluorescent barcodes, we implemented an assay for multiplexed quantification of nucleic acids. Additionally, we demonstrated the triggered in situ self-assembly of fluorescent DNA nanostructures with prescribed brightness upon initial hybridization to a nucleic acid target.
INTRODUCTION
Fluorescence microscopy is a powerful tool for biological research (1). Beyond imaging molecules in bulk, its high specificity and sensitivity allow the detection of single biomolecules (2, 3). This is usually achieved with fluorescent tags, such as genetically encodable fluorescent proteins (4, 5), organic dyes, or inorganic fluorescent nanoparticles (6). While fluorescent proteins can be coexpressed with the target protein of interest, organic and inorganic dyes need to be coupled, for example, to antibodies, small molecules, or DNA to specifically label targets such as proteins or nucleic acids (7).
A major advantage of fluorescence microscopy is the possibility of simultaneously detecting and identifying multiple molecular species in one sample by using spectrally distinct fluorescent tags (colors). However, this so-called multiplexed detection is typically restricted by the number of unambiguously detectable spectral colors in the visible range; the broad emission spectra of organic fluorophores limit spectral multiplexing to about four to five dyes.
Thus, fluorescence microscopy is in need of novel types of programmable tags, which allow the unambiguous detection of ideally hundreds of distinct target species while maintaining the desired properties of “classical” dyes, such as their nanoscale size and target labeling capabilities. However, only limited success toward programmable molecular tags has been achieved so far (8–10), mainly because of the lack of independent and precise control of properties, such as intensity, color, size, and molecular recognition.
Here, we introduce a general framework for engineering sub–100-nm–sized tags with digitally tunable optical properties, such as brightness and color, using tools from DNA nanotechnology (11–16). Each tag is composed of multiple organic fluorophores, organized in a spatially controlled fashion in a compact subdiffraction volume. This makes the composite fluorophore tag appear similar to a traditional organic fluorophore when visualized under a diffraction-limited microscope. Inspired by the definition of metamaterials, we therefore call this tag a metafluorophore.
However, unlike a traditional organic fluorophore, this metafluorophore has digitally and independently tunable optical properties, such as intensity levels and color mixing ratios. To construct these particles, we use DNA nanostructures as a platform to organize organic fluorophores in a subdiffraction volume. A great variety of fluorescent nanoparticles have been constructed by doping or filling a suitable carrier [for example, silica nanoparticles (SiNP), polystyrene particles, hydrogels, and dendrimers] with fluorophores (17) and have been used in diverse bioimaging applications. In contrast to these previous fluorophore-decorated nanoparticles, the DNA nanostructure–based metafluorophore has the unique advantage of enabling digitally tunable control of the exact copy number of the fluorophores over a large dynamic range (one to hundreds) and digitally precise control of the color ratio as well as the spatial arrangement of these fluorophores.
This independent tunability of both intensity and color enables the construction of more than 100 well-defined metafluorophores. An intensity-based multiplexing approach expanded with combinations of multiple colors can thus overcome the limitations of spectral multiplexing, and the metafluorophores can serve as nanoscale intensity codes (analogous to “barcodes” and hereafter referred to as such) for high-content imaging.
Traditionally, there have been several ways to create unique barcode signatures based on properties such as geometry (10, 18–26) and intensity (8–10, 25, 27–31). Geometrical barcoding is achieved by spacing distinct fluorescent sites beyond the spatial resolution of the used imaging system (that is, >250 nm for diffraction-limited systems and >20 to 40 nm for super-resolution systems). In combination with spectrally distinct fluorophores, combinatorial labeling exponentially increases the number of distinguishable barcodes. However, geometrical barcoding leads to an increased label size due to the necessity of spacing fluorophores sufficiently apart for accurate detection of the spatial pattern of the barcode. So far, only a few submicrometer barcode systems based on geometry or fluorescence intensity have been reported (9, 10, 24–26, 28), whereas none demonstrated hundreds of barcodes with sizes below 100 nm.
In intensity barcoding implementations, distinguishable barcodes are usually realized by controlling the number of fluorophores per species, thus allowing the unambiguous detection of different intensity levels. Compared to geometrical barcodes, the key advantage of intensity barcodes is that they require neither the construction nor the detection of spatially resolvable fluorescent features. Thus, intensity barcodes could be much smaller.
Although intensity barcodes with thousands of colors have been proposed, in practice, only bulky and micrometer-sized barcodes have been constructed for hundreds of species (8, 32). This extended spatial size is necessary to ensure robust separation between intensity levels because these approaches lack the molecular tunability of fluorophore number, spacing, and positioning, leading to unwanted photophysical effects, such as self-quenching and Förster resonance energy transfer (FRET) (33) between dye molecules. Because our proposed metafluorophores feature precise molecular control over number, spacing, and arrangement of fluorophores in a nanoscale volume, they can serve as a platform for intensity barcodes without the discussed drawbacks.
Beyond the prescribed tunability of size, color, and brightness, the DNA origami approach also permits the use of other tunable optical properties to further increase the multiplexing level of metafluorophores. As an example of this approach, we report here metafluorophores with tunable photostability.
We also apply these metafluorophores as molecular barcodes in a multiplexed nucleic acid detection assay. By functionalizing distinctly colored metafluorophores with specific, single-stranded DNA handles, we are able to capture and subsequently identify and quantify a multitude of synthetic DNA targets.
Finally, we can also use DNA nanotechnology (34–38) to achieve control over both the position and the order of assembly of the structure’s components. Specifically, using reconfigurable DNA monomers, we can explicitly control the location and kinetic pathway of the metafluorophore assembly. To demonstrate this, we implemented a triggered version of our metafluorophore that dynamically self-assembles from metastable monomers only in the presence of a biomolecular trigger in situ.
RESULTS
Designing a metafluorophore
Nanoscale metafluorophores can be designed and fabricated with tunable properties. Structural DNA nanotechnology enables researchers to build nanoscale shapes and patterns with almost arbitrary complexity in a self-assembled fashion. Here, we use the DNA origami technique (12, 14) as a building platform for our metafluorophore.
In DNA origami, a long, single-stranded DNA molecule (called the “scaffold”) is folded into programmable shapes by ~200 short, single-stranded DNA strands (called “staples”) (12). Every staple has a defined sequence and specifically binds certain parts of the scaffold together. Structures are usually assembled in a one-pot reaction using thermal annealing. After the self-assembly is completed, the scaffold is “folded” into the desired shape, with the staple strands at prescribed positions in the final origami.
Here, we use a two-dimensional (2D), rectangular DNA origami consisting of 24 parallel DNA double helices with dimensions of 90 × 60 nm2 (Fig. 1A, fig. S1, and tables S1 and S2). This specific structure contains 184 uniquely addressable staple strands, which can be functionalized to display a large variety of molecules, such as fluorophores, nanoparticles, etc. (14).
Fig. 1. DNA-based metafluorophores.
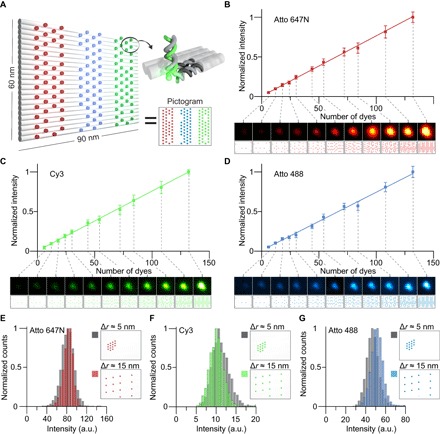
(A) Labeling pattern for DNA origami–based metafluorophores. Cylinders represent DNA double helices. Selected strands are extended with 21–nucleotide (nt) handles on the 3′ end, which bind complementary fluorescently labeled antihandles. Labeling patterns are represented as pictograms, where each colored dot represents a dye-labeled handle. (B to D) Fluorescence intensities increase linearly with the number of dyes attached to a metafluorophore (here, up to 132 dyes per structure). Insets show diffraction-limited fluorescence images of metafluorophores and the corresponding labeling pattern. Image sizes, 1.2 × 1.2 μm2. (E to G) Metafluorophores allow dense labeling (~5-nm dye-to-dye distance) without self-quenching. Pictograms illustrate dense and sparse labeling patterns for 14 dyes. Corresponding intensity distributions of the two patterns overlap for each color, showing no significant change in intensity. a.u., arbitrary units.
One modular and economic way to attach molecules of interest to this molecular pegboard is the use of so-called “handle” and “antihandle” strands (12). Here, the staple strand at the position where one wants to attach a molecule is extended with a 21-nt-long single-stranded handle sequence (table S3). The complementary antihandle is functionalized with the entity that should be arranged on the DNA origami structure (Fig. 1A). Staples carrying the handle sequences and the functionalized antihandle strands are usually part of the one-pot assembly mix. Distinct target species can be attached to the origami pegboard by using orthogonal handle strand sequences (26).
To “label” targets with our DNA origami–based metafluorophore, we could use specific target-binding staple strands. Labeling can either be achieved by direct hybridization to a DNA or RNA strand on the target molecule (handle-/antihandle-binding) or be mediated by using antibodies or small-molecule binders for protein labeling (39, 40).
Tunable brightness
DNA origami has already proven useful as a versatile platform in many fluorescence applications, such as single-molecule studies (41, 42) and super-resolution microscopy (41, 43–47). Recently, DNA origami has been used to create brightness standards for fluorescence microscopy (48, 49).
Here, we engineered metafluorophores with tunable brightness. We designed DNA origami structures with a prescribed number of dyes, ranging from 6 to 132 (Fig. 1A and fig. S2). We assembled each origami species using a staple strand mix that contained dye-labeled antihandle versus handle strands in a 2.25:1 molar ratio (protocol S1). After self-assembly and purification, the metafluorophores (carrying eight biotinylated capture strands) were immobilized on streptavidin-coated glass slides in custom-made flow chambers (protocol S2) (26, 46, 47).
Imaging was performed on a ~100 × 100–μm2 area containing ~1000 DNA origami structures, and single images were acquired for 10 s using light-emitting diode (LED) illumination on an inverted epifluorescence microscope (see the Supplementary Materials). Surface density was adjusted so that individual origami structures appeared as distinct bright spots in the fluorescent image. After image acquisition, a spot detection algorithm was used to identify individual DNA origami structures. In a subsequent step, a 2D Gaussian fit was performed within a 10 × 10–pixel2 area containing a spot. The volume under the Gaussian function was used as the measure of intensity. Narrow intensity distributions for experiments with only one metafluorophore population revealed that most of the spots are well-formed single DNA origami, which is in good agreement with earlier super-resolution studies (50).
Our structures showed a linear dependence of fluorescence intensity on the number of dyes. We confirmed this linear dependence for Atto 647N, Cy3, and Atto 488 dyes using DNA structures carrying up to 132 dyes per DNA origami (Fig. 1, B to D, and figs. S3 and S4). Dyes were spaced approximately equidistantly (see pictograms) on the DNA origami. After evaluating optimal acquisition settings (figs. S5 and S6), measurements for all species were performed independently by analyzing ~10,000 molecules.
Intrinsic variations in measured fluorescence intensity are likely due to structure-to-structure variations on the number of dyes as well as stochastic properties of fluorescence emission of the dyes themselves (51). Extrinsic variations from sample to sample mainly originate from differences in image acquisition, such as slightly different focal planes or photobleaching. If the fluorescence emission from a dye molecule is not acquired in perfect focus, fewer photons will be collected, and thus, the measured intensity will be decreased. To minimize this effect, we used a focus-maintaining system. Repeated image acquisition of the same sample with intermittent refocusing yields mean-to-mean variations of ~5% (fig. S7). Additionally, each image acquisition “bleaches” the samples by ~0.8 to 2.8%, depending on the dye (fig. S8).
An important feature of a metafluorophore is its nanoscale size. To engineer and construct compact metafluorophores, dye molecules need to be spaced close together while preventing unwanted dye-dye interactions, such as self-quenching (52). To demonstrate that dye-dye interactions are effectively prevented in our metafluorophore design, we performed experiments with origami structures carrying 14 dyes with low labeling density (~16-nm dye-to-dye distance) or 14 dyes with high labeling density (~5-nm dye-to-dye distance) and compared their fluorescence intensity distributions (Fig. 1, E to G, and fig. S9). Atto 647N–, Cy3-, and Atto 488–labeled structures with low and high labeling densities showed the same fluorescence intensities within our measurement accuracy.
Tunable color
A key requirement for multicolored nanoscale metafluorophores is the ability to tune brightness and color independently. As briefly mentioned above, our DNA-based metafluorophores can be “functionalized” with multiple orthogonal handle strands that can, in turn, bind spectrally distinct dye-labeled antihandle strands. Thus, we can design structures labeled with either Atto 647N, Cy3, Atto 488, or any combination thereof.
If spectrally distinct fluorophores are brought into close proximity (that is, closer than ~10 nm), they may exhibit FRET (33). In FRET, the fluorophore with the shorter excitation wavelength (donor) transfers energy to the fluorophore with the longer excitation wavelength (acceptor) through nonradiative dipole-dipole coupling. If FRET occurs, the donor dye’s emission fluorescence intensity will be decreased, depending, inter alia, on the proximity and number of adjacent acceptor dyes.
To maintain prescribed fluorescence intensities when using multiple fluorescent colors in our metafluorophores, we must prevent potential FRET between spectrally distinct dye molecules. Thus, we investigated whether FRET occurs in our metafluorophore designs and thereby limits our capability to precisely design their fluorescence intensity and color. We first investigated a design with 44 randomly arranged Atto 647N, Cy3, and Atto 488 dyes (Fig. 2, A to C, respectively, and fig. S10). This random arrangement was tested by comparing two different sample species: One contained all three dyes, and one contained only a single species. The resulting intensity distributions suggest that Atto 488 and Cy3 act as FRET donors because they exhibited a significant decrease in fluorescence intensity for the origami species containing possible acceptor fluorophores. The mean intensities for Atto 488 and Cy3 dyes were reduced by approximately 50 and 40%, respectively, compared to the control species with only one single fluorescent color. However, the mean fluorescence intensity for Atto 647N was unchanged because this dye lacked a potential FRET acceptor fluorophore.
Fig. 2. Multicolor metafluorophores.
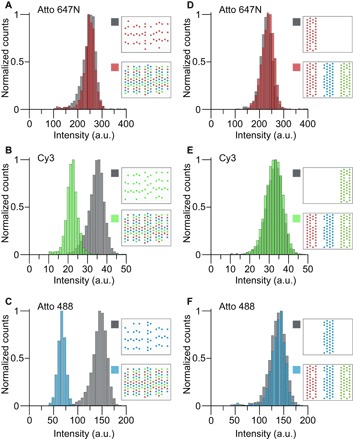
(A to C) “Randomly” labeled metafluorophores may result in significant decrease in fluorescence intensity (B and C) due to FRET, when labeled with spectrally distinct dyes. Metafluorophores with only 44 dyes of the same color serve as references (gray distributions). If Atto 647N, Cy3, and Atto 488 are all present on the same structure (44 dyes each), the intensity distributions (colored) for Cy3 (B) and Atto 488 (C) are significantly shifted to lower values. However, this fluorophore arrangement does not provide an acceptor for Atto 647N fluorescence; thus, its intensity distribution is not altered (A). Pictograms illustrate labeling patterns. (D to F) Column-like metafluorophore labeling pattern prevents energy transfer (FRET). Metafluorophores labeled with 44 dyes of one species (gray) show identical intensity distributions as structures labeled with all three species (colored). Pictograms illustrate labeling patterns.
The finding that FRET can alter fluorescence emission intensity of the metafluorophore by as much as 50% in randomly labeled structures limits our ability to control fluorescence color and intensity independently. However, the precise programmability of DNA origami allows us to increase the spacing of spectrally distinct dyes, thus preventing FRET while maintaining high labeling densities and nanoscale structure dimensions.
To prevent the undesired FRET, we changed the random dye layout to a “column-like” arrangement, where the three dye species are positioned in spatially distant zones (Fig. 2, D to F, and figs. S10 and S11). Repeating the same experiments as in Fig. 2 (A to C), fluorescence intensities between multi- and single-color species were unchanged; thus, our modified column-like layout prevents FRET (Fig. 2, D to F). This finding now allows us to tune the brightness and color of our metafluorophores independently. Having established the ability to engineer photophysical properties, such as intensity and color, we will next investigate potential applications of DNA-based metafluorophores.
Multiplexed tagging
One of the most important features of metafluorophores is their usefulness as labeling probes for multiplexed target detection. We now have to consider the question of how to construct metafluorophores as multiplexed labels on the basis of intensity and color combinations. This poses the challenge that we need to be able to unambiguously identify prescribed intensity levels.
Because of stochastic photon emission, imperfect labeling, and incomplete staple incorporation, the DNA origami–based metafluorophores show a finite intensity distribution for a structure with a designed number of dyes (Fig. 3A). If the intensity distributions of two distinct barcode levels (or numbers of dyes per structure) are engineered to have no overlap, each measured intensity value can be unambiguously assigned to a specific barcode. The number of distinct barcode species N scales as N = ab, with b being the number of spectrally distinct colors and a the number of distinguishable intensity levels per color.
Fig. 3. Metafluorophores for intensity barcoding.
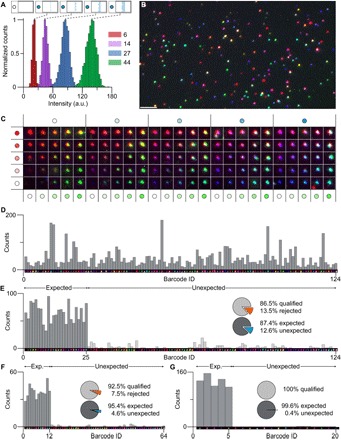
(A) Intensity distributions for Atto 488 (red, 6 dyes per structure; purple, 14 dyes; blue, 27 dyes; green, 44 dyes). Nonoverlapping intensity distributions can be achieved by the precise control over the number of dyes per metafluorophore. (B) Fluorescence image of 124 distinct metafluorophores deposited on a glass surface. Scale bar, 5 μm. (C) Matrix of representative fluorescence images of 124 distinct metafluorophores. (D) Metafluorophore-based intensity barcodes (124) in one sample. A total of 5139 barcodes were recorded, and all 124 barcode types were detected. (E) Subset of 25 of 124 barcodes. A total of 2155 barcodes were recorded, where 86.5% were qualified barcodes and 87.4% thereof were expected barcodes. (F) Subset of 12 of 64 barcodes. All barcodes have all three fluorophore species, making their detection more robust. A total of 521 barcodes were recorded, where 92.5% were qualified and 95.4% thereof were expected barcodes. (G) Subset of 5 of 20 barcodes. A total of 664 barcodes were recorded, where 100% were qualified and 99.6% thereof were expected barcodes.
With a maximum number of 132 staple strands available for modification and 3 distinct dyes, the largest number of dyes per color per structure is 132/3 = 44. The smallest number of dye molecules that can be robustly detected using our standard inverted fluorescence microscope is 6.
By measuring the width of the intensity distribution for different numbers of dyes on a DNA origami, we identified a total of four nonoverlapping levels that can be used in a barcoding application, corresponding to 6, 14, 27, and 44 dyes (fig. S12). Combinatorial labeling with three spectrally distinct dyes and five intensity levels (including 0), allows for a maximum of 53 − 1 = 124 barcodes with our current design.
We tested our ability to design, fabricate, and robustly identify all 124 possible barcodes. After self-assembly and purification of the barcodes, we pooled and immobilized them in a streptavidin-modified flow chamber (Fig. 3, B and C). Here, image acquisition was performed sequentially, starting with the longest wavelength and subsequently imaging the shorter wavelengths to minimize photobleaching. Data analysis (spot detection and intensity measurement) was performed as described above and carried out in each color channel separately. During image analysis, each detected spot (and thus barcode) was assigned a coordinate and corresponding intensity value for each color. Spots that appeared at the same position in two or more color channels (colocalization) were combined and assigned to the same metafluorophore (for details, see the Supplementary Materials).
To identify our metafluorophore with a specific barcode ID, the measured intensity values were compared to a lookup table to assign the correct intensity level (for details, see the Supplementary Materials). One can further obtain a lookup table for each sample acquisition by creating a histogram of all measured intensity values (fig. S12). This has the benefit of a “real-time” test for sample performance (for details, see the Supplementary Materials). The overlap of adjacent distributions is an important measure for barcoding performance because it represents intensity levels that cannot be unambiguously assigned to a specific barcode level. To quantify this overlap and discard corresponding barcodes, we fitted a Gaussian function to the intensity distribution of each level. The intersection points of adjacent Gaussians were calculated and subsequently used to determine regions without overlap (for details, see the Supplementary Materials).
Our ability to fabricate and identify all possible 124 barcodes in one sample is demonstrated in Fig. 3D. Variations in molecule counts are due to different DNA origami concentrations, likely introduced in their folding and purification process.
To benchmark the barcoding performance of our metafluorophores, we studied subsets of barcodes (that is, only 25 of the possible 124 barcodes in one sample) and introduced the following measures: From all detected metafluorophores, those with valid intensity values (for example, outside levels of overlapping intensity distributions) are qualified barcodes. As barcode subsets are measured, these qualified barcodes may consist of two subpopulations: expected barcodes (that is, the 25 barcodes in the sample) and unexpected (or false-positive) barcodes (the 99 barcodes not present in the sample). Consequently, we defined a signal-to-noise ratio (SNR) as 〈expected〉/〈unexpected〉. Together, these measures determine the overall performance of our barcoding system.
The first subset contained 25 randomly selected barcodes of the 124 barcodes in Fig. 3D (Fig. 3E and table S4). We measured 2155 spots, of which 13.5% were discarded as unqualified barcodes with intensity values within overlapping regions. The discarded spots included misfolded structures as well as spots comprising multiple barcodes (that is, spaced closer than the spatial resolution of our imaging system). For this 25-barcode subset, 87.4% of the qualified barcodes were the expected ones. We determined an SNR of 27. A substantial population of false positives were single-colored barcodes with low fluorescence intensities (that is, identified as “6-0-0,” “0-6-0,” or “0-0-6”). We hypothesize that this is an artifact arising from fluorescent surface impurities.
In case the maximum multiplexing capacity is not required, more robust barcode sets with higher performance can be designed. One strategy is to use three-color barcodes (that is, all three colors must be present for each barcode species), making detection and identification more robust (that is, allowing the rejection of single- and double-colored spots). A total of 43 = 64 three-color barcodes can be constructed using our current metafluorophore design. We benchmarked these barcodes by acquiring a subset of 12 structures (Fig. 3F and table S5). Here, 512 spots were detected, and 92.5% were qualified barcodes, of which 95.4% were the expected ones. The SNR was determined to be 90.
Another strategy is to reduce the number of intensity levels, thereby reducing overlapping intensity distributions. As a demonstration, we constructed barcodes with three intensity levels (0, 14, and 44 dyes). Additionally, barcodes were required to consist of at least two colors, allowing a maximum of 33 − 6 − 1 = 20 distinguishable barcodes. We measured a subset of 5 barcodes (N = 664) with a qualification ratio of 100%; that is, all detected spots were positively identified as valid barcodes (Fig. 3G and table S6). Here, only three false positives were counted, yielding 99.6% expected barcodes.
We note that the number of barcodes in a subset is a crucial factor when evaluating the barcoding performance of a system. When using large subsets, one may make a false identification of a spot without noticing because the identified barcode may also be part of the used subset. On the opposite side, when using a small subset, identification accuracy may be biased because only a small fraction of the barcodes is tested.
Ultrasensitive, quantitative, and multiplexed nucleic acid detection
Multiplexed detection applications are readily realized by combining the metafluorophore’s reliable identification capabilities with barcode-specific target recognition. Inspired by the NanoString nCounter digital nucleic acid quantification system, where structurally flexible, surface-immobilized, and geometrically encoded fluorescent barcodes are used in highly multiplexed digital counting of molecular targets (22), we implemented a multiplexed in vitro nucleic acid detection assay using metafluorophores. Similarly, our method allows for highly multiplexed molecular quantification with in-principle similar multiplexing capability. Compared to the nCounter system, our metafluorophore-based assay has four unique advantages. First, our method has a much simpler operational workflow: Our system does not require electrophoretic stretching of the structurally flexible barcodes or sophisticated software to decode these geometrical patterns; additionally, no target-barcode purification is required. Second, because the metafluorophore can pack many more dyes per area [132 dyes on one origami (90 nm × 60 nm) in contrast to 1 dye per 50 base pairs (17 nm) for nCounter], it enables faster image acquisition speed and thus higher throughput (because we have brighter spots). Third, the higher dye density also allows the use of potentially simpler, lower-cost, and standard imaging platforms (we used commercially available confocal and widefield microscopes). Finally, the metafluorophore is manufactured using a simple one-pot self-assembly reaction that, in principle, can be fully automated rather than labor-intensive manual in vitro transcription methods.
In our detection assay, each nucleic acid target (here, eight synthetic DNA strands) was associated with a metafluorophore. The chosen metafluorophores were programmed to specifically bind the target by replacing the eight biotinylated staples (previously used to attach the metafluorophore to the surface) with staples that are extended with a target-complementary 21-nt-long sequence at the 5′ end. To increase the chance of hybridization (and thus the speed of the detection), we used eight target-specific strands per metafluorophore. Because of their high excess over targets, we expect each metafluorophore to bind either one or no target. To detect the target-metafluorophore duplexes on a microscopy slide (comparable to the experiments in Fig. 3), we introduced a biotinylated DNA strand (“capture strand”) complementary to a second 21-nt region on the target (see Fig. 4, A and B).
Fig. 4. Quantitative nucleic acid detection.
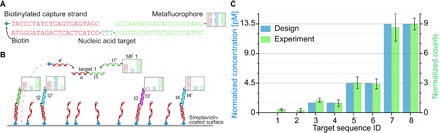
(A and B) Schematic of the hybridization reaction. A metafluorophore is programmed to hybridize to part (green) of a specific nucleic acid target. A biotinylated capture strand binds to a second region (red) and thus immobilizes the complex on a streptavidin-coated surface, yielding fluorescence images comparable to Fig. 3B. Each positively identified metafluorophore indicates a single copy of a nucleic acid target. (C) The number of detected targets is directly proportional to their concentration in the sample of interest. Targets were added with defined concentrations (blue bars) and subsequently identified in the expected ratios (green bars). Five different field of views have been recorded, enabling the calculation of error bars. The lowest target concentration [target 3 (t3) and target 4 (t4)] was 1.5 pM. Target 1 (t1) and target 2 (t2) were not added, and corresponding identifications are due to nonspecific binding of metafluorophores to the surface and potential false-positive identifications.
The three components were combined in a hybridization buffer and incubated for 24 hours (see Materials and Methods). We chose concentrations of 1 nM biotinylated capture strands and approximately 250 pM metafluorophores per target. With this high excess of metafluorophores over targets, we assumed that every target molecule was labeled with one barcode. Targets were added in different amounts to assay quantification and sensitivity (see Fig. 4C and table S7). After incubation, the mixture was added into streptavidin-coated flow chambers as before and incubated for 10 min. The chamber was subsequently washed and sealed.
Data acquisition can be performed on a large variety of fluorescence microscopes. Widefield microscopes, as used in the characterization of the fluorescently labeled DNA origami described above, can efficiently record large areas and are readily available in many laboratories and so are laser scanning confocal microscopes. To demonstrate that the metafluorophores can be platform-independently identified in a robust fashion and thus easily used in most laboratories, we used confocal microscopes for data acquisition in the nucleic acid detection experiments.
To assess the precision of this nucleic acid detection platform, we designed eight capture-target-metafluorophore triplets and added different amounts of six targets to the reaction. The remaining two targets were not added and, thus, indicated barcodes nonspecifically bound to the surface (that is, without cognate target) and false positives as before (see fig. S13 for exemplary fluorescent image). The number of detected triplets is directly proportional to the initial target concentration, and the targets can thus be quantified relative to each other. Figure 4C shows the successful detection and precise quantification of targets with initial concentrations of 13.5, 4.5, and 1.5 pM, the latter corresponding to a target amount of only ~100 fg. The number of counted metafluorophores has been adjusted by using a calibration sample with equally concentrated targets, to minimize effects of unequal initial concentrations (fig. S14).
Additional metafluorophore properties
Beyond brightness and color, we can use additional dye properties to expand the tunability of our metafluorophores. This is done by the controlled modification of the structures with groups of fluorescent molecules displaying the desired property. Suitable dye properties include fluorescence lifetime, the ability to photoactivate and switch, and photostability. These parameters can be tuned independently, similar to brightness and color, thus presenting additional orthogonal axes of adjustability. This is especially valuable for multiplexed tagging because the number of unambiguous labels scales with the power of independent parameters.
Here, we demonstrate the differentiation and identification based on the photostability of dyes. As a proof of concept, we designed metafluorophores that contained two dyes with similar emission spectra but different photostability under our imaging conditions. We chose Atto 647N as a dye with slower bleaching constant (that is, more photostable) and Alexa 647 as a dye with faster bleaching constant (that is, less photostable). In a time-lapsed image acquisition experiment, the structures containing Alexa 647 dyes bleach faster than the ones with Atto 647N dyes. As the fluorescence intensity decreases exponentially, we can measure the decay constant, which is then used as a parameter for photostability.
Figure 5A shows a time-lapsed series of images of the two types of structures in one sample, where one species bleaches faster than the other. Metafluorophores that contain multiple orthogonal properties can be identified in a multidimensional graph (Fig. 5B). For example, we can plot the bleaching (or decay) constant versus the fluorescence intensity. Distinct populations corresponding to different metafluorophore configurations can be easily separated and identified (Fig. 5B). A 1D histogram of the decay constants (Fig. 5C) demonstrates that the photostability can be used as an orthogonal tunable metafluorophore property, similar to intensity discussed above.
Fig. 5. Metafluorophores with different photostability.
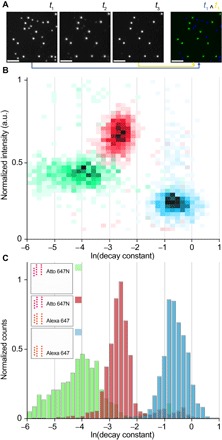
(A) Time-lapsed fluorescence micrographs of a sample composed of two spectrally indistinct metafluorophore species: one containing 44 Atto 647N dyes (more photostable) and one containing 44 Alexa 647 dyes (less photostable). Images were acquired at t1 = 0 s, t2 = 20 s, and t3 = 40 s, with an integration time of 10 s, whereas the sample was constantly illuminated during acquisition. The time-lapsed micrographs show two species where one bleaches faster than the other. The two species can be visually identified by superimposing the images taken at t1 (false color blue) and t3 (false color yellow). The metafluorophore containing more photostable dyes (that is, Atto 647N) appears green (blue + yellow), whereas the one with the less photostable dyes (that is, Alexa 647) appears blue. The fluorescence decay constant can be used as a parameter to quantitatively describe the photostability. The decay constant is obtained by fitting a single exponential decay to the intensity versus time trace. Scale bars, 5 μm. (B) Intensity versus decay constant histograms for three different metafluorophore samples containing Atto 647N dyes (green), Alexa 647 dyes (blue), and both dyes (red), respectively (note that only one species was present in each sample). (C) 1D histogram of the decay constants shows three distinguishable decay constant distributions (schematics in the legend show the dye arrangement on the metafluorophores).
Triggered assembly of metafluorophores
DNA nanotechnology allows us to program the formation of metafluorophores in an environmentally responsive fashion: Structures can be programmed to form only upon detection of a user-specified trigger. By building on previous triggered assembly schemes (34, 36), we use here short fluorescently labeled, metastable hairpins that assemble into a finite triangular structure if, and only if, a target molecule acting as trigger is present (Fig. 6A and table S8). As a proof-of-concept study, we showed the in vitro triggered assembly of a prescribed-size (10 dyes) triangular metafluorophore using a trigger strand, immobilized by a dye-labeled capture strand on a glass surface.
Fig. 6. Triggered assembly of metafluorophores.
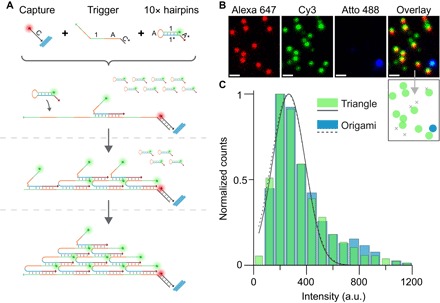
(A) Schematic of triggered assembly of triangular metafluorophores constructed from 10 metastable Cy3-labeled DNA hairpin strands. A so-called capture strand (labeled with Alexa 647) is attached to a glass surface via biotin-streptavidin coupling. A long “trigger strand” can hybridize to the capture strand. The trigger strand consists of four concatenated domains, “1-A,” where the subdomain “1” is 20 nt long and the subdomain “A” is 12 nt long. Hairpin strands coexist metastably in the absence of the trigger and only assemble into the desired structure upon exposure to the trigger. More specifically, the introduction of a repetitive single-stranded trigger initiates the assembly of kinetically trapped fluorescent hairpin monomers, which produce a second row of binding sites. These binding sites further enable the assembly of successive rows of monomers, with each row containing one fewer monomer than the previous. After assembly of 10 hairpins (labeled with Cy3) to a single trigger strand, no further trigger sequences are displayed, and assembly is terminated, yielding a triangular-shaped metafluorophore of fixed dimensions. (B) Fluorescence images of triangles assembled in situ on a glass surface. The capture strands are labeled with Alexa 647 (red), whereas the hairpins are labeled with Cy3 (green). DNA origami with 10 Cy3 and 44 Atto 488 (blue) dyes were added to the sample as intensity references. DNA origami can be identified at the positions where Atto 488 and Cy3 signals colocalize. In the schematic below the overlay fluorescence image, the blue spot indicates the Atto 488–labeled origami marker; green spots indicate the expected overlay of Alexa 647–labeled capture strand and the triangle composed of Cy3-labeled hairpin monomers. Gray crosses indicate nonspecific binding of hairpins to the surface. Scale bars, 1 μm. (C) Triangular metafluorophores (green) and reference DNA origami (blue) intensity distributions are overlapping, thus indicating the formation of the triangles as expected.
First, an Alexa 647–labeled and biotinylated capture strand and a trigger strand were annealed and immobilized on a glass surface coated with bovine serum albumin (BSA)–biotin–streptavidin. Second, Cy3-labeled metastable hairpins were flown in and incubated for 60 min (protocol S3). Last, DNA origami–based metafluorophores carrying 44 Atto 488–labeled and 10 Cy3-labeled strands were bound to the surface, as intensity reference.
Image acquisition was carried out by sequentially recording the Alexa 647, Cy3, and Atto 488 channels (Fig. 6B). Colocalization in the Alexa 647 and Cy3 channels represents the triangles, whereas Atto 488 and Cy3 colocalization identifies the origami references.
To benchmark the formation performance of the triangles, we compared the intensities of the origami reference structures with the intensities of the triangles in the Cy3 channel (Fig. 6C). Gaussian fits to both intensity distributions reveal an almost perfect overlap with a mean-to-mean variation of less than 2%, suggesting successful triangle formation. Both the formation of the triangle in the presence of the trigger and the metastability of the hairpins in the absence of the trigger were further confirmed by a formation gel assay (fig. S15 and protocol S4).
We note that the triggered assembly scheme used here demonstrates a number of novel features compared to previous triggered assembly schemes. Unlike hybridization chain reaction (HCR) (34), which produces a linear polymer structure of unspecified length, a structure of precisely defined size and shape is formed here. Additionally, unlike previous triggered assembly of defined-size structures [for example, dendrimers (36) and tetrahedron (35)] that uses a large number of unique monomer species, the scheme here uses only one monomer species, and its final size and shape are controlled by the length of the trigger strand.
We expect the triggered formation of the metafluorophore to be particularly useful for future in situ imaging applications: The fluorescent hairpin monomers, upon detecting a trigger attached to the target (for example, an mRNA or a protein), will form the metafluorophore in situ. Compared to structures preformed ex situ, the in situ ones have two critical conceptual advantages. First, the monomer has a smaller size than the metafluorophore and thus can more easily penetrate deep tissues with faster diffusion kinetics. Second, because the bright metafluorophore only forms at the target site, possible false positives caused by nonspecific interactions of preassembled barcodes with cellular components can be avoided, and the signal amplification at the target site that resulted from the triggered aggregation of fluorescent monomers will help to increase signal-to-background ratios.
Related in situ fluorescence imaging approaches have been demonstrated with great success, such as single-molecule fluorescence in situ hybridization (smFISH) (9, 53, 54) and HCR (34, 55). Compared to previous approaches, metafluorophores have several conceptual advantages. Compared to smFISH, the tunability of our metafluorophores allows us to assemble more complex structures at the target site by, for example, using a transducer (initiator) molecule that is used to program complex structure assembly on-site. Compared to HCR, where the length of the polymerization and, thus, the number of fluorophores per target are not well defined, the metafluorophore has a precisely defined size and, thus, controlled intensity, which may eventually lead to higher multiplexing capability.
DISCUSSION
Here, we introduced the concept of a metafluorophore, which can be viewed as a new kind of dye with digitally tunable optical properties, can be hundreds of times brighter with arbitrarily prescribed intensity levels, and has digitally tunable “color.” We implemented this concept using DNA origami–based self-assembled nanostructures and were thus able to design metafluorophores with high labeling density (~5-nm dye-to-dye distance) while preventing self-quenching. Furthermore, the precise spatial control over dye positions on the nanostructures allowed us to successfully construct nanoscale multicolor metafluorophores, where FRET between spectrally distinct dyes is prevented.
Combining these features, we were able to construct 124 unique intensity barcodes for high-content imaging. We demonstrated the feasibility of this approach, benchmarked the in vitro performance, and showed the high specificity, identification accuracy, and low false-positive rate.
We also demonstrated the ultrasensitive detection and precise quantification of nucleic acids in an easy, multiplexed, and fast assay. Beyond surface-based microscopy applications, the combination of high brightness, small size, and high multiplexing capacity of metafluorophores suggests potential future applications, such as flow cytometry and fluorescence-activated cell sorting (a subtype of flow cytometry) for high-throughput identification. We also envision our DNA nanostructure–based metafluorophores to be extended to even smaller sizes by using the recently developed single-stranded tile assembly approach (15, 16, 56). Finally, we envision our metafluorophores based on triggered assembly to be a particularly useful tool for improving SNR and labeling efficiency in quantitative smFISH applications.
MATERIALS AND METHODS
DNA origami self-assembly
Self-assembly was performed in a one-pot reaction with a total volume of 20 μl containing 10 nM scaffold strands (M13mp18), 100 nM folding staples, 150 nM biotinylated strands, 100 nM strands with dye-handle extension, and 225 nM fluorescently labeled antihandles in folding buffer (1× TAE buffer with 12.5 mM MgCl2). The solution was heated up to 65°C for 5 min and subsequently cooled down to 4°C over the course of 1 hour. DNA origamis were purified by agarose gel electrophoresis (1.5% agarose and 1× TAE buffer with 12.5 mM MgCl2) at 4.5 V/cm for 1.5 hours on ice. Gel bands were cut, crushed and filled into a Freeze ‘N Squeeze column, and spun for 5 min at 1000g at 4°C.
Microscopy sample preparation
Coverslips (No. 1.5, 18 × 18 mm2, ~0.17 mm thick) and microscopy slides (3 × 1 inch2, 1 mm thick) were cleaned with isopropanol. Flow chambers were built by sandwiching two strips of double-sided sticky tape between the coverslip and the glass slide, resulting in a channel with a volume of ~20 μl. The channel was incubated with 20 μl of BSA-biotin solution (1 mg/ml) in buffer A [10 mM tris-HCl, 100 mM NaCl, and 0.05% Tween 20 (pH 8)] for 2 min. The chamber was subsequently washed with 40 μl of buffer A, then incubated with 20 μl of streptavidin solution (0.5 mg/ml) in buffer A for 2 min. Next, a buffer exchange was performed by washing the chamber with 40 μl of buffer A, followed by addition of 40 μl of buffer B [5 mM tris-HCl, 10 mM MgCl2, 1 mM EDTA, and 0.05% Tween 20 (pH 8)]. Then, 20 μl of buffer B with ~300 pM DNA origami metafluorophores was added and incubated for 2 min and subsequently washed with 40 μl of buffer B. Finally, the chamber was sealed with epoxy before imaging.
Image acquisition parameters
Image acquisition parameters for Figs. 1, 2, 3, and 5A were integration time of 10 s and LED power of 60%, whereas parameters for Figure 5B were integration time of 5 s and LED power of 60%. The decay constant was determined by acquiring a series of 10 consecutive frames and fitting the intensity versus time trace with a single exponential decay function. Data acquisition was performed on a Zeiss Axio Observer microscope with Colibri LED light source.
Multiplexed nucleic acid detection
Incubation was performed at room temperature in saline-sodium citrate (SSC)–based hybridization buffer [4× SSC, 5× Denhardt’s solution, 5% dextran sulfate, 0.1% Tween 20, and salmon sperm DNA (0.1 mg/ml)]. Flow chamber volume was designed to be ~5 μl. Data acquisition was performed on a Zeiss LSM 780 confocal microscope.
Triggered assembly on a surface
Capture and trigger strands were annealed in a thermocycler directly before adding to the sample at 1 μM in 1× TAE with 12.5 mM MgCl2 and 0.05% Tween 20 (85°C for 5 min, gradient from 85° to 10°C in 15 min). Hairpin strands were annealed in a thermocycler directly before adding to the sample at 1 μM in 1× TAE with 12.5 mM MgCl2 (85°C for 5 min, gradient from 85° to 10°C in 15 min). A flow chamber (see above) was prepared with three layers of sticky tape, resulting in a volume of ~60 μl. The chamber was then incubated with 60 μl of BSA-biotin solution (1 mg/ml) in buffer A for 2 min and then washed with 120 μl of buffer A. Next, the chamber was incubated with 60 μl of streptavidin solution (0.5 mg/ml) in buffer A for 2 min, followed by a washing step with 120 μl of buffer A. Subsequently, a buffer exchange was performed by adding 120 μl of buffer C (1× TAE with 12.5 mM MgCl2 and 0.05% Tween 20). Then, 60 μl of buffer C with 25 pM annealed capture-trigger duplexes were added and incubated for 1 min. The chamber was washed with 120 μl of buffer C and incubated with 60 μl of 100 pM DNA origami standards for 2 min. After washing with 120 μl of buffer C, 60 μl of buffer C with 30 nM annealed hairpin was added. After 20-min incubation, the chamber was washed with 120 μl of buffer C. Hairpin incubation was repeated three times. Finally, the chamber was washed with 120 μl of buffer C and sealed with epoxy before imaging.
Supplementary Material
Acknowledgments
We thank T. C. Ferrante from the Wyss Institute for Biologically Inspired Engineering Imaging Core for support with microscopy. We also thank Y. Niyaz from Carl Zeiss AG and M. Spitaler from the Max Planck Institute of Biochemistry for data acquisition support. We also acknowledge W. Sun and S. M. Douglas for initial designs and experiments. Funding: This work is supported by an NIH Director’s New Innovator Award (1DP2OD007292), an NIH Transformative Research Award (1R01EB018659), an NIH grant (5R21HD072481), an Office of Naval Research (ONR) Young Investigator Program Award (N000141110914), ONR grants (N000141010827 and N000141310593), an NSF Faculty Early Career Development Award (CCF1054898), an NSF grant (CCF1162459), and a Wyss Institute for Biologically Engineering Faculty Startup Fund to P.Y. J.B.W., M.T.S., and R.J. acknowledge support from the Deutsche Forschungsgemeinschaft through the Emmy Noether Programme (DFG JU 2957/1-1) and the SFB 1032 (Nanoagents for the spatiotemporal control of molecular and cellular reactions), the European Research Council (ERC) through an ERC Starting Grant (MolMap; grant agreement number 680241), the Max Planck Society, the Max Planck Foundation, and the Center for NanoScience. M.T.S. acknowledges support from the International Max Planck Research School for Molecular and Cellular Life Sciences. D.Y.Z. acknowledges support from an NIH Pathway to Independence Award (K99EB015331). Author contributions: J.B.W. and M.T.S. contributed equally to this work. J.B.W., M.T.S., and R.J. designed and performed the experiments, analyzed the data, developed the software, and wrote the manuscript. L.L.O., B.W., and D.Y.Z. designed the triggered assembly of metafluorophores and performed preliminary experiments. P.Y. and R.J. conceived and supervised the study, interpreted the data, and wrote the manuscript. All authors reviewed and approved the manuscript. Competing interests: P.Y. and R.J. are cofounders of Ultivue Inc. R.J., M.T.S., J.B.W., and P.Y. are inventors on a pending patent related to this work, filed on 16 December 2015 (PCT/US2015/065962). R.J., L.L.O., D.Y.Z., B.W., and P.Y. are inventors on a pending patent related to this work, filed on 16 December 2015 (PCT/US2015/065948). All other authors declare that they have no other competing interests. Data and materials availability: All data needed to evaluate the conclusion in the paper are present in the paper and/or the Supplementary Materials. Additional data related to this paper may be requested from the authors.
SUPPLEMENTARY MATERIALS
Supplementary material for this article is available at http://advances.sciencemag.org/cgi/content/full/3/6/e1602128/DC1
fig. S1. caDNAno DNA origami design.
fig. S2. Schematic DNA origami staple layouts of single-color metafluorophores (6 to 132).
fig. S3. Linear dependence of intensity on the number of dyes per DNA origami (calibrated).
fig. S4. Intensity distributions for 6 to 132 dyes.
fig. S5. Excitation power variation.
fig. S6. Integration time variation.
fig. S7. Refocusing performance.
fig. S8. Photostability.
fig. S9. Schematic DNA origami staple layouts of self-quenching study.
fig. S10. FRET investigation dye patterning (random and column-wise).
fig. S11. Intensity barcode dye patterns.
fig. S12. Intensity distributions for 124 barcodes in one sample.
fig. S13. Exemplary fluorescent image of nucleic acid detection.
fig. S14. DNA detection calibration.
fig. S15. Triggered assembly formation gel assay.
table S1. DNA origami staple sequences.
table S2. M13mp18 scaffold sequence.
table S3. Fluorescently labeled DNA sequences.
table S4. Intensity barcode subset (25 of 124).
table S5. Intensity barcode subset (12 of 64).
table S6. Intensity barcode subset (5 of 20).
table S7. DNA detection sequences and corresponding barcodes.
table S8. Triggered assembly sequences.
protocol S1. DNA origami self-assembly.
protocol S2. Microscopy sample preparation.
protocol S3. Triggered assembly on surface.
protocol S4. Triggered assembly in solution and gel assay.
Materials
Optical setup
Software section
REFERENCES AND NOTES
- 1.Lichtman J. W., Conchello J.-A., Fluorescence microscopy. Nat. Methods 2, 910–919 (2005). [DOI] [PubMed] [Google Scholar]
- 2.Weiss S., Fluorescence spectroscopy of single biomolecules. Science 283, 1676–1683 (1999). [DOI] [PubMed] [Google Scholar]
- 3.Joo C., Balci H., Ishitsuka Y., Buranachai C., Ha T., Advances in single-molecule fluorescence methods for molecular biology. Annu. Rev. Biochem. 77, 51–76 (2008). [DOI] [PubMed] [Google Scholar]
- 4.Tsien R. Y., The green fluorescent protein. Annu. Rev. Biochem. 67, 509–544 (1998). [DOI] [PubMed] [Google Scholar]
- 5.Giepmans B. N. G., Adams S. R., Ellisman M. H., Tsien R. Y., The fluorescent toolbox for assessing protein location and function. Science 312, 217–224 (2006). [DOI] [PubMed] [Google Scholar]
- 6.Resch-Genger U., Grabolle M., Cavaliere-Jaricot S., Nitschke R., Nann T., Quantum dots versus organic dyes as fluorescent labels. Nat. Methods 5, 763–775 (2008). [DOI] [PubMed] [Google Scholar]
- 7.Gonçalves M. S., Fluorescent labeling of biomolecules with organic probes. Chem. Rev. 109, 190–212 (2009). [DOI] [PubMed] [Google Scholar]
- 8.Han M., Gao X., Su J. Z., Nie S., Quantum-dot-tagged microbeads for multiplexed optical coding of biomolecules. Nat. Biotechnol. 19, 631–635 (2001). [DOI] [PubMed] [Google Scholar]
- 9.Levsky J. M., Shenoy S. M., Pezo R. C., Singer R. H., Single-cell gene expression profiling. Science 297, 836–840 (2002). [DOI] [PubMed] [Google Scholar]
- 10.Li Y., Cu Y. T. H., Luo D., Multiplexed detection of pathogen DNA with DNA-based fluorescence nanobarcodes. Nat. Biotechnol. 23, 885–889 (2005). [DOI] [PMC free article] [PubMed] [Google Scholar]
- 11.Seeman N. C., Nucleic-acid junctions and lattices. J. Theor. Biol. 99, 237–247 (1982). [DOI] [PubMed] [Google Scholar]
- 12.Rothemund P. W. K., Folding DNA to create nanoscale shapes and patterns. Nature 440, 297–302 (2006). [DOI] [PubMed] [Google Scholar]
- 13.Douglas S. M., Dietz H., Liedl T., Högberg B., Graf F., Shih W. M., Self-assembly of DNA into nanoscale three-dimensional shapes. Nature 459, 414–418 (2009). [DOI] [PMC free article] [PubMed] [Google Scholar]
- 14.Tørring T., Voigt N. V., Nangreave J., Yan H., Gothelf K. V., DNA origami: A quantum leap for self-assembly of complex structures. Chem. Soc. Rev. 40, 5636–5646 (2011). [DOI] [PMC free article] [PubMed] [Google Scholar]
- 15.Wei B., Dai M., Yin P., Complex shapes self-assembled from single-stranded DNA tiles. Nature 485, 623–626 (2012). [DOI] [PMC free article] [PubMed] [Google Scholar]
- 16.Ke Y., Ong L. L., Shih W. M., Yin P., Three-dimensional structures self-assembled from DNA bricks. Science 338, 1177–1183 (2012). [DOI] [PMC free article] [PubMed] [Google Scholar]
- 17.Wolfbeis O. S., An overview of nanoparticles commonly used in fluorescent bioimaging. Chem. Soc. Rev. 44, 4743–4768 (2015). [DOI] [PubMed] [Google Scholar]
- 18.Nicewarner-Peña S. R., Freeman R. G., Reiss B. D., He L., Peña D. J., Walton I. D., Cromer R., Keating C. D., Natan M. J., Submicrometer metallic barcodes. Science 294, 137–141 (2001). [DOI] [PubMed] [Google Scholar]
- 19.Gudiksen M. S., Lauhon L. J., Wang J., Smith D. C., Lieber C. M., Growth of nanowire superlattice structures for nanoscale photonics and electronics. Nature 415, 617–620 (2002). [DOI] [PubMed] [Google Scholar]
- 20.Braeckmans K., De Smedt S. C., Roelant C., Leblans M., Pauwels R., Demeester J., Encoding microcarriers by spatial selective photobleaching. Nat. Mater. 2, 169–173 (2003). [DOI] [PubMed] [Google Scholar]
- 21.Dejneka M. J., Streltsov A., Pal S., Frutos A. G., Powell C. L., Yost K., Yuen P. K., Müller U., Lahiri J., Rare earth-doped glass microbarcodes. Proc. Natl. Acad. Sci. U.S.A. 100, 389–393 (2003). [DOI] [PMC free article] [PubMed] [Google Scholar]
- 22.Geiss G. K., Bumgarner R. E., Birditt B., Dahl T., Dowidar N., Dunaway D. L., Fell H. P., Ferree S., George R. D., Grogan T., James J. J., Maysuria M., Mitton J. D., Oliveri P., Osborn J. L., Peng T., Ratcliffe A. L., Webster P. J., Davidson E. H., Hood L., Dimitrov K., Direct multiplexed measurement of gene expression with color-coded probe pairs. Nat. Biotechnol. 26, 317–325 (2008). [DOI] [PubMed] [Google Scholar]
- 23.Xiao M., Wan E., Chu C., Hsueh W.-C., Cao Y., Kwok P.-Y., Direct determination of haplotypes from single DNA molecules. Nat. Methods 6, 199–201 (2009). [DOI] [PMC free article] [PubMed] [Google Scholar]
- 24.Li X., Wang T., Zhang J., Zhu D., Zhang X., Ning Y., Zhang H., Yang B., Controlled fabrication of fluorescent barcode nanorods. ACS Nano 4, 4350–4360 (2010). [DOI] [PubMed] [Google Scholar]
- 25.Lubeck E., Cai L., Single-cell systems biology by super-resolution imaging and combinatorial labeling. Nat. Methods 9, 743–748 (2012). [DOI] [PMC free article] [PubMed] [Google Scholar]
- 26.Lin C., Jungmann R., Leifer A. M., Li C., Levner D., Church G. M., Shih W. M., Yin P., Submicrometre geometrically encoded fluorescent barcodes self-assembled from DNA. Nat. Chem. 4, 832–839 (2012). [DOI] [PMC free article] [PubMed] [Google Scholar]
- 27.Xu H., Sha M. Y., Wong E. Y., Uphoff J., Xu Y., Treadway J. A., Truong A., O’Brien E., Asquith S., Stubbins M., Spurr N. K., Lai E. H., Mahoney W., Multiplexed SNP genotyping using the Qbead system: A quantum dot-encoded microsphere-based assay. Nucleic Acids Res. 31, e43 (2003). [DOI] [PMC free article] [PubMed] [Google Scholar]
- 28.Lin C., Liu Y., Yan H., Self-assembled combinatorial encoding nanoarrays for multiplexed biosensing. Nano Lett. 7, 507–512 (2007). [DOI] [PMC free article] [PubMed] [Google Scholar]
- 29.Livet J., Weissman T. A., Kang H., Draft R. W., Lu J., Bennis R. A., Sanes J. R., Lichtman J. W., Transgenic strategies for combinatorial expression of fluorescent proteins in the nervous system. Nature 450, 56–62 (2007). [DOI] [PubMed] [Google Scholar]
- 30.Fournier-Bidoz S., Jennings T. L., Klostranec J. M., Fung W., Rhee A., Li D., Chan W. C. W., Facile and rapid one-step mass preparation of quantum-dot barcodes. Angew. Chem. Int. Ed. 47, 5577–5581 (2008). [DOI] [PubMed] [Google Scholar]
- 31.Marcon L., Battersby B. J., Rühmann A., Ford K., Daley M., Lawrie G. A., Trau M., ‘On-the-fly’ optical encoding of combinatorial peptide libraries for profiling of protease specificity. Mol. Biosyst. 6, 225–233 (2010). [DOI] [PubMed] [Google Scholar]
- 32.Elshal M. F., McCoy J. P., Multiplex bead array assays: Performance evaluation and comparison of sensitivity to ELISA. Methods 38, 317–323 (2006). [DOI] [PMC free article] [PubMed] [Google Scholar]
- 33.Förster T., Zwischenmolekulare energiewanderung und fluoreszenz. Ann. Phys. 437, 55–75 (1948). [Google Scholar]
- 34.Dirks R. M., Pierce N. A., Triggered amplification by hybridization chain reaction. Proc. Natl. Acad. Sci. U.S.A. 101, 15275–15278 (2004). [DOI] [PMC free article] [PubMed] [Google Scholar]
- 35.Sadowski J. P., Calvert C. R., Zhang D. Y., Pierce N. A., Yin P., Developmental self-assembly of a DNA tetrahedron. ACS Nano 8, 3251–3259 (2014). [DOI] [PMC free article] [PubMed] [Google Scholar]
- 36.Yin P., Choi H. M., Calvert C. R., Pierce N. A., Programming biomolecular self-assembly pathways. Nature 451, 318–322 (2008). [DOI] [PubMed] [Google Scholar]
- 37.Yurke B., Turberfield A. J., Mills A. P. Jr, Simmel F. C., Neumann J. L., A DNA-fuelled molecular machine made of DNA. Nature 406, 605–608 (2000). [DOI] [PubMed] [Google Scholar]
- 38.Zhang D. Y., Seelig G., Dynamic DNA nanotechnology using strand-displacement reactions. Nat. Chem. 3, 103–113 (2011). [DOI] [PubMed] [Google Scholar]
- 39.Liu Y., Lin C., Li H., Yan H., Aptamer-directed self-assembly of protein arrays on a DNA nanostructure. Angew. Chem. Int. Ed. 44, 4333–4338 (2005). [DOI] [PubMed] [Google Scholar]
- 40.Rinker S., Ke Y., Liu Y., Chhabra R., Yan H., Self-assembled DNA nanostructures for distance-dependent multivalent ligand-protein binding. Nat. Nanotechnol. 3, 418–422 (2008). [DOI] [PMC free article] [PubMed] [Google Scholar]
- 41.Jungmann R., Scheible M., Simmel F. C., Nanoscale imaging in DNA nanotechnology. Wiley Interdiscip. Rev. Nanomed. Nanobiotechnol. 4, 66–81 (2012). [DOI] [PubMed] [Google Scholar]
- 42.Gietl A., Holzmeister P., Grohmann D., Tinnefeld P., DNA origami as biocompatible surface to match single-molecule and ensemble experiments. Nucleic Acids Res. 40, e110 (2012). [DOI] [PMC free article] [PubMed] [Google Scholar]
- 43.Steinhauer C., Jungmann R., Sobey T. L., Simmel F. C., Tinnefeld P., DNA origami as a nanoscopic ruler for super-resolution microscopy. Angew. Chem. Int. Ed. 48, 8870–8873 (2009). [DOI] [PubMed] [Google Scholar]
- 44.Jungmann R., Steinhauer C., Scheible M., Kuzyk A., Tinnefeld P., Simmel F. C., Single-molecule kinetics and super-resolution microscopy by fluorescence imaging of transient binding on DNA origami. Nano Lett. 10, 4756–4761 (2010). [DOI] [PubMed] [Google Scholar]
- 45.Johnson-Buck A., Nangreave J., Kim D.-N., Bathe M., Yan H., Walter N. G., Super-resolution fingerprinting detects chemical reactions and idiosyncrasies of single DNA pegboards. Nano Lett. 13, 728–733 (2013). [DOI] [PMC free article] [PubMed] [Google Scholar]
- 46.Iinuma R., Ke Y., Jungmann R., Schlichthaerle T., Woehrstein J. B., Yin P., Polyhedra self-assembled from DNA tripods and characterized with 3D DNA-PAINT. Science 344, 65–69 (2014). [DOI] [PMC free article] [PubMed] [Google Scholar]
- 47.Jungmann R., Avendaño M. S., Woehrstein J. B., Dai M., Shih W. M., Yin P., Multiplexed 3D cellular super-resolution imaging with DNA-PAINT and Exchange-PAINT. Nat. Methods 11, 313–318 (2014). [DOI] [PMC free article] [PubMed] [Google Scholar]
- 48.Schmied J. J., Gietl A., Holzmeister P., Forthmann C., Steinhauer C., Dammeyer T., Tinnefeld P., Fluorescence and super-resolution standards based on DNA origami. Nat. Methods 9, 1133–1134 (2012). [DOI] [PubMed] [Google Scholar]
- 49.Schmied J. J., Raab M., Forthmann C., Pibiri E., Wünsch B., Dammeyer T., Tinnefeld P., DNA origami–based standards for quantitative fluorescence microscopy. Nat. Protoc. 9, 1367–1391 (2014). [DOI] [PubMed] [Google Scholar]
- 50.Schlichthaerle T., Strauss M. T., Schueder F., Woehrstein J. B., Jungmann R., DNA nanotechnology and fluorescence applications. Curr. Opin. Biotechnol. 39, 41–47 (2016). [DOI] [PubMed] [Google Scholar]
- 51.Ha T., Tinnefeld P., Photophysics of fluorescent probes for single-molecule biophysics and super-resolution imaging. Annu. Rev. Phys. Chem. 63, 595–617 (2012). [DOI] [PMC free article] [PubMed] [Google Scholar]
- 52.Anderson G. P., Nerurkar N. L., Improved fluoroimmunoassays using the dye Alexa Fluor 647 with the RAPTOR, a fiber optic biosensor. J. Immunol. Methods 271, 17–24 (2002). [DOI] [PubMed] [Google Scholar]
- 53.Levsky J. M., Singer R. H., Fluorescence in situ hybridization: Past, present and future. J. Cell Sci. 116, 2833–2838 (2003). [DOI] [PubMed] [Google Scholar]
- 54.Raj A., van den Bogaard P., Rifkin S. A., van Oudenaarden A., Tyagi S., Imaging individual mRNA molecules using multiple singly labeled probes. Nat. Chem. Biol. 5, 877–879 (2008). [DOI] [PMC free article] [PubMed] [Google Scholar]
- 55.Choi H. M. T., Beck V. A., Pierce N. A., Next-generation in situ hybridization chain reaction: Higher gain, lower cost, greater durability. ACS Nano 8, 4284–4294 (2014). [DOI] [PMC free article] [PubMed] [Google Scholar]
- 56.Myhrvold C., Dai M., Silver P. A., Yin P., Isothermal self-assembly of complex DNA structures under diverse and biocompatible conditions. Nano Lett. 13, 4242–4248 (2013). [DOI] [PubMed] [Google Scholar]
Associated Data
This section collects any data citations, data availability statements, or supplementary materials included in this article.
Supplementary Materials
Supplementary material for this article is available at http://advances.sciencemag.org/cgi/content/full/3/6/e1602128/DC1
fig. S1. caDNAno DNA origami design.
fig. S2. Schematic DNA origami staple layouts of single-color metafluorophores (6 to 132).
fig. S3. Linear dependence of intensity on the number of dyes per DNA origami (calibrated).
fig. S4. Intensity distributions for 6 to 132 dyes.
fig. S5. Excitation power variation.
fig. S6. Integration time variation.
fig. S7. Refocusing performance.
fig. S8. Photostability.
fig. S9. Schematic DNA origami staple layouts of self-quenching study.
fig. S10. FRET investigation dye patterning (random and column-wise).
fig. S11. Intensity barcode dye patterns.
fig. S12. Intensity distributions for 124 barcodes in one sample.
fig. S13. Exemplary fluorescent image of nucleic acid detection.
fig. S14. DNA detection calibration.
fig. S15. Triggered assembly formation gel assay.
table S1. DNA origami staple sequences.
table S2. M13mp18 scaffold sequence.
table S3. Fluorescently labeled DNA sequences.
table S4. Intensity barcode subset (25 of 124).
table S5. Intensity barcode subset (12 of 64).
table S6. Intensity barcode subset (5 of 20).
table S7. DNA detection sequences and corresponding barcodes.
table S8. Triggered assembly sequences.
protocol S1. DNA origami self-assembly.
protocol S2. Microscopy sample preparation.
protocol S3. Triggered assembly on surface.
protocol S4. Triggered assembly in solution and gel assay.
Materials
Optical setup
Software section