Abstract
Purpose
Accurate patient-specific phantoms for device testing or endovascular treatment planning can be 3D printed. We expand the applicability of this approach for cardiovascular disease, in particular, for CT-geometry derived benchtop measurements of Fractional Flow Reserve, the reference standard for determination of significant individual coronary artery atherosclerotic lesions.
Materials and Methods
Coronary CT Angiography (CTA) images during a single heartbeat were acquired with a 320×0.5mm detector row scanner (Toshiba Aquilion ONE). These coronary CTA images were used to create 4 patient-specific cardiovascular models with various grades of stenosis: severe, <75% (n=1); moderate, 50–70% (n=1); and mild, <50% (n=2). DICOM volumetric images were segmented using a 3D workstation (Vitrea, Vital Images); the output was used to generate STL files (using AutoDesk Meshmixer), and further processed to create 3D printable geometries for flow experiments. Multi-material printed models (Stratasys Connex3) were connected to a programmable pulsatile pump, and the pressure was measured proximal and distal to the stenosis using pressure transducers. Compliance chambers were used before and after the model to modulate the pressure wave. A flow sensor was used to ensure flow rates within physiological reported values.
Results
3D model based FFR measurements correlated well with stenosis severity. FFR measurements for each stenosis grade were: 0.8 severe, 0.7 moderate and 0.88 mild.
Conclusions
3D printed models of patient-specific coronary arteries allows for accurate benchtop diagnosis of FFR. This approach can be used as a future diagnostic tool or for testing CT image-based FFR methods.
INTRODUCTION
Three dimensional printing facilitates new medical applications in the clinical domain as well as for biomedical research. Accurate patient-specific phantoms can be used for: treatment testing,1–3 resident physician training,4 physiological simulations,5 imaging protocol optimization,6, 7 software validation and physical measurements.8–10 This work focuses on vascular phantoms where 3D models are particularly useful since patient anatomy can pose significant challenges for endovascular device actuation and deployment during minimally invasive image guided procedures such as catheter angiography. By performing the endovascular device R&D in patient-specific phantoms, researchers can potentially reduce the length of development cycle, identify unfeasible designs early on, assess the number of device failures, and ultimately, assess the potential for periprocedural complications.11
Recently various groups10, 12, 13 have developed complex arterial phantoms which could be used to implement some of the features outlined above. Both qualitative and quantitative assessments of flow and mechanical behavior suggest that these patient-specific models are accurate testing platforms. Based on these results, phantom applicability has extended beyond surgical planning and device testing and their use for diagnosis is likely to be the next step. Use of vascular phantoms in benchtop testing with flow and pressure sensors could offer a better understanding and diagnosis of vascular lesions in the neurovascular and cardiovascular systems.
Cardiovascular modeling in particular is one of the most sought after applications of the 3D printed vascular phantoms. This is due to both the overall prevalence of cardio vascular disease, being the largest cause of mortality in the world, as well as the complexity of flow in the coronary system due to cardiac motion and autoregulation. Patient-specific 3D printed coronary trees could facilitate simulation of precise physiological blood flow conditions, providing knowledge regarding the correlation of flow parameters and cardiac risks. For example, in clinical practice the severity of a stenosis is largely evaluated based on geometrical factors, such as percent diameter stenosis, but the gold-standard measurement to assess lesion hemodynamic significance is the Fractional Flow Reserve (FFR) measurement.14 FFR is calculated as the ratio of the pressure measured distally to that measured proximally of the stenosis at maximum hyperemic conditions using a pressure wire in the catheterization laboratory. More recently, computational approaches have been developed to estimate FFR using coronary CT angiography (CTA) data (CT-FFR). These methods leverage coronary lumen geometry data segmented from CTA and estimate the pressure at presumed hyperemic conditions, which can then be used as a risk predictor.15–19 Software such as the CT-FFR could be validated using patient-specific 3D printed phantoms.
Overall 3D printed phantoms can reproduce cardiovascular geometry with great accuracy and they can mimic the mechanical properties of the arterial wall. Cardiac 3D printed phantoms can then be used to recreate accurate physiological conditions and used for software validation and potentially diagnosis. In this study we propose to investigate this hypothesis, using cardiac vascular phantoms derived from CT scans acquired at the Gates Vascular Institute (Buffalo, NY). In accordance with the IRB protocols we acquired data from four patients, built the phantoms and studied flow reduction correlation with stenosis severity. FFR was measured using embedded pressure sensors in physiologically relevant conditions. Preliminary results performed before this report demonstrated good correlation between benchtop FFR measurements and stenosis severity.
Phantom production and benchtop pressure measurements required less than twenty-four hours. Although this time is longer than those reported in the literature (~ 5 hours) for computational fluid dynamic based FFR,20 simplification of the vascular tree to focus on the affected vessel can reduce the total time required to only a few hours.
Overall this approach could lead to the development of a new diagnosis tool for blood flow assessment with unprecedented accuracy.
PURPOSE
The purpose of this research is to use 3D printing to create patient-specific phantoms that can be used for flow measurements. Such phantoms could be used for software validation and possibly diagnosis. The idea of a benchtop diagnosis model is very attractive since it will reduce patient risks associated with invasive FFR, reduce clinician’s time for diagnosis, and potentially reduce the financial burden on institutions by eliminating the need for equipment and devices used for interventional FFR.
MATERIALS AND METHODS
Coronary CTA images acquired from an Aquilion ONE volume CT scanner were imported into a Vitrea (Vital Images Inc.) workstation. The vessels were processed and segmented using standard clinical workflow on the workstation. In addition to the main branches we manually selected and segmented the visible branches. Figure 1 outlines the selection of the vessels in the CT volume using a 3D volume rendering of the vessels, and Figure 2 shows the curved Multiplanar Reconstruction (MPR) of one vessel. Once the vessels were segmented from the CT image, a stereolithographis (STL) file was then saved and exported out of Vitrea.
Figure 1.
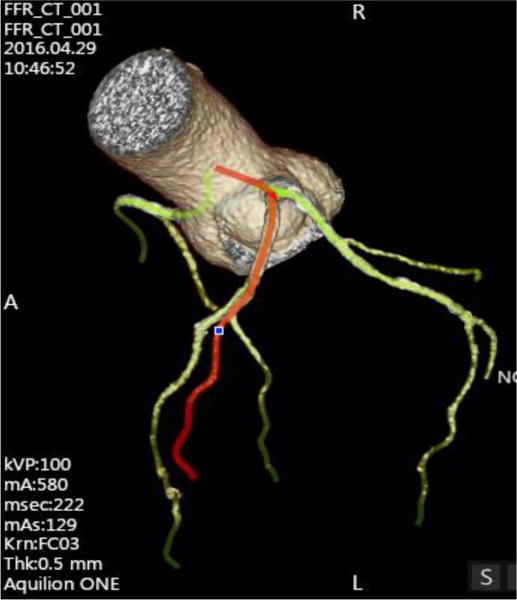
Selected and segmented vessels from the CT image for Model A.
Figure 2.
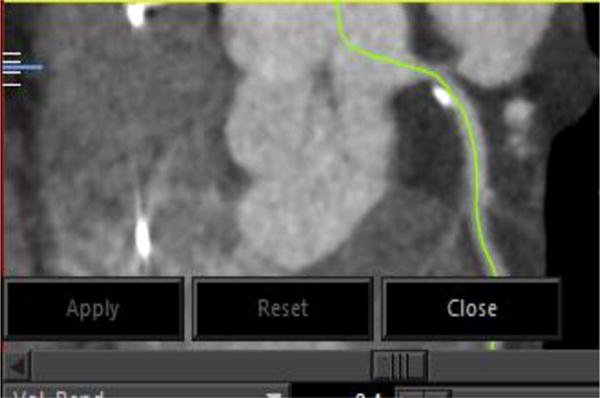
Curved Multiplanar Reconstruction (MPR) in CT image for Model A.
To make a 3D printable model, advanced mesh manipulation is required. The method was presented in detail by Ionita et. al.8 and O’Hara et. al9 and it will be only briefly described in this paper. We imported the STL into Meshmixer to complete this manipulation. The raw image (Figure 3) was smoothed, sculpted and the coronary tree of interest was isolated. The vascular tree was used to create the vascular phantom walls using an extrusion process. In the wall we created inserts which allowed pressures sensor mounting proximal and distal to the stenosis. A flow compliance chamber and a base was appended to the phantom and modified in order for the vessel both to be supported by the base and for the outflow tubes to pass through the flow reserve plate (Figure 4). The model was then printed in a Stratasys Connex3 multi-material 3D printer with soluble support material. For more details, see the accompanying publication “Design Optimization of Distal Arteries in 3D Printed Phantoms for Accurate Flow Simulations” by Sommer et. al.
Figure 3.
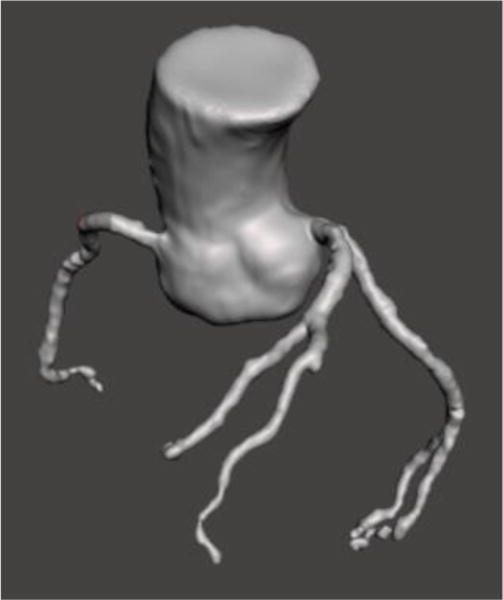
STL file imported into Meshmixer for advanced mesh manipulation.
Figure 4.
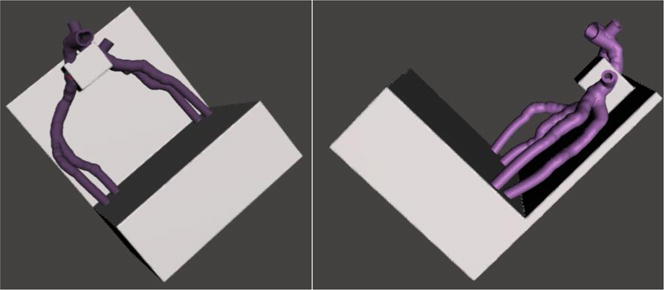
A, B: Top view (A) and side view (B) of Model A after advanced mesh manipulation to smooth vessels and create a base for vessel support.
After the models were printed, the support material was removed. Figure 5 displays a cleaned model of the coronary vessels used for data collection. The vessels were printed with Tango+, a soft polymer that represents the compliance of coronary vessels. The base was printed with Vero, a rigid, opaque polymer that has a high tensile strength and provides support to the printed vasculature. The models contain a reservoir at the end of the vasculature to represent the capillary bed and once the models were cleaned, a printed door was attached to the reservoir allowing for a single outflow with controlled hydraulic resistance. Next, two pressure sensors were embedded proximal and distal to the lesion using openings that were made while modeling the vessels in Meshmixer. In order to create a tight seal, Cole-Parmer luer couplers were silicon glued to the model. The position of the sensors was flush with the lumen vessel and did not interfere with the flow. Pressure sensor outputs were connected to a multichannel Data Acquisition (DAQ) board and a labVIEW program was developed to record the pressure readings in real time.
Figure 5.
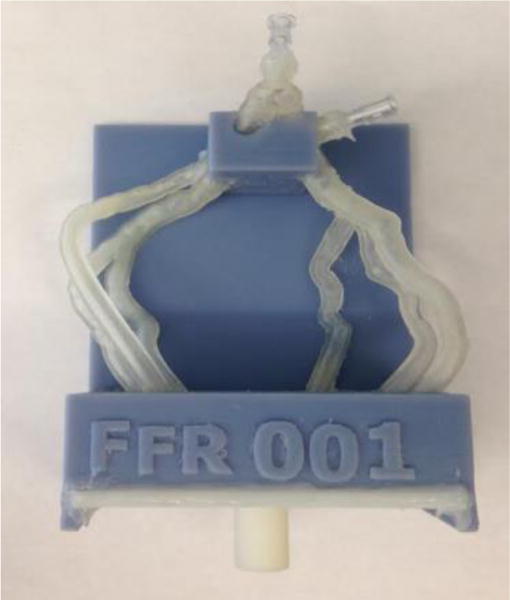
Patient-specific 3D printed coronary arteries used to collect FFR data. The reservoir door and Cole Parmer luers are attached for controlled flow and pressure data.
To establish a flow loop, a programmable Harvard Apparatus Pulsatile Blood Pump was connected to a 3D printed flow damper using Medtronic Class VI 1/2 × 3/32 tube. The flow damper was used to modulate the pressure wave by controlling the air cap. The flow damper was then connected to the model along with a flow diverter to adjust the inlet pressure. The flow output channel was connected to tubing with an adjustable valve to create distal resistance. Figure 6 below shows the full benchtop set up that is used for each model in this experiment. Figure 7 displays the flow diagram outlining the water flow and collection of pressure data within the benchtop system.
Figure 6.
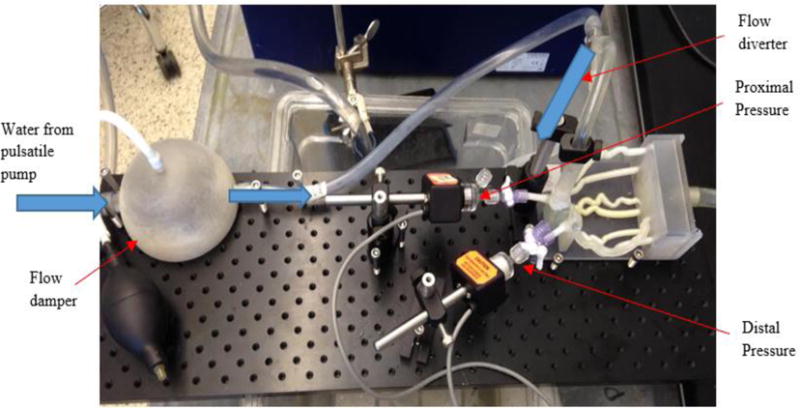
Benchtop set up of FFR models. Pictured is the flow damper with pump to add or remove air, 3D printed coronary arteries, and pressure sensors located proximal and distal to stenosis.
Figure 7.
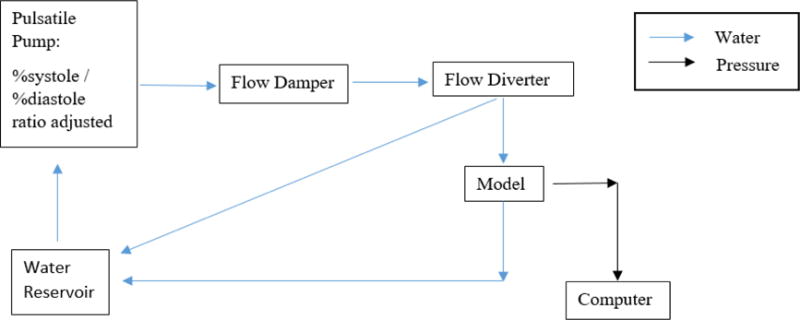
Flow diagram of water and pressure data throughout the benchtop system.
The settings for the pulsatile pump were adjusted for the data collection. The mL per stroke and pump rate were kept constant at 20 mL per stroke and 60 bpm. To study the effect of the pressure wave form on the measurements, the %systole/%diastole ratio was changed and data was collected for ratios of 50/50, 45/55, 40/60, 35/65, 30/70, and 25/75.
The effect of the distal hydraulic resistance was also studied using an adjustable valve post collection chamber. The resistance was modified by adjusting the valve diameters for the outlet tube. The flow rate was measured with varying valve diameters to create a range of distal resistance from low to high. Each setting of %systole/%diastole ratio was tested with four different distal resistances.
The data was collected using the labVIEW program for the different combinations of %systole/%diastole ratio and distal resistances. The flow damper and flow diverters were adjusted until the proximal pressure was approximately 110–120 mmHg to represent normal resting blood pressure. The pressure data collected in labVIEW was analyzed with the average proximal and distal pressures used to calculate the FFR value. To emphasize the difference between lesions and corresponding pressure drop we normalized the curves to the maximum systolic pressure peak. Four patients with different grade stenosis were used. For each patient the specific coronary tree was segmented and phantoms were developed and tested following the steps described above.
RESULTS
Displayed in Figures 8–11 below are the CT images collected for each of the four patient models. Each image contains the 3D reconstruction and the curved Multiplanar Reconstruction (MPR). Each curved MPR image has the stenosis highlighted. The 3D reconstructions and MPRs were used to measure the stenosis severity in each model. Model A has stenosis present in the Left Anterior Descending coronary (LAD) and a percent stenosis of approximately 38% (Figure 8). One patient case used for this study contained stenosis in two vessels and was used for Models B and C. Model B has a percent stenosis of 25% in the Left Circumflex artery (LCX) (Figure 9) and Model C has a percent stenosis of 78% in the LAD (Figure 10). Model D has stenosis in the LAD with a percent stenosis of 51%; however, the stenosis is present in a significant length of vessel. This placement creates a variation in the measurements, as discussed below.
Figure 8.
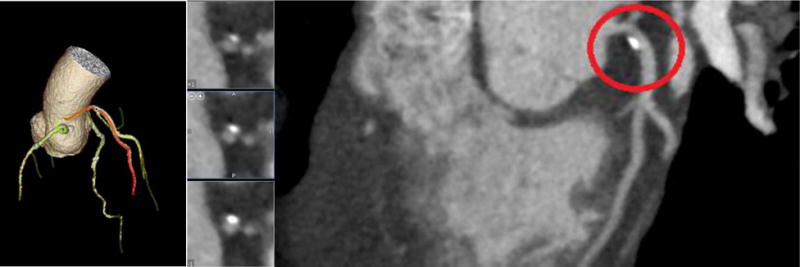
CT image 3D reconstruction and curved MPR for Model A.
Figure 11.
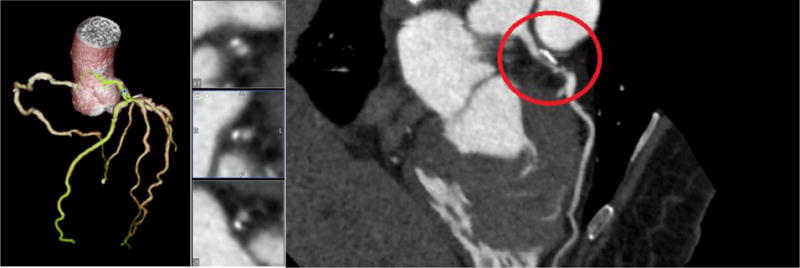
CT image 3D reconstruction and curved MPR for Model D.
Figure 9.
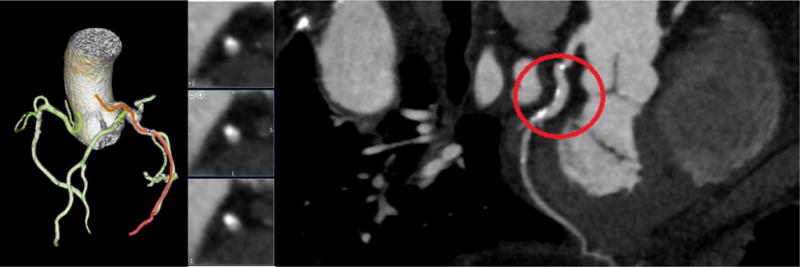
CT image 3D reconstruction and curved MPR for Model B.
Figure 10.
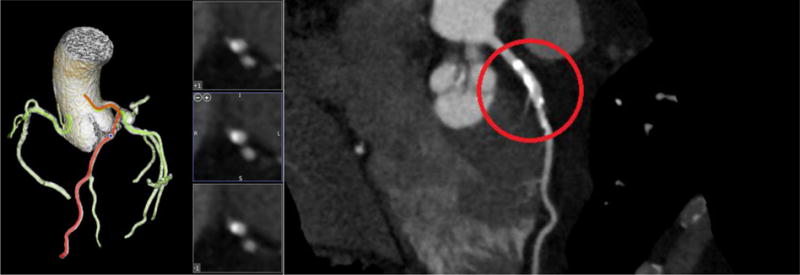
CT image 3D reconstruction and curved MPR for Model C.
From these four CT images, the models used in this study were 3D printed. Each patient model was tested with six different ratios of %systole/%diastole: 50/50, 45/55, 40/60, 35/65, 30/70, and 25/75. The six different ratios were also tested with varying levels of distal resistance ranging from low to high. The distal resistance was regulated by mechanically adjusting the output diameter of the flow. For each model, the effects of distal resistance and the %systole/%diastole ratio were tested. Figures 12–17 below show the results of the %systole/%diastole testing. The normalized pressure waveforms for Model A are graphed with the six ratios of %systole/%diastole and with low and high distal resistances. The results of this part of the experimental testing determined that the pressure waves through the models varied with the ratio. The other three models showed trends similar to Model A in the variation of pressure based on the %systole/%diastole ratio and distal resistance.
Figure 12.

Normalized pressure graphs for Model A at a 50/50 %systole/%diastole ratio with low and high distal resistances.
Figure 17.
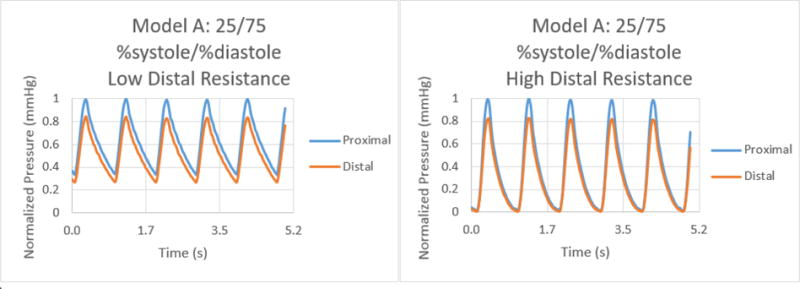
Normalized pressure graphs for Model A at a 25/75 %systole/%diastole ratio with low and high distal resistances.
Figure 13.
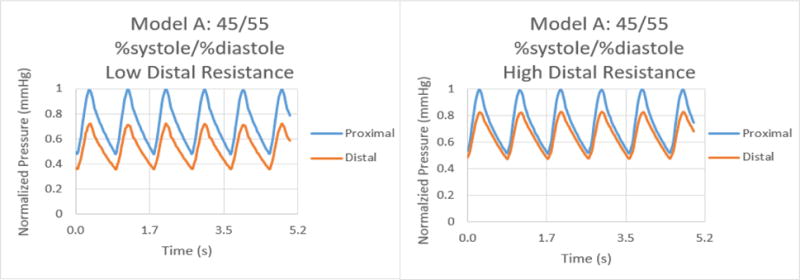
Normalized pressure graphs for Model A at a 45/55 %systole/%diastole ratio with low and high distal resistances.
Figure 14.
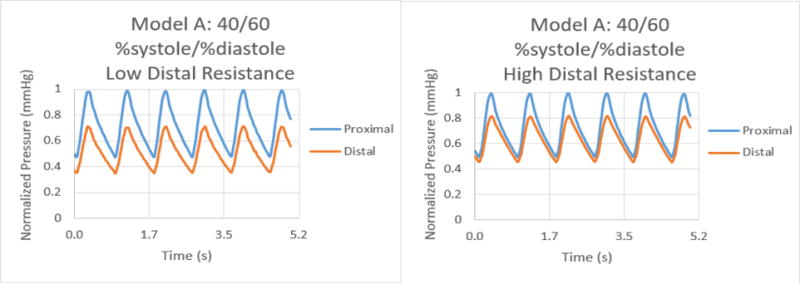
Normalized pressure graphs for Model A at a 40/60 %systole/%diastole ratio with low and high distal resistances.
Figure 15.
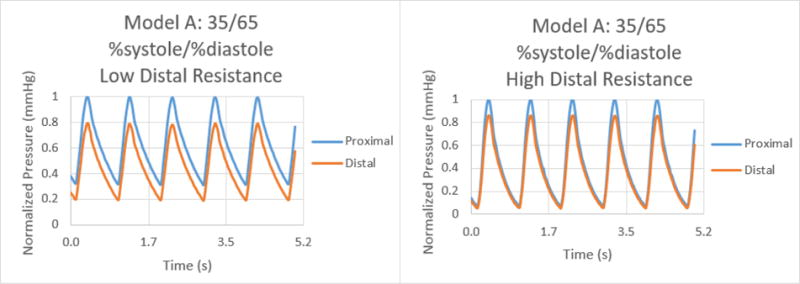
Normalized pressure graphs for Model A at a 35/65 %systole/%diastole ratio with low and high distal resistances.
Figure 16.
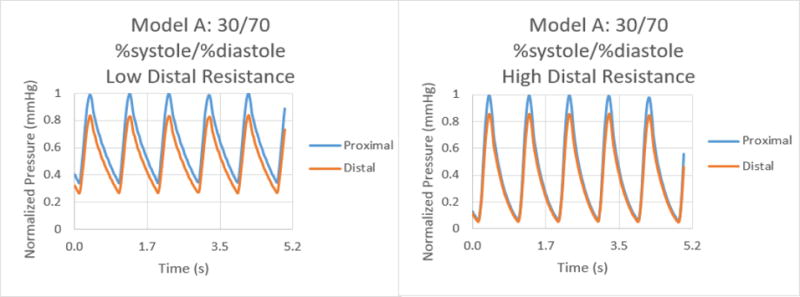
Normalized pressure graphs for Model A at a 30/70 %systole/%diastole ratio with low and high distal resistances.
The results for the %systole/%diastole ratio tests determined that varying the flow waveform has a significant impact on the pressure collected for each model. The ratios increased the peak to valley pressure waveform difference as the systole decreased from 50% through 25% of the heart cycle. In addition, there were significant variations between proximal and distal pressures in low and high distal resistance for each model. Increasing the distal resistance resulted in the distal pressure increasing in magnitude and decreasing the pressure difference for proximal and distal. This data demonstrates that it is necessary to include distal resistance as a component of testing 3D printed models to achieve physiologically accurate models. The inclusion of distal resistance models the capillary bed, allowing the models to have a higher accuracy.
Changing the output flow diameter to regulate the distal resistance resulted in varying flow rates. For each model in this study, the flow rate was measured for each change in distal resistance within an accuracy of ± 5% through the coronary arteries. The FFR was calculated with the ratio of average pressure distal to average pressure proximal for each flow rate. The data collected was graphed to determine the relationship between the two physiological factors. Figures 18–20 show the graphs of average FFR as a function of flow rate for each model at the six %systole/%diastole ratios. The flows rates cover the normal physiological conditions as well as hyperemic patients when flow rates could reach 400 ml/min left main coronary and 200 ml/min in the right coronary artery. For these patients the total coronary flow rates could reach 700 ml/min.
Figure 18.
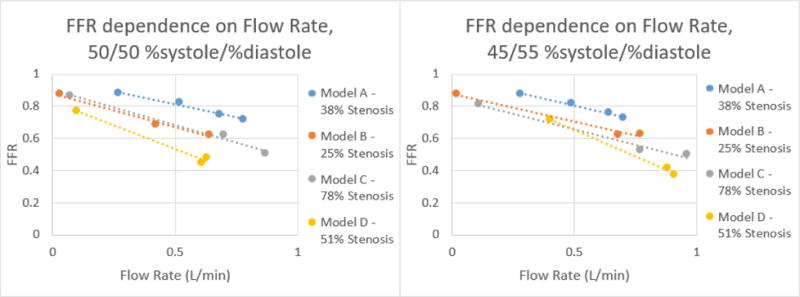
Correlation of FFR and Flow Rate for each model at %systole/%diastole of 50/50 and 45/55 respectively.
Figure 20.
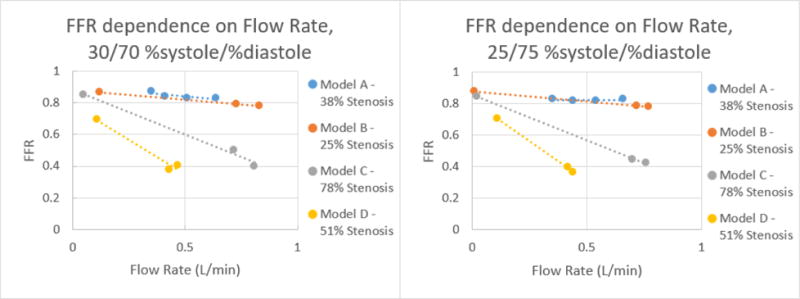
Correlation of FFR and Flow Rate for each model at %systole/%diastole of 30/70 and 25/75 respectively.
Figure 19.
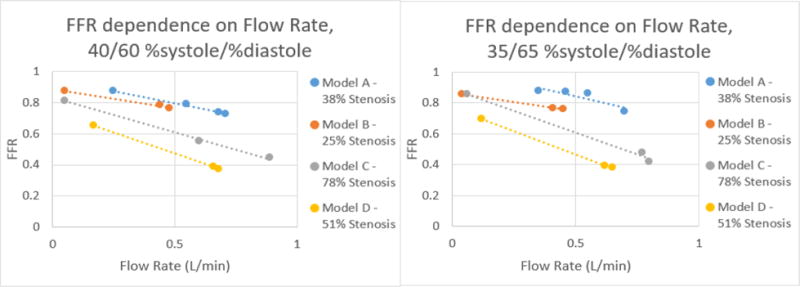
Correlation of FFR and Flow Rate for each model at %systole/%diastole of 40/60 and 35/65 respectively.
From the data collected, it was determined that there is a negative linear relation between the flow rate and average FFR. This linear relation changes as the %systole/%diastole ratios also change from 50% to 25% of the heart cycle. As expected from their mild stenosis, Models A and B have similar changes in flow rate and FFR. Model C also behaved as expected for a 78% stenosis in that there is a higher change in FFR with an increase in flow rate. Model D had the most unexpected behavior out of the four models but this can be accounted for by analyzing the curved MPR images. As can be seen in Figure 11, the stenosis is present over a longer length of vasculature, resulting in a change that is similar to Model C with a higher percent stenosis.
By graphing the flow rate and FFR, the equation of the relation between the two values was determined. Using this equation, the FFR can be calculated at 125 mL/min, the average flow rate in the coronary arteries. This linear equation was used to determine for each model average FFR value for each %systole/%diastole ratio at a 125 mL/min flow rate. The results of this calculation are displayed in Table 1 below.
Table 1.
Calculation of average FFR for each model at the six ratios of %systole/%diastole with a flow rate of 125 mL/min.
| %systole/%diastole | 50/50 | 45/55 | 40/60 | 35/65 | 30/70 | 25/75 |
|---|---|---|---|---|---|---|
| Model A – 38% Stenosis | 0.94 | 0.94 | 0.92 | 0.98 | 0.89 | 0.82 |
| Model B – 25% Stenosis | 0.83 | 0.84 | 0.86 | 0.84 | 0.87 | 0.86 |
| Model C – 78% Stenosis | 0.85 | 0.80 | 0.78 | 0.82 | 0.81 | 0.78 |
| Model D – 51% Stenosis | 0.76 | 0.89 | 0.68 | 0.69 | 0.68 | 0.69 |
The results of this part of the study proved that the flow rate in the models needs to be closely regulated in order to achieve accurate FFR measurements. Confirming the physical aspects for flow in a tube, for each model the FFR decreased as the flow rate increased. The FFR calculations also further demonstrated the dependence on the %systole/%diastole ratio with the results at the extremes of 50/50 and 25/75 being significantly different.
Since each model was patient-specific, different percentages of stenosis were investigated. The mild stenosis Models A and B have percent stenosis of approximately 38% and 25% respectively. The moderate stenosis for Model D has a percent stenosis of approximately 51% and the severe stenosis for Model C has a percent stenosis of 78%. The average FFR for the six %systole/%diastole ratios were 0.91 for Model A, 0.85 for Model B, 0.81 for Model C, and 0.73 for Model D. Even though this is a small study, the correlation of FFR and stenosis severity is weak and indicates that other factors besides stenosis could affect the flow conditions in the coronary circulation.
DISCUSSION
We created four patient-specific phantoms of coronary trees which contained at least one stenosis. The percent stenosis were between 25% and 80%. The 3D printed phantoms allowed us a thorough investigation of the flow in the coronary trees and study the effect of the flow on the Fractional Flow Reserve measurements as performed in the clinic. The coronary geometries were acquired during 70–99% R-R segment of the ECG cycle. We reconstructed four cardiac volumes within this window and used the volume with the least motion artifacts to create the phantom. Thus the phantoms correspond to the largest coronary vessel diameter.
By changing the systole to diastole ratios we were able to create various pressure waveforms which could be related to healthy as well as patients affected by calcified valves for example. In healthy patients the systole percent is about 25–35% of the cardiac cycle.21 In patient suffering from heart failure the systole percent can reach 73% of the cardiac cycle.22
The FFR values measured in this benchtop setting correlated well with percent stenosis for three of the models. Model C, however, did not closely correlate FFR and percent stenosis with average FFR calculated as 0.81 and the percent stenosis measured as 78%. This indicates that the changes in flow cannot be determine with the percentage of stenosis alone. The placement and roughness of the stenosis may have a significant impact on the flow, as was seen in the lengthy stenosis in Model D. This cannot be accounted for with the percent stenosis calculation but can be determined through the FFR number. Our benchtop system is capable of demonstrating the effects that not only the percentage of stenosis but also the location of stenosis has on the FFR value.
CONCLUSIONS
We demonstrate an early benchtop FFR measurement system through the use of patient-specific 3D printed coronary artery models. The 3D models demonstrated physiological pressure drops occurring as a result of stenosis in the vessel and replicate pressure waveforms. By mechanically adjusting the flow rate, the FFR value demonstrated a linear corresponding dependence on flow rate that can be graphed. The capabilities of this system to model multiple physiological factors allows for a complex benchtop system that has the potential to be used for FFR measurement and diagnosis.
This tool can potentially be developed for clinical implementation; it is not limited to FFR diagnosis alone, as other vascular diseases can potentially be modeled to better understand pathophysiology and to plan cardiovascular interventions. This approach could also be used for testing CT image-based FFR methods.
Acknowledgments
This research was supported by Toshiba America Medical Systems, the Jacobs Institute, and Objet-Stratasys Inc.
References
- 1.Mokin M, Setlur Nagesh SV, Ionita CN, Mocco J, Siddiqui AH. Stent retriever thrombectomy with the Cover accessory device versus proximal protection with a balloon guide catheter: in vitro stroke model comparison. J Neurointerv Surg. 2016;8:413–417. doi: 10.1136/neurintsurg-2014-011617. [DOI] [PubMed] [Google Scholar]
- 2.Mokin M, Setlur Nagesh SV, Ionita CN, Levy EI, Siddiqui AH. Comparison of modern stroke thrombectomy approaches using an in vitro cerebrovascular occlusion model. AJNR Am J Neuroradiol. 2015;36:547–551. doi: 10.3174/ajnr.A4149. [DOI] [PMC free article] [PubMed] [Google Scholar]
- 3.Mokin M, Ionita CN, Nagesh SV, Rudin S, Levy EI, Siddiqui AH. Primary stentriever versus combined stentriever plus aspiration thrombectomy approaches: in vitro stroke model comparison. J Neurointerv Surg. 2015;7:453–457. doi: 10.1136/neurintsurg-2014-011148. [DOI] [PMC free article] [PubMed] [Google Scholar]
- 4.Mitsouras D, Liacouras P, Imanzadeh A, Giannopoulos A, Cai T. Medical 3d printing for the radiologist. RadioGraphics. 2015;35 doi: 10.1148/rg.2015140320. [DOI] [PMC free article] [PubMed] [Google Scholar]
- 5.Biglino G, Verschueren P, Zegels R, Taylor AM, Schievano S. Rapid prototyping compliant arterial phantoms for in-vitro studies and device testing. J Cardiovasc Magn Reson. 2013;15:2. doi: 10.1186/1532-429X-15-2. [DOI] [PMC free article] [PubMed] [Google Scholar]
- 6.Ikejimba LC, Graff CG, Rosenthal S, Badal A, Ghammraoui B, Lo JY, Glick SJ. A novel physical anthropomorphic breast phantom for 2D and 3D x-ray imaging. Med Phys. 2016 doi: 10.1002/mp.12062. [DOI] [PubMed] [Google Scholar]
- 7.Mitsouras D, Lee TC, Liacouras P, Ionita CN, Pietilla T, Maier SE, Mulkern RV. Three-dimensional printing of MRI-visible phantoms and MR image-guided therapy simulation. Magn Reson Med. 2016 doi: 10.1002/mrm.26136. [DOI] [PMC free article] [PubMed] [Google Scholar]
- 8.Ionita CN, Mokin M, Varble N, Bednarek DR, Xiang J, Snyder KV, Siddiqui AH, Levy EI, Meng H, Rudin S. Challenges and limitations of patient-specific vascular phantom fabrication using 3D Polyjet printing. SPIE Medical Imaging. 2014;9038 doi: 10.1117/12.2042266. 90380M-90380M-90312. [DOI] [PMC free article] [PubMed] [Google Scholar]
- 9.O’Hara RP, Chand A, Vidiyala S, Arechavala SM, Mitsouras D, Rudin S, Ionita CN. Advanced 3D mesh manipulation in stereolithographic files and post-print processing for the manufacturing of patient-specific vascular flow phantoms. SPIE Medical Imaging. 2016 doi: 10.1117/12.2217036. 978909-978909-978910. [DOI] [PMC free article] [PubMed] [Google Scholar]
- 10.Russ M, O’Hara R, Setlur Nagesh SV, Mokin M, Jimenez C, Siddiqui A, Bednarek D, Rudin S, Ionita C. Treatment Planning for Image-Guided Neuro-Vascular Interventions Using Patient-Specific 3D Printed Phantoms. Proc SPIE Int Soc Opt Eng. 2015;9417 doi: 10.1117/12.2081997. [DOI] [PMC free article] [PubMed] [Google Scholar]
- 11.Izzo RL, O’Hara RP, Iyer V, Hansen R, Meess KM, Nagesh SS, Siddiqui AH, Rudin S, Springer M, Ionita CN. 3D printed cardiac phantom for procedural planning of a transcatheter native mitral valve replacement. SPIE Medical Imaging. 2016 doi: 10.1117/12.2216952. 978908-978908-978916. [DOI] [PMC free article] [PubMed] [Google Scholar]
- 12.Ionita C, Angel E, Mitsouras D, Rudin S, Bednarek D, Zaid S, Wilson M, Rybicki F. Development of 3D Printed Coronary Phantoms for In-Vitro CT-FFR Validation Using Data from 320- Detector Row Coronary CT Angiography. Med Phys. 2016;43:3781. [Google Scholar]
- 13.Anderson JR, Diaz O, Klucznik R, Zhang YJ, Britz GW, Grossman RG, Lv N, Huang Q, Karmonik C. Validation of computational fluid dynamics methods with anatomically exact, 3D printed MRI phantoms and 4D pcMRI. Conf Proc IEEE Eng Med Biol Soc. 2014:6699–6701. doi: 10.1109/EMBC.2014.6945165. [DOI] [PubMed] [Google Scholar]
- 14.Tonino PA, De Bruyne B, Pijls NH, Siebert U, Ikeno F, van’t Veer M, Klauss V, Manoharan G, Engstrom T, Oldroyd KG, Ver Lee PN, MacCarthy PA, Fearon WF, Investigators FS Fractional flow reserve versus angiography for guiding percutaneous coronary intervention. N Engl J Med. 2009;360:213–224. doi: 10.1056/NEJMoa0807611. [DOI] [PubMed] [Google Scholar]
- 15.Leber WA. Is FFR-CT a ‘game changer’ in the diagnostic management of stable coronary artery disease? Herz. 2016;41:398–404. doi: 10.1007/s00059-016-4443-3. [DOI] [PubMed] [Google Scholar]
- 16.LaBounty TM, Nallamothu BK. FFR(CT): a new technology in search of a clinical application. Eur Heart J. 2015;36:3368–3369. doi: 10.1093/eurheartj/ehv534. [DOI] [PubMed] [Google Scholar]
- 17.Douglas PS, Pontone G, Hlatky MA, Patel MR, Norgaard BL, Byrne RA, Curzen N, Purcell I, Gutberlet M, Rioufol G, Hink U, Schuchlenz HW, Feuchtner G, Gilard M, Andreini D, Jensen JM, Hadamitzky M, Chiswell K, Cyr D, Wilk A, Wang F, Rogers C, De Bruyne B, Investigators P Clinical outcomes of fractional flow reserve by computed tomographic angiography-guided diagnostic strategies vs. usual care in patients with suspected coronary artery disease: the prospective longitudinal trial of FFR(CT): outcome and resource impacts study. Eur Heart J. 2015;36:3359–3367. doi: 10.1093/eurheartj/ehv444. [DOI] [PMC free article] [PubMed] [Google Scholar]
- 18.Nakanishi R, Matsumoto S, Alani A, Li D, Kitslaar PH, Broersen A, Koo BK, Min JK, Budoff MJ. Diagnostic performance of transluminal attenuation gradient and fractional flow reserve by coronary computed tomographic angiography (FFR(CT)) compared to invasive FFR: a sub-group analysis from the DISCOVER-FLOW and DeFACTO studies. Int J Cardiovasc Imaging. 2015;31:1251–1259. doi: 10.1007/s10554-015-0666-2. [DOI] [PubMed] [Google Scholar]
- 19.Schoenhagen P, Desai MY. Computed tomography-based fractional flow reserve (FFR-CT) – an attractive concept, but still lacking proof of clinical utility. Circ J. 2015;79:300–302. doi: 10.1253/circj.CJ-14-1306. [DOI] [PubMed] [Google Scholar]
- 20.Koo BK, Erglis A, Doh JH, Daniels DV, Jegere S, Kim HS, Dunning A, DeFrance T, Lansky A, Leipsic J, Min JK. Diagnosis of ischemia-causing coronary stenoses by noninvasive fractional flow reserve computed from coronary computed tomographic angiograms. Results from the prospective multicenter DISCOVER-FLOW (Diagnosis of Ischemia-Causing Stenoses Obtained Via Noninvasive Fractional Flow Reserve) study. J Am Coll Cardiol. 2011;58:1989–1997. doi: 10.1016/j.jacc.2011.06.066. [DOI] [PubMed] [Google Scholar]
- 21.Bazan O, Ortiz JP. Duration of Systole and Diastole for Hydrodynamic Testing of Prosthetic Heart Valves: Comparison Between ISO 5840 Standards and in vivo Studies. Brazilian Journal of Cardiovascular Surgery. 2016;31:171–173. doi: 10.5935/1678-9741.20160036. [DOI] [PMC free article] [PubMed] [Google Scholar]
- 22.Friedberg MK, Silverman NH. Cardiac ventricular diastolic and systolic duration in children with heart failure secondary to idiopathic dilated cardiomyopathy. Am J Cardiol. 2006;97:101–105. doi: 10.1016/j.amjcard.2005.07.127. [DOI] [PubMed] [Google Scholar]


