Abstract
Analyzing neural dynamics underlying complex behavior is a major challenge in systems neurobiology. To meet this challenge through computational neuroscience, we have constructed a brain-based device (Darwin X) that interacts with a real environment, and whose behavior is guided by a simulated nervous system incorporating detailed aspects of the anatomy and physiology of the hippocampus and its surrounding regions. Darwin X integrates cues from its environment to solve a spatial memory task. Place-specific units, similar to place cells in the rodent, emerged by integrating visual and self-movement cues during exploration without prior assumptions in the model about environmental inputs. Because synthetic neural modeling using brain-based devices allows recording from all elements of the simulated nervous system during behavior, we were able to identify different functional hippocampal pathways. We did this by tracing back from reference neuronal units in the CA1 region of the simulated hippocampus to all of the synaptically connected units that were coactive during a particular exploratory behavior. Our analysis identified a number of different functional pathways within the simulated hippocampus that incorporate either the perforant path or the trisynaptic loop. Place fields, which were activated by the trisynaptic circuit, tended to be more selective and informative. However, place units that were activated by the perforant path were prevalent in the model and were crucial for generating appropriate exploratory behavior. Thus, in the model, different functional pathways influence place field activity and, hence, behavior during navigation.
Keywords: network, entorhinal cortex, CA1, place cell, computational model
Analyzing the complexities of neural dynamics underlying behavior is a difficult task for systems neurobiologists. A number of factors contribute to this complexity: the variability of behavior, the multilevel nature and nonlinearity of neural interactions, and the large number of neurons in different functioning brain regions. These factors challenge the design of experimental approaches as well as the construction of computational models. For this reason, we have constructed brain-based devices (BBDs) whose behavior in a real world environment is guided by a simulated nervous system based on features of vertebrate neuroanatomy and neurophysiology. The power of this approach is that it allows simultaneous recording of the state and interactions of all components of the simulated nervous system at all levels during a behavioral task in the real world. Here, we describe a functional analysis of neural patterns in Darwin X, a BBD incorporating aspects of the detailed anatomy and physiology of the hippocampus and its surrounding regions (1). Over the last 12 years, we have successfully constructed BBDs to test theories of the nervous system having to do with perceptual categorization, primary and secondary conditioning, visual binding, and texture discrimination (2–6).
Darwin X can integrate cues from its environment and provide flexible navigation solutions to spatial memory tasks. The responses of simulated neuronal units in the hippocampal areas during its exploratory behavior are comparable to those of neurons in the rodent hippocampus. By simultaneously sampling from the BBD's neural regions during a navigation task, we are able to identify different functional hippocampal pathways and assess their influence on behavior. We introduce an analysis that traces back from any reference neuronal unit to identify all of the other neuronal units that were anatomically and functionally related to the activity of that reference unit. This analysis leads us to predictions about the influence of the perforant path and the trisynaptic loop on place cell activity and behavior during navigation that can be tested in living animals.
Materials and Methods
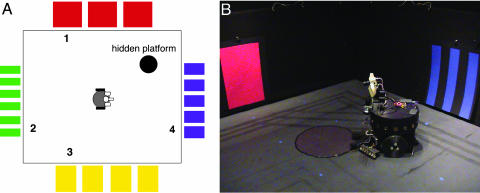
Task and Training. Spatial memory in Darwin X was assessed in a dry variant of the Morris water maze task (7) in which the BBD is rewarded by finding a hidden platform. Successful performance of this task is reflected by the BBD navigating to the hidden platform from any starting position by using only visual landmarks and self-movement cues. Darwin X was allowed to explore an enclosure in which there were visual landmarks on the walls and a circular “hidden platform” of reflective black paper (see Fig. 1). The platform could not be detected by the visual system of Darwin X, but was detectable at close range by an IR sensor on the front of the device.
Fig. 1.
Layout of the enclosure used for the hidden platform task. (A) Schematic of the environment. Enclosure is 16 feet × 14 feet with black walls and flooring. Pieces of differently colored paper of varying widths were hung on each of the walls. A hidden circular platform, 24 inches in diameter and made of reflective black paper, was placed in the center of a quadrant in the enclosure. Each trial began in one of four starting locations (see numbers 1–4 in the diagram). (B) Snapshot of Darwin X in its environment.
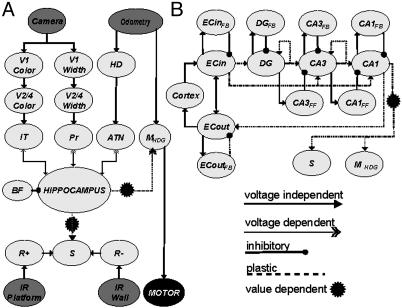
Darwin X began a trial from one of four starting locations (see Fig. 1 A) and explored the enclosure until it encountered the hidden platform or until a time limit of 1,000 s was reached. A training block was defined as a set of four trials from each of four starting locations. Four blocks (16 trials) were completed by the device during training. Training was repeated with nine different Darwin X “subjects.” Each subject consisted of the same physical device, but each possessed a unique simulated nervous system differing at the level of synaptic connections. These differences among subjects were a consequence of random initialization of both the microscopic details of connectivity between individual neuronal units and the initial connection strengths between those units. The overall connectivity among neuronal units remained similar among different subjects: connectivity was constrained by the synaptic pathways, arborization patterns, and ranges of initial connection strengths (see Fig. 2 and Supporting Text and Tables 2 and 3, which are published as supporting information on the PNAS web site).
Fig. 2.
Schematic of the regional and functional neuroanatomy of Darwin X. Gray ellipses denote different neural areas. Arrows denote projections from one area to another. (A) Diagram of cortical-hippocampal connectivity. Input to the neural simulation comes from a charge-coupled device camera, wheel odometry, and IR sensors for wall and platform detection. The simulation contains neural areas analogous to visual cortex (V1, V2/4), the inferotemporal cortex (IT), parietal cortex (Pr), head direction units (HD), anterior thalamic nuclei (ATN), motor areas for egocentric heading (MHDG), a value system (S), and positive and negative reward areas (R+, R-). The hippocampus is connected with the three major sensor input streams (IT, Pr, ATN), the motor system (MHDG), and the value system (S). The hippocampus receives rhythmic inhibition from a simulated basal forebrain region (BF). (B) Diagram of connectivity within the hippocampal region. The modeled hippocampus contains areas analogous to entorhinal cortex (ECIN,ECOUT), dentate gyrus (DG), and the CA3 and CA1 subfields. These areas contain interneurons that implement feedback inhibition (e.g., CA3 → CA3FB → CA3) and feed-forward inhibition (e.g., DG → CA3FF → CA3). See supporting information for details.
Physical Instantiation. The physical device portion of Darwin X consists of a wheeled mobile base equipped with a charge-coupled device camera for vision, odometry for self-movement cues, IR transceivers for obstacle avoidance, and a front mounted, downward pointing IR transceiver to detect the hidden platform (see Fig. 1B). Light-emitting diodes on top of Darwin X, detectable by two cameras placed over the enclosure, were used to track Darwin X's position.
Darwin X was equipped with a set of innate behavioral responses for exploration, obstacle avoidance, and platform detection. Its default behavior was to proceed forward for ≈10 s, rotate to its left, then to its right, and then choose a new heading based on activity in the motor area region of its simulated nervous system (see MHDG in Fig. 2). If Darwin X detected a large obstacle such as a wall with its IR sensors, it would initiate an obstacle avoidance response. If it detected the hidden platform with the downward facing IR sensor, Darwin X would stop on the platform and look to its left, then to its right before ending a successful trial.
Simulated Nervous System. Darwin X's behavior is guided by a simulated nervous system modeled on the anatomy and physiology of the vertebrate nervous system but, obviously, with far fewer neurons and a much less complex architecture. The neural simulation was run on a beowulf cluster containing 12 1.4-GHz Pentium IV computers running the Linux operating system. All sensory input from the device and motor commands to the device were communicated through wireless links between the device and one of cluster's workstations.
The simulated nervous system consists of a number of areas labeled according to the analogous neocortical, hippocampal, and subcortical brain regions. Each area contains neuronal units that can be either excitatory or inhibitory, each of which represents a local population of neurons (8). To distinguish modeled areas from corresponding regions in the mammalian nervous system, the simulated areas are indicated in italics (e.g., IT for “inferotemporal”). A complete description of the specific parameters relating to the simulated nervous system is given in ref. 1 and is included in Supporting Text and Tables 2 and 3.
Fig. 2 shows a high-level diagram of the simulated nervous system including the various neural areas and the overall arrangement of synaptic connections. In the present experiments, the simulated nervous system contained 50 neural areas, 90,000 neuronal units, and ≈1.4 million synaptic connections. It included a visual system, a head direction system, a hippocampal formation, a basal forebrain, a value or reward system, and an action selection system.
A neuronal unit in Darwin X is simulated by a mean firing rate model, in which the activity of each unit corresponds to the average activity of a group of ≈100 real neurons during a time period of ≈200 ms. Synaptic connections between neural units, both within and between neuronal areas, are set to be either voltage-independent or -dependent, and either plastic or non-plastic (see Fig. 2 and Supporting Text). Voltage-independent connections provide synaptic input regardless of postsynaptic state. Voltage-dependent connections represent the contribution of receptor types (e.g., NMDA receptors) that require postsynaptic depolarization to be activated (9, 10). Synaptic strengths are subject to modification based on the Bienenstock–Cooper–Munro (BCM) learning rule (11), where synapses between neuronal units with strongly correlated firing phases are potentiated and synapses between neuronal units with weakly correlated phases are depressed. Plastic synaptic connections are either value-independent or value-dependent (e.g., CA1 → S, CA1 → MHDG in Fig. 2 and Supporting Text), where the magnitude of potentiation or depression of connection strengths is based on a neural implementation of a temporal difference learning rule (12, 13).
During each simulation cycle in Darwin X, sensory input is processed, the states of all neuronal units are computed, the connection strengths of all plastic connections are determined, and motor output is generated. In our experiments, execution of each simulation cycle required ≈200 ms of real time. During each simulation cycle, all neuronal activities were saved on a hard disk, and Darwin X's position was recorded.
The visual system was modeled on the primate occipitotemporal pathway and an occipitoparietal pathway. The occipitotemporal pathway (V1_color → V2/4_color → IT) contained neuronal units in successive areas having progressively larger receptive fields until, in inferotemporal cortex (IT), receptive fields covered nearly the entire visual field (14). The occipitoparietal pathway (V1_width → V2/4_width → PR) contained neuronal units that responded to the size and position of objects (15). A head direction system was modeled after areas of the rodent nervous system (e.g., anterior thalamic nuclei) that respond selectively to an animal's heading (16, 17). Odometer information obtained from Darwin X's wheels was used to estimate current heading.
Hippocampal Anatomy. The architecture of the simulated hippocampal formation (1) was based on mammalian neuroanatomy. The input streams into the hippocampus are from the associative thalamocortical areas in the simulation (see Fig. 2 and Supporting Text). The relative numbers of neuronal units in each area, and the intrinsic and extrinsic connectivity of the hippocampus were modeled based on known anatomical measurements (18–20). The perforant path projects from entorhinal cortex mainly to the dentate gyrus but also to the CA3 and CA1 subfields. Mossy fibers, Schaffer collaterals, and divergent projections from the hippocampus back to thalamocortical areas were also modeled in the neural simulation. Moreover, the prevalent recurrent connectivity found in the hippocampal formation was included in the model. A simplified model of the basal forebrain provided an extrinsic rhythm, whose function was to gate input into the hippocampus and keep activity levels stable.
Activity in the simulated value system (S in Fig. 2) signals the occurrence of salient sensory events. This activity contributes to the modulation of value-dependent connection strengths in synaptic pathways (CA1 → S and CA1 → MHDG). The projection from the simulated CA1 area to the value and goal decision areas is consistent with the known connectivity between CA1 and nucleus accumbens and frontal areas (21, 22). Initially, S is activated only by the hidden platform IR detector (see R+ → S in and Fig. 2), causing potentiation of value dependent connections, or by obstacle avoidance IR detectors (see R- → S in Fig. 2), causing depression of value-dependent connections. After experience, the value system could be activated directly by CA1 activity. For implementation details, see Supporting Text.
Backtracing of Functional Pathways. We have developed a method that traces functional pathways by choosing a particular reference neuronal unit at a specific time and recursively examining all neuronal units that caused the observed activity in this reference unit. We call this iterative method a backtrace. In this study, we chose reference neuronal units in the CA1 region whose activity affected motor output units, which caused the device to choose a new heading. Specifically, a reference CA1 neuronal unit had to fit the following criteria: (i) It had to be active at the time of a heading choice. (ii) It had to have strong synaptic input to the MHdg unit that was determining the new heading. This criterion was met by choosing the five strongest CA1 units at the time of heading choice, as reflected by their synaptic weight multiplied by presynaptic activity. (iii) The given CA1 unit had to meet the above criteria in at least 3 of the last 12 of the 16 training trials. (iv) If a given CA1 unit was identified multiple times in one trial, the trial in which this unit had the largest synaptic influence was used. In a single Darwin X subject, we found 16 CA1 reference units that satisfied these criteria; these units were active during as few as four and as many as nine new heading choices.
Starting with a CA1 reference unit, the backtrace proceeds by first identifying a list of other neuronal units that are physically connected to the reference CA1 unit and are active during the previous time step (200 ms). The procedure is then repeated with this new list of neuronal units. We iterated this process until we identified neuronal units six time steps back from the time step at which the reference CA1 unit was chosen. We used this method to generate 91 backtrace networks that contained 56–478 neuronal units by the sixth time step back from the starting point.
To analyze which neuronal units from different neural areas directly influenced the activity of the reference CA1 neuronal unit, the number and types of pathways were identified in the backtrace network at two time steps back. Specifically, for each network, a 10-element vector was constructed, where each vector element denoted a pathway (i.e., ATN → EC, IT → EC, PR → EC, EC → EC, EC → DG, EC → CA3, EC → CA1, DG → CA3, CA3 → CA3, and CA3 → CA1; see Fig. 2 for abbreviations). The value of each vector element corresponded to the frequency of occurrence of each of the pathways present in the network; that is, for a given backtrace network, the number and type of connections were counted (see Fig. 5 A1 and B1). To classify different functional pathways, the Manhattan distances (matlab, Mathworks, Natick, MA) between the 91 vectors corresponding to the backtraces were calculated and a hierarchical cluster tree was created by grouping vectors that were close together.
Fig. 5.
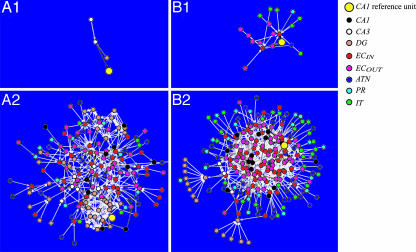
Representative backtrace networks. Each circle in the network represents a neuronal unit whose area is denoted by its color. For abbreviations, see Fig. 2. The lines between vertices denote a connection between neuronal units and the gray scale reflects the level of synaptic influence on a unit with white being a weaker link and black being the strongest. The layout of circles is generated by an energy minimization technique (Pajek Network Analysis Package; http://vlado.fmf.uni-lj.si/pub/networks/pajek), which results in neuronal units that are strongly functionally connected to be bunched together. (A) Networks where the CA1 reference unit was mainly driven by CA3 and dentate gyrus. (A1) Two time steps back. (A2) Six time steps back. (B) Networks where the CA1 reference unit was mainly driven by entorhinal cortex. (B1) Two time steps back. (B2) Six time steps back.
Results
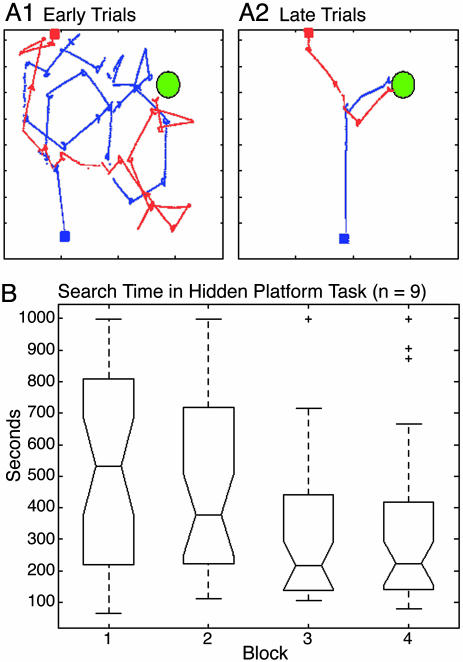
Behavior and Place Field Formation in the Hidden Platform Task. In general, after the second block (trials 9–16), Darwin X traversed directly to the hidden platform from multiple starting points. Fig. 3A shows representative trajectories from a subject early during training trials (Fig. 3A1) and later in the training (Fig. 3A2). Darwin X subjects showed significant improvement in the hidden platform task, as measured by the time to find the hidden platform, as training progressed (Fig. 3B). A video of the performance may be seen in Movie 1, which is published as supporting information on the PNAS web site.
Fig. 3.
Behavioral performance in the hidden platform task. (A) Trajectories of a subject during the training paradigm. The green circle denotes the location of the platform during training trials. Red and blue squares denote starting locations. Red and blue lines indicate trajectories during individual trials. (A1) Early trials. (A2) Late trials. (B) Box plot of the search times over the course of the experiment for the nine subjects. Each subject ran 16 trials in which a block consisted of four trials, each with a different starting location. The middle line of each box is the median search time, the lower line is the 25th percentile, and the upper line is the 75th percentile. The lines extending from the box show the extent of the sample except for outliers. Outliers, which are data points >1.5 times the upper quartile, are denoted by a “+”. Search times were significantly shorter for blocks 3 and 4 than block 1 (P < 0.01; Wilcoxon signed-rank test).
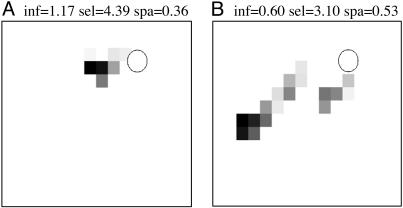
Many of the neuronal units in the hippocampal areas of the simulation showed responses typical of place cells (23) where the neuronal unit was active exclusively in a specific region of the environment. These place units emerged by integrating visual and self-movement cues during exploration without incorporating prior assumptions about the environmental inputs into the model. Fig. 4 shows examples of place units in CA1, one of which was activated by the perforant path and the other of which was activated by the trisynaptic path. We characterized the spatial responses of the simulated hippocampal neuronal units by calculating the information, sparsity, and selectivity metrics that have been used to analyze hippocampal place fields in animals (24). The spatial information is derived by considering a cell as a communication channel whose input is the rat's location (see ref. 24): If the neuronal unit is active across half of an environment, then the occurrence of the unit's activity conveys one binary bit of information. Sparsity measures the fraction of the explored environment in which the neuronal unit was active. Selectivity is equal to the maximum firing rate divided by the mean firing rate of the unit. The more tightly concentrated the unit's activity, the higher the selectivity. The means and standard deviations of the reference CA1 units' information, selectivity, and sparsity were 0.65 ± 0.41, 4.50 ± 3.32, and 0.57 ± 0.17, respectively, and were comparable to those measures reported during rat foraging (24).
Fig. 4.
Representative place units recorded in simulated CA1. Each outline represents Darwin X's enclosure, and each pixel represents one square foot in the enclosure. The gray scale represents the activity of a given CA1 neuronal unit and is normalized from quiescent (white) to maximal (black) firing rate. The circle denotes the location of the hidden platform. Above each chart are the spatial metrics for the neuronal units: spatial information (inf), sparsity (spa), and selectivity (sel). (A) CA1 neuronal unit activated by trisynaptic loop. (B) CA1 neuronal unit activated by perforant path.
Identifying Functional Pathways by Backtracing. Two sample backtrace networks, which were typical examples of the two broad classes of functional connectivity identified by the backtracing algorithm, are shown in Fig. 5. This methodology allows us to identify functional pathways that cause a given unit to be active, and in turn generate behavior. Fig. 5A shows a backtrace where the reference CA1 unit was predominately driven by the trisynaptic loop (dentate gyrus and CA3). Fig. 5B shows a backtrace where the reference CA1 unit was predominately driven by the simulated entorhinal cortex. Typically, relatively few neuronal units caused the CA1 unit to fire at two time steps back (see Fig. 5 A1 and B1). However, by six time steps back, the networks included large numbers of neuronal units and synaptic connections (see Fig. 5 A2 and B2).
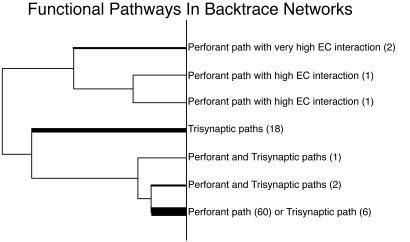
A cluster analysis, as described in Materials and Methods, was performed on the 91 backtraces at two time steps back from the starting point, by calculating path frequency vectors for each backtrace. This analysis identified seven different functional connectivity classes based on the different connectivity patterns (see Fig. 6). These classes were labeled according to the components of the vectors that were grouped by the cluster analysis. In general, the backtraces fell into either a perforant path category where CA1 was driven by the entorhinal cortex or a trisynaptic loop category where CA1 was driven by CA3. Only 3 of the 91 backtraces had both perforant and trisynaptic pathways driving CA1. The network shown in Fig. 5A falls in the “trisynaptic loop” category of Fig. 6 as a result of the strong CA3 and DG activity that drives the reference CA1 unit. Its corresponding place field activity is depicted in Fig. 4A. The network shown in Fig. 5B falls in the “perforant path with high EC interaction” category of Fig. 6 because of the direct connections from ECIN to CA1 and the recurrent ECIN to ECOUT interactions that can be observed in the figure. Its corresponding place field activity is depicted in Fig. 4B.
Fig. 6.
Dendrogram generated from the cluster analysis on the 91 backtrace networks. As shown on the right, seven broad classes of functional connectivity were identified. The thickness of the lines corresponds to the number of networks within each class (actual numbers are shown in parentheses).
The functional pathways were strongly correlated with place unit metrics (see Table 1). Neuronal units that were high in spatial information and selectivity with low sparsity tended to be supported by the trisynaptic pathway, whereas neuronal units having lower spatial information and less selectivity tended to be supported by the perforant pathway.
Table 1. Correlation between functional paths and place field metrics.
| Place field metrics
|
|||
|---|---|---|---|
| Path occurrence | Information | Selectivity | Sparsity |
| ATN → EC | -0.232 | ||
| IT → EC | |||
| PR → EC | -0.257 | 0.239 | |
| EC → EC | |||
| EC → CA3 | 0.332* | 0.431* | -0.308* |
| EC → CA1 | -0.285* | -0.295* | 0.232 |
| DG → CA3 | 0.339* | 0.359* | -0.327* |
| CA3 → CA3 | |||
| CA3 → CA1 | 0.332* | 0.295* | -0.314* |
Only significant correllations are shown (P < 0.05). Highly significant correllations (P < 0.01) are denoted by an asterisk. See Fig. 2 for abbreviations.
Comparing across multiple steps of the backtraces, we found that when the traces started from the same reference unit at two time steps back, the units in these networks were similar (57% of the neuronal units were shared across traces). At six time steps back, the units were more varied (32% of the neuronal units were in common). However, there was very little overlap of units in those backtrace networks in which the reference units were different but the backtrace corresponded to the same place in the environment. These results suggest that different inputs and elements can cause very specific and repeatable responses in downstream neuronal units such as the reference units examined here. In this respect, Darwin X is an example of a degenerate system: structurally different circuits and dynamics can yield similar neural and organism behavior (25, 26).
Discussion
The BBD methodology used in this study permitted direct investigation of the connectivity driving simulated hippocampal activity in the context of navigation. In contrast to other computational models of the hippocampus, Darwin X was embedded in the environment (27–33). No assumptions were made concerning the form of environmental inputs to the model or the behavioral actions required to solve a spatial memory task. Importantly, no underlying functions were used to bias neuronal unit activity toward spatial tuning. Moreover, unlike robotic systems (34–38), in which abstract features of the hippocampus were used to drive spatially modulated discharge, Darwin X implements many elements of the macro- and microanatomy characteristic of hippocampal–hippocampal and hippocampal–cortical connections.
Spatially modulated activity of the simulated hippocampal CA1 region proved sufficient to drive purposeful behavior in the context of the spatial memory task. Neuronal units of the hippocampal simulation exhibited spatial modulation (see Fig. 4) comparable to that observed in the rodent (23, 24). As in the rodent, such activity was produced through an integration of visual and self-motion information across time (39).
Full knowledge of the anatomical connectivity and neuronal unit activity patterns in combination with the substantial neuroanatomical detail of the simulation (see Supporting Text) permitted us to dissect distinct processes by which network activity resulted in behavior leading to the hidden target. The primary driving forces for activation of CA1 neuronal units were found to correspond to direct perforant inputs or trisynaptic inputs. In the vast majority of cases, one or the other, but not both, of these two pathways drove CA1 activity (see Fig. 6). It was notable that the spatial metrics of CA1 activity driven by these two main pathways differed. CA1 neuronal units driven primarily by trisynaptic inputs exhibited higher spatial information and selectivity and lower sparsity than CA1 neuronal units driven by direct perforant inputs (Table 1). Each of these pathways was capable of producing appropriate behavioral choices.
The functional segregation of direct perforant and trisynaptic pathways to CA1 neuronal unit activation found in the simulated hippocampus may be of heuristic value in understanding the physiology of the mammalian hippocampus. For instance, this finding suggests the possibility that the input strengths of entorhinal and CA3 neurons onto individual CA1 neurons are bimodally distributed. Evidence for this might be found by in vitro experiments in tissue slices measuring the responses of single CA1 neurons to entorhinal and CA3 stimulation. In a similar vein, paired entorhinal–CA1 and CA3–CA1 recordings in behaving animals could reveal distinct CA1 neuron populations whose activity shows greater temporal association with either entorhinal or CA3 unit activities depending on the task.
A second possibility suggested by our simulation is that the entorhinal cortical inputs to CA1 may be sufficient to produce place-specific discharge as well as associations between the position of animal in space and the appropriate action it needs to execute to reach a goal (40). In this respect, it is notable that some entorhinal neurons in the rat exhibit robust spatial modulation that is also sensitive to the context of preceding or subsequent actions (41, 42). Taken together, these observations imply that associations between spatial positions and correct actions might be spared after lesions restricted to the dentate gyrus and CA3 of the rodent.
Finally, the backtracing methodology demonstrated that, at only a few time steps back, the neuronal units producing direct activation of any individual CA1 reference neuronal unit remained fairly constant. However, the patterns of activity obtained from steps further back in time varied much more. Thus, the simulation exhibited degeneracy in the sense that many different patterns of activity could converge to produce activation of CA1 neurons leading to correct behavioral choices. The extent to which this occurs in behaving animals remains to be determined.
Supplementary Material
Acknowledgments
We thank A. Seth and J. Fleischer for useful suggestions and discussion and J. Snook, D. Moore, and D. Hutson for their contribution to the design of Darwin X. This work was supported by the Neurosciences Research Foundation, the W. M. Keck Foundation, the Defense Advanced Research Projects Agency (DARPA), and the Office of Naval Research.
Abbreviation: BBD, brain-based device.
References
- 1.Krichmar, J. L., Nitz, D. A., Fleischer, J. G., Seth, A. K. & Edelman, G. M. (2005) Neuroinformatics, in press. [DOI] [PubMed]
- 2.Almassy, N., Edelman, G. M. & Sporns, O. (1998) Cereb. Cortex 8, 346-361. [DOI] [PubMed] [Google Scholar]
- 3.Edelman, G. M., Reeke, G. N., Gall, W. E., Tononi, G., Williams, D. & Sporns, O. (1992) Proc. Natl. Acad. Sci. USA 89, 7267-7271. [DOI] [PMC free article] [PubMed] [Google Scholar]
- 4.Krichmar, J. L. & Edelman, G. M. (2002) Cereb. Cortex 12, 818-830. [DOI] [PubMed] [Google Scholar]
- 5.Seth, A. K., McKinstry, J. L., Edelman, G. M. & Krichmar, J. L. (2004) Cereb. Cortex 14, 1185-1199. [DOI] [PubMed] [Google Scholar]
- 6.Seth, A. K., McKinstry, J. L., Edelman, G. M. & Krichmar, J. L. (2004) in Animals to Animats 8: Proceedings of the Eighth International Conference on the Simulation of Adaptive Behavior, ed. Meyer, J. A. (MIT Press, Cambridge, MA), pp. 130-139.
- 7.Morris, R. (1984) J. Neurosci. Methods 11, 47-60. [DOI] [PubMed] [Google Scholar]
- 8.Edelman, G. M. (1987) Neural Darwinism: The Theory of Neuronal Group Selection (Basic, New York).
- 9.Grossberg, S. (1999) Conscious Cogn. 8, 1-44. [DOI] [PubMed] [Google Scholar]
- 10.Wray, J. & Edelman, G. M. (1996) Cereb. Cortex. 6, 701-716. [DOI] [PubMed] [Google Scholar]
- 11.Bienenstock, E. L., Cooper, L. N. & Munro, P. W. (1982) J. Neurosci. 2, 32-48. [DOI] [PMC free article] [PubMed] [Google Scholar]
- 12.Sutton, R. S. & Barto, A. G. (1990) in Learning and Computational Neuroscience: Foundations of Adaptive Networks, ed. Moore, J. (MIT Press, Cambridge, MA) pp. 497-537.
- 13.Montague, P. R., Dayan, P. & Sejnowski, T. J. (1996) J. Neurosci. 16, 1936-1947. [DOI] [PMC free article] [PubMed] [Google Scholar]
- 14.Ungerleider, L. G. & Haxby, J. V. (1994) Curr. Opin. Neurobiol. 4, 157-165. [DOI] [PubMed] [Google Scholar]
- 15.Ungerleider, L. & Mishkin, M. (1982) in Analysis of Visual Behavior, ed. Mansfield, R. (MIT Press, Cambridge, MA), pp. 549-586.
- 16.Muller, R. U., Ranck, J. B., Jr., & Taube, J. S. (1996) Curr. Opin. Neurobiol. 6, 196-206. [DOI] [PubMed] [Google Scholar]
- 17.Taube, J. S. (1998) Prog. Neurobiol. 55, 225-256. [DOI] [PubMed] [Google Scholar]
- 18.Treves, A. & Rolls, E. T. (1994) Hippocampus 4, 374-391. [DOI] [PubMed] [Google Scholar]
- 19.Amaral, D. G., Ishizuka, N. & Claiborne, B. (1990) Progr. Brain Res. 83, 1-11. [DOI] [PubMed] [Google Scholar]
- 20.Bernard, C. & Wheal, H. V. (1994) Hippocampus 4, 497-529. [DOI] [PubMed] [Google Scholar]
- 21.Mogenson, G. & Nielsen, M. (1984) Behav. Neural Biol. 42, 52-60. [DOI] [PubMed] [Google Scholar]
- 22.Thierry, A. M., Gioanni, Y., Degenetais, E. & Glowinski, J. (2000) Hippocampus 10, 411-419. [DOI] [PubMed] [Google Scholar]
- 23.O'Keefe, J. & Dostrovsky, J. (1971) Brain Res. 34, 171-175. [DOI] [PubMed] [Google Scholar]
- 24.Skaggs, W. E., McNaughton, B. L., Wilson, M. A. & Barnes, C. A. (1996) Hippocampus 6, 149-172. [DOI] [PubMed] [Google Scholar]
- 25.Edelman, G. M. & Gally, J. A. (2001) Proc. Natl. Acad. Sci. USA 98, 13763-13768. [DOI] [PMC free article] [PubMed] [Google Scholar]
- 26.Tononi, G., Sporns, O. & Edelman, G. M. (1999) Proc. Natl. Acad. Sci. USA 96, 3257-3262. [DOI] [PMC free article] [PubMed] [Google Scholar]
- 27.Shapiro, M. L. & Hetherington, P. A. (1993) Behav. Neurosci. 107, 34-50. [DOI] [PubMed] [Google Scholar]
- 28.Blum, K. I. & Abbott, L. F. (1996) Neural Comput. 8, 85-93. [DOI] [PubMed] [Google Scholar]
- 29.Samsonovich, A. & McNaughton, B. L. (1997) J. Neurosci. 17, 5900-5920. [DOI] [PMC free article] [PubMed] [Google Scholar]
- 30.Redish, A. D., Touretzky, D. & Wan, H. S. (1993) Neural Comput. 5, 869-884. [Google Scholar]
- 31.Recce, M. & Harris, K. D. (1996) Hippocampus 6, 735-748. [DOI] [PubMed] [Google Scholar]
- 32.Foster, D. J., Morris, R. G. & Dayan, P. (2000) Hippocampus 10, 1-16. [DOI] [PubMed] [Google Scholar]
- 33.Mataric, M. J. (1991) in From Animals to Animats, ed. Wilson, S. W. (MIT Press, Cambridge, MA), pp. 169-175.
- 34.Arleo, A. & Gerstner, W. (2000) in From Animals to Animats 6: Proceedings of the Sixth International Conference on Simulation of Adaptive Behavior, ed. Wilson, S. W. (MIT Press, Cambridge, MA), pp. 236-245.
- 35.Bachelder, I. A. & Waxman, A. M. (1995) Robotics Autonomous Syst. 16, 267-289. [Google Scholar]
- 36.Burgess, N., Donnett, J. G., Jeffery, K. J. & O'Keefe, J. (1997) Biol. Sci. 352, 1535-1543. [DOI] [PMC free article] [PubMed] [Google Scholar]
- 37.Gaussier, P., Revel, A., Banquet, J. P. & Babeau, V. (2002) Biol. Cybernet. 86, 15-28. [DOI] [PubMed] [Google Scholar]
- 38.Milford, M. J., Wyeth, G. F. & Prasser, D. (2004) in Proceedings of the 2004 IEEE International Conference on Robotics and Automation, New Orleans, LA (Omni, Madison, WI), pp. 403-408.
- 39.Gothard, K. M., Skaggs, W. E. & McNaughton, B. L. (1996) J. Neurosci. 16, 8027-8040. [DOI] [PMC free article] [PubMed] [Google Scholar]
- 40.Brun, V. H., Otnass, M. K., Molden S., Steffenach, H. A., Witter, M. P., Moser, M. B. & Moser, E. I. (2002) Science 296, 2243-2246. [DOI] [PubMed] [Google Scholar]
- 41.Frank, L. M., Brown, E. N. & Wilson, M. (2000) Neuron 27, 169-178. [DOI] [PubMed] [Google Scholar]
- 42.Fyhn, M., Molden, S., Witter, M. P., Moser, E. I. & Moser, M. B. (2004) Science 305, 1258-1264. [DOI] [PubMed] [Google Scholar]
Associated Data
This section collects any data citations, data availability statements, or supplementary materials included in this article.


