Abstract
Fluorescence microscopy and spectroscopy techniques are commonly used to investigate complex and interacting biological systems (e.g. proteins and nanoparticles in living cells), since these techniques can explore intracellular dynamics with high time resolution at the nanoscale. Here we extended one of the Image Correlation Spectroscopy (ICS) methods, i.e. the image Mean Square Displacement, in order to study 2-dimensional diffusive and flow motion in confined systems, whose driving speed is uniformly distributed in a variable angular range. Although these conditions are not deeply investigated in the current literature, they can be commonly found in the intracellular trafficking of nanocarriers, which diffuse in the cytoplasm and/or may move along the cytoskeleton in different directions. The proposed approach could reveal the underlying system’s symmetry using methods derived from fluorescence correlation concepts and could recover dynamic and geometric features which are commonly done by single particle analyses. Furthermore, it improves the characterization of low-speed flow motions, when compared to SpatioTemporal Image Correlation Spectroscopy (STICS). Although we present a specific example (lipoplexes in living cells), the emphasis is in the discussion of the method, its basic assumptions and its validation on numeric simulations.
Keywords: Image Correlation Spectroscopy (ICS), intracellular trafficking, drug and gene delivery
1. Introduction
One important task in biophysics concerns the characterization of motion of macromolecules in living cells. This task is generally carried out by means of fluorescence microscopy or spectroscopy techniques and provides a fundamental approach to the study of dynamics and interactions at cellular and molecular levels. These methods explore a variety of biological processes involving membrane proteins [1–4], protein-protein interactions [5], nucleic acids, lateral structure of biological membranes [6], molecular diffusion and cytoplasmatic trafficking of nanoparticles (NPs) [7–9]. NPs offer unique possibilities for overcoming cellular barriers in order to improve the delivery of various drugs and gene nanomedicines. Characterizing the intracellular mode of motion of nanocarriers is rapidly emerging as a key issue in drug delivery. In this regard, Single Particle Tracking (SPT) represents the technique-of-choice [10–15], but it is extremely time consuming. On the other side, variants of Fluorescence Correlation Spectroscopy (FCS) provide techniques by which fluorescent labeled objects can be studied at high spatial and temporal resolution, without identifying single particles. In detail, FCS measures spontaneous intensity fluctuations caused by small deviations from thermal equilibrium [16, 17]. The analysis is commonly achieved by applying temporal correlation functions, which can be coupled to spatial information, for example by means of laser scanning techniques. Image Correlation Spectroscopy (ICS) operates on image stacks and globally refers to the ensemble of simultaneously detected NPs. Average values but not their distribution are obtained by ICS, but a great amount of data can be rapidly achieved due to its high statistics. Many ICS-based methods have been developed, such as Raster Image Correlation Spectroscopy (RICS) [18], Temporal and SpatioTemporal Image Correlation Spectroscopy (TICS and STICS respectively) [1, 7, 9], ν-space ICS [19], Particle Image Correlation Spectroscopy (PICS) [20], image Mean Square Displacement (iMSD) [2]. Each method has its own field of application such as dynamic processes ranging from diffusion of cytosolic proteins, slower processes such as the assembly and disassembly of large multiprotein complexes to determination of spatial maps of concentrations, aggregation, and dynamics in living cells. However, all of these methods have not specifically been designed to the study two-dimensional dynamical processes driven by flow terms, which are uniformly distributed within an angular range. These conditions are biologically relevant since they characterize NPs that, in turn, controls the efficiency of drug delivery.
To fulfill this gap, here we present an ICS-based method that arises from Spatio Temporal Image Correlation Spectroscopy (STICS) and image Mean Square Displacement (iMSD) and provides a degree of spatial symmetry. Specifically, we decoupled the average flow vector from the strength of the driving speed. These aspects become relevant whether a velocity map at the intracellular level is computed or the chemical and biological interactions at the nanoscale are investigated. Furthermore, the obtained results can be coupled to information arising from pair correlation-based techniques [21], that do not require spatial averaging, but detect boundaries of confinement zones and barriers to flow. We found that this extension of the correlation analysis over a 3-dimensional domain allows a correct NP’s motion characterization for low values of flow speed, under specific conditions of symmetry. This was an unexpected result, since in these regimes of NPs speed and motion symmetry, application of STICS-based techniques does result in incorrect categorization of the NPs mode of motion, leading to misleading interpretations. We mainly focused on the analytical method, which has been validated by numeric simulations illustrating and supporting our basic assumptions. Finally, a specific example of application is given. It involves the analysis of cationic lipid/DNA nanoparticles (lipoplexes) in Chinese Hamster Ovary cells. To date, lipoplexes are considered to be the most promising class of organic nanoparticles for a wide variety of both in vitro and in vivo applications (e.g. cell transfection, gene silencing, gene therapy etc.). Therefore, a deeper insight on the intracellular dynamics of lipoplexes shall have a profound impact for the development of further lipid-based gene delivery materials.
2. Material and methods
2.1. Preparation of complexes and confocal microscopy experiments
The cationic lipid 3β-[N-(N,N-dimethylaminoethane)-carbamoyl]-cholesterol (DC-Chol) and the zwitterionic helper lipid dioleoylphosphatidylethanolamine (DOPE) were purchased from Avanti Polar Lipids (Alabaster, AL) and used without further purification. For the preparation of cationic liposomes, the binary lipid mixtures were first dissolved in chloroform and subsequently left to evaporate under vacuum for at least 24 h. The obtained lipid films were then hydrated with Nanopure water until a final concentration of 1 mg/ml. Sonication to clarity was needed to obtain unilamellar cationic liposomes. In order to form binary liposome/DNA complexes, 100 μl of phosphate buffered saline (PBS) were added to a 5 μl dispersion containing binary liposomes. The same amount of buffer was added to 1 μl of plasmid DNA (pDNA). The solutions were subsequently left to equilibrate for a few minutes. Then, the pDNA solution was poured in the liposome dispersion and after 20 minutes the complexes were ready to use. CHO-K1 cells were purchased from American Type Culture Collection (CCL-61 ATCC) and were grown in Hams F12K medium supplemented with 10% of Fetal Bovine Serum (FBS) at 37°C and in 5% CO2. Confocal microscopy experiments were carried out using a Fluoview FV-1000 (Olympus, Tokyo, Japan) microscope, provided with a 543 nm HeNe laser, as excitation source. Data were collected at 37°C and were controlled by a proper acquisition software (FV10-ASW, Olympus, Tokyo, Japan). The experimental parameters have been chosen in order to explore the slow dynamics of liposome/DNA complexes in living cells. In detail, pixel size was set equal to 0.295 μm/pixel, pixel dwell time was equal to 10 μs/pixel, the distance in time between two subsequent frames was set equal to 5 s and takes into account the delay time arising from the scanner motion. Preliminary checks were carried out to evaluate the effect of non-moving particles. Immobile-population corrections have been carried out by adopting a custom made algorithm acting on the direct space of the acquired images. For the investigated systems, correlation analyses on filtered and not filtered images lead to identical results. Thus, it was not necessary to implement this kind of correction on the acquired movies. On the other hand a Fourier-filtering procedure introduced artifacts in the analyses. More precisely, the correlation Gaussian were found reduced in width and accompanied by two diametrically opposed depressions aligned with the flow direction. This behavior is expected when particles do not move more than a correlation radius over the time of acquisition of the entire image-series[1].
2.2. Numeric simulations and data analysis
In silico validations have been carried out by simulating image-stacks with tunable dynamic parameters (i.e. diffusion coefficient and strength, direction and angular distribution of flow speed), total length, number and size of spot-like nanoparticles. First, a set of single particle tracks was generated according to the dynamic input arguments. Then, the trajectories were randomly distributed over a square domain, which corresponds to the image matrix. Finally, the obtained template was used to locate the Gaussian spots, frame by frame. All simulations and data analyses were performed off-line using a commercial software package (MATLAB 7.13, The MathWorks Inc., Natick, MA, 2011).
3. Theory
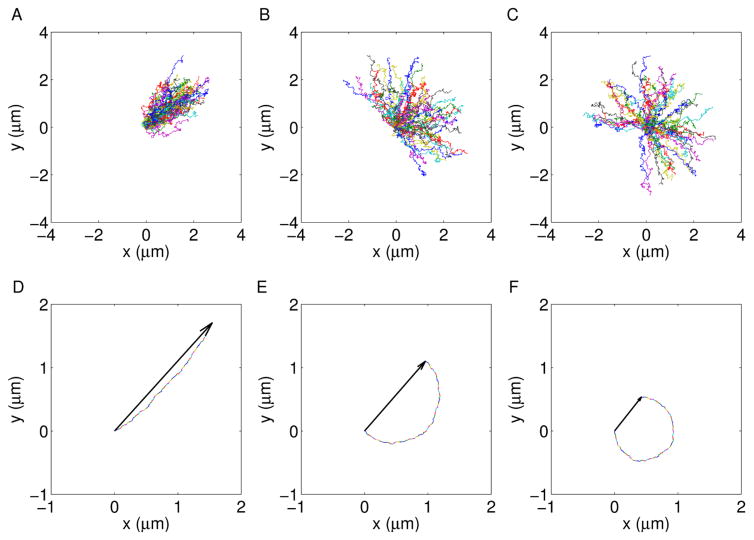
The proposed model describes the effects of nanoparticle-cytoskeleton interactions as directed motions along manifold directions in a two-dimensional space. Due to the slow dynamics of interest, the approximation of a two-dimensional motion is often adopted to study the intracellular trafficking on nanoparticles. Of note, this approximation can be used only when particles do not move out of focus during the entire acquisition period. 3D investigation goes beyond the scope of the present work and will be addressed elsewhere. In a two-dimensional space, ordered fluxes of particles can be characterized by an average direction and an angular spread with respect to it. More precisely, we consider that the cytoplasmatic diffusive dynamics is affected by a driving speed of modulus v, uniformly distributed around a fixed direction ϕ0 within an angular range ψ (Fig. 1). In other words, the particle speed is spatially distributed as follows:
| (1) |
Figure 1.
(A, B, C) Sets of 50 tracks and (D, E, F) corresponding average displacements from the origin, for dynamics driven by Brownian diffusion + uniformly distributed flow motion (D = 0.75 10−3 μm2 s−1; v = 1.5 10−2 μm s−1; ϕ0 = π/4 and ψA = π/6, ψB = π, ψC = 3π/2).
The square modulus of the driving speed is supposed to be constant and it can be expressed as
| (2) |
where v⃗ϕ is the vectorial average evaluated over the ensemble
| (3) |
and vσ represents the orthogonal component, of square modulus
| (4) |
More details are given in the Supplementary material. Finally, the following adimensional parameters can be defined and related to statistical moments of first and second order:
| (5) |
| (6) |
These parameters quantify the relative weights of the speed’s components and verify the following relationship:
| (7) |
and arise from the ensemble of single particle behaviours and can be experimentally revealed as decoupled contributions to the spatiotemporal correlation function.
Image Correlation Spectroscopy (ICS)-based techniques focus on the correlation of fluorescence fluctuations, which are computed from the intensities recorded in the image time-series, pixel by pixel, frame by frame. In detail, a generalized spatiotemporal intensity fluctuation correlation function can be defined as
| (8) |
where ξ, η and τ represent two spatial and a temporal lag variables, respectively and δi(x, y, t) is the intensity fluctuation at pixel position (x, y) and time t, i.e. δi(x, y, t) = i(x, y, t)–〈i(x, y)〉t [1]. g(ξ, η, τ) is typically calculated by Fourier methods and fit to standard Gaussian functions. The spatial correlation at frame k can be evaluated from Eq. 8 by imposing a zero time-lag and can be fitted as follows:
| (9) |
Where G0(k), G∞(k) and ωk are scale factor, offset and variance of the fitting 2-dimensional Gaussian surface. Similarly, the temporal correlation function is defined by evaluating the generalized correlation function at zero spatial-lag and can be fitted by the following curve:
| (10) |
where τd = ω/(4D) and τf = ω/v represent the characteristic diffusion decay time and flow time, respectively [1]. ω is the mean correlation radius, obtained by averaging the ωk-values, which have been measured by fitting Eq. 9 for every image in the stack. Particles undergoing Brownian diffusion tend to exit the correlation area in a symmetric fashion, thus broadening the Gaussian surface in any direction [7]: the peak is then centered at (ξ0, η0) = (0, 0) and its value decreases with time. Flow motion adds a drift contribution, leading to a peak’s shift in the opposite direction of particle motion, i.e. ϕ = ϕ0 + π. However, the fitting procedure on the temporal correlation function alone (Eq. 10) is directionally blind to the flow speed v⃗. Conversely, its extension over a spatiotemporal domain only measures the net resultant directed component [1]. Therefore, further arguments are needed to explore dynamics driven by spatially distributed flow terms.
In order to decouple the flow’s effects on the correlation function and take into account the symmetry properties arising from the angular distribution of the driving speed, we adopted and extended the image-Mean Square Displacement (iMSD) method. The theory of iMSD has been developed and validated for Brownian and confined diffusions to describe the protein lateral motion in cell membranes[2]. The theory starts from the following expression of g(ξ, η, τ):
| (11) |
where g0 defines the contrast of fluctuation and is related to the average number of particles in the observation volume, W(ξ, η) is known as the instrument Point Spread Function (PSF) and p(ξ, η, τ) is the probability function describing the dispersive dynamics. Its expression is strictly related to the single particle’s transition probability P(r⃗′| r⃗, τ), i.e. the probability that a particle originally at r⃗, will be at r⃗′ after a time period τ. For Brownian diffusion + directed motion it reads [14, 22]
| (12) |
The spatiotemporal correlation gives overall information about the entire set of the investigated particles. Thus, an ensemble average of the single particle behaviors should be carried out to take into account the spatial distribution of velocities. Under the considered conditions it can be expressed as
| (13) |
where G∞ is a constant offset value, G1(τ ) is a scale factor and the brackets represent an average over the set of particles, thus an angular average of the single particle contributions. Its expression can be analytically obtained for ψ = 2π. At short timescale, e.g. for τ ≪ τf (further details can be found in the Supplementary material) it can be approximated by a Gaussian function, whose variance quadratically increases in time. Its generalization for arbitrary ψ-value leads to the following expression:
| (14) |
where the numerator describes the net directed component and the variance reads
| (15) |
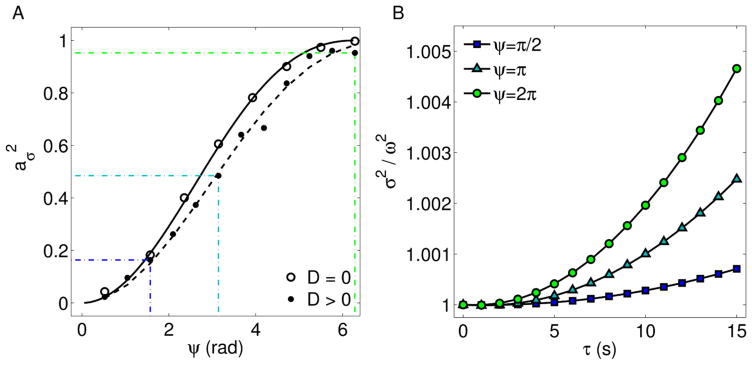
Beyond the short timescale, an angular spread becomes manifest, the correlation function can not be approximated by a Gaussian function and the angular distribution of the velocity may introduce some non-linearities in the peak shift. This trend has been recently detected through transport-intermittent models to study motion of nanoparticles within intricate networks of active filaments [23]. However, at short timescale, the motion characterization can be carried out by fitting separately the peak’s position and the Gaussian variance, in order to measure D, v, v⃗ϕ = 〈v⃗〉 and . The latter parameters depend on the angular dispersion ψ (Fig. 2), since ψ defines the system’s geometrical properties. In other word, for ψ = 2π each single particle’s drift along a direction is balanced by the opposite one, thus displacements of particles from their starting positions are symmetrically distributed with respect to the origin. Hence aϕ = 0 and vσ = v. When 0 < ψ < 2π, a flow direction characterizes the dynamics and therefore a degree of anisotropy is introduced. The net flow strength and direction can be quantified by v⃗ϕ and the dispersion along the orthogonal direction can be measured by . Finally, when ψ = 0, the flow is directed along a single direction, the Gaussian variance has not a quadratic term and the peak’s shift uniquely quantifies the velocity of particles.
Figure 2.
(A) as function of ψ for strongly directed motion and diffusive + flow motion (D = 0.75 10−3 μm2 s−1; v = 0.5 10−2 μm s−1). The solid line represents the expected curve obtained from Eq. 15, the dashed lines takes into account the Brownian diffusion. (B) Corresponding Gaussian variance for three different ψ-values.
In conclusion, the flow speed can be viewed as composed by two complementary terms, i.e. and , which can be related to the angular spread ψ by evaluating average and variance of the distribution 1. More precisely,
| (16) |
thus
| (17) |
and can be obtained as . At a fixed square modulus of the driving speed, the parabolic contribution to the Gaussian variance is proportional to (Fig. 2). Incidentally, the effect of the Brownian diffusion over the measured parameters is a deviation from the functional relationship 17. The deviation is such that aϕ follows the trend of a specific single track asphericity. This is evaluated over the trajectory which is obtained by translating all the tracks of the ensemble, one after the other. The asphericity is an ensemble’s parameter arising from single particle analyses, it is defined from the gyration tensor of the particle trajectories [24, 25] and quantifies the mean square displacement of the particle positions along two orthogonal directions.
4. Results and discussion
4.1. Dynamic parameters and speed’s spatial distribution
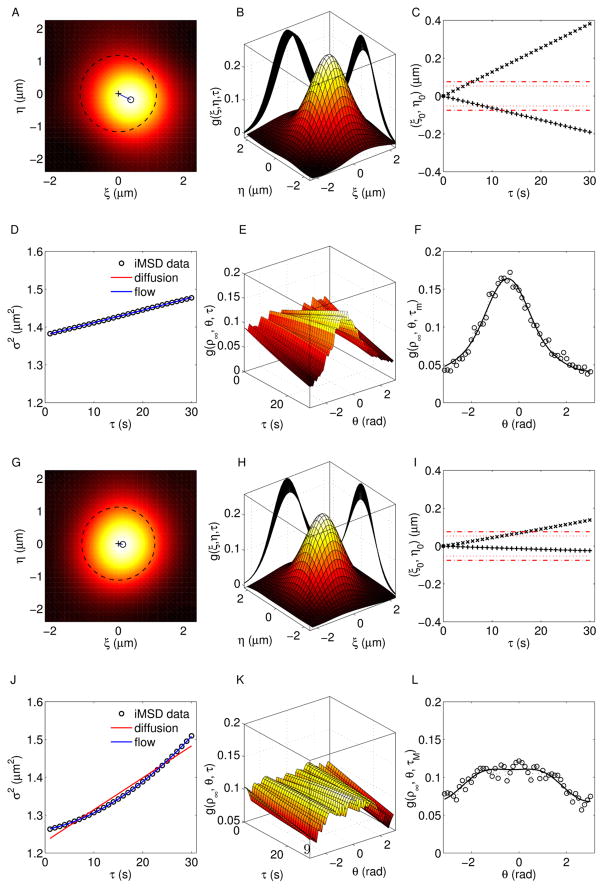
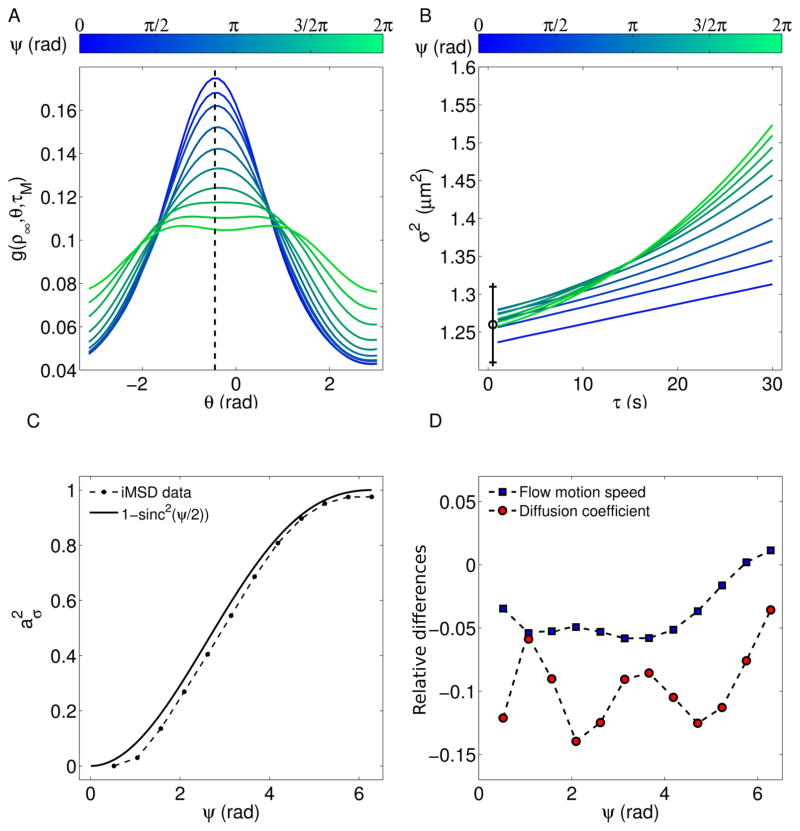
In order to validate the proposed method, tests on numerical simulation have been carried out. In this section we present some representative examples mimicking the dynamics of nanoparticle inside the cytoplasm. They consist on image-stacks of length N = 300 frames, size 256×256 pixels, containing M = 50 spots undergoing Brownian diffusion (D = 0.75 10−3 μm2 s−1) + flow motion (v = 1.5 10−2 μm s−1) and different angular dispersion (Fig 3). For low ψ-values (e.g. ψ = π/4, top panels) the shift of the fitting surface is manifest and it can be measured through the centroid’s position (ξ0(τ ), η0(τ )) (Fig. 3C). Conversely, the parabolic contribution of the Gaussian variance is very small (Fig. 3D). Finally, the autocorrelation function can be evaluated along a circumference of arbitrary radius ρ∞ (dashed line in Fig. 3A). This circular section (i.e. g(ρ∞, θ, τ)) is related to the angular distribution of the flow speed, presents a peak centered at θ = ϕ and it is sharper for decreasing values of ψ. On the other side, high ψ-values (e.g. ψ = 3π/2) yield lower shifts of the correlation function, corresponding to flatter angular distribution and remarkable quadratic contribution to the time evolution of σ2 (Fig. 3, bottom panels). The intermediate conditions can be explored by varying ψ (Fig. 4). As expected, high drift contribution corresponds to low quadratic terms in the variance curve, which approaches to linear trends for ψ → 0. On the other end, increasing ψ yields lower shifts and higher parabolic terms. Furthermore, g(ρ∞, θ, τ)) is centered at ϕ and the intercept of σ2(τ) is equal to ω2, for any ψ-value. Finally, we measured the parameter , the diffusion coefficient D and the flow speed v, as functions of ψ. A slight underestimation of with respect to the ideal curve (D = 0) has been found. This trend is confirmed by the obtained values of the dynamic parameters, whose percentage deviations with respect to the input arguments are lower than 15% for D and 5% for v. This underestimation is ascribable to the basic assumptions of the proposed method, i.e. the Gaussian approximation which has been adopted to describe a more general and complex problem (Supplementary material).
Figure 3.
iMSD analysis of two representative conditions with same dynamic parameters (D = 0.75 10−3 μm2 s−1; v = 1.5 10−2 μm s−1; ϕ = −π/6) and different angular dispersions ψ1 = π/4 (top panels), ψ2 = 3π/2 (bottom panels). (A, G) Top view and (B, H) 3D view of the correlation function, (C, I) peak’s position as function of time (”×” for ξ0(τ), ”+” for η0(τ)), (D, J) time evolution of σ2 from τ = 0 to τ = τm = 30 s and (E, F, K, L) circular sections g(ρ∞, θ, τ), g(ρ∞, θ, τm) for ρ∞ = ω.
Figure 4.
(A) Circular section of the correlation function at ρ∞ = ω, τ = τm, for dynamics driven by same flow speed v and different angular dispersions ψ. Remarkable drift’s effects are manifest for low ψ-values. (B) Corresponding time evolution of σ2, The parabolic contribution increases with ψ, complementarily to the peak’s shift. The black error bar shows the square correlation radius, obtained through Eq. 9. (C) output values of and (D) relative differences from the input values of the dynamic parameters, as functions of ψ. Input arguments: D = 0.75 10−3 μm2 s−1; v = 1.5 10−2 μm s−1; ϕ = −π/6.
4.2. Detection of low-speed flow motion
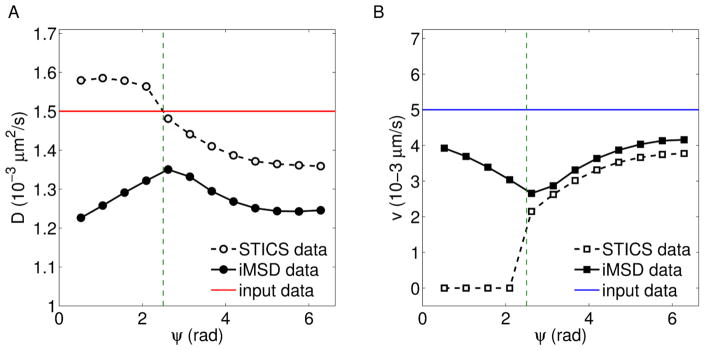
The lowest value of flow speed, which can be detected at a given diffusion coefficient, depends on the experimental set up (through ω, pixel size and total period of acquisition) and on the system itself (through D, v and ψ). As an instance, particles directed with small angular dispersion and low flow speed (with respect to the diffusion coefficient) yield a detectable drift at high τ, which can be out of the measurement range. Instead, if the symmetric contribution is dominant, the measurement of v is based on the parabolic term of σ2, which can be imperceptible within the observation time scale at a given ω. Under low-speed conditions, i.e. for τf ≫ τd, the analysis of the correlation function over the (ξ, η)-plane improves the STICS motion characterization. Indeed, finite values of ω can yield a negligible flow contribution to g(0, 0, τ), whose trend results indistinguishable from the diffusive one. On the other side, the iMSD approach detects flow effects on the Gaussian variance or the peak’s shift. Here we present a representative example Fig. (5), obtained by simulating dynamics mainly governed by Brownian diffusion and affected by a small speed term, for different angular dispersions. The focus is on the comparison of STICS and iMSD analyses under the same experimental and dynamic conditions. In the considered case, it is found that there exists a maximum critical angle ψc, such that STICS does not distinguish flow terms for ψ <ψc. However, the characterization of motion is successfully carried out trough iMSD, which discriminates the kind of dynamics for any ψ, even if the measured parameters are underestimated. The value of ψc can not be considered as a universal parameter, since it depends on the experimental setup (through ω, time lapse, maximum correlation period, pixel size) and the dynamics itself. Of note, no thresholds are needed to carry out the analysis. More precisely, all the diffusive trends are included in the general forms of the functional relationships and can be obtained from them if v → 0. The fitting computation is carried out through the general forms 10, 15 and yields redundant flow terms if the dynamic is driven only by diffusion. In other words, the obtained v-values are close to 0 and the fitting error δ(v) are very high, thus resulting in δ(v)/v →∞. Instead, dynamics governed by Brownian diffusion + flow motion present finite values of v, δ(v)/v and higher fitting determination coefficient R2, with respect to the simple diffusive models.
Figure 5.
Output values of (A) diffusion coefficient and (B) flow speed as functions of ψ, obtained from STICS and iMSD. The vertical lines individuate ψc, the input parameters are shown as horizontal red and blue lines, respectively for D = 1.5 10−3 μm2 s−1 and v = 0.5 10−2 μm s−1.
The detection limits are therefore dictated only by the adopted experimental conditions and the investigated system. Indeed, the spatial average involved in the correlation ultimately determines the spatial resolution of the method and the minimum time delay of the experimental apparatus determines the behavior at very short time. Furthermore, the ability in discriminating Brownian diffusions from flows involves the correlation radius, which is related to the geometry of laser beam and the finite dimensions of spots. Therefore, although the discussion has been focused on slow dynamics mimicking the cytoplasmatic trafficking of nanoparticles, other biophysical systems can be studied through the proposed approach, with a preliminary optimization of the experimental and analytical parameters (i.e. minimum time delay, total length of image-stacks, maximum time-lag for correlation, pixel size, extension of the fitting domain).
4.3. Background’s effects
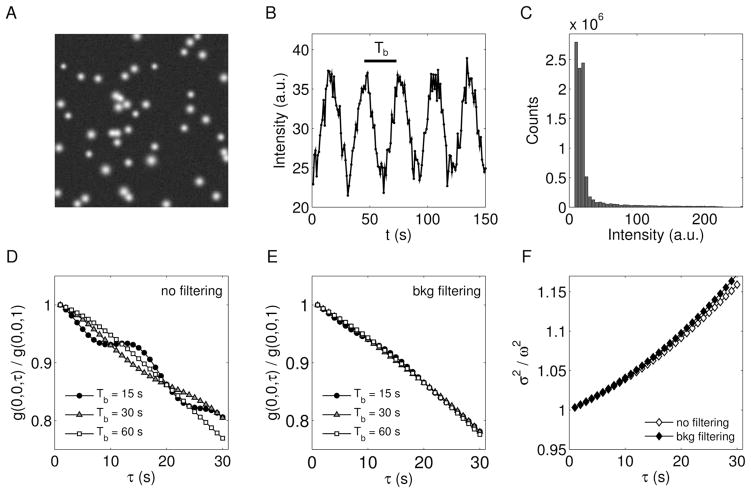
In the experiments the spatiotemporal correlation function is generally affected by changes of the overall background within the region of calculation, in which case it is difficult to discriminate the contribution of particles. Here, we discuss the effects of slowly changing background on the measurement of the dynamic parameters. This argument is based on the analyses of simulations and the comparison of results obtained from STICS and iMSD approaches. In order to mimic the actual conditions of acquisition, a Gaussian noise of tunable strength and a sinusoid function of random phase and temporal period Tb are added to the simulated signals, pixel by pixel. Thus, the resulting image-stack contains moving spots over a varying background (Fig. 6 panels A and B). The proportion between the intensities of spots and background defines the signal-to-noise ratio and STICS iMSD the intensity distribution quantifies the number of pixels with intensity within the range (i, i+Δi). Common procedures of background removal act on the intensity distribution (Fig. 6C) and filter the signals which overcome a tunable threshold value. More precisely, zero intensity values were assigned to pixels whose intensity do not overcame a certain tunable threshold. The threshold was properly set in order to efficiently remove the background without remarkably affect the tails of the spot-like particles. The temporal correlation function is affected by the background (Fig. 6D), since it varies over times and modulates the correlation at zero spatial-lag. The oscillations of g(0, 0, τ) depend on Tb and alter the measurements of the dynamic parameters. However, the effect is reduced when the background is removed from the original image-stack (Fig. 6E). On the other side, the background changes with no spatial periodicity and its fluctuation weakly affects the correlation over the entire (ξ, η)-plane. Subsequently, the peak’s shift (not shown) and the time evolution of the Gaussian variance (Fig. 6F) provide better estimations of the dynamic parameters. Of note, the background removal is necessary to the STICS analysis (further details are given in Supplementary material), but slightly improves iMSD measurements. Thus, the iMSD method is more stable and less sensitive to slowly changing background and its fluctuations. As an instance, we found this general trend for different value of Tb, at a fixed signal-to-noise ratio of SNR=8.5. Tab. 1 shows the results obtained through STICS and iMSD analyses on filtered images. The dynamics is driven by D = 10−3 μm2s−1, v = 1.5 10−2 μm s−1, at an angular dispersion ψ = π.
Figure 6.
(A) First frame of a simulated image-stack affected by slowly changing background. (B) Background intensity as a function of time: a Gaussian noise is added to a modulating sinusoid function of period Tb. (C) Intensity distribution over the image-stack, adopted to set the background filter. (D) Effects of background on the temporal correlation function and (E) corresponding curves after the filtering procedure. (F) Background’s effect on the Gaussian variance (Tb = 30 s). The presented dynamics is characterized by the following input parameters: D = 10−3 μm2 s−1; v = 1.5 10−2 μm s−1; ψ = π; ϕ = π/6.
Table 1.
Results of STICS and iMSD analyses after the background removal. Results are shown as percentage differences from the input data.
| Tb(s) | STICS | iMSD | ||
|---|---|---|---|---|
| ΔD (%) | Δv (%) | ΔD (%) | Δv (%) | |
| 1 | 17.7 | −8.18 | −6.80 | −7.75 |
| 5 | 47.2 | 11.1 | −6.89 | −7.75 |
| 10 | 39.8 | −2.75 | −6.91 | −7.75 |
| 15 | 37.0 | −11.9 | −6.60 | −7.81 |
| 20 | 20.4 | −7.93 | −9.21 | −7.75 |
| 30 | 71.3 | −17.0 | −6.12 | −7.81 |
| 60 | 55.1 | −2.43 | −6.10 | −6.07 |
4.4. Velocity map of lipid-based nanocarriers in living cells
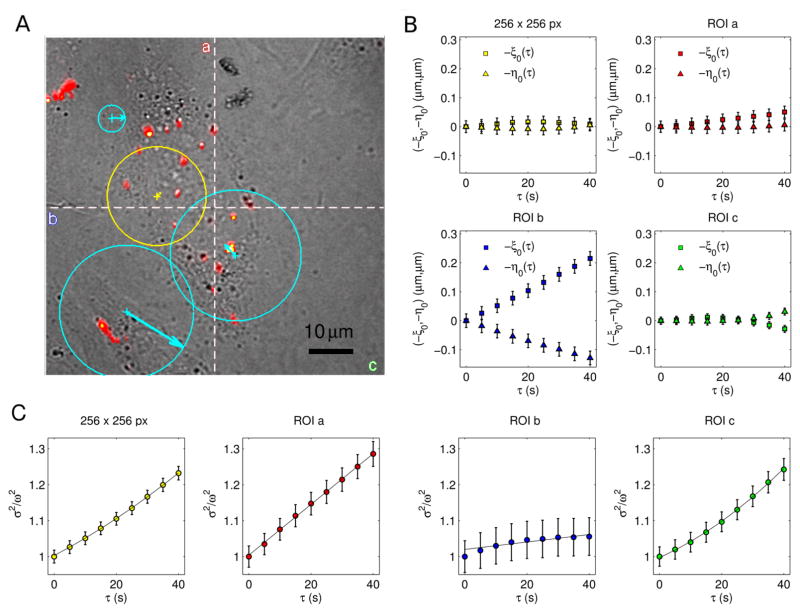
As an example of application of the proposed method, we present the analysis of an image-stack exploring the intracellular dynamics of lipid/DNA complexes in Chinese Hamster Ovary (CHO) cells (Fig. 7A). In the proposed example, the pixel size is equal to 0.295 μm and the frame acquisition time is Δt = 5s (due to the slow dynamics of the complexes). The computation of the correlation function and the characterization of motion were carried out over the entire 256 × 256 pixels image and on three regions of interest (ROIs) of 128 × 128 pixels (Fig. 7B), without implementing corrections for non-moving particles (further details are given in ”Materials and methods”). The speed’s contributions (vϕ and vσ) are independently calculated by fitting the peak’s shift (ξ0(τ ), η0(τ )) and the Gaussian variance σ2 (Fig. 7 panels C, D). Thus, a velocity map is obtained, in terms of speed modulus (〈| v⃗|〉) and average drift (v⃗ϕ = 〈v⃗〉). The analysis over the 256 × 256 pixels image does not reveal a peak’s shift ( ), but detects a parabolic trend of σ2. Therefore, the dynamics is characterized by flowing particles with symmetrically distributed velocities and both the diffusion coefficient and the flow speed are measured by fitting σ2(τ ). Conversely, uniform motions of the correlation peaks are detected for ROI a and ROI b. However, no quadratic terms affect the Gaussian variances, thus resulting in . The corresponding dynamics are governed by Brownian diffusion + flow motion with negligible angular dispersion and differ for the values of D and v (Tab. 2). ROI c represents an intermediate condition: a small drift and a remarkable quadratic term are detected. Subsequently, both the anisotropic and the symmetric contributions are included to characterize the motion and measure the dynamic parameters. Tab. 2 summarizes the results. Incidentally, the information arising from the decoupled flow terms provides a deeper understanding, which can not be in general obtained by the STICS method. Furthermore, the iMSD approach is closer to the single particle analyses, since it explores both the strength of the dynamic parameters and the geometrical features of the investigated systems.
Figure 7.
(A) fluorescence-labeled cationic liposomes/DNA complexes in CHO cells. (B) Velocity maps over the entire image (yellow) and on single ROIs (cyan). The arrows indicate direction and modulus of the drift’s speed v⃗ϕ and the circumferences have radius proportional to the speed modulus v. Origin of flow vectors are placed on the corresponding image center of mass. iMSD results are reported as peak’s shift (C) and time evolution of Gaussian variance (D). Both anisotropic and symmetric terms contribute to the characterization of motion.
Table 2.
Measurement of the dynamic parameters which define the velocity map of the presented example.
| D (10−3μm2s−1) | v (10−3μm s−1) | ϕ0 (rad) | (a.u.) | |
|---|---|---|---|---|
| 256×256 pixels | 1.06 ± 0.16 | 4.64 ± 0.15 | - | 1.00 |
| ROI a | 1.05 ± 0.23 | 1.27 ± 0.04 | 0.10 | 0.00 |
| ROI b | 0.60 ± 0.26 | 6.30 ± 0.11 | −0.55 | 0.00 |
| ROI c | 1.16 ± 0.11 | 6.86 ± 0.37 | 2.36 | 0.89 |
5. Conclusions
Through Image Correlation Spectroscopy, dynamic information about the investigated systems can be obtained by directly analyzing image time series and without exploring single particle behaviors. Diffusion coefficients and flow speeds are measured by fitting procedure, acting on the spatiotemporal correlation function and defined over a domain which is included in the 3-dimensional lag-variable space. The iMSD approach allowed us to determine the system’s dynamic parameters and recover geometrical features about particles undergoing Brownian diffusion and flow motion, uniformly distributed within an angular range. This condition is a good approximation of the intracellular dynamics of gene delivery vectors, which generally diffuse in the cytoplasm and can be directed along microtubules, i.e. along manifold and different directions. By decoupling the speed spatial distribution’s effects on the detected intensity fluctuations, symmetry properties and average particle drift can be evaluated. These are strictly interconnected and represent the global information arising from the motion of single particles. More precisely, if we are interested on the average particle behavior (e.g. to compute a velocity map), only the peak’s drift should be take into account. Instead, biochemical properties which are responsible for the flow motion (e.g. the nanoparticle chemical affinity with the cytoskeleton), do not depend on specific directions and can be studied through the modulus of the flow speed. Furthermore, this method improves the motion characterization, especially when the diffusive contribution is dominant with respect to the flow. Indeed, when compared to the STICS approach, the study of the correlation function over the entire spatial lag-variable domain better characterize low-speed flow motion (under reasonable experimental conditions). Finally, stability in the measurement procedure and low sensitivity to slowly changing background have been demonstrated, resulting in good discrimination of the contribution of particles under realistic experimental conditions.
Supplementary Material
Acknowledgments
Dr. Daniela Pozzi is gratefully acknowledged for performing confocal microscopy experiments. Reviewers are sincerely acknowledged for their useful inputs that allowed the authors to improve the manuscript.
References
- 1.Hebert B, Costantino S, Wiseman PW. Spatiotemporal image correlation spectroscopy (stics) theory, verification, and application to protein velocity mapping in living cho cells. Biophys J. 2005;88:3601–3614. doi: 10.1529/biophysj.104.054874. [DOI] [PMC free article] [PubMed] [Google Scholar]
- 2.Di Rienzo C, Piazza V, Gratton E, Beltram F, Cardarelli F. Probing short-range protein brownian motion in the cytoplasm of living cells. Nat Commun. 2014:5. doi: 10.1038/ncomms6891. [DOI] [PMC free article] [PubMed] [Google Scholar]
- 3.Keating E, Nohe A, Petersen NO. Studies of distribution, location and dynamic properties of egfr on the cell surface measured by image correlation spectroscopy. Eur Biophys J. 2008;37:469–481. doi: 10.1007/s00249-007-0239-y. [DOI] [PubMed] [Google Scholar]
- 4.Brown CM, Petersen NO. An image correlation analysis of the distribution of clathrin associated adaptor protein (ap-2) at the plasma membrane. J Cell Sci. 1998;111:271–281. doi: 10.1242/jcs.111.2.271. [DOI] [PubMed] [Google Scholar]
- 5.Kogure T, Karasawa S, Araki T, Saito K, Kinjo M, Miyawaki A. A fluorescent variant of a protein from the stony coral montipora facilitates dual-color single-laser fluorescence cross-correlation spectroscopy. Nat Biotechnol. 2006;24:577–581. doi: 10.1038/nbt1207. [DOI] [PubMed] [Google Scholar]
- 6.Chiantia S, Ries J, Schwille P. Fluorescence correlation spectroscopy in membrane structure elucidation. Biochim Biophys Acta-Biomembranes. 2009;1788:225–233. doi: 10.1016/j.bbamem.2008.08.013. [DOI] [PubMed] [Google Scholar]
- 7.Coppola S, Pozzi D, De Sanctis SC, Digman M, Gratton E, Caracciolo G. Quantitative measurement of intracellular transport of nanocarriers by spatio-temporal image correlation spectroscopy. Methods Appl Fluoresc. 2013;1:015005. doi: 10.1088/2050-6120/1/1/015005. [DOI] [PMC free article] [PubMed] [Google Scholar]
- 8.Coppola S, Caracciolo G, Schmidt T. Exact occupation probabilities for intermittent transport and application to image correlation spectroscopy. New J Phys. 2014;16:113057. [Google Scholar]
- 9.Kulkarni RP, Wu DD, Davis ME, Fraser SE. Quantitating intracellular transport of polyplexes by spatio-temporal image correlation spectroscopy. Proc Natl Acad Sci USA. 2005;102:7523–7528. doi: 10.1073/pnas.0501950102. [DOI] [PMC free article] [PubMed] [Google Scholar]
- 10.Zagato E, Forier K, Martens T, Neyts K, Demeester J, Smedt SD, Remaut K, Braeckmans K. Single-particle tracking for studying nanomaterial dynamics: applications and fundamentals in drug delivery. Nanomedicine. 2014;9:913–927. doi: 10.2217/nnm.14.43. [DOI] [PubMed] [Google Scholar]
- 11.Remaut K, Oorschot V, Braeckmans K, Klumperman J, De Smedt SC. Lysosomal capturing of cytoplasmic injected nanoparticles by autophagy: An additional barrier to non viral gene delivery. J Control Release. 2014;195:29–36. doi: 10.1016/j.jconrel.2014.08.002. [DOI] [PubMed] [Google Scholar]
- 12.Sauer A, De Bruin K, Ruthardt N, Mykhaylyk O, Plank C, Bräuchle C. Dynamics of magnetic lipoplexes studied by single particle tracking in living cells. J Control Release. 2009;137:136–145. doi: 10.1016/j.jconrel.2009.04.003. [DOI] [PubMed] [Google Scholar]
- 13.Akita H, Enoto K, Masuda T, Mizuguchi H, Tani T, Harashima H. Particle tracking of intracellular trafficking of octaarginine-modified liposomes: a comparative study with adenovirus. Mol Ther. 2010;18:955–964. doi: 10.1038/mt.2010.33. [DOI] [PMC free article] [PubMed] [Google Scholar]
- 14.Qian H, Sheetz MP, Elson EL. Single particle tracking. analysis of diffusion and flow in two-dimensional systems. Biophys J. 1991;60:910. doi: 10.1016/S0006-3495(91)82125-7. [DOI] [PMC free article] [PubMed] [Google Scholar]
- 15.Michalet X. Mean square displacement analysis of single-particle trajectories with localization error: Brownian motion in an isotropic medium. Phys Rev E. 2010;82:041914. doi: 10.1103/PhysRevE.82.041914. [DOI] [PMC free article] [PubMed] [Google Scholar]
- 16.Elson EL, Magde D. Fluorescence correlation spectroscopy. i. conceptual basis and theory. Biopolymers. 1974;13:1–27. doi: 10.1002/bip.1974.360130103. [DOI] [PubMed] [Google Scholar]
- 17.J. D. C. J. Colin E. Webb. Handbook of laser technology and applications, volume 3: application. Philadelphia: Institute of Physics; 2004. [Google Scholar]
- 18.Rossow MJ, Sasaki JM, Digman MA, Gratton E. Raster image correlation spectroscopy in live cells. Nat Protoc. 2010;5:1761–1774. doi: 10.1038/nprot.2010.122. [DOI] [PMC free article] [PubMed] [Google Scholar]
- 19.Potvin-Trottier L, Chen L, Horwitz AR, Wiseman PW. A nu-space for image correlation spectroscopy: characterization and application to measure protein transport in live cells. New J Phys. 2013;15:085006. doi: 10.1088/1367-2630/15/8/085006. [DOI] [PMC free article] [PubMed] [Google Scholar]
- 20.Semrau S, Schmidt T. Particle image correlation spectroscopy (pics): retrieving nanometer-scale correlations from high-density single-molecule position data. Biophys J. 2007;92:613–621. doi: 10.1529/biophysj.106.092577. [DOI] [PMC free article] [PubMed] [Google Scholar]
- 21.Digman MA, Gratton E. Imaging barriers to diffusion by pair correlation functions. Biophys J. 2009;97:665–673. doi: 10.1016/j.bpj.2009.04.048. [DOI] [PMC free article] [PubMed] [Google Scholar]
- 22.Chandrasekhar S. Stochastic problems in physics and astronomy. Rev Mod Phys. 1943;15:1. [Google Scholar]
- 23.Bouzin M, Sironi L, Chirico G, DAlfonso L, Inverso D, Pallavicini P, Collini M. An intermittent model for intracellular motions of gold nanostars by k-space scattering image correlation. Biophys J. 2015;109:2246–2258. doi: 10.1016/j.bpj.2015.10.025. [DOI] [PMC free article] [PubMed] [Google Scholar]
- 24.Rudnick J, Gaspari G. The aspherity of random walks. J Phys A. 1986;19:L191. [Google Scholar]
- 25.Coppola S, Estrada LC, Digman MA, Pozzi D, Cardarelli F, Gratton E, Caracciolo G. Intracellular trafficking of cationic liposome–dna complexes in living cells. Soft matter. 2012;8:7919–7927. doi: 10.1039/C2SM25532D. [DOI] [PMC free article] [PubMed] [Google Scholar]
Associated Data
This section collects any data citations, data availability statements, or supplementary materials included in this article.


