

Abstract
The evolution of body shape is thought to be tightly coupled to changes in regulatory sequences, but specific molecular events associated with major morphological transitions in vertebrates have remained elusive. We identified snake-specific sequence changes within an otherwise highly conserved long-range limb enhancer of Sonic hedgehog (Shh). Transgenic mouse reporter assays revealed that the in vivo activity pattern of the enhancer is conserved across a wide range of vertebrates including fish, but not in snakes. Genomic substitution of the mouse enhancer with its human or fish ortholog results in normal limb development. In contrast, replacement with snake orthologs caused severe limb reduction. Synthetic restoration of a single transcription factor binding site lost in the snake lineage reinstated full in vivo function to the snake enhancer. Our results demonstrate changes in a regulatory sequence associated with a major body plan transition and highlight the role of enhancers in morphological evolution.
Keywords: Cis-regulatory element, enhancer, limb development, morphological evolution, snakes, CRISPR/Cas9, ZRS, evo-devo, Sonic hedgehog (Shh), genome editing
eTOC Blurb
Increased rate of molecular evolution and progressive loss of function for a critical limb enhancer in snakes explains morphological disappearance of limbs
Introduction
Distant-acting transcriptional enhancers are a major class of tissue-specific regulatory DNA sequences that has been implicated in morphological evolution in vertebrates (Chan et al., 2010; Cooper et al., 2014; Cretekos et al., 2008; Guenther et al., 2014; Guerreiro et al., 2013; Indjeian et al., 2016; Jones et al., 2012; Lopez-Rios et al., 2014; McLean et al., 2011; Prabhakar et al., 2008). Sequence changes in enhancers are hypothesized to be a main driver of changes in body shape (Britten and Davidson, 1969; Carroll, 2008; King and Wilson, 1975; Wray, 2007), but many aspects of this complex interplay between molecular changes in regulatory sequences and morphological adaptations across the vertebrate tree remain the subject of considerable debate (Hoekstra, 2012; Wittkopp and Kalay, 2012; Wray, 2007).
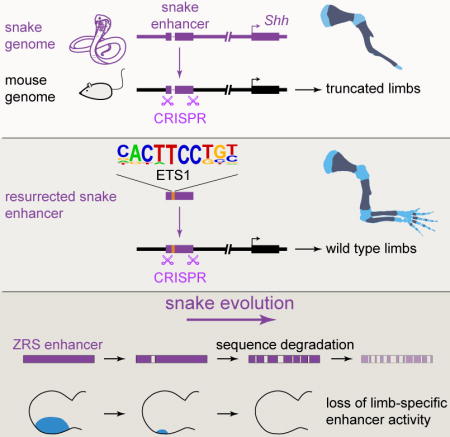
In the present study we utilized a series of recently sequenced snake genomes to study the molecular and functional evolution of a critical limb enhancer in snakes and examine its possible role in limb loss. Our analysis focuses on one of the best-studied vertebrate enhancers, the Zone of Polarizing Activity [ZPA] Regulatory Sequence (ZRS, also known as MFCS1) (Lettice et al., 2003; 2008; 2014; 2012; Sagai et al., 2005; 2004; Zeller and Zuniga, 2007). The ZRS is a limb-specific enhancer of the Sonic hedgehog (Shh) gene that is located at the extreme distance of nearly one million base pairs from its target promoter. During limb development, the enhancer is active in the posterior limb bud mesenchyme (Figure 1A), where its activity is critically required for normal limb development in mouse (Sagai et al., 2005). Single nucleotide mutations within the ZRS cause limb malformations, such as preaxial polydactyly, in multiple vertebrate species including humans (Hill and Lettice, 2013; Lettice et al., 2003; 2008; VanderMeer and Ahituv, 2011). Surprisingly, we observed that the sequence of this limb enhancer is conserved throughout nearly all examined species in the snake lineage. In basal snakes, which retain vestigial limbs, it is highly conserved, whereas it underwent a rapid increase in substitution rate in advanced snakes, in which all skeletal limb structures have disappeared. Consistent with this, we provide evidence that the snake enhancer progressively lost its in vivo function as the body plan evolved from basal to advanced snakes. Finally, we identify a specific subset of nucleotide changes within the enhancer that contribute to its functional degeneration in snakes and show in a mouse model that synthetic reversion of just one degraded transcription factor binding site is sufficient to recreate the ancestral function and to rescue normal limb formation in vivo.
Figure 1. Evolution of a limb enhancer across the vertebrate tree.
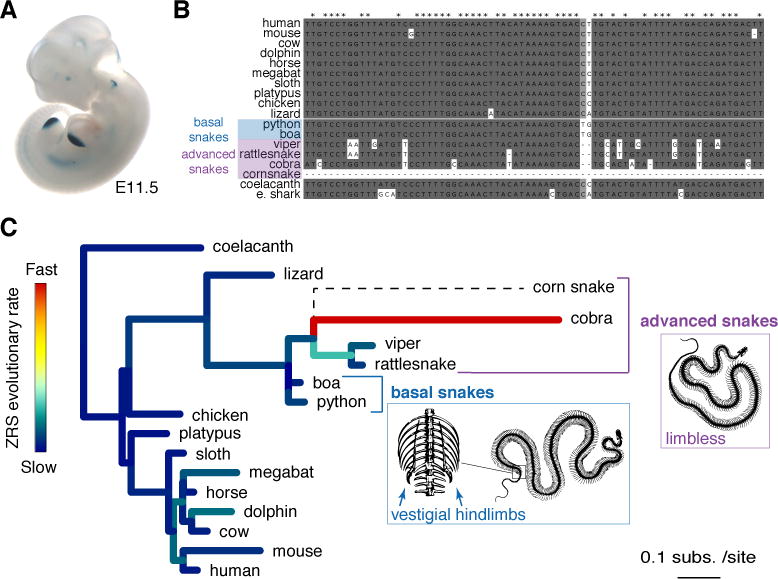
(A) Human ZRS enhancer activity in a mid-gestation (E11.5) mouse embryo. Staining in structures other than limb was not reproducible in additional transgenic embryos and due to ectopic effects.
(B) Comparison of the core ZRS region across 18 different vertebrate species including two basal (blue) and four advanced (purple) snakes. See Figure S1 for full alignment.
(C) Phylogeny of vertebrate species used in the study (based on UCSC (https://genome.ucsc.edu/cgi-bin/hgGateway) and (Hsiang et al., 2015; Pyron et al., 2013)). Branch length indicates absolute ZRS substitution rate, colors indicate relative ZRS evolutionary rate compared to other embryonic enhancers (see Figure S2 and Method Details). The schematic snake skeletons are drawn after (Romanes, 1892); http://www.zoochat.com/; and http://www.skullcleaning.com/.
Results
A Critical Limb Enhancer is Evolutionarily Conserved but Highly Diverged in Snakes
To explore the potential role of the ZRS limb enhancer in snake evolution, we examined the draft genomes of six snake species including the Burmese python (Python molurus bivittatus) (Castoe et al., 2013), boa constrictor (Boa constrictor constrictor), king cobra (Ophiophagus hannah) (Vonk et al., 2013), speckled rattlesnake (Crotalus mitchellii pyrrhus), viper (Vipera berus berus), and corn snake (Pantherophis guttatus) (Ullate-Agote et al., 2014). These species represent different morphological stages within the evolutionary history of snakes (Apesteguía and Zaher, 2006; Martill et al., 2015), from basal snakes (boa and python) that retained a vestigial pelvic girdle and rudimentary hindlimbs, to advanced snakes (viper, rattlesnake, king cobra, and corn snake) that completely lost all skeletal limb structures and represent the majority (>85%) of all extant snake species (Lawson et al., 2005; Pyron et al., 2013). Nearly all of the snake species studied have a ZRS-orthologous sequence (Figure 1B and Figure S1). However, while the ZRS enhancer of basal snakes shares ~80% nucleotide identity with the orthologous region from limbed lizards and shows a substitution rate similar to other vertebrate ZRS orthologs, the ZRS of advanced snakes displays a substantially increased number of substitutions compared to other enhancers (P = 0.012, permutation test; Figures 1B and 1C, Figure S2 and Table S4). This fast evolutionary rate clearly distinguishes the ZRS from other limb enhancers, which do not show such an increase in substitutions (Figure S2) (Infante et al., 2015). Thus, while nearly all snake species examined have a ZRS enhancer, a loss of evolutionary constraint on this enhancer coincides with the complete loss of limb structures at the transition from basal to advanced snakes.
Loss of Region-Specific Limb Enhancer Activity in Snakes
To systematically examine if the sequence changes observed in different snake ZRS orthologs alter the in vivo function of the enhancer, we used a transgenic mouse enhancer reporter assay (http://enhancer.lbl.gov/) (Kothary et al., 1989; Visel et al., 2007). We determined ZRS enhancer activity patterns for 16 different species covering a wide range of jawed vertebrates, including cartilaginous and bony fishes (elephant shark and coelacanth), four snakes (boa, python, rattlesnake and cobra), and ten limbed tetrapods at mid-gestation (embryonic day [E]11.5), a time point when the mouse ZRS is active (Figures 1A and 2) (Lettice et al., 2003). The orthologs from nine finned or limbed vertebrates (coelacanth, lizard, chicken, platypus, sloth, horse, cow, mouse, and human) displayed reproducible patterns of activity in the posterior limb bud that were indistinguishable from the activity of the mouse enhancer (Figure 2), confirming the deep conservation of its function across vertebrates with paired appendages (Dahn et al., 2007; Lettice et al., 2003; Sagai et al., 2004). ZRS orthologs from three species were active in the ZPA of mouse limb buds but also had activity expanded anteriorly (dolphin and megabat) or proximally (elephant shark). In contrast, in four out of five basal and advanced snake species examined, either the enhancer activity in the ZPA or the enhancer sequence itself were lost (Figure 2). Among them, the rattlesnake ZRS displayed an ectopic limb activity pattern that did not include the ZPA and may be related to a ~180 bp insertion specifically found in the viper and rattlesnake lineage (Figure 2 and Figure S1). Only the ZRS of boa, which diverged from python 63–96 million years ago (Esquerré and Scott Keogh, 2016) and among the examined snakes is the one showing the lowest nucleotide substitution rate with respect to that of the lizard, retained activity in the ZPA. Notably, the ZRS from all advanced snakes examined (rattlesnake and cobra) completely lost ZPA-specific activity.
Figure 2. Comparison of enhancer activity across jawed vertebrates.
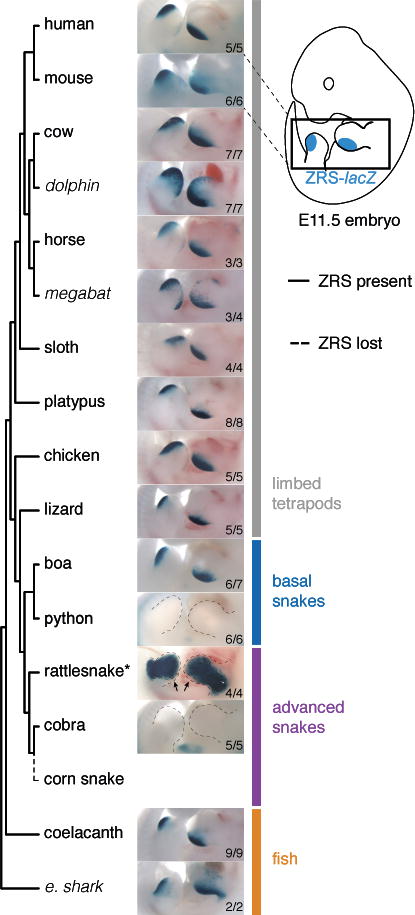
Enhancer activities for 16 different vertebrate species in the limb buds of transgenic E11.5 stage mouse embryos. Numbers of embryos with lacZ activity in the limb over the total number of transgenic embryos screened are indicated. Some species (marked in italics) were active in the ZPA of the limb buds but had additional activity expanded anteriorly (dolphin and megabat) or proximally (elephant shark). * – The rattlesnake ZRS enhancer drives an ectopic reporter activity pattern that does not include the ZPA (arrows point to the ZPA area without detectable LacZ activity).
Snake Enhancer Knock-In Causes Severe Limb Truncation in Mice
To assess the extent to which the observed activity changes in transgenic reporter assays affect vertebrate limb morphology in vivo, we employed CRISPR/Cas9 genome editing to generate a series of knock-in (KI) mice where the functionally critical 1.3kb core region of the ZRS (Figure S3) was replaced with the orthologous sequences of the same length from other species. We first replaced the mouse ZRS with the orthologs from human (73% sequence identity to the mouse ZRS) and coelacanth (57% sequence identity to the human ZRS), whose last common ancestor lived approximately 400 million years ago. Both the human and coelacanth orthologs resulted in Shh expression at the onset of limb bud formation that was indistinguishable from wildtype and rescued the formation of fully developed limbs (Figure 3; Figures S4G–S4J), indicating that despite considerable evolutionary distance between mammals and fish, the enhancers of mouse, human, and coelacanth are largely functionally interchangeable. In contrast, replacing the mouse ZRS with the orthologous cobra sequence resulted in a complete loss of Shh expression and a truncated limb phenotype, affecting both the fore- and hindlimbs, that is indistinguishable from the phenotype caused by deletion of the mouse enhancer (Figure 3; Figures S3 and S4G) (Sagai et al., 2005). This result confirms that despite recognizable sequence conservation, the cobra sequence lacks limb enhancer function and is therefore unable to support limb development. The less diverged python ZRS resulted in a similar but a slightly milder phenotype. While most skeletal forelimb and hindlimb elements distal of the stylopod:zeugopod junction were also severely affected, the python ZRS resulted in formation of 2–3 rudimentary digits in the forelimb and a slightly enlarged ossification resembling a rudimentary zeugopod (Figure 3D). This result may be due to residual enhancer activity that was not detected in transgenic reporter assays (Figure 2). Consistent with this possibility, prolonged development after RNA in situ hybridization indeed revealed very weak levels of Shh transcript in the posterior forelimb bud of python ZRS knock-in mouse embryos (data not shown). Taken together our data indicate that both snake enhancers tested lost their ability to induce normal limb development in mice despite the much shorter evolutionary distance between mammals and snakes than between mammals and lobe-finned fish.
Figure 3. Limb phenotypes of knock-in mice with ZRS orthologs from other vertebrate species.
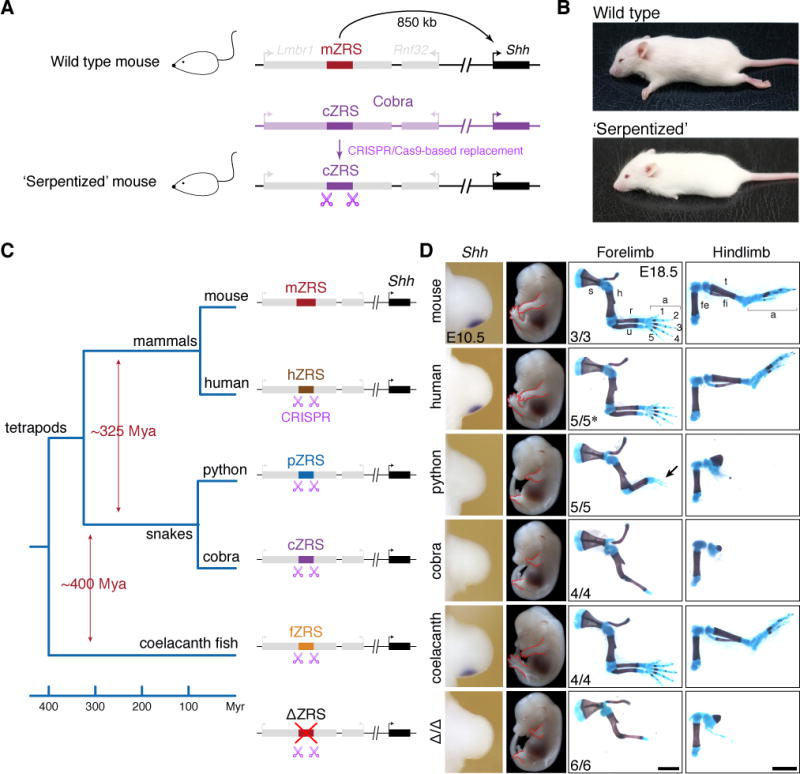
(A) CRISPR/Cas9-mediated replacement of the mouse ZRS sequence with an orthologous sequence from cobra. Schematic of the mouse Shh locus is shown at the top. The ZRS is located in the intron of the Lmbr1 gene (intron-exon structure not shown), 850 kb away from the promoter of Shh. A homologous locus from king cobra with the cobra ZRS enhancer (cZRS) is indicated in purple. A CRISPR/Cas9 modified ‘serpentized’ mouse Shh locus is shown below. See also Figures S4A–S4F and Method Details. Gene diagram not to scale.
(B) Gross phenotypes of ZRSWT/Δ (top) and ‘serpentized’ ZRScZRS/Δ (bottom) mice. Scale bars, 10 mm.
(C and D) Limb phenotypes of knock-in mice with ZRS orthologs from other vertebrate species. (C) Phylogeny and approximate divergence estimates (Amemiya et al., 2013; Hsiang et al., 2015; Wright et al., 2015) are shown on the left. Schematic mouse Shh loci with the ZRS replaced by orthologs from human (hZRS), python (pZRS), cobra (cZRS) and coelacanth fish (fZRS) are shown. (D) Comparative Shh mRNA in situ hybridization analysis in knock-in mouse embryos during forelimb bud development (1st column). Per knock-in line, the Shh transcript distribution was assessed in at least three independent mouse embryos. Scale bars, 0.1 mm. See Figure S4G for hindlimb bud analysis of Shh expression. Corresponding whole-mount E14.5 knock-in mouse embryos (2nd column) and skeletal preparations at E18.5 (3rd and 4th columns) are shown; s, scapula; h, humerus; r, radius; u, ulna; fe, femur; fi, fibula; t, tibia; a, autopod. The genotypes of the embryos are ZRSWT/Δ (mouse), ZRShZRS/Δ (human), ZRSpZRS/Δ (python), ZRScZRS/Δ (cobra), and ZRSfZRS/Δ (coelacanth fish). Arrow points to rudimentary digits in ZRSpZRS/Δ embryos. Bottom embryo shows E14.5 gross and limb skeletal phenotypes of the ZRSΔ/Δ KO mice (see Figure S3 for details). Number of embryos that exhibited representative limb phenotype over the total number of embryos with the genotype are indicated. * − 3/5 mouse embryos displayed mild digit number variation (see Figures S4H–S4J). Scale bars, 2 mm.
In Vivo Resurrection of a Distant-Acting Snake Limb Enhancer
To identify specific nucleotide changes within the enhancer that may have led to its loss of activity in snakes, we examined the snake sequences in detail. While multiple nucleotide differences are observed between snakes and limbed lizards (Figure S1), one small deletion of 17 bp stood out because it affected a region of the ZRS that is highly conserved across all examined tetrapods and fish (Figure 4A). Although it represents less than 10% of all sequence changes between the snake and lizard ZRS, this deletion is the only sequence that is deleted in all snakes but present in all examined limbed vertebrates and fish (Figures 4A and S1). To directly test whether this small snake-specific deletion contributed to the loss of enhancer activity in snakes, we created a partially ancestral allele by reintroducing the 17 bp deleted sequence into the python enhancer sequence (Figures 2, 4A and 4B). In a transgenic mouse reporter assay, this reintroduction of 17 bp of sequence alone was sufficient to reinstate full enhancer activity in the posterior mesenchyme of the limb bud at E11.5 (Figure 4C). To determine if this allele could also functionally restore normal limb development in vivo, we used CRISPR/Cas9 genome editing to replace the endogenous mouse enhancer with this partially ancestral allele. Consistent with the results of the transgenic reporter experiments, the resulting knock-in mice with the modified python allele had normal limbs (Figures 4D and 4E; Figure S5B). These results suggest that a 17 bp snake-specific deletion contributed to enhancer degeneration and that synthetic reintroduction of this microdeletion is sufficient to recreate the ancestral function of the ZRS and to rescue limb development in vivo.
Figure 4. Resurrection of snake limb enhancer function in vivo.
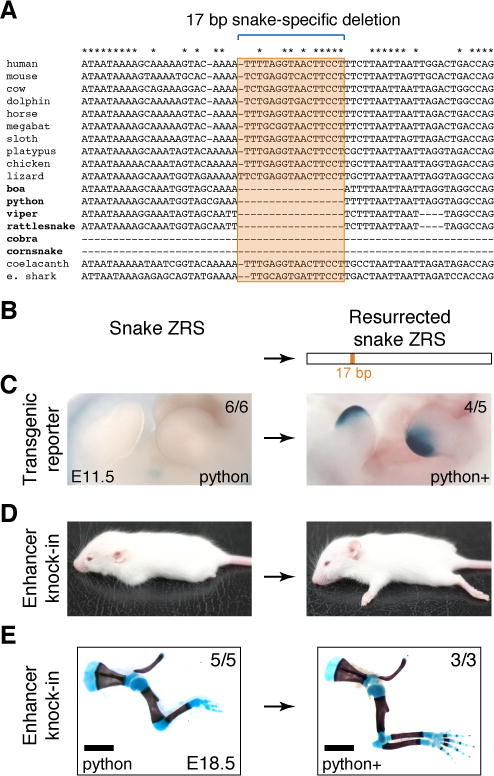
(A) Snake-specific deletion in the ZRS. An alignment of the central ZRS region for 18 vertebrates including six snakes. Asterisks indicate nucleotides that are conserved in limbed tetrapods and fish.
(B) A 17 bp sequence is able to resurrect python ZRS enhancer function.
(C) Shown are the wild type (left) and modified (right) python ZRS in vivo enhancer activities in the limb buds of transgenic E11.5 mouse embryos. Numbers of embryos with lacZ activity in the limb over the total number of transgenic embryos screened are indicated.
(D) This resurrected allele is able to rescue limb development when knocked-in to the mouse genome in place of the wild type ZRS. Shown are gross phenotypes of ZRSpZRS/Δ (‘python’, left) and ZRSpZRS(r)/Δ (‘python+’, right) mice at two weeks of age. Scale bars, 10 mm.
(E) Skeletal preparations from E18.5 knock-in mice are shown. See Figures S5B and S5C for more detailed skeletal phenotypes. Scale bars, 2 mm.
To identify specific transcription factors that may be involved in the loss of enhancer function, we examined potential transcription factor binding sites that may have been affected by the 17 bp sequence deletion in the snake lineage. We identified a highly conserved motif within the deleted region whose sequence matched the binding preference of the ETS1 transcription factor. ETS1 has been suggested to directly activate the ZRS enhancer by binding to multiple ETS recognition sites (Lettice et al., 2012). We scanned the ZRS-orthologous sequences from 18 vertebrates for the presence of additional conserved ETS motifs (Figure S5C). In total, five ETS motifs within the enhancer are conserved across tetrapods, which includes four ETS binding sites previously identified in the mouse enhancer (Lettice et al., 2012). Remarkably, all five motifs were also conserved in coelacanth (bony fish), and three were present in elephant shark (cartilaginous fish, Figure 5 and Figure S5C). In contrast to this strong conservation of ETS motifs across limbed vertebrates and fish, and despite the overall conservation of the ZRS sequence in basal snakes, all examined snakes have lost the E0 and E1 ETS motifs. In addition, the E4 motif was lost in rattlesnake, and cobra lost the E2 motif (Figure 5B; Figures S1 and S5C). More generally, in vertebrates with paired appendages the ETS sites show increased evolutionary constraint compared to the rest of the ZRS, whereas in snakes the ETS sites do not stand out as particularly constrained (Figure 5C). The fact that the loss of E1 motif in mouse ZRS is not sufficient to alter limb bud expression (Lettice et al., 2012) and that boa ZRS is active despite absence of both E0 and E1 motifs indicate that loss of these motifs alone cannot explain ZRS deactivation in snake lineage. We therefore also scanned the ZRS for other transcription factor motifs that showed a similar snake-specific loss of evolutionary constraint (Table S5). Interestingly, binding sites for homeodomain transcription factors, which have also been implicated in ZRS regulation (Capellini et al., 2006; Kmita et al., 2005; Lopez-Rios, 2016), display a similar increase in substitution rate in snakes (Figure 5D). Taken together our results implicate the loss of the E1 ETS site as well as potentially other ETS and homeodomain transcription factor binding sites in the loss of function of this limb enhancer in snakes.
Figure 5. Loss of conserved ETS binding sites in the snake lineage.
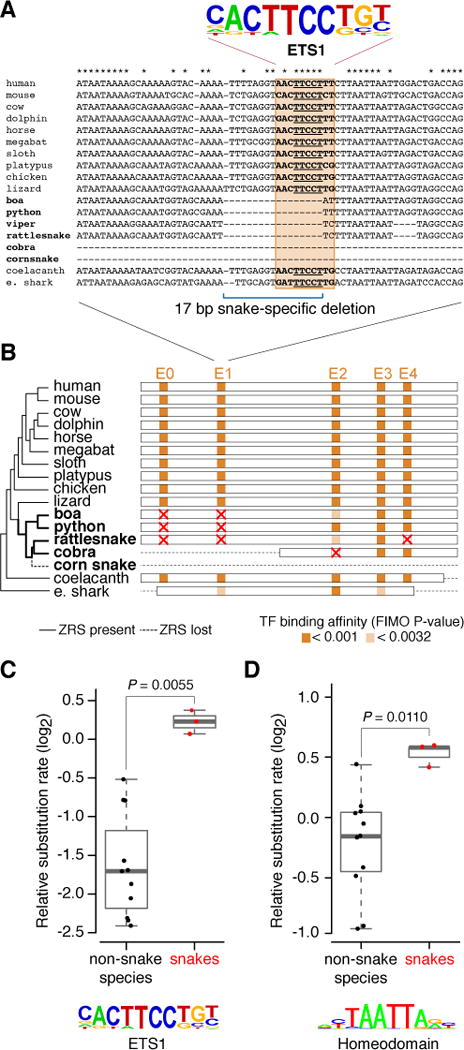
(A) A detailed view of the E1 ETS binding site alignment for 18 vertebrates including six snakes. ETS1 consensus motif is shown above. Asterisks indicate nucleotides that are conserved in limbed tetrapods and fish.
(B) Distribution of tetrapod conserved ETS motifs in the ZRS enhancer in different jawed vertebrates. Shown is a schematic alignment of the ZRS for 16 vertebrates (tree) and the locations of predicted ETS binding sites (E0–E4). Red crosses indicate motifs that were lost. See Figure S5 for details.
(C and D) Relative substitution rates in the ETS and homeodomain DNA motifs in the ZRS enhancer in non-snake species (black dots: species from Figure 5A) and snakes (red dots: boa, python and rattlesnake). Mann-Whitney P value is shown on top.
Discussion
In the present study, we demonstrate an increased rate of molecular evolution, as well as progressive in vivo loss of function for a distant-acting limb enhancer in snakes. Decreased sequence conservation and loss of enhancer function were most pronounced in advanced snakes, which have lost all skeletal limb structures. The only snake genome in which no ZRS sequence was detected belonged to the corn snake. Our results indicate that the previously reported loss of the ZRS enhancer in Japanese rat snakes (Sagai et al., 2004), a member of the same subfamily (Colubrinae) as corn snakes, is not representative of snakes in general, but affects only a small subset of advanced snakes where it occurred after the morphological loss of all limb structures (Figure 1B; Figure S1). Across the snake species examined, the progressive sequence degeneration of the enhancer correlated with its loss of activity in transgenic reporter assays. In contrast, across all limbed tetrapods and fish examined, the enhancer activity was highly conserved. Remarkably, even a ZRS ortholog from fish (coelacanth), which shares less sequence similarity with the human ortholog than with the python ortholog (57% vs 59%), was sufficient for normal limb development despite the major morphological differences between mammalian limbs and coelacanth fins.
The molecular basis of loss of limbs in snakes as they evolved from their limbed ancestor has been the subject of extensive speculation (Apesteguía and Zaher, 2006; Cohn and Tickle, 1999; Di-Poï et al., 2010; Infante et al., 2015; Lopez-Rios, 2016; Martill et al., 2015; Sagai et al., 2004; Tchernov et al., 2000; Zeller et al., 2009). Our genomic enhancer replacement experiments in mice conclusively demonstrate that the loss of function in a single enhancer observed in snakes is sufficient to cause severe limb reduction in mice, raising the possibility that ZRS deactivation contributed to the loss of limbs in the snake lineage. However, changes in other sequences involved in limb development must also have occurred in snakes. These changes could for example involve regulation of Hox genes that act upstream of Shh (Cohn and Tickle, 1999; Di-Poï et al., 2010; Head and Polly, 2015), or other genes that are critical for initiation of limb development (e.g., (Min et al., 1998; Rallis et al., 2003; Sekine et al., 1999; Tanaka et al., 2002)). Notably, following the morphological disappearance of limbs, any sequence required exclusively for limb development is no longer subject to negative selection and is expected to degrade over time. This is exemplified by the reduction in the transgenic reporter activity of other serpentine limb enhancers whose phenotypic impact on limb development remains to be determined (Guerreiro et al., 2016; Infante et al., 2015). In the case of the ZRS, the enhancer activity observed in a basal snake (boa, Figure 2) suggests that the sequence degeneration of the ZRS in snakes started in conjunction with or, more likely, after other disruptive molecular events contributing to the loss of limbs. Consequently, we do not expect that the reintroduction of a fully functional ZRS into a snake genome alone would be sufficient to induce the formation of fully or even partially developed limbs in snakes.
While we deliberately focused on a locus with strong pre-existing evidence for function from human disease and mouse genetics studies (reviewed in (Hill and Lettice, 2013; VanderMeer and Ahituv, 2011)), an increasing number of unbiased genome-wide enhancer data across closely and distantly related animal species (Acemel et al., 2016; Arnold et al., 2014; Cotney et al., 2013; Eckalbar et al., 2016; Gehrke et al., 2014; He et al., 2011; Prescott et al., 2015; Reilly et al., 2015; Villar et al., 2015; Xiao et al., 2012) creates a rapidly growing list of candidate lineage- and species-specific enhancers. A major challenge is the identification of the subsets of these enhancers that functionally contribute to morphological and other phenotypic diversity. Our study provides an example how genome editing-enabled enhancer replacement makes it possible to recapitulate the functional erosion of a regulatory sequence across evolution through in vivo experiments. As genome editing tools are becoming increasingly available, we expect that this approach will be useful to routinely study the phenotypes associated with evolutionary changes in other regulatory sequences associated with morphological adaptations in vertebrates.
STAR Methods
Contact for Reagent and Resource Sharing
Further information and requests for reagents may be directed to, and will be fulfilled by the lead contact Axel Visel (avisel@lbl.gov).
Experimental Model and Subject Details
All animal work was reviewed and approved by the Lawrence Berkeley National Laboratory Animal Welfare. All mice used in this study were housed at The Animal Care Facility (the ACF) of the LBNL. Mice were monitored daily for food and water intake, and animals were inspected weekly by the Chair of the Animal Welfare and Research Committee and the head of the animal facility in consultation with the veterinary staff. The LBNL ACF is accredited by the American Association for the Accreditation of Laboratory Animal Care International (AAALAC). Transgenic mouse assays, enhancer knock-outs and knock-ins were performed in Mus musculus FVB strain mice. The following developmental ages were used in this study: embryonic day E10.5, E11.5, E14.5 and E18.5 mice; adult 2 week old mice. Animals of both sexes were used in the analysis. See method details for sample size selection and randomization strategies.
Method Details
Phylogenetic analysis
Genome data
The following genome assemblies were used in the study: human (hg19), cow (bosTau7), dolphin (turTru2), horse (equCab2), megabat (pteVam1), mouse (mm9), platypus (ornAna1), sloth (choHof14), chicken (galGal4), anole lizard (anoCar2), Burmese python (version AEQU02, NCBI), king cobra (version AZIM01, NCBI), boa constrictor (assembly version 7C, Assemblathon 2, http://gigadb.org/), speckled rattlesnake (version JPMF01), viper (version JTGP01), corn snake (version JTLQ01), coelacanth (latCha1), elephant shark (calMil1). All snake genomes, except boa constrictor, were downloaded from the NCBI. All other vertebrate genomes were downloaded from the UCSC genome browser. See Table S1 for details.
Identification of orthologous enhancer sequences
The list of 2,260 mouse enhancers was obtained from the VISTA database (Pennacchio et al., 2006; Visel et al., 2007). In addition to the ZRS, we selected VISTA enhancers that were active exclusively in the developing limbs (73) or forebrain (121). To identify orthologous enhancers, mouse genome sequences corresponding to each enhancer were mapped onto other genomes using the modified bi-directional BLAST. We first conducted a blastn search and collected best hits with E-values smaller than 1e-5 for every enhancer for every genome. For every hit we extracted the genomic region corresponding to blast alignment and adjacent regions of the genomes sufficient to cover unaligned segment of the enhancer plus 20 nucleotides to account for indels. We then used these sequences to query the mouse genome, collected best hits with E-values smaller than 1e-5 and examined the location of the hit. If its location overlapped partially or completely with the location of the original enhancer, the enhancer was included into the corresponding “enhancer family”. For the ZRS from python, cobra, and boa we also confirmed the location of the enhancer between highly conserved exons of the LMBR1 gene.
Phylogenetic tree inference and analysis of evolutionary rates
For enhancers present in at least 4 species, the orthologous sequences from all the species were aligned to each other using MAFFT (Katoh and Standley, 2013) in linsi mode. Poorly aligned positions were eliminated from the alignments using Gblocks (Castresana, 2000) in DNA mode, allowing 50% of gapped positions and setting minimum length of a block to 8. A poorly sequenced region (polyN region) in the 3′ of the viper ZRS enhancer was excluded from the analysis for all species. The best fitting model of evolution was found for every enhancer ortholog family using jMolelTest (Darriba et al., 2012), and phylogeny was reconstructed for every group using PhyML (Guindon et al., 2010), collecting site-specific likelihood for the ML tree. We used the known topology of the vertebrate species tree (based on UCSC (https://genome.ucsc.edu/cgi-bin/hgGateway) and (Hsiang et al., 2015; Pyron et al., 2013)) and estimated branch lengths using alignments of every respective enhancer in PhyML, collecting site-specific likelihood. We then compared two topologies in terms of the fit they provide for the sequence data using SH-test implemented in CONSEL (Shimodaira and Hasegawa, 2001). If the enhancer-specific topology was a much better fit for the sequence data than species tree topology (p-value of SH-test less than 0.03) we excluded this enhancer family as potentially containing non-orthologous sequences. This resulted in 60 limb- and 96 forebrain-specific enhancer families that were used for further analysis. The relative evolutionary rate in each branch of the species tree was estimated as the branch length for the ZRS (or mean branch length for all limb enhancers), normalized by the mean branch length of all forebrain or limb enhancers. Average heights of the relevant sub-trees were used to test the differences in evolutionary rates between the ZRS and forebrain enhancers with a one-sided permutation test.
In vivo transgenic reporter assays
Enhancer candidate regions (see Table S2 for sequences) were chemically synthetized by Integrated DNA Technologies (IDT) and cloned into an Hsp68-promoter-LacZ reporter vector (Pennacchio et al., 2006) using Gibson (New England Biolabs [NEB]) cloning (Gibson et al., 2009). Transgenic mouse embryos were generated by pronuclear injection, and F0 embryos were collected at E11.5 and stained for LacZ activity (Kothary et al., 1989; Pennacchio et al., 2006). Before injection plasmid DNA was linearized with XhoI or HindIII, followed by purification. FVB and CD-1 mice strains were used as embryo donors and foster mothers respectively. Super-ovulated female FVB mice (7–8 weeks old) were mated to FVB stud males, and fertilized embryos were collected from oviducts. The DNA was diluted in injection buffer (10 mM Tris, pH 7.5; 0.1 mM EDTA) to a final concentration of 1.5 ng/ul and used for pronuclear injections of FVB embryos in accordance with standard protocols approved by the Lawrence Berkeley National Laboratory. The injected zygotes were cultured in KSOM with amino acids at 37°C under 5% CO2 in air for approximately 2 hours. Thereafter, zygotes were transferred into uterus of pseudopregnant CD-1 females. Embryos were harvested at embryonic day 11.5 in cold PBS, followed by 30 min of incubation with 4% paraformaldehyde. The embryos were washed three times for 30 min with embryo wash buffer (2mM MgCl2; 0.01% deoxycholate; 0.02% NP-40; 100mM phosphate buffer, pH 7.3). LacZ activity was detected by incubating with freshly made staining solution (0.8mg/ml X-gal; 4mM potassium ferrocyanide; 4mM potassium ferricyanide; 20mM Tris, pH 7.5 in wash buffer) overnight followed by three rinses in PBS and post-fixation in 4% paraformaldehyde. Only patterns that were observed in at least three different embryos resulting from independent transgenic integration events of the same construct were considered reproducible. The procedures for generating transgenic and engineered mice were reviewed and approved by the Lawrence Berkeley National Laboratory (LBNL) Animal Welfare and Research Committee.
Generation of enhancer knock-out and knock-in mice using CRISPR/Cas9
Mouse strains carrying replaced (knock-in) and deleted (knock-out) ZRS enhancer alleles were created using a modified CRISPR/Cas9 protocol (Wang et al., 2013; Yang et al., 2014; 2013) (see Figures 3; Figures S3, S4A–S4F for details of the strategy and methodology). Briefly, sgRNAs targeting the ZRS enhancer region were designed using CHOPCHOP (Montague et al., 2014) to position the guide target sequence inside the replaced enhancer region in close proximity to its 5′ border (sgRNA recognition sequence was 5′-agtaccatgcgtgtgtgtgaGGG-3′ where GGG is the PAM; see Figures S4A–S4F). No potential off-targets were found by searching for matches in the mouse genome (mm10) and allowing for up to two mismatches in the 20 nt sequence preceding NGG PAM sequence. The T7 promoter was added to the sgRNA template, and the whole cassette was chemically synthetized by IDT. The PCR amplified T7-sgRNA product (primers E1 and E2) was used as a template for in vitro transcription using the MEGAshortscript T7 kit (Thermo Fisher Scientific). The Cas9 mRNA was in vitro transcribed using the mMESSAGE mMACHINE T7 kit (Thermo Fisher Scientific). The DNA template for in vitro transcription containing human optimized Cas9 gene was PCR amplified from pDD921 plasmid using T7Cas9_F and PolyACas9_R primers. To create a donor plasmid, a corresponding orthologous enhancer region of the same size was chemically synthetized by IDT, flanked by homology arms and incorporated into the pCR4-TOPO (Thermo Fisher Scientific) or pSKB1 (Bronson et al., 1996) backbone using Gibson cloning (NEB; see Table S3 and Figures S4A–S4F). Transgenic knock-in mice were generated by injecting a mix of Cas9 mRNA (final concentration of 100 ng/ul), sgRNA (50 ng/ul) and donor plasmid (50 ng/ul) in injection buffer (10 mM Tris, pH 7.5; 0.1 mM EDTA) into the cytoplasm of FVB embryos in accordance with standard procedure approved by the Lawrence Berkeley National Laboratory (see details of injection procedure above). Female mice of CD-1 strain were used as foster mothers. F0 mice were genotyped using PCR. See Key Resources Table, and Figures S4A–S4F for details.
In situ hybridization
The Shh transcript distribution in E10.5 mouse embryonic limb buds was assessed by whole mount in situ hybridization using digoxigenin-labeled antisense riboprobes as previously described (Echelard et al., 1993; Panman et al., 2006). Embryos were fixed in 4%PFA/PBS overnight at 4°C, washed in PBT (0.1% Tween), progressively dehydrated in a methanol/PBT series and stored in methanol at −20°C until further processing. Embryos were rehydrated in a reverse methanol series, washed in PBT and bleached in 6% H2O2/PBT for 15 minutes. After further washes in PBT, samples were treated with 10 μg/mL proteinase K in PBT for 15 min, followed by a 5 min incubation in 2 mg/ml glycine/PBT, washed in PBT and finally re-fixed in 0.2% glutaraldehyde/4% PFA in PBT for 20 min. After several washes in PBT, embryos were transferred to hybridization buffer (50% deionized formamide; 5x SSC pH 4.5; 2% Roche Blocking Reagent; 0.1% Tween-20; 0.5% CHAPS; 50 μg/mL yeast RNA; 5 mM EDTA; 50 μg/ml heparin) and incubated for one hour at 70°C. Afterwards, the solution was changed to hybridization buffer containing 1μg/ml DIG-labeled Shh riboprobe and samples were incubated overnight at 70°C. The following morning, the probe solution was removed and the embryos washed at 70°C several times in hybridization buffer with increasing concentrations of 2x SCC pH 4.5, with the last washes performed in 2x SCC; 0.1% CHAPS. Subsequently, the samples were treated with 20 μg/ml RNase A in 2x SSC, 0.1 % CHAPS for 45 minutes at 37°C and washed twice in maleic acid buffer (100 mM Maleic acid disodium salt hydrate; 150mM NaCl; pH 7.5) for 10 minutes at room temperature, followed by additional washes at 70°C. Embryos where then equilibrated in TBST (140mM NaCl; 2.7mM KCl; 25mM Tris-HCl; 1% Tween 20; pH 7.5), blocked in 10% lamb serum/TBST and finally incubated overnight at 4°C in a 1% lamb serum containing Anti-Dig-AP antibody (Roche, 1:5000). After extensive washes in TBST and equilibration in NTMT (100mM NaCl, 100mM Tris-HCl; 50mM MgCl2; 1% Tween-20; pH 9.5), AP activity was detected by incubating the samples in BM purple reagent (Roche) at room temperature. Forelimb buds from at least three independent embryos were analyzed for each genotype (including ZRSWT/Δ and ZRSΔ/Δ controls) and yielded very similar or identical patterns for all results shown. The stained limb buds were imaged using standard Leica MZ16 microscope and Leica DFC420 digital camera.
Skeletal preparations
For skeletal preparation, embryos were harvested at embryonic day E18.5, dissected in water, followed by overnight incubation in water at room temperature. The embryos were fixed in ethanol for 24 hours and stained according to a standard Alcian blue/Alizarin red protocol (Ovchinnikov, 2009). The stained embryos were dissected in 80% glycerol and limbs were imaged at 1x using standard Leica MZ16 microscope and Leica DFC420 digital camera.
Sample Selection and Blinding
Transgenic mouse assays
Sample sizes were selected empirically based on our previous experience of performing transgenic mouse assays for >2,000 total putative enhancers (Attanasio et al., 2013; Blow et al., 2010; May et al., 2012; Pennacchio et al., 2006; Visel et al., 2007; 2009). Mouse embryos were only excluded from further analysis if they did not carry the reporter transgene or if they were not at the correct developmental stage. All transgenic mice were treated with identical experimental conditions. Randomization and experimenter blinding were unnecessary and not performed.
Enhancer knock-outs and knock-ins
All experiments that involved knock-in and knock-out mice employed a matched littermate selection strategy. Sample sizes were selected empirically based on our previous studies (Attanasio et al., 2013). All knock-out/knock-in mice described in the paper resulted from multiple F0 × heterozygous enhancer deletion (null) crosses to allow for the comparison of matched littermates of different genotypes. For every hemizygous null/knock-in animal selected, a null/wild type and homozygous null/null animal from the same litter was selected for comparison. Embryonic samples used for in situ hybridizations and skeletal preparations were dissected blind to genotype.
Motif analysis
Orthologous aligned ZRS sequences from multiple species were scanned for all putative binding sites of the ETS1 transcription factor using FIMO (Grant et al., 2011) and available position weight matrixes (Heinz et al., 2010; Jolma et al., 2013). Gaps were removed from the multispecies alignment and a custom Python script was used to super-impose the FIMO-derived sites on the alignment (Figure S5). Relative substitution rates in the ETS and homeodomain sites (Figure 5C and 5D) were calculated for each species as the ratio between the substitution rate in the ETS or homeodomain sites and the substitution rate in the rest of the ZRS enhancer (using human ZRS enhancer as a reference).
Quantification and Statistical Analysis
Substitution rates in TF motifs
Changes in relative substitution rates in DNA motifs in the ZRS enhancer between non-snake species and snakes (Figure 5) were compared using Mann-Whitney test.
Differences in evolutionary rates
Average heights of the relevant sub-trees were used to test the differences in evolutionary rates between the ZRS and forebrain enhancers with a one-sided permutation test.
Sample numbers, experimental repeats and statistical tests are indicated in figures and figure legends or methods section above.
Supplementary Material
Shown is the core ~800 bp of the mouse ZRS enhancer aligned with the orthologous sequences from 17 different vertebrate species, including cartilaginous and bony fishes (elephant shark and coelacanth), five snakes (boa constrictor, Burmese python, speckled rattlesnake, viper and king cobra) and ten limbed tetrapods. Blastn was used to identify sequences orthologous to the mouse ZRS sequence. Colors indicate different nucleotides. Tetrapod-conserved ETS motifs are shown (orange boxes). 17 bp snake-specific deletion overlapping E1 motif is indicated. See Figures 4, 5 and Figure S5 for more details.
(A–C) Branch lengths indicate absolute substitution rate for ZRS enhancer (A, B) or all other limb specific enhancer sequences from the VISTA enhancer browser (C). Colors indicate the relative evolutionary rate of the ZRS (A, B) or all other limb specific enhancers (C) compared to forebrain specific enhancers (A, C) or to other limb specific enhancers (B) from the VISTA enhancer browser. This is consistent with the recent observation that other limb enhancers are conserved in snakes (Infante et al., 2015). This sequence conservation has been ascribed to functions in the development of vestigial limb structures in basal snakes or pleiotropic functions in structures outside the limb. Mouse ZRS transgenic reporter assays show no reproducible staining outside the limb, and ZRS deletion studies in mice indicate no phenotypes beyond limb defects, suggesting that the function of the ZRS is restricted to limb development (Lettice et al., 2003; Sagai et al., 2005).
We used CRISPR/Cas9 technology to replicate the enhancer deletion to exclude possible effects of the neomycin cassette and genetic background on the phenotype observed by Sagai et al. (Sagai et al., 2005).
(A) Schematic overview of the strategy. A 4.5 kb mouse genomic region containing the ZRS (red) is shown together with the vertebrate sequence conservation track (dark blue). The sgRNA recognition site is indicated in purple. A mouse with a CRISPR/Cas9-induced 1324 bp deletion (chr5:29,314,497-29,315,820; mm10) similar to the deletion from Sagai et al. was selected for further analysis. Genotyping primers are indicated as blue arrows (F and R). A 3780 bp ‘donut‘ transgenic reporter was used to detect residual enhancer activity outside of the deleted region.
(B) Representative E11.5 transgenic mouse embryo injected with a reporter under control of the ‘donut‘ sequence. No reproducible limb activity was detected in 6/6 independent transgenic embryos.
(C) PCR genotyping of the ZRS enhancer knock-out mice.
(D) The PCR product from ZRSΔ/Δ mice was sequenced to identify the deletion breakpoint.
(E) Gross phenotypes of two week old ZRSWT/Δ (top) and ZRSΔ/Δ (bottom) mice. The body sizes are comparable, but ZRSΔ/Δ mice have truncated limbs. Scale bars, 10 mm.
(F) Skeletal phenotypes of E18.5 limbs from ZRSWT/Δ (top) and ZRSΔ/Δ (bottom) embryos; s, scapula; h, humerus; r, radius; u, ulna; fe, femur; fi, fibula; t, tibia; a, autopod. The humerus, radius, and ulna of the ZRSΔ/Δ E18.5 forelimb appear to be fused, while no recognizable autopod is present. The zeugopod of the hindlimb is severely reduced, and the autopod is represented by just one rudimentary digit. Overall, the limb phenotype of the CRISPR ZRS knock-out mouse reproduces the limb phenotype observed in ShhΔ/Δ and ZRSNeo/Neo (Sagai et al., 2005) knock-out mice. Scale bars, 2 mm.
(A) Schematic overview of strategy. A 4.5 kb mouse genomic region containing the ZRS enhancer (red) is shown together with the vertebrate conservation track (dark blue). The donor vector contained two homology arms (grey, indicated as HA-L and HA-R) and a corresponding replaced region (blue) with borders exactly matching the deletion breakpoints from the ZRS deletion allele (Figure S3). The sgRNA recognition site is indicated in purple. PCR primers used for genotyping are shown as arrows (left-F, right-R - mouse specific, outside of the homology arms; right-F, left-R - species specific, inside the replaced region).
(B) PCR genotyping analysis of F0 human ZRS knock-in mice using primer pairs left-F/left-R-H and right-F-H/right-R to confirm the correct integration of the left (HA–L) and the right (HA–R) homology arms, respectively. Numbers indicate independent founder mice. WT - wild-type mouse.
(C–F) PCR genotyping analysis of F0 ZRS knock-in mice containing the alleles from python (C, left-F/left-R-P and right-F-P/right-R primers), king cobra (D, left-F/left-R-KC and right-F-KC/right-R primers), coelacanth (E, left-F/left-R-C and right-F-C/right-R primers), and resurrected python (F, left-F/left-R-RP and right-F-RP/right-R primers). All fragments were sequence-verified by Sanger sequencing.
(G) Comparative Shh RNA in situ hybridization analysis in knock-in mouse embryos during the onset of hindlimb bud development. Per knock-in line, the Shh transcript distribution was reproduced in at least n = 3 independent mouse embryos. The genotypes of the embryos are ZRSWT/Δ (mouse), ZRShZRS/Δ (human), ZRSpZRS/Δ (python), ZRScZRS/Δz (cobra), ZRSfZRS/Δ (coelacanth fish) and ZRS Δ/Δ. Scale bars, 0.1 mm.
(H–J) A range of autopod skeletal phenotypes observed in wild-type (H, ZRSWT/Δ), heterozygous human knock-in (I, ZRShZRS/Δ), and coelacanth fish knock-in (J, ZRSfZRS/Δ) knock-in mice. Asterisks indicate extra- (**) or existing (*) digit fusions. Numbers of embryos that exhibited respective limb phenotype over the total number of embryos with the genotype are indicated.
(A) Strategy for in vivo resurrection of the snake limb enhancer function. A 17 bp sequence from the lizard ZRS ortholog was introduced into the python ZRS, and the resulting snake allele (1341 bp) containing modified python ZRS was inserted into the mouse genome in place of the wild-type mouse ZRS using CRISPR/Cas9 (see Figure S4 and Method Details).
(B) Limb skeletal phenotypes of the knock-in mice with the python ZRS (pZRS) enhancer (top) and the “resurrected“ python ZRS enhancer (pZRS(r)). Number of embryos that exhibited representative limb phenotype over the total number of embryos with the genotype are indicated. Scale bars, 2 mm.
(C) Distribution of predicted ETS1 binding sites in the ZRS for 17 jawed vertebrates. PWMs (Position Weight Matrixes) for ETS1 were used to search for all possible motif matches (FIMO P-value < 0.0032) in the ZRS from each species. Predicted binding sites were mapped to the multi-species alignment (right; see Figure S1). Binding sites that are conserved in tetrapods are indicated at top (ETS1, E0-4). Position of cobra- and rattlesnake-specific insertions is indicated in pink (Figure S1). A dashed line indicates a sequencing gap in the viper ZRS sequence.
Table S1. Genome sequence data used in the study, Related to Figure 1
Table S2. Orthologous ZRS sequences used for lacZ transgenic reporters, Related to Figure 2
Table S3. Extended orthologous ZRS sequences and homology arms used for knock-in experiments, Related to Figure 3
Table S4. Significance testing for evolutionary rates (Permutation test), Related to Figure 2
Table S5. Representative transcription factor motifs that show increase in relative substitution rate in snakes compared to non-snake species, Related to Figure 5
Table S6. Primers used in the study, Related to Figure 3
Highlights.
Activity of the critical ZRS limb enhancer is highly conserved across vertebrates
ZRS enhancer has progressively lost its function during snake evolution
Snake-specific nucleotide changes contributed to the loss of ZRS enhancer function
Resurrection of snake enhancer function in vivo
Acknowledgments
This work was supported by National Institutes of Health grants R01HG003988, U54HG006997, and U01DE024427 (to A.V. and L.A.P.), and by the Olga Mayenfisch Foundation and the University of Basel (to J.L-R). E.Z.K. is supported by a postdoctoral fellowship from the Helen Hay Whitney Foundation funded by a Howard Hughes Medical Institute. M.O. was supported by a Swiss National Science Foundation (SNSF) fellowship. We thank T. Castoe for providing the draft assembly sequence of the Boa genome; and J. Doudna for providing a plasmid containing a human-optimized Cas9 gene. We also thank A. Stark for helpful suggestions and comments on the manuscript. Research was conducted at the E.O. Lawrence Berkeley National Laboratory and performed under Department of Energy Contract DE-AC02-05CH11231, University of California.
Footnotes
Publisher's Disclaimer: This is a PDF file of an unedited manuscript that has been accepted for publication. As a service to our customers we are providing this early version of the manuscript. The manuscript will undergo copyediting, typesetting, and review of the resulting proof before it is published in its final citable form. Please note that during the production process errors may be discovered which could affect the content, and all legal disclaimers that apply to the journal pertain.
Author Contributions
E.Z.K., D.E.D., E.M.R., A.V., and L.A.P. conceived the project. E.Z.K. and O.K. performed the phylogenetic analysis. E.Z.K. and U.M.S. cloned transgenic reporter and targeting vectors. E.Z.K., B.M., I.P.-F., C.S.P., T.G., M.K., E.A.L., J.A.A., and V.A. carried out transgenic validation. E.Z.K. performed the enhancer knock-out and knock-in studies with help of U.M.S. V.T., J.L.-R., M.O. and E.Z.K. performed ISH. I.B. and E.Z.K. performed motif analysis. E.Z.K., A.V. and L.A.P. wrote the manuscript with input from the remaining authors.
References
- Acemel RD, Tena JJ, Irastorza-Azcarate I, Marlétaz F, Gomez-Marin C, la Calle-Mustienes de E, Bertrand S, Diaz SG, Aldea D, Aury J-M, et al. A single three-dimensional chromatin compartment in amphioxus indicates a stepwise evolution of vertebrate Hox bimodal regulation. Nat Genet. 2016;48:336–341. doi: 10.1038/ng.3497. [DOI] [PubMed] [Google Scholar]
- Amemiya CT, Alföldi J, Lee AP, Fan S, Philippe H, MacCallum I, Braasch I, Manousaki T, Schneider I, Rohner N, et al. The African coelacanth genome provides insights into tetrapod evolution. Nature. 2013;496:311–316. doi: 10.1038/nature12027. [DOI] [PMC free article] [PubMed] [Google Scholar]
- Apesteguía S, Zaher H. A Cretaceous terrestrial snake with robust hindlimbs and a sacrum. Nature. 2006;440:1037–1040. doi: 10.1038/nature04413. [DOI] [PubMed] [Google Scholar]
- Arnold CD, Gerlach D, Spies D, Matts JA, Sytnikova YA, Pagani M, Lau NC, Stark A. Quantitative genome-wide enhancer activity maps for five Drosophila species show functional enhancer conservation and turnover during cis-regulatory evolution. Nat Genet. 2014 doi: 10.1038/ng.3009. [DOI] [PMC free article] [PubMed] [Google Scholar]
- Attanasio C, Nord AS, Zhu Y, Blow MJ, Li Z, Liberton DK, Morrison H, Plajzer-Frick I, Holt A, Hosseini R, et al. Fine tuning of craniofacial morphology by distant-acting enhancers. Science. 2013;342:1241006. doi: 10.1126/science.1241006. [DOI] [PMC free article] [PubMed] [Google Scholar]
- Blow MJ, Mcculley DJ, Li Z, Zhang T, Akiyama JA, Holt A, Plajzer-Frick I, Shoukry M, Wright C, Chen F, et al. ChIP-Seq identification of weakly conserved heart enhancers. Nat Genet. 2010;42:806–810. doi: 10.1038/ng.650. [DOI] [PMC free article] [PubMed] [Google Scholar]
- Britten RJ, Davidson EH. Gene regulation for higher cells: a theory. Science. 1969;165:349–357. doi: 10.1126/science.165.3891.349. [DOI] [PubMed] [Google Scholar]
- Bronson SK, Plaehn EG, Kluckman KD, Hagaman JR, Maeda N, Smithies O. Single-copy transgenic mice with chosen-site integration. Proc Natl Acad Sci USA. 1996;93:9067–9072. doi: 10.1073/pnas.93.17.9067. [DOI] [PMC free article] [PubMed] [Google Scholar]
- Capellini TD, Di Giacomo G, Salsi V, Brendolan A, Ferretti E, Srivastava D, Zappavigna V, Selleri L. Pbx1/Pbx2 requirement for distal limb patterning is mediated by the hierarchical control of Hox gene spatial distribution and Shh expression. Development. 2006;133:2263–2273. doi: 10.1242/dev.02395. [DOI] [PubMed] [Google Scholar]
- Carroll SB. Evo-devo and an expanding evolutionary synthesis: a genetic theory of morphological evolution. Cell. 2008;134:25–36. doi: 10.1016/j.cell.2008.06.030. [DOI] [PubMed] [Google Scholar]
- Castoe TA, de Koning APJ, Hall KT, Card DC, Schield DR, Fujita MK, Ruggiero RP, Degner JF, Daza JM, Gu W, et al. The Burmese python genome reveals the molecular basis for extreme adaptation in snakes. Proc Natl Acad Sci USA. 2013;110:20645–20650. doi: 10.1073/pnas.1314475110. [DOI] [PMC free article] [PubMed] [Google Scholar]
- Castresana J. Selection of conserved blocks from multiple alignments for their use in phylogenetic analysis. Mol Biol Evol. 2000;17:540–552. doi: 10.1093/oxfordjournals.molbev.a026334. [DOI] [PubMed] [Google Scholar]
- Chan YF, Marks ME, Jones FC, Villarreal G, Shapiro MD, Brady SD, Southwick AM, Absher DM, Grimwood J, Schmutz J, et al. Adaptive evolution of pelvic reduction in sticklebacks by recurrent deletion of a Pitx1 enhancer. Science. 2010;327:302–305. doi: 10.1126/science.1182213. [DOI] [PMC free article] [PubMed] [Google Scholar]
- Cohn MJ, Tickle C. Developmental basis of limblessness and axial patterning in snakes. Nature. 1999;399:474–479. doi: 10.1038/20944. [DOI] [PubMed] [Google Scholar]
- Cooper KL, Sears KE, Uygur A, Maier J, Baczkowski KS, Brosnahan M, Antczak D, Skidmore JA, Tabin CJ. Patterning and post-patterning modes of evolutionary digit loss in mammals. Nature. 2014;511:41–45. doi: 10.1038/nature13496. [DOI] [PMC free article] [PubMed] [Google Scholar]
- Cotney J, Leng J, Yin J, Reilly SK, DeMare LE, Emera D, Ayoub AE, Rakic P, Noonan JP. The evolution of lineage-specific regulatory activities in the human embryonic limb. Cell. 2013;154:185–196. doi: 10.1016/j.cell.2013.05.056. [DOI] [PMC free article] [PubMed] [Google Scholar]
- Cretekos CJ, Wang Y, Green ED, Martin JF, Rasweiler JJ, Behringer RR. Regulatory divergence modifies limb length between mammals. Genes & Development. 2008;22:141–151. doi: 10.1101/gad.1620408. [DOI] [PMC free article] [PubMed] [Google Scholar]
- Dahn RD, Davis MC, Pappano WN, Shubin NH. Sonic hedgehog function in chondrichthyan fins and the evolution of appendage patterning. Nature. 2007;445:311–314. doi: 10.1038/nature05436. [DOI] [PubMed] [Google Scholar]
- Darriba D, Taboada GL, Doallo R, Posada D. jModelTest 2: more models, new heuristics and parallel computing. Nat Methods. 2012;9:772. doi: 10.1038/nmeth.2109. [DOI] [PMC free article] [PubMed] [Google Scholar]
- Di-Poï N, Montoya-Burgos JI, Miller H, Pourquié O, Milinkovitch MC, Duboule D. Changes in Hox genes’ structure and function during the evolution of the squamate body plan. Nature. 2010;464:99–103. doi: 10.1038/nature08789. [DOI] [PubMed] [Google Scholar]
- Echelard Y, Epstein DJ, St-Jacques B, Shen L, Mohler J, McMahon JA, McMahon AP. Sonic hedgehog, a member of a family of putative signaling molecules, is implicated in the regulation of CNS polarity. Cell. 1993;75:1417–1430. doi: 10.1016/0092-8674(93)90627-3. [DOI] [PubMed] [Google Scholar]
- Eckalbar WL, Schlebusch SA, Mason MK, Gill Z, Parker AV, Booker BM, Nishizaki S, Muswamba-Nday C, Terhune E, Nevonen KA, et al. Transcriptomic and epigenomic characterization of the developing bat wing. Nat Genet. 2016;48:528–536. doi: 10.1038/ng.3537. [DOI] [PMC free article] [PubMed] [Google Scholar]
- Esquerré D, Scott Keogh J. Parallel selective pressures drive convergent diversification of phenotypes in pythons and boas. Ecol Lett. 2016;19:800–809. doi: 10.1111/ele.12620. [DOI] [PubMed] [Google Scholar]
- Gehrke AR, Schneider I, la Calle-Mustienes de E, Tena JJ, Gomez-Marin C, Chandran M, Nakamura T, Braasch I, Postlethwait JH, Gómez-Skarmeta JL, et al. Deep conservation of wrist and digit enhancers in fish. Proc Natl Acad Sci USA. 2014 doi: 10.1073/pnas.1420208112. [DOI] [PMC free article] [PubMed] [Google Scholar]
- Gibson DG, Young L, Chuang RY, Venter JC, Hutchison CA, Smith HO. Enzymatic assembly of DNA molecules up to several hundred kilobases. Nat Methods. 2009;6:343–345. doi: 10.1038/nmeth.1318. [DOI] [PubMed] [Google Scholar]
- Grant CE, Bailey TL, Noble WS. FIMO: scanning for occurrences of a given motif. Bioinformatics. 2011;27:1017–1018. doi: 10.1093/bioinformatics/btr064. [DOI] [PMC free article] [PubMed] [Google Scholar]
- Guenther CA, Tasic B, Luo L, Bedell MA, Kingsley DM. A molecular basis for classic blond hair color in Europeans. Nat Genet. 2014 doi: 10.1038/ng.2991. [DOI] [PMC free article] [PubMed] [Google Scholar]
- Guerreiro I, Gitto S, Nóvoa A, Codourey J, Nguyen Huynh TH, Gonzalez F, Milinkovitch MC, Mallo M, Duboule D. Reorganisation of Hoxd regulatory landscapes during the evolution of a snake-like body plan. Elife. 2016;5:347. doi: 10.7554/eLife.16087. [DOI] [PMC free article] [PubMed] [Google Scholar]
- Guerreiro I, Nunes A, Woltering JM, Casaca A, Nóvoa A, Vinagre T, Hunter ME, Duboule D, Mallo M. Role of a polymorphism in a Hox/Pax-responsive enhancer in the evolution of the vertebrate spine. Proc Natl Acad Sci USA. 2013;110:10682–10686. doi: 10.1073/pnas.1300592110. [DOI] [PMC free article] [PubMed] [Google Scholar]
- Guindon S, Dufayard JF, Lefort V, Anisimova M, Hordijk W, Gascuel O. New algorithms and methods to estimate maximum-likelihood phylogenies: assessing the performance of PhyML 3.0. Syst Biol. 2010;59:307–321. doi: 10.1093/sysbio/syq010. [DOI] [PubMed] [Google Scholar]
- He Q, Bardet AF, Patton B, Purvis J, Johnston J, Paulson A, Gogol M, Stark A, Zeitlinger J. High conservation of transcription factor binding and evidence for combinatorial regulation across six Drosophila species. Nat Genet. 2011;43:414–420. doi: 10.1038/ng.808. [DOI] [PubMed] [Google Scholar]
- Head JJ, Polly PD. Evolution of the snake body form reveals homoplasy in amniote Hox gene function. Nature. 2015 doi: 10.1038/nature14042. [DOI] [PubMed] [Google Scholar]
- Heinz S, Benner C, Spann N, Bertolino E, Lin YC, Laslo P, Cheng JX, Murre C, Singh H, Glass CK. Simple combinations of lineage-determining transcription factors prime cis-regulatory elements required for macrophage and B cell identities. Molecular Cell. 2010;38:576–589. doi: 10.1016/j.molcel.2010.05.004. [DOI] [PMC free article] [PubMed] [Google Scholar]
- Hill RE, Lettice LA. Alterations to the remote control of Shh gene expression cause congenital abnormalities. Philos Trans R Soc Lond, B Biol Sci. 2013;368:20120357. doi: 10.1098/rstb.2012.0357. [DOI] [PMC free article] [PubMed] [Google Scholar]
- Hoekstra HE. Genomics: Stickleback is the catch of the day. Nature. 2012;484:46–47. doi: 10.1038/484046a. [DOI] [PubMed] [Google Scholar]
- Hsiang AY, Field DJ, Webster TH, Behlke ADB, Davis MB, Racicot RA, Gauthier JA. The origin of snakes: revealing the ecology, behavior, and evolutionary history of early snakes using genomics, phenomics, and the fossil record. BMC Evol Biol. 2015;15:87. doi: 10.1186/s12862-015-0358-5. [DOI] [PMC free article] [PubMed] [Google Scholar]
- Indjeian VB, Kingman GA, Jones FC, Guenther CA, Grimwood J, Schmutz J, Myers RM, Kingsley DM. Evolving New Skeletal Traits by cis-Regulatory Changes in Bone Morphogenetic Proteins. Cell. 2016;164:45–56. doi: 10.1016/j.cell.2015.12.007. [DOI] [PMC free article] [PubMed] [Google Scholar]
- Infante CR, Mihala AG, Park S, Wang JS, Johnson KK, Lauderdale JD, Menke DB. Shared Enhancer Activity in the Limbs and Phallus and Functional Divergence of a Limb-Genital cis-Regulatory Element in Snakes. Developmental Cell. 2015:1–32. doi: 10.1016/j.devcel.2015.09.003. [DOI] [PMC free article] [PubMed] [Google Scholar]
- Jolma A, Yan J, Whitington T, Toivonen J, Nitta KR, Rastas P, Morgunova E, Enge M, Taipale M, Wei G, et al. DNA-Binding Specificities of Human Transcription Factors. Cell. 2013;152:327–339. doi: 10.1016/j.cell.2012.12.009. [DOI] [PubMed] [Google Scholar]
- Jones FC, Grabherr MG, Chan YF, Russell P, Mauceli E, Johnson J, Swofford R, Pirun M, Zody MC, White S, et al. The genomic basis of adaptive evolution in threespine sticklebacks. Nature. 2012;484:55–61. doi: 10.1038/nature10944. [DOI] [PMC free article] [PubMed] [Google Scholar]
- Katoh K, Standley DM. MAFFT multiple sequence alignment software version 7: improvements in performance and usability. Mol Biol Evol. 2013;30:772–780. doi: 10.1093/molbev/mst010. [DOI] [PMC free article] [PubMed] [Google Scholar]
- King MC, Wilson AC. Evolution at two levels in humans and chimpanzees. Science. 1975;188:107–116. doi: 10.1126/science.1090005. [DOI] [PubMed] [Google Scholar]
- Kmita M, Tarchini B, Zakany J, Logan M, Tabin CJ, Duboule D. Early developmental arrest of mammalian limbs lacking HoxA/HoxD gene function. Nature. 2005;435:1113–1116. doi: 10.1038/nature03648. [DOI] [PubMed] [Google Scholar]
- Kothary R, Clapoff S, Darling S, Perry MD, Moran LA, Rossant J. Inducible expression of an hsp68-lacZ hybrid gene in transgenic mice. Development. 1989;105:707–714. doi: 10.1242/dev.105.4.707. [DOI] [PubMed] [Google Scholar]
- Lawson R, Slowinski JB, Crother BI, Burbrink FT. Phylogeny of the Colubroidea (Serpentes): new evidence from mitochondrial and nuclear genes. Molecular Phylogenetics and Evolution. 2005;37:581–601. doi: 10.1016/j.ympev.2005.07.016. [DOI] [PubMed] [Google Scholar]
- Lettice LA, Heaney SJH, Purdie LA, Li L, de Beer P, Oostra BA, Goode D, Elgar G, Hill RE, de Graaff E. A long-range Shh enhancer regulates expression in the developing limb and fin and is associated with preaxial polydactyly. Hum Mol Genet. 2003;12:1725–1735. doi: 10.1093/hmg/ddg180. [DOI] [PubMed] [Google Scholar]
- Lettice LA, Hill AE, Devenney PS, Hill RE. Point mutations in a distant sonic hedgehog cis-regulator generate a variable regulatory output responsible for preaxial polydactyly. Hum Mol Genet. 2008;17:978–985. doi: 10.1093/hmg/ddm370. [DOI] [PubMed] [Google Scholar]
- Lettice LA, Williamson I, Devenney PS, Kilanowski F, Dorin J, Hill RE. Development of five digits is controlled by a bipartite long-range cis-regulator. Development. 2014;141:1715–1725. doi: 10.1242/dev.095430. [DOI] [PMC free article] [PubMed] [Google Scholar]
- Lettice LA, Williamson I, Wiltshire JH, Peluso S, Devenney PS, Hill AE, Essafi A, Hagman J, Mort R, Grimes G, et al. Opposing functions of the ETS factor family define Shh spatial expression in limb buds and underlie polydactyly. Developmental Cell. 2012;22:459–467. doi: 10.1016/j.devcel.2011.12.010. [DOI] [PMC free article] [PubMed] [Google Scholar]
- Lopez-Rios J. The many lives of SHH in limb development and evolution. Semin Cell Dev Biol. 2016 doi: 10.1016/j.semcdb.2015.12.018. [DOI] [PubMed] [Google Scholar]
- Lopez-Rios J, Duchesne A, Speziale D, Andrey G, Peterson KA, Germann P, Ünal E, Liu J, Floriot S, Barbey S, et al. Attenuated sensing of SHH by Ptch1 underlies evolution of bovine limbs. Nature. 2014;511:46–51. doi: 10.1038/nature13289. [DOI] [PubMed] [Google Scholar]
- Martill DM, Tischlinger H, Longrich NR. EVOLUTION. A four-legged snake from the Early Cretaceous of Gondwana. Science. 2015;349:416–419. doi: 10.1126/science.aaa9208. [DOI] [PubMed] [Google Scholar]
- May D, Blow MJ, Kaplan T, Mcculley DJ, Jensen BC, Akiyama JA, Holt A, Plajzer-Frick I, Shoukry M, Wright C, et al. Large-scale discovery of enhancers from human heart tissue. Nat Genet. 2012;44:89–93. doi: 10.1038/ng.1006. [DOI] [PMC free article] [PubMed] [Google Scholar]
- McLean CY, Reno PL, Pollen AA, Bassan AI, Capellini TD, Guenther C, Indjeian VB, Lim X, Menke DB, Schaar BT, et al. Human-specific loss of regulatory DNA and the evolution of human-specific traits. Nature. 2011;471:216–219. doi: 10.1038/nature09774. [DOI] [PMC free article] [PubMed] [Google Scholar]
- Min H, Danilenko DM, Scully SA, Bolon B, Ring BD, Tarpley JE, DeRose M, Simonet WS. Fgf-10 is required for both limb and lung development and exhibits striking functional similarity to Drosophila branchless. Genes & Development. 1998;12:3156–3161. doi: 10.1101/gad.12.20.3156. [DOI] [PMC free article] [PubMed] [Google Scholar]
- Montague TG, Cruz JM, Gagnon JA, Church GM, Valen E. CHOPCHOP: a CRISPR/Cas9 and TALEN web tool for genome editing. Nucleic Acids Research. 2014;42:W401–W407. doi: 10.1093/nar/gku410. [DOI] [PMC free article] [PubMed] [Google Scholar]
- Ovchinnikov D. Alcian blue/alizarin red staining of cartilage and bone in mouse. Cold Spring Harb Protoc. 2009;2009 doi: 10.1101/pdb.prot5170. pdb.prot5170. [DOI] [PubMed] [Google Scholar]
- Panman L, Galli A, Lagarde N, Michos O, Soete G, Zuniga A, Zeller R. Differential regulation of gene expression in the digit forming area of the mouse limb bud by SHH and gremlin 1/FGF-mediated epithelial-mesenchymal signalling. Development. 2006;133:3419–3428. doi: 10.1242/dev.02529. [DOI] [PubMed] [Google Scholar]
- Pennacchio LA, Ahituv N, Moses AM, Prabhakar S, Nobrega MA, Shoukry M, Minovitsky S, Dubchak I, Holt A, Lewis KD, et al. In vivo enhancer analysis of human conserved non-coding sequences. Nature. 2006;444:499–502. doi: 10.1038/nature05295. [DOI] [PubMed] [Google Scholar]
- Prabhakar S, Visel A, Akiyama JA, Shoukry M, Lewis KD, Holt A, Plajzer-Frick I, Morrison H, Fitzpatrick DR, Afzal V, et al. Human-specific gain of function in a developmental enhancer. Science. 2008;321:1346–1350. doi: 10.1126/science.1159974. [DOI] [PMC free article] [PubMed] [Google Scholar]
- Prescott SL, Srinivasan R, Marchetto MC, Grishina I, Narvaiza I, Selleri L, Gage FH, Swigut T, Wysocka J. Enhancer Divergence and cis-Regulatory Evolution in the Human and Chimp Neural Crest. Cell. 2015:1–17. doi: 10.1016/j.cell.2015.08.036. [DOI] [PMC free article] [PubMed] [Google Scholar]
- Pyron RA, Burbrink FT, Wiens JJ. A phylogeny and revised classification of Squamata, including 4161 species of lizards and snakes. BMC Evol Biol. 2013;13:1–1. doi: 10.1186/1471-2148-13-93. [DOI] [PMC free article] [PubMed] [Google Scholar]
- Rallis C, Bruneau BG, Del Buono J, Seidman CE, Seidman JG, Nissim S, Tabin CJ, Logan MPO. Tbx5 is required for forelimb bud formation and continued outgrowth. Development. 2003;130:2741–2751. doi: 10.1242/dev.00473. [DOI] [PubMed] [Google Scholar]
- Reilly SK, Yin J, Ayoub AE, Emera D, Leng J, Cotney J, Sarro R, Rakic P, Noonan JP. Evolutionary genomics. Evolutionary changes in promoter and enhancer activity during human corticogenesis. Science. 2015;347:1155–1159. doi: 10.1126/science.1260943. [DOI] [PMC free article] [PubMed] [Google Scholar]
- Romanes GJ. Darwin and after Darwin: An exposition of the Darwinian theory and a discussion of post-Darwinian questions. Chicago: The Open court publishing company; 1892. [Google Scholar]
- Sagai T, Hosoya M, Mizushina Y, Tamura M, Shiroishi T. Elimination of a long-range cis-regulatory module causes complete loss of limb-specific Shh expression and truncation of the mouse limb. Development. 2005;132:797–803. doi: 10.1242/dev.01613. [DOI] [PubMed] [Google Scholar]
- Sagai T, Masuya H, Tamura M, Shimizu K, Yada Y, Wakana S, Gondo Y, Noda T, Shiroishi T. Phylogenetic conservation of a limb-specific, cis-acting regulator of Sonic hedgehog (Shh) Mamm Genome. 2004;15:23–34. doi: 10.1007/s00335-033-2317-5. [DOI] [PubMed] [Google Scholar]
- Sekine K, Ohuchi H, Fujiwara M, Yamasaki M, Yoshizawa T, Sato T, Yagishita N, Matsui D, Koga Y, Itoh N, et al. Fgf10 is essential for limb and lung formation. Nat Genet. 1999;21:138–141. doi: 10.1038/5096. [DOI] [PubMed] [Google Scholar]
- Shimodaira H, Hasegawa M. CONSEL: for assessing the confidence of phylogenetic tree selection. Bioinformatics. 2001;17:1246–1247. doi: 10.1093/bioinformatics/17.12.1246. [DOI] [PubMed] [Google Scholar]
- Tanaka M, Münsterberg A, Anderson WG, Prescott AR, Hazon N, Tickle C. Fin development in a cartilaginous fish and the origin of vertebrate limbs. Nature. 2002;416:527–531. doi: 10.1038/416527a. [DOI] [PubMed] [Google Scholar]
- Tchernov E, Rieppel O, Zaher H, Polcyn MJ, Jacobs LL. A fossil snake with limbs. Science. 2000;287:2010–2012. doi: 10.1126/science.287.5460.2010. [DOI] [PubMed] [Google Scholar]
- Ullate-Agote A, Milinkovitch MC, Tzika AC. The genome sequence of the corn snake (Pantherophis guttatus), a valuable resource for EvoDevo studies in squamates. Int J Dev Biol. 2014;58:881–888. doi: 10.1387/ijdb.150060at. [DOI] [PubMed] [Google Scholar]
- VanderMeer JE, Ahituv N. cis-regulatory mutations are a genetic cause of human limb malformations. Dev Dyn. 2011;240:920–930. doi: 10.1002/dvdy.22535. [DOI] [PMC free article] [PubMed] [Google Scholar]
- Villar D, Berthelot C, Aldridge S, Rayner TF, Lukk M, Pignatelli M, Park TJ, Deaville R, Erichsen JT, Jasinska AJ, et al. Enhancer evolution across 20 mammalian species. Cell. 2015;160:554–566. doi: 10.1016/j.cell.2015.01.006. [DOI] [PMC free article] [PubMed] [Google Scholar]
- Visel A, Blow MJ, Li Z, Zhang T, Akiyama JA, Holt A, Plajzer-Frick I, Shoukry M, Wright C, Chen F, et al. ChIP-seq accurately predicts tissue-specific activity of enhancers. Nature. 2009;457:854–858. doi: 10.1038/nature07730. [DOI] [PMC free article] [PubMed] [Google Scholar]
- Visel A, Minovitsky S, Dubchak I, Pennacchio LA. VISTA Enhancer Browser–a database of tissue-specific human enhancers. Nucleic Acids Research. 2007;35:D88–D92. doi: 10.1093/nar/gkl822. [DOI] [PMC free article] [PubMed] [Google Scholar]
- Vonk FJ, Casewell NR, Henkel CV, Heimberg AM, Jansen HJ, McCleary RJR, Kerkkamp HME, Vos RA, Guerreiro I, Calvete JJ, et al. The king cobra genome reveals dynamic gene evolution and adaptation in the snake venom system. Proc Natl Acad Sci USA. 2013;110:20651–20656. doi: 10.1073/pnas.1314702110. [DOI] [PMC free article] [PubMed] [Google Scholar]
- Wang H, Yang H, Shivalila CS, Dawlaty MM, Cheng AW, Zhang F, Jaenisch R. One-Step Generation of Mice Carrying Mutations in Multiple Genes by CRISPR/Cas-Mediated Genome Engineering. Cell. 2013 doi: 10.1016/j.cell.2013.04.025. [DOI] [PMC free article] [PubMed] [Google Scholar]
- Wittkopp PJ, Kalay G. Cis-regulatory elements: molecular mechanisms and evolutionary processes underlying divergence. Nat Rev Genet. 2012;13:59–69. doi: 10.1038/nrg3095. [DOI] [PubMed] [Google Scholar]
- Wray GA. The evolutionary significance of cis-regulatory mutations. Nat Rev Genet. 2007;8:206–216. doi: 10.1038/nrg2063. [DOI] [PubMed] [Google Scholar]
- Wright AM, Lyons KM, Brandley MC, Hillis DM. Which came first: The lizard or the egg? Robustness in phylogenetic reconstruction of ancestral states. J Exp Zool B Mol Dev Evol. 2015;324:504–516. doi: 10.1002/jez.b.22642. [DOI] [PubMed] [Google Scholar]
- Xiao S, Xie D, Cao X, Yu P, Xing X, Chen CC, Musselman M, Xie M, West FD, Lewin HA, et al. Comparative epigenomic annotation of regulatory DNA. Cell. 2012;149:1381–1392. doi: 10.1016/j.cell.2012.04.029. [DOI] [PMC free article] [PubMed] [Google Scholar]
- Yang H, Wang H, Jaenisch R. Generating genetically modified mice using CRISPR/Cas-mediated genome engineering. Nat Protoc. 2014;9:1956–1968. doi: 10.1038/nprot.2014.134. [DOI] [PubMed] [Google Scholar]
- Yang H, Wang H, Shivalila CS, Cheng AW, Shi L, Jaenisch R. One-step generation of mice carrying reporter and conditional alleles by CRISPR/Cas-mediated genome engineering. Cell. 2013;154:1370–1379. doi: 10.1016/j.cell.2013.08.022. [DOI] [PMC free article] [PubMed] [Google Scholar]
- Zeller R, Zuniga A. Shh and Gremlin1 chromosomal landscapes in development and disease. Curr Opin Genet Dev. 2007;17:428–434. doi: 10.1016/j.gde.2007.07.006. [DOI] [PubMed] [Google Scholar]
- Zeller R, Lopez-Rios J, Zuniga A. Vertebrate limb bud development: moving towards integrative analysis of organogenesis. Nat Rev Genet. 2009;10:845–858. doi: 10.1038/nrg2681. [DOI] [PubMed] [Google Scholar]
Associated Data
This section collects any data citations, data availability statements, or supplementary materials included in this article.
Supplementary Materials
Shown is the core ~800 bp of the mouse ZRS enhancer aligned with the orthologous sequences from 17 different vertebrate species, including cartilaginous and bony fishes (elephant shark and coelacanth), five snakes (boa constrictor, Burmese python, speckled rattlesnake, viper and king cobra) and ten limbed tetrapods. Blastn was used to identify sequences orthologous to the mouse ZRS sequence. Colors indicate different nucleotides. Tetrapod-conserved ETS motifs are shown (orange boxes). 17 bp snake-specific deletion overlapping E1 motif is indicated. See Figures 4, 5 and Figure S5 for more details.
(A–C) Branch lengths indicate absolute substitution rate for ZRS enhancer (A, B) or all other limb specific enhancer sequences from the VISTA enhancer browser (C). Colors indicate the relative evolutionary rate of the ZRS (A, B) or all other limb specific enhancers (C) compared to forebrain specific enhancers (A, C) or to other limb specific enhancers (B) from the VISTA enhancer browser. This is consistent with the recent observation that other limb enhancers are conserved in snakes (Infante et al., 2015). This sequence conservation has been ascribed to functions in the development of vestigial limb structures in basal snakes or pleiotropic functions in structures outside the limb. Mouse ZRS transgenic reporter assays show no reproducible staining outside the limb, and ZRS deletion studies in mice indicate no phenotypes beyond limb defects, suggesting that the function of the ZRS is restricted to limb development (Lettice et al., 2003; Sagai et al., 2005).
We used CRISPR/Cas9 technology to replicate the enhancer deletion to exclude possible effects of the neomycin cassette and genetic background on the phenotype observed by Sagai et al. (Sagai et al., 2005).
(A) Schematic overview of the strategy. A 4.5 kb mouse genomic region containing the ZRS (red) is shown together with the vertebrate sequence conservation track (dark blue). The sgRNA recognition site is indicated in purple. A mouse with a CRISPR/Cas9-induced 1324 bp deletion (chr5:29,314,497-29,315,820; mm10) similar to the deletion from Sagai et al. was selected for further analysis. Genotyping primers are indicated as blue arrows (F and R). A 3780 bp ‘donut‘ transgenic reporter was used to detect residual enhancer activity outside of the deleted region.
(B) Representative E11.5 transgenic mouse embryo injected with a reporter under control of the ‘donut‘ sequence. No reproducible limb activity was detected in 6/6 independent transgenic embryos.
(C) PCR genotyping of the ZRS enhancer knock-out mice.
(D) The PCR product from ZRSΔ/Δ mice was sequenced to identify the deletion breakpoint.
(E) Gross phenotypes of two week old ZRSWT/Δ (top) and ZRSΔ/Δ (bottom) mice. The body sizes are comparable, but ZRSΔ/Δ mice have truncated limbs. Scale bars, 10 mm.
(F) Skeletal phenotypes of E18.5 limbs from ZRSWT/Δ (top) and ZRSΔ/Δ (bottom) embryos; s, scapula; h, humerus; r, radius; u, ulna; fe, femur; fi, fibula; t, tibia; a, autopod. The humerus, radius, and ulna of the ZRSΔ/Δ E18.5 forelimb appear to be fused, while no recognizable autopod is present. The zeugopod of the hindlimb is severely reduced, and the autopod is represented by just one rudimentary digit. Overall, the limb phenotype of the CRISPR ZRS knock-out mouse reproduces the limb phenotype observed in ShhΔ/Δ and ZRSNeo/Neo (Sagai et al., 2005) knock-out mice. Scale bars, 2 mm.
(A) Schematic overview of strategy. A 4.5 kb mouse genomic region containing the ZRS enhancer (red) is shown together with the vertebrate conservation track (dark blue). The donor vector contained two homology arms (grey, indicated as HA-L and HA-R) and a corresponding replaced region (blue) with borders exactly matching the deletion breakpoints from the ZRS deletion allele (Figure S3). The sgRNA recognition site is indicated in purple. PCR primers used for genotyping are shown as arrows (left-F, right-R - mouse specific, outside of the homology arms; right-F, left-R - species specific, inside the replaced region).
(B) PCR genotyping analysis of F0 human ZRS knock-in mice using primer pairs left-F/left-R-H and right-F-H/right-R to confirm the correct integration of the left (HA–L) and the right (HA–R) homology arms, respectively. Numbers indicate independent founder mice. WT - wild-type mouse.
(C–F) PCR genotyping analysis of F0 ZRS knock-in mice containing the alleles from python (C, left-F/left-R-P and right-F-P/right-R primers), king cobra (D, left-F/left-R-KC and right-F-KC/right-R primers), coelacanth (E, left-F/left-R-C and right-F-C/right-R primers), and resurrected python (F, left-F/left-R-RP and right-F-RP/right-R primers). All fragments were sequence-verified by Sanger sequencing.
(G) Comparative Shh RNA in situ hybridization analysis in knock-in mouse embryos during the onset of hindlimb bud development. Per knock-in line, the Shh transcript distribution was reproduced in at least n = 3 independent mouse embryos. The genotypes of the embryos are ZRSWT/Δ (mouse), ZRShZRS/Δ (human), ZRSpZRS/Δ (python), ZRScZRS/Δz (cobra), ZRSfZRS/Δ (coelacanth fish) and ZRS Δ/Δ. Scale bars, 0.1 mm.
(H–J) A range of autopod skeletal phenotypes observed in wild-type (H, ZRSWT/Δ), heterozygous human knock-in (I, ZRShZRS/Δ), and coelacanth fish knock-in (J, ZRSfZRS/Δ) knock-in mice. Asterisks indicate extra- (**) or existing (*) digit fusions. Numbers of embryos that exhibited respective limb phenotype over the total number of embryos with the genotype are indicated.
(A) Strategy for in vivo resurrection of the snake limb enhancer function. A 17 bp sequence from the lizard ZRS ortholog was introduced into the python ZRS, and the resulting snake allele (1341 bp) containing modified python ZRS was inserted into the mouse genome in place of the wild-type mouse ZRS using CRISPR/Cas9 (see Figure S4 and Method Details).
(B) Limb skeletal phenotypes of the knock-in mice with the python ZRS (pZRS) enhancer (top) and the “resurrected“ python ZRS enhancer (pZRS(r)). Number of embryos that exhibited representative limb phenotype over the total number of embryos with the genotype are indicated. Scale bars, 2 mm.
(C) Distribution of predicted ETS1 binding sites in the ZRS for 17 jawed vertebrates. PWMs (Position Weight Matrixes) for ETS1 were used to search for all possible motif matches (FIMO P-value < 0.0032) in the ZRS from each species. Predicted binding sites were mapped to the multi-species alignment (right; see Figure S1). Binding sites that are conserved in tetrapods are indicated at top (ETS1, E0-4). Position of cobra- and rattlesnake-specific insertions is indicated in pink (Figure S1). A dashed line indicates a sequencing gap in the viper ZRS sequence.
Table S1. Genome sequence data used in the study, Related to Figure 1
Table S2. Orthologous ZRS sequences used for lacZ transgenic reporters, Related to Figure 2
Table S3. Extended orthologous ZRS sequences and homology arms used for knock-in experiments, Related to Figure 3
Table S4. Significance testing for evolutionary rates (Permutation test), Related to Figure 2
Table S5. Representative transcription factor motifs that show increase in relative substitution rate in snakes compared to non-snake species, Related to Figure 5
Table S6. Primers used in the study, Related to Figure 3