Abstract
Purpose
Assessment of brain hemodynamics without exogenous contrast agents is of increasing importance in clinical applications. This study aims to develop an MR perfusion technique that can provide non-contrast and multi-parametric estimation of hemodynamic markers.
Methods
We devised an Arterial-Spin-Labeling (ASL) method based on the principle of MR Fingerprinting (MRF), referred to as MRF-ASL. By taking advantage of the rich information contained in MRF sequence, up to seven hemodynamic parameters can be estimated concomitantly. Feasibility demonstration, flip angle optimization, comparison with Look-Locker ASL, reproducibility test, sensitivity to hypercapnia challenge, and initial clinical application in an intracranial steno-occlusive process, Moyamoya disease, were performed to evaluate this technique.
Results
MRF-ASL provided estimation of up to seven parameters, including B1+, tissue T1, cerebral blood flow (CBF), tissue bolus-arrival-time (BAT), pass-through arterial BAT, pass-through blood volume, and pass-through blood travel time. Coefficients-of-variation (CoV) of the estimated parameters ranged from 0.2% to 9.6%. Hypercapnia resulted in an increase in CBF by 57.7%, and a decrease in BAT by 13.7% and 24.8% in tissue and vessels, respectively. Patients with Moyamoya disease showed diminished CBF and lengthened BAT that could not be detected with regular ASL.
Conclusion
MRF-ASL is a promising technique for non-contrast, multi-parametric perfusion assessment.
Keywords: arterial spin labeling, perfusion, cerebral blood flow, magnetic resonance fingerprinting, hypercapnia, CO2, Moyamoya Disease
INTRODUCTION
Assessment of brain hemodynamics plays a critical role in the diagnosis and treatment selection in patients with cerebrovascular disease, such as Moyamoya Disease (MMD) (1,2), atherosclerosis (3), and stroke (4,5). When brain perfusion imaging is needed in clinical practice, dynamic-susceptibility-contrast (DSC) MRI using gadolinium-based contrast agent is the most widely used method, which uses rapid tracking of contrast bolus inside the brain to estimate hemodynamic parameters (6). Despite the fact that the use of contrast agent increases the cost of care and that some patients with poor kidney function may develop a potentially lethal complication called nephrogenic systemic fibrosis (7), DSC remains the procedure of choice in assessment of perfusion in patients.
Arterial Spin Labeling (ASL) allows for non-invasive evaluation of perfusion using endogenous water spins as the tracer. A recent consensus paper (8) has provided the community with a summary guideline of recommended protocols and implementations for standardized clinical application, showing great promise of ASL. However, for applications in cerebrovascular disease, significant technical gaps remain. For instance, extra or intracranial arterial stenoses may cause a delay in bolus arrival, resulting in an underestimation of CBF in some regions with overestimation in others (9). Additionally, tissue T1 may change with edema which will again cause a bias in cerebral blood flow (CBF) estimation. These issues reveal a fundamental limitation of the current ASL technique. That is, multiple physiological parameters are involved in the determination of ASL signal, but we only have one experimental observable. Therefore, overfitting of the limited experimental measure results in potential bias in CBF estimation, especially in cerebrovascular patients in whom assumptions on T1 and bolus arrival time cannot be confidently made.
Magnetic Resonance Fingerprinting (MRF) is a recently developed technique that can estimate multiple MR parameters concomitantly using dynamic signal patterns (10). In MRF acquisition, imaging parameters (e.g. TR) are intentionally varied with time, thus producing a non-steady-state signal time course. This time course is affected by multiple MR properties such as T1, T2, B1+, proton density, etc. A database of “virtual voxels”, each with a specific set of MR properties, can be generated with Bloch simulation. Thus, by comparing the experimentally measured time course with the database, one can find the best match, through which multiple MR properties can be obtained in one step. ASL presents an ideal application for the MRF principle for two reasons (11,12): 1) ASL signal is inherently affected by multiple parameters. As a matter of fact, ASL researchers are often frustrated by the fact that in the kinetic perfusion model there are too many unknown parameters (e.g. CBF, bolus arrival time, tissue T1 property, etc.). By using MRF acquisition, we can take advantage of, rather than being limited by, the multi-parametric nature of ASL signal. 2) MRF requires that spin history is partially preserved across TRs, that is, signal acquired at present TR is influenced by spin events several TRs ago. This concept is highly similar to the ASL in which the MR signal is modulated by the incoming labeled blood spins that are tagged a few seconds ago.
Here we proposed a novel ASL sequence based on MRF that has the ability to estimate multiple hemodynamic parameters concomitantly in a single scan. Distinctive features of our proposed method, referred to as MRF-ASL, include that there is no strict pairing of labeled and control scans, the labeling duration is time-dependent across TRs, and that the labeled spins, by design, are to affect the imaging signal not in the same TR, but several TRs later. We hypothesize that the main advantage of MRF-ASL is that traditional ASL outcome variables such as CBF can be more reliably estimated (because the confounding factors such as T1, B1 and bolus arrival time can be teased apart) and new hemodynamic parameters can be estimated from the same scan. In the present study, feasibility demonstration, flip angle dependence, comparison with Look-Locker ASL, reproducibility test, sensitivity to hypercapnia challenge, and initial clinical application in arterial-stenotic disease were performed to evaluate this technique.
METHODS
MRF-ASL Pulse Sequence
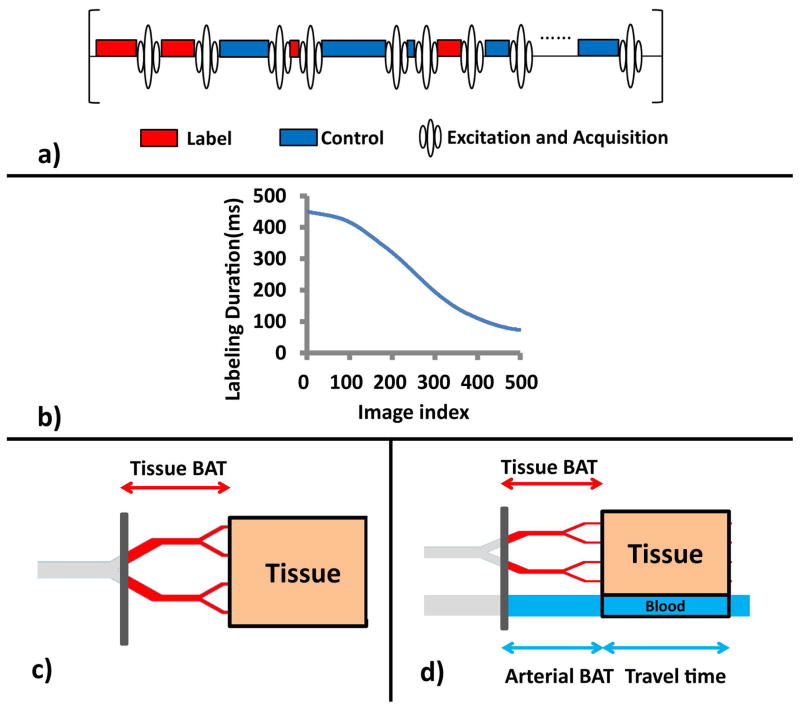
Figure 1a depicts a schematic diagram of the proposed sequence. Compared to conventional ASL, there are four main differences in this sequence. One is that there is no post-labeling delay (PLD) in our sequence. PLD is necessary in conventional ASL to allow labeled spins to reach the tissue compartment. However, it is inefficient since it is a completely idle time. In MRF-ASL, the spins labeled in one TR will actually manifest their effects in images acquired several TRs later. Thus, delays to allow the spins labeled in the present TR to influence signal acquired in the same TR are not necessary. The second feature is that there is no strict pairing of label (red) and control (blue) scans. Since the CBF estimation is based on signal pattern matching rather than control-label subtraction, such pairing is no longer needed. In fact, the strict pairing (i.e. label-control-label-control order) may be detrimental for MRF-ASL, as their influence on signal (acquired several TRs later) may be canceled out. Thus, in our sequence, the control and label scans are pseudo-randomly assigned. The third difference is that the labeling duration (thereby TR) is now varying. In this study, our sequence uses 500 TRs with the labeling duration varying with a Perlin noise function (Figure 1b), following the strategy used in the original MRF report (10). Note that, in the present study, the experiments (in all participants and for all runs) used the same pseudo-random control/label order and the same TR orders. The final difference which is not apparent in the diagram in Figure 1a is that the excitation flip angle is no longer 90°, as we want to preserve some effects of the incoming spins to influence the signal of next TR. In this study, we first tested a range of flip angles to evaluate the dependence of the results on flip angle choice, and used an optimized flip angle for the remainder of the study.
Figure 1.
a) Schematic diagram of the MRF-ASL pulse sequence. The sequence consists of varying-duration, randomly ordered control and label blocks, each followed immediately by an acquisition. b) Label and control duration as a function of image index. c) Illustration of the single-compartment model, consisting of a tissue compartment (brown). d) Illustration of the two-compartment model, which consists of a tissue compartment (brown), and a pass-through artery compartment (blue). Note that arterial BAT is expected to be considerably shorter than tissue BAT. However, since the diagram here is shown in spatial scale, they are illustrated in similar line lengths to reflect that the travel distances for the arterial and tissue compartments are comparable.
Signal Modeling
Two-models were considered in understanding the signal mechanism of MRF-ASL. One is a single-compartment model, in which the imaging voxel is assumed to contain tissue only (Figure 1c). The advantage of this model is that it contains fewer parameters (i.e. CBF, BAT, tissue T1, B1+), thus the estimated parametric map has a higher SNR. We also considered a two-compartment model, depicted in Figure 1d, which includes an additional compartment of pass-through artery (blue in Figure 1d). The spins in the pass-through artery do not perfuse neural tissue in the current voxel. Thus, they are the primary source of potential vascular artifacts in ASL. In this study, the experimental MRF-ASL data were analyzed using both models.
Because the single-compartment model is relatively straightforward and is nested in the two-compartment model, we will focus on describing the two-compartment model below.
With the two-compartment model, the longitudinal magnetization in the MRF-ASL is a weighted sum of tissue and pass-through blood compartments in the voxel and can be written as:
| [1] |
where vblood is the volume fraction of the pass-through artery compartment (%), ρtissue is the tissue density (1.05 g/ml) (13), Mtissue is the magnetization of the tissue compartment (MR signal/100g tissue), and Mblood is the magnetization of the pass-through artery compartment (MR signal/100ml blood). Note that the expressions of the tissue and blood signals are slightly different in that one is defined in signal per 100g and the other is defined in signal per 100ml, and that one contains a density (ρ) term while the other does not. This is necessary in order to obtain a CBF value in the unit of per 100g tissue instead of 100ml tissue. The tissue and pass-through artery compartments are modeled as having no spin exchange. The tissue magnetization follows the formulation of the conventional perfusion General Kinetic Model (GKM). The pass-through artery is modeled as a non-permeable tube with a volume of vblood and a mean travel time (i.e. the time it takes for a spin to travel through the tube).
Specifically, Mtissue can be described by (14):
| [2] |
where M0,tissue is the equilibrium magnetization of tissue, T1,tissue is tissue T1, T1app is given by 1/T1app = 1/T1,tissue + f/λ, where λ is the blood-brain partition coefficient (0.9 ml/g) (15), f is the CBF (ml/100g/min). Minput (in units of MR signal/100ml blood) is the arterial input function for the tissue. It is a parameter distinctive in MRF-ASL in that it varies from one TR to another and is determined by multiple factors including the history of label/control conditions, the tissue bolus arrival time (BAT), T1 of blood (1664 ms) (16). Minput can be obtained by shifting the control/label timing paradigm by bolus arrival time (BAT) and accounting for blood T1 relaxation. Also distinctive in MRF-ASL, the initial condition of Mtissue is different for different TR periods. Specifically, Mtissue at t=0 in a TR is determined by Mtissue · cos α at the end of the previous TR, due to the fact that the excitation flip angle, α, is no longer 90 degrees in order to allow the blood spins labeled in the previous TRs to be measured in the present TR. Note that α is the actual excitation flip angle, and is determined by the nominal flip angle, αNominal and B1+.
Mblood can be calculated by the sum of magnetization of blood spins in the pass-through artery. Specifically, Mblood can be written as:
| [3] |
where M0,blood is the equilibrium magnetization of blood, T1,blood is blood T1, η is pass-through blood travel time, Minput is the input function for the pass-through artery, Moutput describes the magnetization of spins leaving the blood compartment. Minput can be obtained by shifting the control/label timing paradigm by arterial bolus arrival time (aBAT) and accounting for blood T1 relaxation. Moutput can be obtained by shifting the control/labeling timing paradigm by aBAT+η, accounting for blood T1 relaxation, and considering the saturation effects of prior RF excitations by replacing Minput(t) with Minput(t) * cos (α) for t between τ-η and τ. In this report, we model pass-through arterial flow as plug flow (thus a single arterial BAT value). But it could be extended to laminar or turbulent flow (which will have a distribution of BAT values).
The measured signal in MRF-ASL is M · sin α and the experimental data is a time course of MR signal intensity across many (e.g. 500) TR periods.
In the single-compartment model, the following four are the unknown parameters and will be concomitantly estimated from a single scan of MRF-ASL: B1+, T1,tissue, CBF, tissue BAT. In the two-compartment model, three additional parameters are included: pass-through arterial BAT, pass-through blood volume (vblood), and pass-through blood travel time, resulting in a total of seven unknown parameters estimated concomitantly.
Simulation
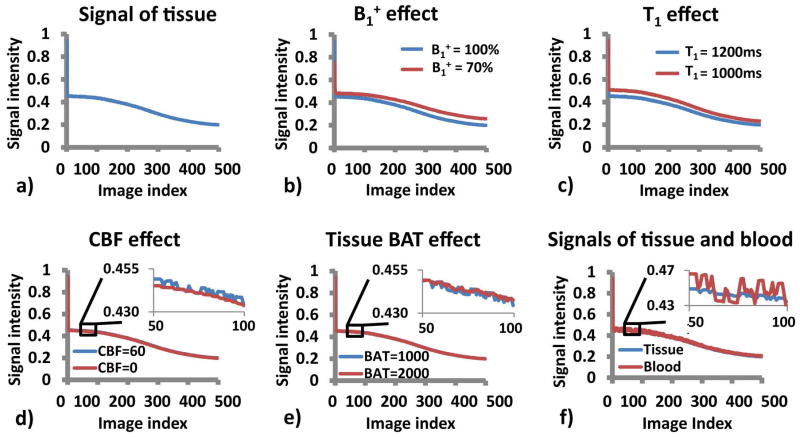
To separately evaluate the tissue and pass-through arterial signal behavior, we first performed simulations to study the signal evolution in a voxel containing only tissue (i.e. single-compartment model). We defined a hypothetical tissue voxel with the following parameters: B1+ = 100%, tissue T1 = 1200 ms, CBF = 60 ml/100g/min, tissue BAT = 1000 ms. A signal time course was then generated by solving the Bloch equation in a piecewise manner. We then varied the parameters one at a time to study the influence of each parameter on the measured signal. Specifically, we performed four additional simulations, each time with one parameter changed to the following but the other three remained the same as above: B1+ = 70%, tissue T1 = 1000 ms, CBF = 0 ml/100g/min, tissue BAT = 2000 ms. These simulations serve to show that the influence of each parameter on the signal time course is unique such that the effects of different parameters can be teased apart when comparing the experimental data to the model and dictionary.
We also simulated the effect of pass-through artery on the MRF-ASL time course by considering a voxel containing 95% tissue and 5% pass-through artery (i.e. two-compartment model), with the following pass-through arterial parameters: arterial BAT = 700 ms and blood travel time = 1000 ms. The tissue parameters were set to be the same as above. The signal evolution of this voxel was compared to that of a pure tissue voxel.
MRI Experiments
The study was approved by our Institutional Review Board. All subjects gave informed written consent before participation. All experiments were performed on a 3T (Philips Healthcare, Best, The Netherlands) system using body coil for transmission and a 32 channel head coil for receiving. A total of thirteen participants were studied.
Five healthy subjects (age 30 ± 8 years; range 21–42 years; 2 males and 3 females) were studied to examine the dependence of the MRF results on excitation flip angle and for comparison with a conventional Look-Locker multi-delay method. For the flip angle study, each participant received 9 MRF-ASL scans (runs) with the following excitation flip angle, respectively: 10, 20, 30, 40, 50, 60, 70, 80, 90 degrees. Other imaging parameters were the same for all scans: 500 TRs, duration of the label/control periods varied from 72 to 450 ms, the label and control TRs were randomized, no post-labeling-delay, gradient echo EPI acquisition, voxel size = 2.81×2.81×10 mm, field-of-view (FOV) = 180×180 mm, single slice, TE = 9.3 ms, SENSE factor = 2.4, scan duration = 3 min 10 s. To compare the MRF-ASL method with Look-Locker method (17), we performed a pulsed ASL Look-Locker technique (18,19) in which the sequence used a QUASAR labeling scheme and an acquisition of initial TI=40 ms, interval=300 ms, 13 TIs, flip angle = 35°, 24 averages, scan duration = 3 minutes 12 seconds. A single-delay pCASL (20) scan was also performed with the following parameters: gradient echo EPI, voxel size = 2.81×2.81×10 mm, one slice, FOV = 180×180 mm, flip angle = 90°, TE = 9.3 ms, SENSE factor = 2.4, labeling duration = 1800 ms, post-labeling delay = 1800 ms, 24 averages, and scan time 3 min 12s.
Five healthy subjects (age 25 ± 2 years; range 23–28 years; 2 males and 3 females) were studied to test reproducibility of the MRF-ASL technique and evaluate its sensitivity to hypercapnia challenge. The subject wore a nose clip and breathed via a mouthpiece while they were scanned in a supine position. End-tidal CO2 (Capnogard, Model 1265) was monitored and recorded continuously on a laptop. The scanning procedure was as follows. Under room-air breathing, a single-delay pCASL was performed. Then MRF-ASL sequence was performed three times to test the reproducibility of the technique. The MRF sequence used a flip angle of 70°, based on results from the flip-angle study described above. Then, the inhaled air was switched to a hypercapnic gas (5% CO2, 21% O2, and 74% N2) and 2 min of waiting time was used to allow the individual’s physiology to stabilize at the hypercapnic state. The MRF-ASL sequence was performed again to test the sensitivity of the technique in detecting hemodynamic alterations. Note that hypercapnia is known to enhance perfusion (e.g. increase in CBF and decrease in BAT).
Three patients with Moyamoya Syndrome (MMS) (age 35 ± 3 years; range 32–38 years; 2 males and 1 female) were studied to provide an initial demonstration of potential clinical utility. Moyamoya is a chronic and progressive steno-occlusive disease which typically involves the internal carotid artery (ICA) terminus and the proximal middle and anterior cerebral arteries (MCAs and ACAs), with development of abnormal net-like collaterals around steno-occlusive regions (21). Multiple hemodynamic parameters may be compromised in MMD, thus it is important to separately evaluate these abnormalities (1,22). Patient 1 was diagnosed with right ICA occlusion. Patient 2 had right supraclinoid ICA and MCA occlusions. Patient 3 had bilateral MCA occlusions. Time-Of-Flight (TOF) MR angiography and conventional pCASL scans were also performed. The pCASL scan used a single delay. The imaging parameters of TOF were: 3D FFE, voxel size = 0.48×0.75×0.5 mm3, FOV = 170×170×75 mm3, flip angle = 20°, TE = 3.5 ms, TR = 25 ms, SENSE factor = 2, scan time = 5 min 5s.
Data Analysis
In MRF, estimation of parameters is conducted by comparing the experimental data, in our case the MRF-ASL signal time course, to a pre-defined database to find the entry that provides the best match to the experimental data, then the parameter values used to generate this entry is assigned as the estimated parameters. The database is generated by sampling the parametric space and performing Bloch simulation for each parameter set. For example, we can choose one set of parameter values for (B1+, tissue T1, CBF, tissue BAT, pass-through arterial BAT, pass-through blood volume, pass-through blood travel time) and generate one entry in the database. Then, we can modify one parameter value and generate another entry. This process is repeated for many times until all possible parameter sets have been sampled at sufficient interval. This forms a complete database.
In this work, each data set was analyzed with both single-compartment and two-compartment models. For the single-compartment analysis, a four-dimensional MRF-ASL database was generated with the following parameters: B1+ (70–110% at 2% interval), tissue T1 (500–5000 ms at 20ms interval below 2000ms and 300ms interval above 2000ms), CBF (0–150 ml/100g/min at 6ml/100g/min interval), and tissue BAT (100–2000 ms at 100 interval). For the two-compartment analysis, a seven-dimensional database was generated with the following parameters: B1+ (70–110% at 3% interval), tissue T1 (500–5000 ms at 40ms interval below 2000ms and 300ms interval above 2000ms), CBF (0–150 ml/100g/min at 6ml/100g/min interval), and tissue BAT (200–2000 ms at 200 interval), pass-through arterial BAT (200–1000 ms at 200ms interval), pass-through blood volume (0, 1–5% at 0.5% interval), and pass-through blood travel time (200–1400 ms at 200 interval). The best match was based on the highest cross-correlation coefficient between the simulated and experimental time courses.
This algorithm was implemented using in-house MATLAB (Mathworks, Natick, MA) scripts on a Linux Cluster (AMD Opteron™ Processor 6320). The generation of the seven-dimensional database (for two-compartment model) took approximately 171 gigabytes of disk space and 5 hours to generate. The processing (i.e. matching) time for each slice was approximately 2 hours. To improve reliability of the voxel-wise estimation, the image series were smoothed using a 4mm FWHM Gaussian kernel. For reproducibility study, intra-class correlation across the three repetitions was calculated after down-sampling the images by a factor of two.
For Look-Locker PASL analysis, we use the FSL-BASIL toolbox (University of Oxford, UK) (23–25), which includes both single-compartment and two-compartment models, similar to the ones used for the MRF-ASL analysis. For the conventional pCASL data, the image series were realigned to the first volume using SPM. Pair-wise subtraction was conducted for the label and control images to obtain CBF-weighted images. A standard kinetic model as suggested by the consensus paper was then used to obtain the CBF map (8).
RESULTS
Simulation
Figure 2a shows the MR signal time course of a typical gray matter voxel that does not have any pass-through arteries (T1 = 1200 ms, B1+ = 100%, CBF = 60 ml/100g/min, tissue BAT = 1000 ms). Effect of each parameter on the signal time course is shown in Figures 2b–e. It can be seen that different parameters in the model affect different features of the signal time course. The low frequency signal fluctuations are primarily determined by B1+ and T1 (Figures 2b and c). On the other hand, the high frequency fluctuations are primarily influenced by CBF and BAT (Figures 2d and e).
Figure 2.
Simulation result: a) A typical signal curve of gray matter (B1+ = 100%, tissue T1 =1200 ms, CBF = 60 ml/100g/min, tissue BAT = 1000 ms); b–e) Effect of each parameter on the signal time course; f) Signal curves of baseline tissue voxel and the voxel that contains passing-through arteries.
Figure 2f shows the signal time course of a voxel that contains pass-through arteries, illustrating the effect of vessel signals (note: noise was not added in these simulations, thus the difference reflects an actual artery effect).
Flip angle dependence
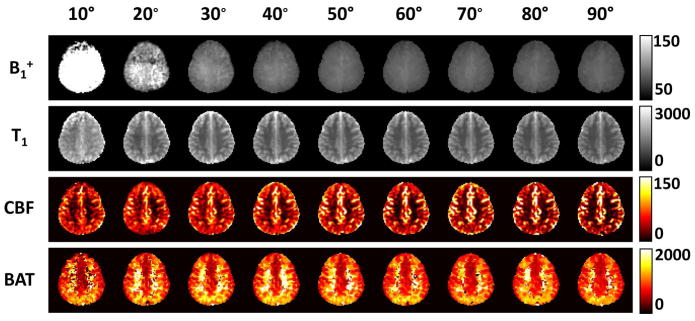
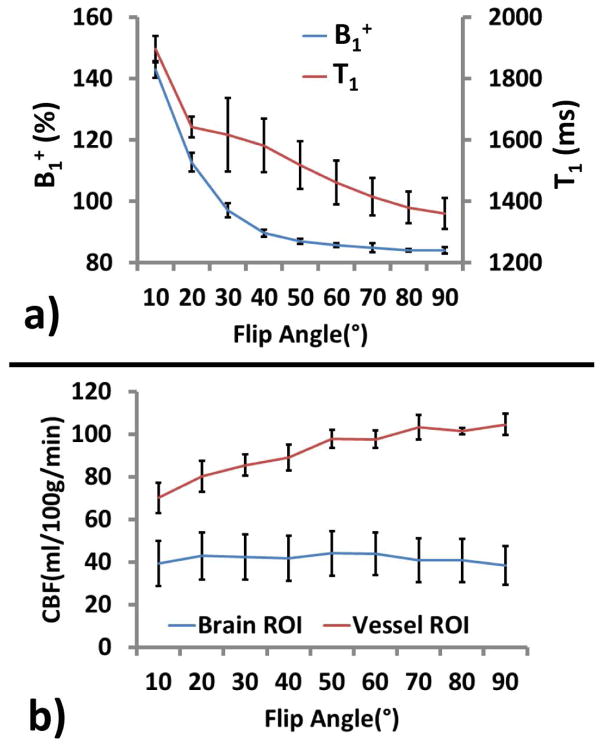
The performance of the MRF sequence was tested using a range of excitation flip angles. Figure 3 shows MRF-derived parametric maps as a function of flip angle. It is apparent that low flip angle resulted in noisier data and bias in parametric estimations. Figure 4a displays estimated B1+ and T1 values across flip angles. It can be seen that flip angles of less than 70° contains certain over-estimation in B1+ and T1. On the other hand, larger flip angle tends to over-emphasize large vessel signals, as can be seen in the hyperintensive regions in CBF maps of Figure 3. Quantitative values of estimated CBF in representative large vessel regions and in brain tissue are shown in Figure 4b. Therefore, as a tradeoff, we have primarily used a flip angle of 70° in the remaining experiments of the study. However, it should be noted that the choice of flip angle should be decided based upon the primary parameter of interest of a particular study.
Figure 3.
Parametric maps obtained from MRF-ASL data using different flip angles. Shown here are results using a single-compartment model: B1+ (%), tissue T1 (ms), CBF (ml/100g/min) and BAT (ms). The corresponding two-compartment model is shown in the supporting figure S1.
Figure 4.
Quantitative results of estimated parameters as a function of flip angle. a) Estimated B1+ and tissue T1 values as a function of flip angle; b) Estimated CBF in large vessel regions and brain tissue as a function of flip angle.
Comparison with Look-Locker PASL methods
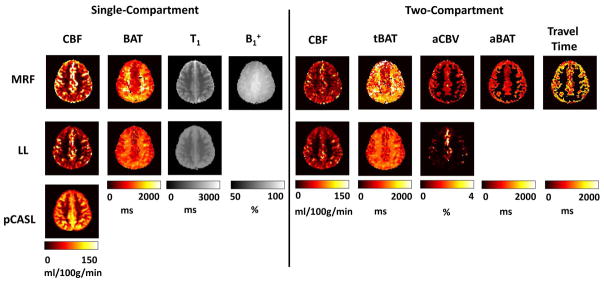
Figure 5 shows parametric maps obtained from the MRF-ASL method in comparison with those obtained from Look-Locker PASL and conventional pCASL. Both single-compartment and two-compartment results are shown for the MRF-ASL and Look-Locker PASL. For single-compartment results, it can be seen that both MRF-ASL and Look-Locker PASL were able to provide simultaneous estimations of CBF and BAT. CBF obtained by MRF-ASL yielded higher CBF values, and both CBF maps contains some outliers due to pass-through artery effects. For BAT maps, both methods showed that the white matter had longer arrival time compared to the gray matter. MRF-ASL yielded a larger dynamic range of BAT (Figure 5). Conventional pCASL provided CBF map only. MRF-ASL also provides estimations of B1+.
Figure 5.
Voxel-wise parametric maps obtained from the MRF-ASL, Look-Locker (LL) PASL and conventional pCASL sequences. MRF-ASL (top row): single-compartment derived CBF, BAT, tissue T1 and B1+; two-compartment derived CBF, tissue BAT (tBAT), pass-through blood volume (aCBV), aBAT (pass-through arterial BAT), pass-through blood travel time. Look-Locker PASL (middle row): single-compartment derived CBF, BAT, tissue T1; two-compartment derived CBF, tBAT, aCBV, aBAT and pass-through blood travel time. Conventional pCASL derived CBF (bottom row).
For two-compartment model, additional parametric maps were obtained for both MRF-ASL and Look-Locker PASL (Figure 5). MRF-ASL also provided estimations of arterial BAT and travel time maps.
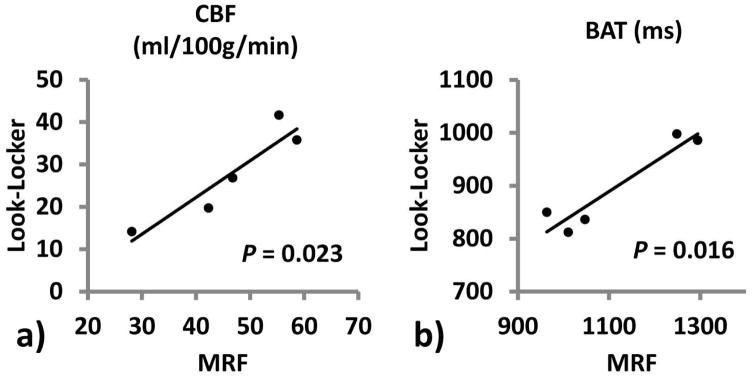
Across subjects, results from MRF-ASL and Look-Locker PASL are strongly correlated. Figure 6 shows scatter plots of single-compartment derived CBF (Figure 6a) and BAT (Figure 6b) between these two methods.
Figure 6.
Scatter plots of results between MRF-ASL and Look-Locker PASL (N=5). Panel (a) shows CBF and Panel (b) shows BAT.
Gray matter values (N=10) of the parameters are summarized in Table 1.
Table 1.
Averaged parametric values estimated from MRF-ASL in 10 healthy subjects (mean ± SD).
| Model | Parameter | Value |
|---|---|---|
| Single-Compartment | CBF | 70.9 ± 17.6 ml/100g/min |
| BAT | 971.3 ± 154.7 ms | |
| B1+ | 85.7 ± 1.4 % | |
| Tissue T1 | 1707.5 ± 18.1 ms | |
|
| ||
| Two-Compartment | CBF | 39.6 ± 8.3 ml/100g/min |
| Tissue BAT | 1159.0 ± 114.1 ms | |
| Pass-through Arterial BAT | 802.0 ± 60.9 ms | |
| Pass-through Blood Volume | 1.2 ± 0.1 % | |
| Pass-through Travel Time | 1083.5 ± 38.0 ms | |
Reproducibility
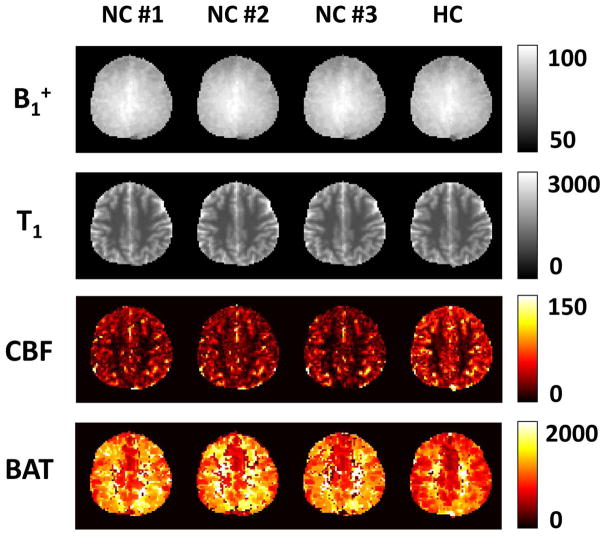
Figure 7 (left panels) shows test-retest reproducibility results of B1+, tissue T1, CBF and BAT maps. Intra-class correlations were found to be 0.989 ± 0.006, 0.984 ± 0.009, 0.631 ± 0.254 and 0.723 ± 0.091 respectively. Coefficient-of-variation (CoV) of all estimated parameters, calculated as standard deviation across repetitions divided by mean, is shown in Table 2.
Figure 7.
Test-retest reproducibility and hypercapnia effect of MRF-derived parametric maps: B1+ (%), tissue T1 (ms), tissue CBF (ml/100g/min) and BAT (ms). NC = Normocapnia, HC = Hypercapnia.
Table 2.
Coefficient-of-variation (CoV) of parameters and change of parameters during hypercapnia in 5 healthy subjects (mean ± SD).
| Model | Parameter | Cov (%) | Change (%) |
|---|---|---|---|
| Single-Compartment | CBF | 5.1 ± 3.6 | 37.6 ± 13.6* |
| BAT | 2.4 ± 1.0 | −23.3 ± 6.1* | |
| B1+ | 0.4 ± 0.1 | 0.2 ± 0.1* | |
| Tissue T1 | 0.2 ± 0.1 | −0.4 ± 0.5 | |
|
| |||
| Two-Compartment | CBF | 9.6 ± 8.7 | 57.7 ± 27.9* |
| Tissue BAT | 3.6 ± 2.1 | −13.7 ± 6.7* | |
| Pass-through Arterial BAT | 2.2 ± 0.6 | −24.8 ± 5.5* | |
| Pass-through Blood Volume | 1.3 ± 0.8 | 7.2 ± 11.3 | |
| Pass-through Travel Time | 4.1 ± 4.1 | −18.5 ± 6.4* | |
Asterisks (*) mark the changes that were statistically significantly (P < 0.05).
Hypercapnia effects
Inhalation of 5% CO2 increased the end tidal CO2 from 42.7 ± 1.9 mmHg to 53.0 ± 1.9 mmHg (n = 5, mean ± SD). Figure 6 (right panel) shows changes in CBF and BAT during CO2 breathing. It was found that, during hypercapnia, CBF is elevated by 57.7 ± 27.9% (P = 0.014) while tissue BAT and vessel BAT are shortened by 13.7 ± 6.7 % (P = 0.0134) and 24.8 ± 5.5 % (P = 0.0011), respectively. A summary across all participants is shown in Table 2.
Experiment in Moyamoya patients
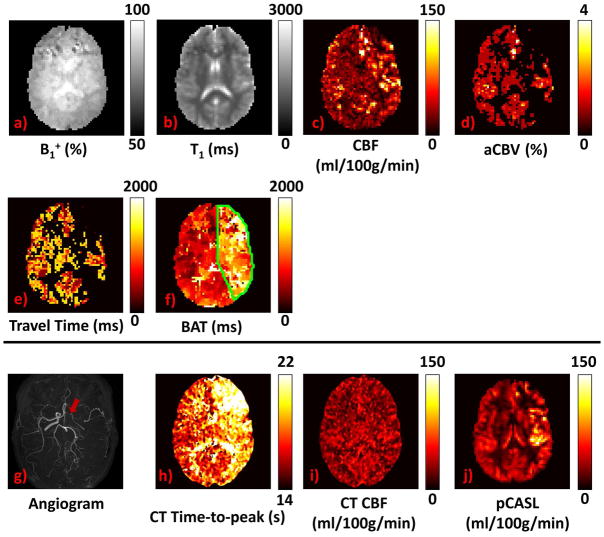
Figure 8 shows MRF-ASL parametric maps (a–f) obtained from a representative Moyamoya patient with arterial stenosis in right MCA and ACA. To compare the MRF-ASL results to other clinical images, TOF angiogram (g), CT perfusion time-to-peak map (h), CT perfusion CBF map (i), and conventional ASL CBF map (j) are also displayed. All images in this study are displayed in neurological convention. As can be seen, T1 and B1+ show no obvious abnormalities. The most notable deficit is that BAT (Figure 8f) in the stenotic side (green outlined regions) is considerably prolonged relative to the normal side. This effect is similar to observations identified in CT perfusion time-to-peak map (Figure 8h). CBF did not show obvious deficit in the stenotic side.
Figure 8.
Results from a representative Moyamoya patient (Patient 1): a) B1+ (%); b) Tissue T1 (ms); c) Tissue CBF (ml/100g/min); d) Pass-through blood volume (%); e) Pass-through blood travel time; f) BAT (ms); g) TOF angiogram, red arrow shows right ICA occlusion; h) TTP (time-to-peak, sec) map from CT perfusion scan; i) CBF (ml/100g/min) map from CT perfusion scan; j) CBF map from conventional pCASL (ml/100g/min). Note that all images are displayed in neurological convention.
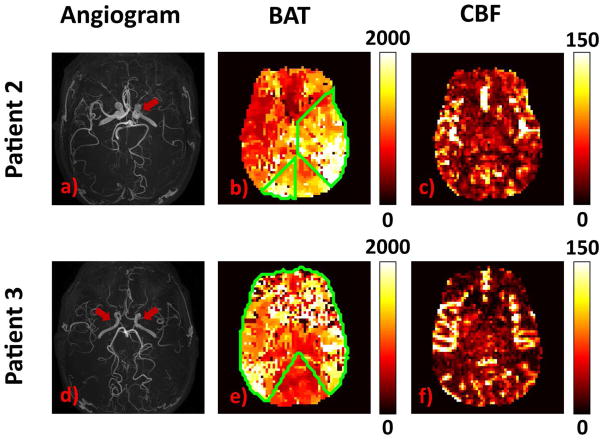
Figure 9 illustrates the results from the other two patients with Moyamoya disease. Patient 2 (upper row) has right-sided unilateral stenosis. Accordingly, prolonged BAT on the right side can be observed. Patient 3 (lower row) has bilateral stenoses, and BAT at both sides is prolonged, when compared to the posterior cerebral artery territories (thalami and medial occipital lobes).
Figure 9.
Results from Patient 2 and Patient 3 of Moyamoya Disease: Patient 2 (upper row): a) TOF angiogram, red arrow shows the right MCA occlusion; b) MRF-ASL derived BAT (ms) c) MRF-ASL derived tissue CBF map (ml/100g/min). Patient 3 (lower row): d) TOF angiogram, red arrows show bilateral MCA occlusions; e) MRF-ASL derived BAT (ms); f) MRF-ASL derived tissue CBF map (ml/100g/min). Note that all images are displayed in neurological convention.
Regions of interest analysis across all three patients revealed that the stenotic regions had a BAT of 1310 ± 79 ms, compared to that in the normal regions of 933 ± 236 ms (P = 0.028, one tail). CBF was 33.0 ± 4.0ml/100g/min and 34.5 ± 10.2 ml/100g/min in stenotic and normal regions, respectively.
DISCUSSION
In this study, we developed a Fingerprinting ASL sequence that is capable of measuring multiple hemodynamic parameters from a single scan of approximately 3 minutes. Simulation and experimental studies demonstrated the initial feasibility of this technique as well as its test-retest reproducibility. We further studied its dependence on flip angle choice and compared the MRF-ASL results to those of Look-Locker ASL. We tested the sensitivity of MRF-ASL in detecting hemodynamic alterations using hypercapnia challenge as a model, and the data revealed concomitant increase in perfusion and reduction in arrival time during CO2 inhalation. Moreover, we examined the clinical utility of MRF-ASL in patients with Moyamoya Disease, and the results showed the ability of this technique in identifying hemodynamic deficits in this population. While further technical optimization is needed, this study provides initial evidence that MRF-ASL may be a useful technique in multi-parametric studies of brain hemodynamics.
ASL is a powerful method for non-contrast assessment of perfusion. However, a potential limitation of the conventional ASL is that its signal is influenced by multiple physiological parameters, yet usually only one experimental measure is obtained. Therefore, in the absence of additional experimental measures, many of the parameters in the kinetic model, e.g. tissue T1, bolus arrival time, B1 inhomogeneity, etc. have to rely on assumptions, in order to determine CBF. Such assumptions are generally valid. However, under pathological conditions such as cerebrovascular diseases, these parameters are likely patient-specific and even region-specific, thus it is not feasible to make a “one-value-fits-all” assumption. The MRF-ASL method can potentially overcome this limitation by not only allowing heterogeneity in regional parametric values, but also teasing apart their contributions and estimating them concomitantly. The ability of multi-parametric estimation from the data is attributed to the rich information contained in the MRF acquisition, which is a strength of MRF-type pulse sequences.
ASL with multiple post-labeling delays (PLD) has been used to address the effect of BAT on CBF estimation. By acquiring ASL images at various PLDs and fitting the signal to a kinetic model, one can estimate CBF and BAT simultaneously (14,26–28). Other variants of the multi-delay method have also been proposed, including a pre-scan to obtain lower resolution BAT map (29), Hadamard time encoding to improve the efficiency of the measurement (30–33), and combining it with flow-crusher gradients (34) and Looker-Locker acquisition (18). The MRF-ASL method proposed in this work applies a similar principle to these prior techniques, but the implementation of the sequence allows estimation of other parameters such as B1+ and tissue T1. The MRF-ASL method may potentially also allow the estimation of longer BAT values (e.g. Figures 5, 6b). This is particularly useful in cerebrovascular disease, as BAT itself is an important physiological indicator of disease severity.
The hemodynamic parameters measured with MRF-ASL were in general agreement with previous literature (19,26,35,36) and are within the expected range. Similarly, our observations of an increased CBF (by about 58%) and a decreased BAT (by about 14%) during CO2 inhalation are in good agreement with reports of Ho et al. (37) and Donahue et al. (38). Overall, we found that the hemodynamic parameters estimated are reproducible across runs, with CoV of CBF and BAT being 9.6% and 3.6%, respectively. It is also interesting to note that the BAT estimation appears to be more reproducible than CBF, possibly attributed to the large number of delay times sampled in MRF-ASL. Therefore, our current data suggest that MRF-ASL may be particularly useful for non-contrast measurement of BAT or bolus time-to-peak. For CBF estimation, our general impression of the data is that CBF estimated with MRF-ASL was lower than that estimated with conventional single-delay ASL. Some of this discrepancy may be due to arterial artifact present in conventional ASL. Discrepancy in other regions is more difficult to interpret. It may be due to an over-estimation in conventional ASL or an under-estimation in MRF-ASL. Further investigation by measuring CBF with a third technique, ideally with a gold-standard method, will be necessary to identify the actual cause.
One interesting aspect of MRF-ASL data is that one can analyze the same experimental data set multiple times, each time using a different perfusion kinetic model. We reported results using both single-compartment and two-compartment models (Figure 1). In general, MRF results using a one-compartment model are more robust than that of two-compartment model. The drawback is that, in certain voxels that clearly contain large pass-through arteries, very bright spots are seen in the CBF map. The use of a two-compartment model can effectively remove such artifacts. In essence, the benefit of a two-compartment model is that the matching algorithm can (hopefully) divide the measured signal (and its fluctuation) into those attributed to tissue perfusion and those attributed to inflow in pass-through arteries. Then, hemodynamic parameters can be correctly estimated. Further investigation is needed to develop more comprehensive algorithms to determine which model is most suitable for which voxel and the final parametric map can in principle be a synthetic map in which different voxels are extracted from maps using different models.
The present study tested two different models in understanding the MRF-ASL signal and in data analysis. However, the actual signal mechanism is likely more complicated than presently modeled. One important aspect is the presence of spins in microvasculature that will supply the tissue in the voxel but has not reached the extravascular space. Since our model to differentiate tissue vs. pass-through spins is based on whether they stay in the voxel or they leave the voxel after a certain traveling time, these microvascular spins will likely be characterized as tissue spins in our analysis. Thus, the tissue BAT estimated from our two-compartment model actually reflects a mixture of tissue and microvascular BAT. We have not attempted to construct a three-compartment model to separate the microvascular spins from the true tissue spins, as the dimension of the parametric space would be too high for the fingerprinting database and searching procedures. Additionally, it should be pointed out that the present approach assumes that the hemodynamic parameters (e.g. CBF, BAT) are constant throughout the scan duration. Should these parameters change during the scan, the MRF signal time course will become different and may cause errors in the parametric estimations. Another factor that was not accounted for in the current model is the dispersion of the bolus, which should be considered in future studies. However, larger dictionary space (20–50 times larger for every new parameter added to the dictionary) and longer searching time are expected.
In the one-compartment model, we fixed three parameters, labeling efficiency, blood T1, and blood-brain-partition coefficient, by using assumptions, rather than allowing them to be variables in the dictionary. This was because these three parameters co-vary with CBF, thus one would not be able to tease apart their influence on the MRF signal time course. We have tested to add these parameters (one at time) to the four-dimensional model to make a new dictionary of five dimensions. The results showed that the maps for these parameters were noisy and do not provide usable information.
A previous report has also demonstrated the use of MRF principles in ASL (11). The method proposed in the present study is different from that previous report in the following areas. The sequence of Wright et al. followed the conventional ASL scheme of paired acquisitions of labeled and control scans, whereas our approach used a pseudo-randomized temporal order of labeled and control scans. Pseudo-randomization is expected to avoid the cancellation of control and labeling effects in the later TRs, potentially allowing more accurate estimation of long BAT values. Another difference is that our sequence does not contain a post-labeling delay, which allows more images to be collected for a given scan duration. In terms of the fingerprinting database construction, Wright et al. assumed a spatially constant B1+ of 100%, whereas our approach included B1+ as a variable (a separate dimension) in the database. We also tested the inclusion of a second compartment (i.e. pass-through arterial compartment) in the voxel model, which illustrated that our MRF-ASL data allows the simultaneous estimation of up to 7 parameters while Wright et al. estimated 3 parameters (CBF, BAT, T1). Our approach also has some similarity with another previously proposed ASL method, Pseudo-Random Arterial Modulation (PRAM) MRI (39), in that both used pseudo-randomized order in label and control arrangements. One difference in terms of pulse sequence is that the PRAM technique used a fixed TR whereas we used a varying labeling duration/TR, which allows estimation of T1 and B1+. In terms of output variables, the PRAM focuses on arterial arrival and dispersion function in relatively large vessels, but not CBF in tissue voxels.
It should be pointed out that the present work should be viewed as a proof-of-concept study, rather than a thorough optimization of the technique. While we have investigated a few important aspects of the technique such as flip angle dependence, comparison with Look-Locker ASL, test-retest reproducibility, physiological challenge response, and initial clinical demonstration, a number of points remain to be addressed. One limitation is that the spatial coverage of the current study is a 2D single slice. Multislice EPI acquisition (40) can be used to achieve more brain coverage. However, the saturation effect of the incoming spins by the lower-slice excitation pulses needs to be studied, and possible alternations to the model and MRF dictionary should be incorporated. Additionally, the sequence design (e.g. the labeling duration time series) can be further optimized. In this work, we used a Perlin function following the original MRF work (10), which was not for the purpose of ASL perfusion measurement. Therefore, it is possible that other labeling duration design will yield more robust signal and, importantly, allow a better separation and assignment of tissue versus pass-through artery contributions. Finally, it should be recognized that MR Fingerprinting is a rapidly developing field. Several technical improvements have been made to accelerate the MRF acquisition, such as implementing an iterative multiresolution compressed sensing (CS) method (41) and incorporating simultaneous multislice (SMS) acquisition in the acquisition (42). These advances should be incorporated into the MRF-ASL method presented here to allow estimation of more hemodynamic parameters, e.g. dispersion of the labeled blood bolus (43), or to estimate them more accurately.
CONCLUSION
We presented a framework of MR Fingerprinting based ASL acquisition and analysis. The potential benefit of this method is that it can take advantage of the multi-parametric nature of the ASL signal mechanism and provide concomitant estimation of several hemodynamic markers in a single scan. We showed proof-of-concept evidence in healthy volunteers and in vascular disease patients that this technique is reproducible, sensitive to the hypercapnia challenge, and also has potential clinical applications.
Supplementary Material
Supporting Figure S1: Two-compartment MRF-derived parametric maps as a function of flip angle: B1+ (%), tissue T1 (ms), CBF (ml/100g/min), tissue BAT (ms), pass-through arterial BAT (ms), pass-through blood volume (%) and pass-through blood travel time (ms).
Acknowledgments
NIH R01 MH084021, NIH R01 NS067015, NIH R01 AG042753, NIH R01 AG047972, NIH R21 NS095342, NIH R21 NS085634, and NIH P41 EB015909.
References
- 1.Lee M, Zaharchuk G, Guzman R, Achrol A, Bell-Stephens T, Steinberg GK. Quantitative hemodynamic studies in moyamoya disease: a review. Neurosurg Focus. 2009;26:E5. doi: 10.3171/2009.1.FOCUS08300. [DOI] [PMC free article] [PubMed] [Google Scholar]
- 2.Zaharchuk G, Do HM, Marks MP, Rosenberg J, Moseley ME, Steinberg GK. Arterial spin-labeling MRI can identify the presence and intensity of collateral perfusion in patients with moyamoya disease. Stroke. 2011;42:2485–2491. doi: 10.1161/STROKEAHA.111.616466. [DOI] [PMC free article] [PubMed] [Google Scholar]
- 3.Holmstedt CA, Turan TN, Chimowitz MI. Atherosclerotic intracranial arterial stenosis: risk factors, diagnosis, and treatment. Lancet Neurol. 2013;12:1106–1114. doi: 10.1016/S1474-4422(13)70195-9. [DOI] [PMC free article] [PubMed] [Google Scholar]
- 4.Latchaw RE, Alberts MJ, Lev MH, et al. Recommendations for imaging of acute ischemic stroke: a scientific statement from the American Heart Association. Stroke. 2009;40:3646–3678. doi: 10.1161/STROKEAHA.108.192616. [DOI] [PubMed] [Google Scholar]
- 5.Wang DJ, Alger JR, Qiao JX, et al. The value of arterial spin-labeled perfusion imaging in acute ischemic stroke: comparison with dynamic susceptibility contrast-enhanced MRI. Stroke. 2012;43:1018–1024. doi: 10.1161/STROKEAHA.111.631929. [DOI] [PMC free article] [PubMed] [Google Scholar]
- 6.Calamante F, Thomas DL, Pell GS, Wiersma J, Turner R. Measuring cerebral blood flow using magnetic resonance imaging techniques. J Cereb Blood Flow Metab. 1999;19:701–735. doi: 10.1097/00004647-199907000-00001. [DOI] [PubMed] [Google Scholar]
- 7.Grobner T. Gadolinium--a specific trigger for the development of nephrogenic fibrosing dermopathy and nephrogenic systemic fibrosis? Nephrol Dial Transplant. 2006;21:1104–1108. doi: 10.1093/ndt/gfk062. [DOI] [PubMed] [Google Scholar]
- 8.Alsop DC, Detre JA, Golay X, et al. Recommended implementation of arterial spin-labeled perfusion MRI for clinical applications: A consensus of the ISMRM perfusion study group and the European consortium for ASL in dementia. Magn Reson Med. 2015;73:102–116. doi: 10.1002/mrm.25197. [DOI] [PMC free article] [PubMed] [Google Scholar]
- 9.Hendrikse J, Petersen ET, Golay X. Vascular disorders: insights from arterial spin labeling. Neuroimaging Clin N Am. 2012;22:259–269. x–xi. doi: 10.1016/j.nic.2012.02.003. [DOI] [PubMed] [Google Scholar]
- 10.Ma D, Gulani V, Seiberlich N, Liu K, Sunshine JL, Duerk JL, Griswold MA. Magnetic resonance fingerprinting. Nature. 2013;495:187–192. doi: 10.1038/nature11971. [DOI] [PMC free article] [PubMed] [Google Scholar]
- 11.Wright KL, Ma D, Jiang Y, Gulani V, Griswold MA, Hernandez-Garcia L. Theoretical Framework for MR Fingerprinting with ASL: Simultaneous Quantification of CBF, Transit Time, and T1. Proceedings of the 22th annual meeting of ISMRM; 2014. p. 0417. [Google Scholar]
- 12.Su P, Mao D, Liu P, Li Y, Welch BG, Lu H. Arterial Spin Labeling without control/label pairing and post-labeling delay: an MR fingerprinting implementation. Proceedings of the 23th annual meeting of ISMRM; 2015. p. 0276. [Google Scholar]
- 13.Herscovitch P, Raichle ME. What is the correct value for the brain--blood partition coefficient for water? J Cereb Blood Flow Metab. 1985;5:65–69. doi: 10.1038/jcbfm.1985.9. [DOI] [PubMed] [Google Scholar]
- 14.Buxton RB, Frank LR, Wong EC, Siewert B, Warach S, Edelman RR. A general kinetic model for quantitative perfusion imaging with arterial spin labeling. Magn Reson Med. 1998;40:383–396. doi: 10.1002/mrm.1910400308. [DOI] [PubMed] [Google Scholar]
- 15.Wang DJ, Fernandez-Seara MA, Lu H. Confounding Effects in ASL. In: Bammer R, editor. MR and CT Perfusion and Pharmacokinetic Imaging: Clinical Applications and Theoretical Principles. Philadelphia: Lippincott Williams & Wilkins; 2016. [Google Scholar]
- 16.Lu H, Clingman C, Golay X, van Zijl PC. Determining the longitudinal relaxation time (T1) of blood at 3. 0 Tesla. Magn Reson Med. 2004;52:679–682. doi: 10.1002/mrm.20178. [DOI] [PubMed] [Google Scholar]
- 17.Gunther M, Bock M, Schad LR. Arterial spin labeling in combination with a look-locker sampling strategy: inflow turbo-sampling EPI-FAIR (ITS-FAIR) Magn Reson Med. 2001;46:974–984. doi: 10.1002/mrm.1284. [DOI] [PubMed] [Google Scholar]
- 18.Petersen ET, Lim T, Golay X. Model-free arterial spin labeling quantification approach for perfusion MRI. Magn Reson Med. 2006;55:219–232. doi: 10.1002/mrm.20784. [DOI] [PubMed] [Google Scholar]
- 19.Petersen ET, Mouridsen K, Golay X. The QUASAR reproducibility study, Part II: Results from a multi-center Arterial Spin Labeling test-retest study. Neuroimage. 2010;49:104–113. doi: 10.1016/j.neuroimage.2009.07.068. [DOI] [PMC free article] [PubMed] [Google Scholar]
- 20.Dai W, Garcia D, de Bazelaire C, Alsop DC. Continuous flow-driven inversion for arterial spin labeling using pulsed radio frequency and gradient fields. Magn Reson Med. 2008;60:1488–1497. doi: 10.1002/mrm.21790. [DOI] [PMC free article] [PubMed] [Google Scholar]
- 21.Suzuki J, Takaku A. Cerebrovascular “moyamoya” disease. Disease showing abnormal net-like vessels in base of brain. Arch Neurol. 1969;20:288–299. doi: 10.1001/archneur.1969.00480090076012. [DOI] [PubMed] [Google Scholar]
- 22.Wang R, Yu S, Alger JR, et al. Multi-delay arterial spin labeling perfusion MRI in moyamoya disease--comparison with CT perfusion imaging. Eur Radiol. 2014;24:1135–1144. doi: 10.1007/s00330-014-3098-9. [DOI] [PMC free article] [PubMed] [Google Scholar]
- 23.Chappell MA, Groves AR, Whitcher B, Woolrich MW. Variational Bayesian Inference for a Nonlinear Forward Model. IEEE Transactions on Signal Processing. 2009;57:223–236. [Google Scholar]
- 24.Chappell MA, MacIntosh BJ, Donahue MJ, Gunther M, Jezzard P, Woolrich MW. Separation of macrovascular signal in multi-inversion time arterial spin labelling MRI. Magn Reson Med. 2010;63:1357–1365. doi: 10.1002/mrm.22320. [DOI] [PubMed] [Google Scholar]
- 25.Jenkinson M, Beckmann CF, Behrens TE, Woolrich MW, Smith SM. Fsl. Neuroimage. 2012;62:782–790. doi: 10.1016/j.neuroimage.2011.09.015. [DOI] [PubMed] [Google Scholar]
- 26.Gonzalez-At JB, Alsop DC, Detre JA. Cerebral perfusion and arterial transit time changes during task activation determined with continuous arterial spin labeling. Magn Reson Med. 2000;43:739–746. doi: 10.1002/(sici)1522-2594(200005)43:5<739::aid-mrm17>3.0.co;2-2. [DOI] [PubMed] [Google Scholar]
- 27.MacIntosh BJ, Filippini N, Chappell MA, Woolrich MW, Mackay CE, Jezzard P. Assessment of arterial arrival times derived from multiple inversion time pulsed arterial spin labeling MRI. Magn Reson Med. 2010;63:641–647. doi: 10.1002/mrm.22256. [DOI] [PubMed] [Google Scholar]
- 28.Wang DJ, Alger JR, Qiao JX, Gunther M, Pope WB, Saver JL, Salamon N, Liebeskind DS Investigators US. Multi-delay multi-parametric arterial spin-labeled perfusion MRI in acute ischemic stroke - Comparison with dynamic susceptibility contrast enhanced perfusion imaging. Neuroimage Clin. 2013;3:1–7. doi: 10.1016/j.nicl.2013.06.017. [DOI] [PMC free article] [PubMed] [Google Scholar]
- 29.Dai W, Robson PM, Shankaranarayanan A, Alsop DC. Reduced resolution transit delay prescan for quantitative continuous arterial spin labeling perfusion imaging. Magn Reson Med. 2012;67:1252–1265. doi: 10.1002/mrm.23103. [DOI] [PMC free article] [PubMed] [Google Scholar]
- 30.Gunther M. Highly efficient accelerated acquisition of perfusion inflow series by cycled arterial spin labeling. Proceedings of the 15th annual meeting of ISMRM; 2007. p. 380. [Google Scholar]
- 31.Wells JA, Lythgoe MF, Gadian DG, Ordidge RJ, Thomas DL. In vivo Hadamard encoded continuous arterial spin labeling (H-CASL) Magn Reson Med. 2010;63:1111–1118. doi: 10.1002/mrm.22266. [DOI] [PubMed] [Google Scholar]
- 32.Dai W, Shankaranarayanan A, Alsop DC. Volumetric measurement of perfusion and arterial transit delay using hadamard encoded continuous arterial spin labeling. Magn Reson Med. 2013;69:1014–1022. doi: 10.1002/mrm.24335. [DOI] [PMC free article] [PubMed] [Google Scholar]
- 33.Teeuwisse WM, Schmid S, Ghariq E, Veer IM, van Osch MJ. Time-encoded pseudocontinuous arterial spin labeling: basic properties and timing strategies for human applications. Magn Reson Med. 2014;72:1712–1722. doi: 10.1002/mrm.25083. [DOI] [PubMed] [Google Scholar]
- 34.Wang J, Alsop DC, Song HK, Maldjian JA, Tang K, Salvucci AE, Detre JA. Arterial transit time imaging with flow encoding arterial spin tagging (FEAST) Magn Reson Med. 2003;50:599–607. doi: 10.1002/mrm.10559. [DOI] [PubMed] [Google Scholar]
- 35.Liu P, Uh J, Lu H. Determination of spin compartment in arterial spin labeling MRI. Magn Reson Med. 2011;65:120–127. doi: 10.1002/mrm.22601. [DOI] [PMC free article] [PubMed] [Google Scholar]
- 36.Schmid S, Teeuwisse WM, Lu H, van Osch MJ. Time-efficient determination of spin compartments by time-encoded pCASL T2-relaxation-under-spin-tagging and its application in hemodynamic characterization of the cerebral border zones. Neuroimage. 2015;123:72–79. doi: 10.1016/j.neuroimage.2015.08.025. [DOI] [PubMed] [Google Scholar]
- 37.Ho YC, Petersen ET, Zimine I, Golay X. Similarities and differences in arterial responses to hypercapnia and visual stimulation. J Cereb Blood Flow Metab. 2011;31:560–571. doi: 10.1038/jcbfm.2010.126. [DOI] [PMC free article] [PubMed] [Google Scholar]
- 38.Donahue MJ, Faraco CC, Strother MK, Chappell MA, Rane S, Dethrage LM, Hendrikse J, Siero JC. Bolus arrival time and cerebral blood flow responses to hypercarbia. J Cereb Blood Flow Metab. 2014;34:1243–1252. doi: 10.1038/jcbfm.2014.81. [DOI] [PMC free article] [PubMed] [Google Scholar]
- 39.Taei-Tehrani MR, Van Osch MJ, Brown TR. Pseudo-random arterial modulation (PRAM): a novel arterial spin labeling approach to measure flow and blood transit times. J Magn Reson Imaging. 2012;35:223–228. doi: 10.1002/jmri.22844. [DOI] [PubMed] [Google Scholar]
- 40.Alsop DC, Detre JA. Multisection cerebral blood flow MR imaging with continuous arterial spin labeling. Radiology. 1998;208:410–416. doi: 10.1148/radiology.208.2.9680569. [DOI] [PubMed] [Google Scholar]
- 41.Pierre EY, Ma D, Chen Y, Badve C, Griswold MA. Multiscale reconstruction for MR fingerprinting. Magn Reson Med. 2016;75:2481–2492. doi: 10.1002/mrm.25776. [DOI] [PMC free article] [PubMed] [Google Scholar]
- 42.Ye H, Ma D, Jiang Y, Cauley SF, Du Y, Wald LL, Griswold MA, Setsompop K. Accelerating magnetic resonance fingerprinting (MRF) using t-blipped simultaneous multislice (SMS) acquisition. Magn Reson Med. 2016;75:2078–2085. doi: 10.1002/mrm.25799. [DOI] [PMC free article] [PubMed] [Google Scholar]
- 43.Chappell MA, Woolrich MW, Kazan S, Jezzard P, Payne SJ, MacIntosh BJ. Modeling dispersion in arterial spin labeling: validation using dynamic angiographic measurements. Magn Reson Med. 2013;69:563–570. doi: 10.1002/mrm.24260. [DOI] [PubMed] [Google Scholar]
Associated Data
This section collects any data citations, data availability statements, or supplementary materials included in this article.
Supplementary Materials
Supporting Figure S1: Two-compartment MRF-derived parametric maps as a function of flip angle: B1+ (%), tissue T1 (ms), CBF (ml/100g/min), tissue BAT (ms), pass-through arterial BAT (ms), pass-through blood volume (%) and pass-through blood travel time (ms).


