

Abstract
Structure determination of proteins by NMR is unique in its ability to measure restraints, very accurately, in environments and under conditions that closely mimic those encountered in vivo. For example, advances in solid-state NMR methods enable structure determination of membrane proteins in detergent-free lipid bilayers, and of large soluble proteins prepared by sedimentation, while parallel advances in solution NMR methods and optimization of detergent-free lipid nanodiscs are rapidly pushing the envelope of the size limit for both soluble and membrane proteins. These experimental advantages, however, are partially squandered during structure calculation, because the commonly used force fields are purely repulsive and neglect solvation, Van der Waals forces and electrostatic energy. Here we describe a new force field, and updated energy functions, for protein structure calculations with EEFx implicit solvation, electrostatics, and Van der Waals Lennard-Jones forces, in the widely used program Xplor-NIH. The new force field is based primarily on CHARMM22, facilitating calculations with a wider range of biomolecules. The new EEFx energy function has been rewritten to enable OpenMP parallelism, and optimized to enhance computation efficiency. It implements solvation, electrostatics, and Van der Waals energy terms together, thus ensuring more consistent and efficient computation of the complete nonbonded energy lists. Updates in the related python module allow detailed analysis of the interaction energies and associated parameters. The new force field and energy function work with both soluble proteins and membrane proteins, including those with cofactors or engineered tags, and are very effective in situations where there are sparse experimental restraints. Results obtained for NMR-restrained calculations with a set of five soluble proteins and five membrane proteins show that structures calculated with EEFx have significant improvements in accuracy, precision, and conformation, and that structure refinement can be obtained by short relaxation with EEFx to obtain improvements in these key metrics. These developments broaden the range of biomolecular structures that can be calculated with high fidelity from NMR restraints.
Keywords: Structure calculation, Implicit solvent, Membrane protein, Eefx, Force field
Introduction
NMR structure calculations involve minimization of an energy function that includes terms for both the experimental NMR data and the interatomic interactions, active in a given chemical structure, that are collectively referred to as the “force field”. Standard calculation protocols, implemented in the most commonly used NMR programs, Xplor-NIH (Schwieters et al. 2003, 2006), CNS (Brunger et al. 1998), DYANA and CYANA (Guntert 2004; Guntert et al. 1997), are performed in a purely repulsive force field that ignores attractive Van der Waals Lennard-Jones forces, electrostatic forces, and solvent effects (Clore and Gronenborn 1989; Guntert 1998; Nilges et al. 1988). This provides a good balance among the requirements for computational speed, structural quality, and the weighted inclusion of a wide range of experimental restraints, but it can also lead to non-native structures with suboptimal atomic packing, unsatisfied hydrogen bonds and unbalanced salt bridges, particularly in the early stages of calculation when the experimental NMR restraints are often too sparse to generate properly folded structures. The purely repulsive model is particularly ill suited for membrane proteins, where membrane-embedded and water-exposed residues exist in entirely different and heterogeneous environments.
All atom force fields, with explicit atomic representation of protein and solvent molecules (water or water plus lipid) and complete chemical energy functions, provide realistic atomic-level treatments of the intra- and inter-molecular forces experienced by the protein and its environment. They can be used in NMR-restrained molecular dynamics (MD) simulations to refine structures and obtain information about protein-water (Bertini et al. 2011; Linge and Nilges 1999; Linge et al. 2003; Nabuurs et al. 2004; Nederveen et al. 2005; Spronk et al. 2002), and protein-lipid (Cheng and Im 2012; Cheng et al. 2013; Sharma et al. 2010) interactions. This approach, however, is computationally intensive and typically relies on a reasonably accurate structure for MD simulation. Thus, it remains impractical for routine ab initio NMR structure calculations by simulated annealing, that start from fully extended polypeptides.
A number of alternative approaches have been developed to address this problem. Implicit representation of solvent effects (Baker 2005; Bashford and Case 2000; Chen et al. 2008; Feig and Brooks 2004; Roux and Simonson 1999) helps reduce computation times and can be used with restrained MD protocols to improve the quality of NMR structures through refinement. Generalized Born implicit solvent models have been used with the CHARMM (Brooks et al. 2009) and AMBER (Case et al. 2005) force fields to refine water-soluble protein structures (Chen et al. 2004, 2005; Xia et al. 2002), and to fold a membrane protein (Im and Brooks 2004). This method, however, remains too computationally intensive for routine, de novo structure determination, and is not widely implemented as an integral part of NMR calculation protocols from unfolded templates.
Monte Carlo minimization with the Rosetta force field (Das and Baker 2008; Kuhlman and Baker 2000), which incorporates elements of statistical and physical parameter sets, has been shown to improve the quality and accuracy of soluble protein structures determined by NMR (Mao et al. 2014; Ramelot et al. 2009). However, to date, this approach has not been applied to membrane proteins and has not been used in combination with simulated annealing calculations.
A structure-based solvent accessibility term has been developed to improve precision and accuracy in NMR-restrained structure calculations of soluble proteins (Wang et al. 2012), and empirical potentials of membrane insertion depth (Shi et al. 2009), or geometric restraining terms (Teriete et al. 2007; Xu et al. 2008), can be used to impose virtual water-membrane boundaries that guide NMR structure calculations of membrane proteins. These approaches work with the standard simple repulsive force fields to facilitate rapid structure computation, but do not provide realistic atomic-level representations of the protein in its environment.
Recently, we described an implicit solvent potential (Tian et al. 2014, 2015) for Xplor-NIH, that is easily implemented with NMR-restrained simulated annealing protocols, and enables computationally efficient structure calculations of both soluble and membrane proteins. The potential, EEFx (effective energy function for Xplor-NIH), is based on the implicit solvation energy functions developed for CHARMM (Lazaridis 2003; Lazaridis and Karplus 1999). It includes support for a membrane solvation force field, IMMx (implicit membrane model for Xplor-NIH), that provides a physically realistic environmental restraint for folding and refinement of membrane proteins in a lipid bilayer. EEFx works with a dedicated force field that includes terms for van der Waals Lennard-Jones interatomic force, electrostatic force, and solvation free energy, and can be easily implemented with the wide range of experimental energy terms used for NMR structure determination. Notably, EEFx is very effective at guiding structure calculations towards the native state, even in the absence of large numbers of experimental measurements, and leads to significant improvements in structural quality, accuracy and precision for both soluble and membrane proteins (Cornilescu et al. 2016; Jureka et al. 2015; Lee et al. 2016; Marassi et al. 2015; Tian et al. 2014, 2015).
The original force fields of EEFx were developed from the topology and chemical parameters of the Xplor-NIH version of PARALLHDG5.3 (Linge and Nilges 1999; Linge et al. 2003), with atom groupings and partial charges taken from CHARMM19, in version 1 (Tian et al. 2014), or CHARMM22, in version 2 (Tian et al. 2015). Here we describe a new force field, based primarily on CHARMM22, and optimized EEFx energy functions, that extend the capabilities of implicit solvent calculations with Xplor-NIH. We assess performance by analyzing results obtained for a set of five soluble proteins and five membrane proteins. The data show that structures calculated with EEFx have significant improvements in accuracy, precision and conformation, and that structure refinement can be obtained by short MD relaxation with EEFx to obtain improvements in these key metrics. We also describe efficient and practical protocols for the implementation of EEFx in both routine NMR-restrained structure calculations from extended polypeptide strands, and restrained MD calculations at constant temperature. Application to a wider variety of molecular groups beyond the standard amino acids is also demonstrated. The incorporation of EEFx into structure calculations has the potential to be broadly useful to the biomolecular NMR community.
Description of the EEFx energy function and force field
EEFx energy function
The total energy function (ETOTAL) that is minimized in Xplor-NIH EEFx structure calculations is given by:
| (1) |
EEXP uses the experimental NMR data as input and contains target functions for restraints such as those used in this study for distances (noe), dipolar couplings (rdc), chemical shift anisotropy (csa), and dihedral angles (CDIH). ECOVA defines the covalent geometry. It contains the original XPLOR terms for bonds (EBOND), bond angles (EANGL), and improper dihedral angles (EIMPR), to define planarity and chirality (Brunger 1992), as well as the Xplor-NIH statistical potential, torsionDB (EtorsionDB), to restrain proper dihedral angles to values seen in high-resolution crystal structures (Bermejo et al. 2012):
| (2) |
EEEFx contains terms for nonbonded interatomic contacts (EVDW), electrostatic interactions (EELEC), and implicit solvation (ESOLV):
| (3) |
EVDW depends on the interatomic distance, van der Waals radius and Lennard-Jones well depth, while EELEC is computed from the Coulomb's constant and the atomic charges, with ionic side-chains neutralized to simplify the treatment of electrostatic interactions. ESLV represents the sum of solvation free energies contributed by all atomic groups in the protein, each defined as the solvation free energy of an atomic group in its fully solvated state minus the reduction in solvation due to the presence of surrounding atomic groups.
For membrane proteins, the IMMx functionality of EEFx acts to modulate electrostatic and solvation energies as a function of the atomic distance (z) from the hydrophobic center (z = 0) of a model membrane with the water–lipid interface parallel to the xy coordinate plane. The IMMx energy function defines the transition from polar to hydrophobic environments, and depends on the hydrocarbon thickness of the membrane and the size of the region over which the transition occurs. It yields stronger electrostatic interactions and weaker screening of partial charges in the hydrophobic membrane interior, and includes the effect of the change in solvation free energy associated with the transfer from water to a hydrophobic environment.
The functional forms of the nonbonded terms that make up the EEFx energy function have been described previously (Tian et al. 2014, 2015). EVDW and EELEC have the same forms as their original XPLOR counterparts (Brunger 1992), and ESLV has the same form as the function developed for MD simulations in CHARMM (Lazaridis 2003; Lazaridis and Karplus 1999). Information about the individual energy terms is available in the Xplor-NIH online reference manual (http://nmr.cit.nih.gov/Xplor-NIH).
In this newest version of EEFx the nonbonded terms are implemented together as a single term within the eefxPot Python module of Xplor-NIH (Tian et al. 2015). This combined implementation bypasses the need to use the original XPLOR terms, VDW and ELEC, and ensures more convenient, consistent and efficient computation of the complete nonbonded energy lists. Each of the three nonbonded energy terms can be scaled and reported independently during structure calculation. Furthermore, additional functions have been introduced into the eefxPotTools Python module, to allow detailed analysis of the interaction energies and related parameters. For example, the function eefxResEnergy returns EEFx energy values for selected residues, with separate components for solvation, electrostatic and Van der Waals terms, while the eefxAtomInfo function returns the solvation parameters of selected atoms. Finally, the EEFx energy function has been optimized to compute quantities for each interacting atom a single time, rather than twice, as was the case previously. This optimization can be disabled, by calling the accessor set CollectAtomEnergies (True), in case per-atom energies are desired. Additionally, the EEFx energy term was rewritten such that OpenMP parallelism can be optionally enabled by specifying -omp NUM on the Xplor-NIH command-line, where NUM is the number of cores to be used. By default, NUM = 1, but wall-time speed enhancement is possible by specifying NUM > 1, subject to the condition that cores are not oversubscribed.
The energy terms collected in ECOVA and EEEFx work in conjunction with: (i) dedicated topology and parameter files that specify the values used by EBOND, EANGL, EIMPR, EVDW, and EELEC; (ii) the Python module torsionDBPot-Tools, which contains the parameters and functionalities needed to set up EtorsionDB; and (iii) the Python module eefxPotTools, which contains the set of solvation parameters and functionalities required by ESLV. Collectively, these three elements make up the EEFx force field.
EEFx2 force field
The previous version of the EEFx force field was based primarily on PARALLHDG5.3 (Linge and Nilges 1999; Linge et al. 2003), with atom groupings and partial charges from CHARMM22 (Brooks et al. 2009). By contrast, the new force field, EEFx2, is based primarily on CHARMM22 with some elements taken from PARALLHDG5.3. CHARMM parameter releases after CHARMM19 explicitly include all hydrogen atoms and hence are well suited for NMR studies. We selected the CHARMM force field for three reasons: (i) the Xplor-NIH force fields are derived from CHARMM and retain many common parameters and common language; (ii) CHARMM is one of the most well-established force fields for MD studies of biomolecular systems; (iii) CHARMM contains parameter sets for a wide variety of biomolecules including: proteins, nucleic acids, lipids, carbohydrates and many organic molecules (Vanommeslaeghe and MacKerell 2015).
The atom types and chemical groups of the topology and parameter files of EEFx2 (protein_eefx2.top and protein_eefx2.par) are from CHARMM22, as are the nonbonded parameters for partial atomic charges, atomic masses, and Van der Waals radii, and the covalent parameters for bond lengths and bond angles. By contrast, improper dihedral angles have values taken from CHARMM22 but are defined as in the Xplor-NIH version of PARALLHDG5.3. In the case of Pro residues, the angle, bond, and improper parameters were taken from PARALLHDG5.3, as these were found to generate structures with better conformational quality by Molprobity. In addition, partial atomic charges for ionic residues (Arg, Lys, Asp, Glu, and termini) were replaced with those of CHARMM22-EEF (Lazaridis and Karplus 1999), to obtain polar, albeit neutralized, residues that yield the proper stabilizing interactions for salt bridges.
As in the standard Xplor-NIH force fields, improper dihedrals are used to maintain trans- or cis-peptide bonds, chirality of tetrahedral centers, and planarity of peptide bonds and aromatic rings, while backbone and side chain dihedral angles are restrained with the statistical potential torsionDB. The force field also retains the full set of standard Xplor-NIH patches, including those for switching from trans- to cis-peptide bonds or from l to d amino acids. At present, EEFx2 includes parameters for proteins plus some additional molecules (described below). We envision future expansion to include the even larger parameter set available in later CHARMM versions, thus extending implicit solvation calculations to a wider variety of systems.
To enable NMR-restrained simulated annealing calculations with internal coordinate dynamics, the force constants of EEFx2 were converted from their CHARMM22 values to uniform values of 1000 kcal mol−1 Å−2 for bonds, and 500 kcal mol−1 rad−2 for angles and improper dihedrals. These values were taken from the standard Xplor-NIH force field where the weightings among bonds, bond angles, planarity, and chirality, are optimized for NMR calculations (Schwieters and Clore 2001). Furthermore, to overcome local energy barriers between different molecular conformations, the initial high temperature dynamics of simulated annealing is performed in two stages: a first stage where the EEFx energy term of Eq. 1 is replaced by the XPLOR purely repulsive energy function, REPEL, and a second stage performed with Eq. 1 and the force constants of its component terms scaled to low values.
Methods
Protocols for NMR-restrained calculations
All calculations were performed with Xplor-NIH (Schwieters et al. 2003, 2006), using either the purely repulsive nonbonded energy function, REPEL, with its conventional force field (protein.top and protein.par), or the EEFx energy function with the new force field (protein_eefx2.top and protein_eefx2.par), henceforth collectively referred to as EEFx2. In both cases, the torsionDB term (torsionDBPot) was used to restrain dihedral angles. NMR restraints were implemented with the following Xplor-NIH potentials: NOEPot for all distances, including those derived from NOEs, hydrogen bonds, and paramagnetic relaxation enhancement (PRE); Xplor CDIH for dihedral angles; RDCPot for all dipolar couplings; and CSAPot for all chemical shift anisotropy data. The updated and optimized EEFx energy function improves computation efficiency, afording up to 50% shorter computation times. The latest version of EEFx, including the new topology and parameter files, is available with the Xplor-NIH software suite and downloadable from the web (http://nmr.cit.nih.gov/Xplor-NIH/).
Experimental NMR data sets were downloaded from the PDB for each of ten deposited protein structures determined by solution NMR or solid-state NMR (Table 1). Each calculation with REPEL or EEFx2 was initiated from a fully extended polypeptide strand. NMR-restrained simulated annealing calculations were performed, as previously described (Tian et al. 2014, 2015), using two protocols, the first to fold and the second to refine protein structures. A total of 100 initial structures were generated with the fold protocol, and the ensemble of 10 structures with lowest energy of the experimental restraining terms was selected as input for the refinement protocol. A total of 100 structures were refined, and the 10 structures with lowest energy of the experimental restraining terms were selected for the final ensemble.
Table 1. Protein data sets used in test structure calculations with EEFx2.
| Protein | PDB | Length | Fold | Experimental method | Total number of key experimental restraints | ||||
|---|---|---|---|---|---|---|---|---|---|
|
| |||||||||
| long-range distancea | backbone dihedral | side chain dihedral | DCb | CSAb | |||||
| Soluble proteins | |||||||||
| GB1 | 3GB1 | 56 | αβ | Solution NMR (water buffer) | 304 (5.43/residue) | 102 | 44 | 299 | 0 |
| BAF | 2EZX | 89 | α | Solution NMR (water buffer) | 226 (2.54/residue) | 158 | 94 | 248 | 0 |
| ArfA-b | 2KSM | 131 | αβ | Solution NMR (water buffer) | 293 (2.24/residue) | 208 | 0 | 279 | 0 |
| DHFR | 2L28 | 162 | αβ | Solution NMR (water buffer) | 605 (3.73/residue) | 275 | 51 | 170 | 0 |
| EIN | 1EZA | 259 | αβ | Solution NMR (water buffer) | 662 (2.56/residue) | 261 | 283 | 159 | 0 |
| Membrane proteins | |||||||||
| fd pVIII | 1MZT | 50 | α | Solid-state NMR (oriented bilayers) | 0 (0/residue) | 76 | 76 | 39 | 39 |
| CrgA | 2MMU | 67 | α | Solid-state NMR (oriented bilayers) | 4 (0.06/residue) | 78 | 78 | 40 | 40 |
| OmpX | 2M06 | 148 | β | Solution NMR (nanodiscs) | 125 (0.84/residue) | 291 | 291 | 7 | 7 |
| Ail | 2N2L | 156 | β | Solution NMR (detergent micelles) | 223 (1.43/residue) | 294 | 294 | 0 | 0 |
| ASR | 2M3G | 229 | α | MAS solid-state NMR (liposomes) | 235 (1.03/residue) | 372 | 372 | 0 | 0 |
GB1, protein G B1 domain (Gronenborn et al. 1991; Kuszewski et al. 1999); BAF, human barrier to autointegration factor, monomer (Cai et al. 1998); ArfA-b, M. tuberculosis ammonia release facilitator A domain b (Teriete et al. 2010); DHFR, L. casei apo dihydrofolate reductase (Feeney et al. 2011); EIN, enzyme I N-terminal domain (Garrett et al. 1997, 1999); fd coat, membrane bound form of fd bacteriophage pVIII coat protein (Marassi and Opella 2003); CrgA TM, M. tuberculosis cell division protein transmembrane region (Das et al. 2015); OmpX, E. coli outer membrane protein X; input data include solution NMR restraints measured in nanodiscs (Hagn et al. 2013) and solid-state NMR restraints measured in oriented bilayers (Mahalakshmi and Marassi 2008); Ail, Y. pestis attachment invasion locus outer membrane protein (Marassi et al. 2015); ASR, Anabaena sensory rhodopsin, monomer (Wang et al. 2013)
Defined as (i – i + 4) > 4 and including measurements of hydrogen exchange and paramagnetic relaxation enhancement
Dipolar coupling (DC) and chemical shift anisotropy (CSA) restraints, measured by solution NMR with proteins in weakly aligned media, or by solid-state NMR with protein in oriented bilayers
Both fold and refine protocols utilize the internal variable module (IVM) (Schwieters and Clore 2001) for dynamics and minimization, and share the same basic scheme comprising four stages: (i) dynamics in torsion angle space with reduced force constants at a temperature of 3500 K for folding or 3000 K for refinement; (ii) dynamics in torsion angle space with simulated annealing from the initial high temperature to 25 K, in steps of 12.5 K, where the force constants are geometrically ramped from their small initial values to full values at the final temperature; (iii) 500 steps of Powell minimization in torsion angle space; and (iv) 500 steps of Powell minimization in Cartesian coordinate space.
In the fold calculations with EEFx, the REPEL term was used at high temperature to facilitate chain rearrangement and to avoid singular energy values, while the EEFx term was used for the remainder of the calculation. Identical time and temperature parameters were used in the simulated annealing protocols performed with EEFx and REPEL to enable direct comparison of the resulting structures.
For membrane proteins, the IMMx function was implemented with a membrane thickness set to reflect the lipid composition of the experimental sample. These calculations include an additional functionality that translates a selected center of mass of the protein to the membrane hydrophobic center (z = 0 plane) after each MD run at high-temperature in the folding protocol.
NMR-restrained relaxation of the refined structures was performed with EEFx, at a constant temperature of 300 K, using a protocol for MD in Cartesian space, and normal atomic masses, instead of the uniform mass setup that is routinely used in NMR structure calculation protocols. The nitroxide spin label methyl methanesulfonothioate (MTSL) was included during the fold and refine protocols to enable the use of PRE distance restraints, and then removed for the final minimization steps and relaxation protocols, which were performed in the absence of PRE distances.
Structure validation and analysis
Xplor-NIH scripts were used to assess the precision and accuracy of the calculated structure ensembles. Precision was evaluated as the pairwise root mean square deviation (RMSD) of the ten models in the final ensemble. Accuracy was evaluated as the RMSD agreements of the calculated coordinates to the reference structure in the protein data bank (PDB). Agreement with the NMR data was evaluated as the RMSD of the back-calculated NMR restraints from the experimental NMR restraints. The fit between calculated coordinates and experimental dipolar couplings, purposely excluded from structure calculation, was evaluated and reported as an R-factor (Clore and Garrett 1999). The dipolar R-factor expresses the ratio of the RMSD between experimental and back-calculated dipolar couplings to that expected for a totally random distribution of vectors, calculated from the magnitude of the alignment tensor. It ranges from 0%, for perfect agreement between observed and calculated dipolar couplings and 100% for a completely random structure. Finally, the conformations and the nonbonded interaction parameters were evaluated using the program MolProbity (Chen et al. 2010; Davis et al. 2007; Lovell et al. 2003). Structures were rendered and examined with PyMol (DeLano 2005).
Results
Test protein structures
To assess the performance of the new force field, we compared the results of NMR-restrained simulated annealing calculations performed for ten protein data sets (Table 1) using either EEFx2 or REPEL. We also examined the performance of the REPEL potential with two versions of the standard Xplor-NIH force field: protein-1.0, which retains many features of the parallhdg.pro and topallhdg. pro parameter and topology files for NMR structure calculations in XPLOR (Brunger 1992), and the newer, now default, version, protein-3.1, where nonbonded parameters have been updated and the atomic radii have been modified to those of Molprobity, to provide a more realistic representation of atomic radii and improve nonbonded repulsions (Bermejo et al. 2016).
The protein benchmarks selected for analysis cover a range of sizes (∼50 to 260 amino acids) and folds (α, αβ, β) and include five soluble proteins determined by solution NMR and five membrane proteins determined by solution NMR in micelles or by solid-state NMR in lipid bilayers. The restraints include distances, dihedral angles and bond orientations. All calculations were started from fully extended polypeptide strands, as is typically done for NMR. For the soluble proteins, the calculations included distance and dihedral angle experimental restraints, but dipolar couplings were excluded and used only for cross validation. For membrane proteins, the experimental data are relatively sparse compared to their soluble counterparts; in this case, only a portion of the dipolar coupling data (when available) was set aside for cross validation, while the rest was used as a working set to restrain the structure calculations.
The test data sets encompass the typical range of variables associated with NMR structure calculations and thus can provide a relatively unbiased evaluation of the energy functions. The experimental data sets vary with respect to the numbers and types of restraints that they contain. For example, the density of long-range distance restraints, defined for atoms separated by four or more residues, ranges from 0 to 10.6 per protein residue and, while some data sets include hydrogen bonds, as well as dipolar coupling and chemical shift anisotropy orientation restraints, others do not. Furthermore, the data were measured in different laboratories using a wide range of experimental methods. Long-range distances were derived primarily from NOE measurements for soluble proteins or spin-diffusion experiments for membrane proteins, with one case, ASR, making use of PRE restraints measured from a nitroxide spin label.
Agreement with experimental data
Balancing the effects of experimental restraints with those of the conformational and nonbonded energy terms of the force field is critical for achieving high quality structures and avoiding over fitting the experimental data. Previously, we showed that the introduction of EEFx implicit solvation in the target energy function does not deteriorate the agreement between calculated structures and the other experimental and conformational energy terms (Tian et al. 2014, 2015). The results in Fig. 1 demonstrate that the new force field maintains this excellent agreement with the NMR restraining data. Compared with REPEL, EEFx2 calculations produce similar RMSD agreements between structure coordinates and the experimental distance and dihedral angle restraints.
Fig. 1.

Effect of EEFx2 on precision and accuracy of NMR structures. Bar plots represent results for the average of ten models in each ensemble, calculated for five soluble proteins (GB1, BAF, ArfA-b, DHFR, EIN) and five membrane proteins (fd, CrgA, OmpX, Ail, ASR). Results were obtained using: REPEL and protein-1.0 (gray); REPEL and protein-3.1 (white); or EEFx2 (blue). For protein names refer to Table 1. a, b Agreement with the working experimental distance and dihedral angle restraints used in the structure calculations. c Agreement with experimental dipolar couplings excluded from structure calculations and used only for cross-validation. The R-factor is expressed as a % unweighted average over different alignment media. A value of 0% indicates perfect agreement between observed and calculated dipolar couplings, and a value of 100% indicates a completely random structure. d Coordinate precision of each ensemble evaluated as average pairwise RMSD for backbone CA atoms
For all the membrane proteins, EEFx2 leads to appreciable improvements in the RMSD agreements with experimentally derived dihedral angles. This is also observed for two of the soluble proteins (GB1 and EIN), and likely reflects the improvements in structural conformation afforded by the force field (see below) and its ability to guide structures towards their native conformation. This is particularly important for NMR structures determined with sparse restraints, such as those of membrane proteins, where the number of experimental measurements is often small due to a series of sample-specific challenges that pose limitations on the NMR experiments as well as sensitivity (Cross et al. 2014; Ward et al. 2015).
Accuracy and precision
Agreement between the structure and the set of working experimental restraints used in its calculation provides a useful estimate of validation, but the best measure of goodness of fit and structural accuracy is obtained by cross-validation with a non-working set of restraints that are purposely excluded from calculation, in a manner analogous to the free R-factor used in crystallography (Clore and Garrett 1999). Dipolar couplings are particularly well suited for cross-validation (Murray et al. 2014). Unlike other restraints that depend on internal connections between atomic sites, they depend on the orientation of interatomic vectors relative to the external magnetic field. They are autonomous, since each measurement provides orientation-dependent information at a specific molecular site relative to an external frame of reference the magnetic field, as well as correlated, since the distribution of all dipolar couplings measured at different sites in the molecule reflects the global molecular structure and orientation.
Evaluating how well the dipolar couplings in the excluded, test data set are predicted by the other restraints in the working set, serves as a powerful measure of structural accuracy. As shown in Fig. 1c, the protein structures calculated with EEFx2 have generally better dipolar coupling R-factors. By this measurement, we conclude that the structures generated with EEFx2 are generally more accurate. For the membrane proteins in our test set, the experimental dipolar couplings also reflect the global orientation of the polypeptide in the lipid bilayer membrane, a parameter that is intimately linked with biological function. In this case, improved R-factors for non-working dipolar couplings indicate that the structures from EEFx2 are both more accurate and have more accurate global position in the membrane than those from REPEL.
The precision of NMR structures is readily evaluated as the RMSD of atomic coordinates in the bundle of aligned structures. All EEFx2 structures have higher precision than their REPEL counterparts for both backbone and heavy atom (not shown) coordinates. Taken together, the results show that EEFx2 is very effective at guiding the calculations more precisely towards native conformations.
Conformational quality
To assess the conformational quality of the EEFx2 structures we carried out Molprobity (Chen et al. 2010; Davis et al. 2007) analyses for all the calculated structure ensembles. The results in Fig. 2 show that the majority of EEFx2 structures have better backbone and side chain conformation compared to results obtained with REPEL. In general, EEFx2 causes the percent of Ramachandran outliers to drop significantly and the side chains to adopt better conformations, with a higher percent of favored rotamers and lower number of poor rotamers (Fig. 2a, b). This result is an improvement compared to the previous force field (Fig. 2, green), which results in higher numbers of both Ramachandran outliers and of poor rotamers (Fig. 2a, b) despite the use of torsionDB (Bermejo et al. 2012). For all membrane proteins, the favored regions of the Ramachandran plot also become more populated (Fig. 2c, d).
Fig. 2.
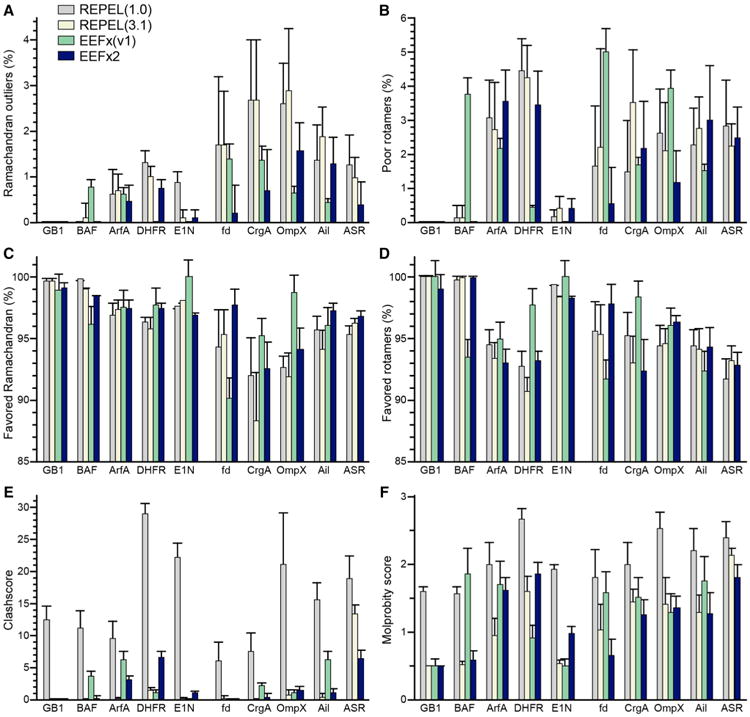
Effect of EEFx2 on protein conformation evaluated by MolProbity. Bar plots (a–f) represent results for the average of ten models in each ensemble, calculated for soluble proteins (GB1, BAF, ArfA-b, DHFR, EIN) and membrane proteins (fd, CrgA, OmpX, Ail, ASR). Results were obtained using: REPEL and protein-1.0 (gray); REPEL and protein-3.1 (white); EEFx version 1 (green); or EEFx2 (blue). The clashscore (e) and MolProbity score (f) are costs: the lower the better. For protein names refer to Table 1. ASR was not calculated with EEFx version 1 because that force field does not contain parameters for retinal
The MolProbity clashscore (estimated as the number of serious atomic overlaps per thousand atoms) reflects the quality of nonbonded atomic interactions or atomic packing (Word et al. 1999). By this metric, EEFx2 leads to a dramatic improvement in the structures of all of all proteins examined when compared to structures calculated with REPEL and protein-1.0 (Fig. 2e). As expected, the use of REPEL with protein-3.1, which has been revised with atomic radii from Molprobity, yields structures with the least number of clashes and the most favorable Clashscore (Fig. 2e). All membrane protein and GB1 structures calculated with EEFx2, however, have better overall conformational quality, as reflected in the overall MolProbity score (Chen et al. 2010; Davis et al. 2007), which improves (the lower the better) with EEFx2 (Fig. 2f) even compared to the previous version of the EEFx force field.
Interestingly, the improvement in atomic packing obtained with EEFx2 is in line with the improvement in dipolar coupling cross validation. It has been noted that experimental NMR data are often more consistent with high-resolution crystal structures than NMR structures (Clore and Gronenborn 1998) since X-ray structures are typically better packed and less expanded (Abagyan and Totrov 1997; Gronenborn and Clore 1995); EEFx2 helps correct this problem. A few of the benchmarks included in our analysis (e.g. GB1 and BAF) have very well defined structures determined from nearly complete distance and angle restraint sets. It is notable that even in these cases EEFx2 plays a significant role in improving accuracy, precision and quality.
EEFx2 improves NMR structures determined with sparse-restraints
The ability to guide structures towards their native state is an important property of EEFx. In the case of NMR studies, this helps relieve the burden of having to measure multiple long-range distances for accurate structure determination, and is particularly useful in cases where the number of restraints is relatively sparse, a situation that is often encountered with larger proteins, molecular assemblies and membrane proteins.
To assess the new force field in this respect, we tested its performance in structure calculations of GB1 with a highly reduced set of distance restraints. GB1 was selected for this analysis because its NMR structure (Gronenborn et al. 1991) in the PDB (code 3gb1) is based on an extensive set of experimental restraints and is exceptionally well defined. The restraints include a complete set of NOEs (H–H), dipolar couplings (HN–N, HN–C, N–C) measured in two different alignment media, J couplings (HN–CA), and dihedral angles from chemical shifts (Gronenborn et al. 1991). In addition, the structure was calculated with a target function that included a pseudo-potential term for the radius of gyration (Kuszewski et al. 1999), developed to counteract the tendency toward expansion of NMR structures calculated with REPEL and designed to improve packing quality.
We generated ten independent, reduced restraint sets by, first, removing all experimental dipolar couplings and J couplings, as well as NOEs and hydrogen bonds between sites separated by less than five residues, and then randomly selecting only 4% of the distances from the remaining long-range data. Each of these 10 sets contained only 12 long-range NOEs (0.2 per residue) and was used to fold and refine structures with the simulated annealing protocols described in this study. The dipolar couplings, excluded from the working restraint set, were used only to estimate the R-factor in cross validation. Statistics were generated for the ten lowest energy structures calculated from each independent restraint set. Since the inherent information content of individual distance restraints is not uniform, and influences structural quality (Nabuurs et al. 2005), the use of ten randomly chosen, independent data sets helps reduce bias in this test.
We first compared sparse restraint structures calculated with EEFx2 (Fig. 3, blue) or REPEL with protein-3.1 (Fig. 3, white) to the complete-restraint structure in the PDB [code 3gb1 (Gronenborn et al. 1991)], taken to represent the reference, native state. By this metric, EEFx2 produces structures with dramatically higher accuracy than REPEL (Fig. 3a). Notably, even though both energy functions are capable of determining the overall global fold of the protein, the REPEL structures (Fig. 3e) are visibly distorted and highly expanded compared to those generated with EEFx2 (Fig. 3g).
Fig. 3.

Effect of EEFx2 on sparse restraint structure calculations. Structures of GB1 were calculated using only 4% of the number of long-range (>4 residues apart) distance restrains. The total number of restraints was reduced by randomly eliminating distances from the full data set. Bar plots (a–d) and ribbons (e–h) represent results for the deposited NMR structure (PDB 3gb1; red), or for the average of ten models in each of ten ensembles, calculated from one of ten sparse restraint sets, using REPEL alone (white), REPEL followed by 100 ps relaxation with EEFx2 (cyan), EEFx2 alone (blue), or EEFx2 followed by additional 100 ps relaxation with EEFx2 (yellow). a Average pairwise RMSD agreement with the NMR structure in the PDB (code 3gb1). b Precision evaluated as average pairwise RMSD of atomic coordinates in each ensemble. c Agreement with the residual dipolar couplings not used in structure calculations (DC R-factor), and with full set of experimental distances (distance RMSD). The R-factor is expressed as a % unweighted average over different alignment media. A value of 0% indicates perfect agreement between observed and calculated dipolar couplings, and a value of 100% indicates a completely random structure. d MolProbity analysis. The clashscore and MolProbity score is a cost: the lower the better. e–h Ribbon representations of the PDB (3gb1, red) and lowest energy structures calculated with each of the four protocols
The accuracy improvement averaged over all ten sparse restraint sets is ∼40% and extends to the side chains, as evidenced by inspecting the RMSDs for all non-hydrogen atoms (Fig. 3a, non h). The sparse restraints structures from EEFx2 have average RMSDs of 2.38 Å, for CA atoms, and 2.82 Å, for all non hydrogen atoms, from the reference PDB structure. By contrast the REPEL structures have RMSDs of 3.90 Å for CA atoms and 4.35 Å for all non hydrogens. Improvements with EEFx2 are also observed in precision (Fig. 3b) and, importantly, in cross validation with the experimental data excluded from calculation, including dipolar couplings (24% improvement) and the complete set of experimental distance restraints (44% improvement), including all available short and long-range distances (Fig. 3c).
Together, these results show that the new energy function effectively drives the calculation towards the native state of the protein. Interestingly, these results do not correlate substantially with the Molprobity metrics of structural quality (Fig. 3d). While the sparse restraint structures generated with EEFx2 have more favored backbone dihedral angles, the favored rotamers are equally well populated as in the structures from REPEL, and both REPEL and EEFx2 yield very similar overall Molprobity scores. Furthermore, both REPEL and EEFx2 result in improved Molprobity metrics compared to the PDB structure, even though the latter was determined with the full set of restraints as well as the radius of gyration pseudo-potential. These results mirror the influence of the new protein-3.1 force field that is used with REPEL, where the new Molprobity atomic radii alleviate clashes and improve the clashscore, as observed for the other proteins in our test test (Fig. 2e) and for nucleic acids (Bermejo et al. 2016). In addition, the torsionDB term (Bermejo et al. 2012) helps increase the number of favored side chain rotamers. In this analysis, it is important to consider the structure coordinates and their alignments with the PDB file: despite similar Molprobity scores, the structures generated with REPEL are not optimally folded and remain substantially expanded compared to those from EEFx2.
Notably, we also found that the sparse-restraint structures from REPEL can be substantially improved by performing a short (100 ps in this case) relaxation step with EEFx2, under the influence of the same sparse restraint sets, at a constant temperature of 300 K. Such restrained relaxation (Fig. 3, cyan) leads to appreciable improvements of the REPEL structures in terms of accuracy, precision, cross validation with experimental restraints, and population of backbone Ramachandran space. A similar, restrained relaxation of the sparse restraint structures from EEFx2 leads to further improvements across these key validation metrics (Fig. 3, yellow).
EEFx2 improves accuracy, precision and conformation of membrane protein structures
Our last analysis focused on the integral membrane sensory rhodopsin, ASR, from the anabaema microbe. ASR is a photoactive protein that acts by regulating light-induced interconversion between stable 13-cis and all-trans states of a retinal molecule covalently bound inside the seven transmembrane helix bundle. A crystal structure (PDB 1xio) of has been determined by X-ray diffraction (Vogeley et al. 2004) and a structure in phospholipid bilayer membranes (PDB 2m3g) has been determined by solid-state NMR (Wang et al. 2013). The latter was based on a set of restraints, measured under magic angle spinning (MAS), that include: C–C and H–H distances, hydrogen bonds derived from hydrogen exchange experiments, some long-range distances derived from PRE from the engineered Cys-linked nitroxide tag MTSL, and backbone dihedral angles derived from isotropic chemical shifts.
The new EEFx2 force field gives Xplor-NIH calculations access to the wide variety of parameter sets available in CHARMM for proteins, nucleic acids, lipids, carbohydrates and many organic molecules with a wider variety of molecular groups than the standard amino acids. In the case of ASR for example, we could take advantage of the full set of parameters available for the retinal cofactor in CHARMM, and derive solvation parameters by matching with similar atom types. This allowed us to perform simulated annealing with full degrees of freedom of the retinal moiety, without the need to hold it as a rigid body, as was done for the NMR structure in the PDB (Wang et al. 2013). Retinal parameters were also translated and imported to the Xplor-NIH REPEL force fields to allow direct comparison of the calculations.
In addition, EEFx2 allowed us to import CHARMM partial charges and other nonbonded and bonded parameters for MTSL-linked Cys, and to calculate and report its nonbonded interaction energies with other residues during the structure calculation. The solvation parameters for MTSL-modified Cys were derived by matching to the closest chemical types in the standard amino acids and from Lazaridis's solvation parameter set available for CHARMM EEF (Sammalkorpi and Lazaridis 2007). The MTSL tag is commonly used to measure PRE distance restraints in both solution and solid-state NMR experiments (Clore 2015; Sengupta et al. 2013). The availability of a complete parameter set, including solvation and partial charges, for this key molecule, is a significant advantage enabling calculations of PRE-based structures with implicit water or membrane solvation.
ASR crystallizes as a layer of closely interacting dimers but forms a symmetric trimer in lipid bilayers. The crystal structure was determined at moderately high resolution (2 Å). Several regions were either not defined or poorly resolved by the electron density. The extracellular loop connecting helices B and C was not defined. Furthermore, backbone B-factors > 20 precluded high resolution definition of the intracellular end of transmembrane helix E; in this region, the helix appears visibly distorted away from ideality, suggesting some over fitting of the model to the data. Outside of these regions, the transmembrane helices are very well defined, and the structure also contains a number of resolved lipids that provide information about the interaction of ASR with the membrane.
Our analysis focused on the ASR monomer. We used the solid-state NMR restraints available in the PDB to calculate structures using either the REPEL or EEFx2 energy functions, and analyzed the results with the usual metrics for accuracy, precision and quality. As shown in Figs. 1 and 2, EEFx2 provides significant improvements in the precision and Molprobity structural quality for ASR. In addition, we find that EEFx2 improves agreement with the crystal structure (Fig. 4a). This is consistent with the improvements in packing, dihedral angles, and overall structural quality, all of which have Molprobity estimates closer to the crystal structure. By contrast, agreement to the NMR structure (Fig. 4b) is only slightly improved by EEFx2 and similar to that of structures obtained with REPEL.
Fig. 4.

Effect of EEFx2 on the structure of ASR in lipid bilayers. Structures of monomeric ASR were calculated using solid-state NMR distance and dihedral angle restraints. Bar plots represent results for the deposited crystal structure (PDB 1xio; pink), or the average for ten models in the ensembles of the deposited solid-state NMR structure (PDB 2m3g; red), the ensemble calculated with REPEL alone (gray), the ensemble calculated with REPEL followed by 40 ps relaxation with EEFx (cyan), or the ensemble calculated with EEFx2 alone (blue). a Agreement with the PDB crystal structure (PDB 1xio) evaluated as average pairwise RMSD of atomic coordinates. b Precision evaluated as average pairwise RMSD of atomic coordinates in each ensemble. c MolProbity analysis. The MolProbity score is a cost: the lower the better. d Comparisons of the PDB NMR structure (2m3g, red) or the PDB crystal structure (PDB 1zxio, pink) with lowest energy structure generated with EEFx2 (blue)
Conclusions
The principal purpose of EEFx in Xplor-NIH is to provide a physically realistic energy landscape for NMR-restrained structure calculations without sacrificing ease of use and computation speed. The new EEFx2 force field is derived primarily from CHARMM, thus, allowing NMR structure calculations to take advantage of its vast parameter set, while fully supporting the fundamental advantages of EEFx in generating structures with higher accuracy, precision and quality, and directing structure calculations towards the native state. Aside from their inherent value such improved structures also serve as superior starting points for MD simulations in explicit solvent. Updates to the EEFx energy function enable OpenMP parallelism and improve computation efficiency, affording up to 50% shorter computation times.
Monte Carlo minimization with Rosetta (Das and Baker 2008) has also been shown to improve the quality and accuracy of soluble protein structures determined by NMR (Mao et al. 2014; Ramelot et al. 2009), and has been used to facilitate the search toward lowest-energy conformations in cases where the NMR data are too sparse for conventional methods (Mao et al. 2014; Raman et al. 2010). Rosetta refinement, however, appears to sacrifice the fit between structures and experimental NMR data (Mao et al. 2014). The Rosetta force field (Kuhlman and Baker 2000) is a hybrid of statistical and physical parameter sets. It incorporates elements of the CHARMM19 unified atom energy function, it uses statistical potentials for electrostatic interactions, torsion angles as well as folding free energy, and it models implicit solvation with Lazaridis's EEF/IMM energy functions (Lazaridis 2003; Lazaridis and Karplus 1999). By contrast, the EEFx2 force field of Xplor-NIH contains physical parameters for all the nonbonded energy terms, except for solvation which is also modeled with CHARMM EEF/IMM, and uses only one statistical potential (torsionDB) for torsion angles. In summary, EEFx2 strikes an excellent balance between experimental restraining terms and physical molecular parameters. It is highly compatible with simulated annealing sampling methods and, hence, very well suited for de novo structure calculations from fully extended polypeptide strands.
The quality of NMR structures depends not only on the accuracy and quantity of the experimental data, but also, to a large extent, on the force field used in the structure calculations. Recent advances in computational methods have enabled long MD simulations and concomitant optimization of force fields (Dror et al. 2012; Vanommeslaeghe and MacKerell 2015). The EEFx2 force field allows us to take advantage of these developments and broadens the range of molecular systems that can be calculated with high fidelity from NMR restraints. We have shown that it is useful for soluble proteins and membrane proteins, including those with cofactors or engineered tags. Given its usefulness in cases of sparse restraints, we anticipate that EEFx2 will be able to contribute significantly to the structural information generated for intrinsically disordered proteins and nucleic acids, where solvation plays an important role.
Acknowledgments
We thank Vladimir Ladizhansky for helpful discussion. This research was supported by a grant from the National Institutes of Health (GM118186) and by the Resource for Molecular Imaging of Proteins at UCSD supported by the National Institutes of Health (P41 EB002031) and by the Intramural Research Program of the Center for Information Technology at the National Institutes of Health.
References
- Abagyan RA, Totrov MM. Contact area difference (CAD): a robust measure to evaluate accuracy of protein models. J Mol Biol. 1997;268:678–685. doi: 10.1006/jmbi.1997.0994. [DOI] [PubMed] [Google Scholar]
- Baker NA. Improving implicit solvent simulations: a Poisson-centric view. Curr Opin Struct Biol. 2005;15:137–143. doi: 10.1016/j.sbi.2005.02.001. [DOI] [PubMed] [Google Scholar]
- Bashford D, Case DA. Generalized born models of macro-molecular solvation effects. Annu Rev Phys Chem. 2000;51:129–152. doi: 10.1146/annurev.physchem.51.1.129. [DOI] [PubMed] [Google Scholar]
- Bermejo GA, Clore GM, Schwieters CD. Smooth statistical torsion angle potential derived from a large conformational database via adaptive kernel density estimation improves the quality of NMR protein structures. Protein Sci. 2012;21:1824–1836. doi: 10.1002/pro.2163. [DOI] [PMC free article] [PubMed] [Google Scholar]
- Bermejo GA, Clore GM, Schwieters CD. Improving NMR Structures of RNA. Structure. 2016;24:806–815. doi: 10.1016/j.str.2016.03.007. [DOI] [PMC free article] [PubMed] [Google Scholar]
- Bertini I, Case DA, Ferella L, Giachetti A, Rosato A. A Grid-enabled web portal for NMR structure refinement with AMBER. Bioinformatics. 2011;27:2384–2390. doi: 10.1093/bioinformatics/btr415. [DOI] [PubMed] [Google Scholar]
- Brooks BR, et al. CHARMM: the biomolecular simulation program. J Comput Chem. 2009;30:1545–1614. doi: 10.1002/jcc.21287. [DOI] [PMC free article] [PubMed] [Google Scholar]
- Brunger AT. X-PLOR, Version 3.1: a system for X-ray crystallography and NMR. Yale University Press; New Haven: 1992. [Google Scholar]
- Brunger AT, et al. Crystallography & NMR system: a new software suite for macromolecular structure determination. Acta Crystallogr D Biol Crystallogr. 1998;54(Pt 5):905–921. doi: 10.1107/s0907444998003254. [DOI] [PubMed] [Google Scholar]
- Cai M, et al. Solution structure of the cellular factor BAF responsible for protecting retroviral DNA from autointegration. Nat Struct Biol. 1998;5:903–909. doi: 10.1038/2345. [DOI] [PubMed] [Google Scholar]
- Case DA, et al. The Amber biomolecular simulation programs. J Comput Chem. 2005;26:1668–1688. doi: 10.1002/jcc.20290. [DOI] [PMC free article] [PubMed] [Google Scholar]
- Chen J, Brooks CL, 3rd, Khandogin J. Recent advances in implicit solvent-based methods for biomolecular simulations. Curr Opin Struct Biol. 2008;18:140–148. doi: 10.1016/j.sbi.2008.01.003. [DOI] [PMC free article] [PubMed] [Google Scholar]
- Chen J, Im W, Brooks CL., 3rd Refinement of NMR structures using implicit solvent and advanced sampling techniques. J Am Chem Soc. 2004;126:16038–16047. doi: 10.1021/ja047624f. [DOI] [PubMed] [Google Scholar]
- Chen J, Won HS, Im W, Dyson HJ, Brooks CL., 3rd Generation of native-like protein structures from limited NMR data, modern force fields and advanced conformational sampling. J Biomol NMR. 2005;31:59–64. doi: 10.1007/s10858-004-6056-z. [DOI] [PubMed] [Google Scholar]
- Chen VB, et al. MolProbity: all-atom structure validation for macromolecular crystallography. Acta Crystallogr D Biol Crystallogr. 2010;66:12–21. doi: 10.1107/S0907444909042073. [DOI] [PMC free article] [PubMed] [Google Scholar]
- Cheng X, Im W. NMR observable-based structure refinement of DAP12-NKG2C activating immunoreceptor complex in explicit membranes. Biophys J. 2012;102:L27–L29. doi: 10.1016/j.bpj.2012.03.002. [DOI] [PMC free article] [PubMed] [Google Scholar]
- Cheng X, Jo S, Marassi FM, Im W. NMR-based simulation studies of Pf1 coat protein in explicit membranes. Biophys J. 2013;105:691–698. doi: 10.1016/j.bpj.2013.06.040. [DOI] [PMC free article] [PubMed] [Google Scholar]
- Clore GM. Practical aspects of paramagnetic relaxation enhancement in biological macromolecules. Methods Enzymol. 2015;564:485–497. doi: 10.1016/bs.mie.2015.06.032. [DOI] [PMC free article] [PubMed] [Google Scholar]
- Clore GM, Garrett DS. R-factor, free R, and complete cross-validation for dipolar coupling refinement of NMR structures. J Am Chem Soc. 1999;121:9008–9012. [Google Scholar]
- Clore GM, Gronenborn AM. Determination of three-dimensional structures of proteins and nucleic acids in solution by nuclear magnetic resonance spectroscopy. Crit Rev Biochem Mol Biol. 1989;24:479–564. doi: 10.3109/10409238909086962. [DOI] [PubMed] [Google Scholar]
- Clore GM, Gronenborn AM. New methods of structure refinement for macromolecular structure determination by NMR. Proc Natl Acad Sci USA. 1998;95:5891–5898. doi: 10.1073/pnas.95.11.5891. [DOI] [PMC free article] [PubMed] [Google Scholar]
- Cornilescu G, et al. Structural analysis of multi-helical RNAs by NMR-SAXS/WAXS: application to the U4/U6 di-snRNA. J Mol Biol. 2016;428:777–789. doi: 10.1016/j.jmb.2015.11.026. [DOI] [PMC free article] [PubMed] [Google Scholar]
- Cross TA, Ekanayake V, Paulino J, Wright A. Solid state NMR: the essential technology for helical membrane protein structural characterization. J Magn Reson. 2014;239:100–109. doi: 10.1016/j.jmr.2013.12.006. [DOI] [PMC free article] [PubMed] [Google Scholar]
- Das R, Baker D. Macromolecular modeling with rosetta. Annu Rev Biochem. 2008;77:363–382. doi: 10.1146/annurev.biochem.77.062906.171838. [DOI] [PubMed] [Google Scholar]
- Das N, Dai J, Hung I, Rajagopalan MR, Zhou HX, Cross TA. Structure of CrgA, a cell division structural and regulatory protein from Mycobacterium tuberculosis, in lipid bilayers. Proc Natl Acad Sci USA. 2015;112:E119–E126. doi: 10.1073/pnas.1415908112. [DOI] [PMC free article] [PubMed] [Google Scholar]
- Davis IW, et al. MolProbity: all-atom contacts and structure validation for proteins and nucleic acids. Nucleic Acids Res. 2007;35:W375–W383. doi: 10.1093/nar/gkm216. [DOI] [PMC free article] [PubMed] [Google Scholar]
- DeLano WL. PyMol 2005 [Google Scholar]
- Dror RO, Dirks RM, Grossman JP, Xu H, Shaw DE. Biomolecular simulation: a computational microscope for molecular biology. Annu Rev Biophys. 2012;41:429–452. doi: 10.1146/annurev-biophys-042910-155245. [DOI] [PubMed] [Google Scholar]
- Feeney J, Birdsall B, Kovalevskaya NV, Smurnyy YD, Navarro Peran EM, Polshakov VI. NMR structures of apo L. casei dihydrofolate reductase and its complexes with trimethoprim and NADPH: contributions to positive cooperative binding from ligand-induced refolding, conformational changes, and interli-gand hydrophobic interactions. Biochemistry. 2011;50:3609–3620. doi: 10.1021/bi200067t. [DOI] [PMC free article] [PubMed] [Google Scholar]
- Feig M, Brooks CL., 3rd Recent advances in the development and application of implicit solvent models in biomolecule simulations. Curr Opin Struct Biol. 2004;14:217–224. doi: 10.1016/j.sbi.2004.03.009. [DOI] [PubMed] [Google Scholar]
- Garrett DS, Seok YJ, Liao DI, Peterkofsky A, Gronenborn AM, Clore GM. Solution structure of the 30 kDa N-terminal domain of enzyme I of the Escherichia coli phosphoenolpyruvate: sugar phosphotransferase system by multidimensional NMR. BioChemistry. 1997;36:2517–2530. doi: 10.1021/bi962924y. [DOI] [PubMed] [Google Scholar]
- Garrett DS, Seok YJ, Peterkofsky A, Gronenborn AM, Clore GM. Solution structure of the 40,000 Mr phosphoryl transfer complex between the N-terminal domain of enzyme I and HPr. Nat Struct Biol. 1999;6:166–173. doi: 10.1038/5854. [DOI] [PubMed] [Google Scholar]
- Gronenborn AM, Clore GM. Structures of protein complexes by multidimensional heteronuclear magnetic resonance spectroscopy. Crit Rev Biochem Mol Biol. 1995;30:351–385. doi: 10.3109/10409239509083489. [DOI] [PubMed] [Google Scholar]
- Gronenborn AM, Filpula DR, Essig NZ, Achari A, Whitlow M, Wingfield PT, Clore GM. A novel, highly stable fold of the immunoglobulin binding domain of streptococcal protein G. Science. 1991;253:657–661. doi: 10.1126/science.1871600. [DOI] [PubMed] [Google Scholar]
- Guntert P. Structure calculation of biological macromolecules from NMR data. Q Rev Biophys. 1998;31:145–237. doi: 10.1017/s0033583598003436. [DOI] [PubMed] [Google Scholar]
- Guntert P. Automated NMR structure calculation with CYANA Methods. Mol Biol. 2004;278:353–378. doi: 10.1385/1-59259-809-9:353. [DOI] [PubMed] [Google Scholar]
- Guntert P, Mumenthaler C, Wuthrich K. Torsion angle dynamics for NMR structure calculation with the new program DYANA. J Mol Biol. 1997;273:283–298. doi: 10.1006/jmbi.1997.1284. [DOI] [PubMed] [Google Scholar]
- Hagn F, Etzkorn M, Raschle T, Wagner G. Optimized phospholipid bilayer nanodiscs facilitate high-resolution structure determination of membrane proteins. J Am Chem Soc. 2013;135:1919–1925. doi: 10.1021/ja310901f. [DOI] [PMC free article] [PubMed] [Google Scholar]
- Im W, Brooks CL., 3rd De novo folding of membrane proteins: an exploration of the structure and NMR properties of the fd coat protein. J Mol Biol. 2004;337:513–519. doi: 10.1016/j.jmb.2004.01.045. [DOI] [PubMed] [Google Scholar]
- Jureka AS, Kleinpeter AB, Cornilescu G, Cornilescu CC, Petit CM. Structural basis for a novel interaction between the NS1 protein derived from the 1918 influenza virus and RIG-I. Structure. 2015;23:2001–2010. doi: 10.1016/j.str.2015.08.007. [DOI] [PMC free article] [PubMed] [Google Scholar]
- Kuhlman B, Baker D. Native protein sequences are close to optimal for their structures. Proc Natl Acad Sci USA. 2000;97:10383–10388. doi: 10.1073/pnas.97.19.10383. [DOI] [PMC free article] [PubMed] [Google Scholar]
- Kuszewski J, Gronenborn AM, Clore GM. Improving the packing and accuracy of NMR structures with a pseudopotential for the radius of gyration. J Am Chem Soc. 1999;121:2337–2338. [Google Scholar]
- Lazaridis T. Effective energy function for proteins in lipid membranes. Proteins. 2003;52:176–192. doi: 10.1002/prot.10410. [DOI] [PubMed] [Google Scholar]
- Lazaridis T, Karplus M. Effective energy function for proteins in solution. Proteins. 1999;35:133–152. doi: 10.1002/(SICI)1097-0134(19990501)35:2<133∷AID-PROT1>3.0.CO;2-N. [DOI] [PubMed] [Google Scholar]
- Lee W, Petit CM, Cornilescu G, Stark JL, Markley JL. The AUDANA algorithm for automated protein 3D structure determination from NMR NOE data. J Biomol NMR. 2016;65:51–57. doi: 10.1007/s10858-016-0036-y. [DOI] [PMC free article] [PubMed] [Google Scholar]
- Linge JP, Nilges M. Influence of non-bonded parameters on the quality of NMR structures: a new force field for NMR structure calculation. J Biomol NMR. 1999;13:51–59. doi: 10.1023/a:1008365802830. [DOI] [PubMed] [Google Scholar]
- Linge JP, Williams MA, Spronk CA, Bonvin AM, Nilges M. Refinement of protein structures in explicit solvent. Proteins. 2003;50:496–506. doi: 10.1002/prot.10299. [DOI] [PubMed] [Google Scholar]
- Lovell SC, et al. Structure validation by Calpha geometry: phi, psi and Cbeta deviation. Proteins. 2003;50:437–450. doi: 10.1002/prot.10286. [DOI] [PubMed] [Google Scholar]
- Mahalakshmi R, Marassi FM. Orientation of the Escherichia coli outer membrane protein OmpX in phospholipid bilayer membranes determined by solid-state NMR. BioChemistry. 2008;47:6531–6538. doi: 10.1021/bi800362b. [DOI] [PMC free article] [PubMed] [Google Scholar]
- Mao B, Tejero R, Baker D, Montelione GT. Protein NMR structures refined with Rosetta have higher accuracy relative to corresponding X-ray crystal structures. J Am Chem Soc. 2014;136:1893–1906. doi: 10.1021/ja409845w. [DOI] [PMC free article] [PubMed] [Google Scholar]
- Marassi FM, Opella SJ. Simultaneous assignment and structure determination of a membrane protein from NMR orientational restraints. Protein Sci. 2003;12:403–411. doi: 10.1110/ps.0211503. [DOI] [PMC free article] [PubMed] [Google Scholar]
- Marassi FM, Ding Y, Schwieters CD, Tian Y, Yao Y. Backbone structure of Yersinia pestis Ail determined in micelles by NMR-restrained simulated annealing with implicit membrane solvation. J Biomol NMR. 2015;63:59–65. doi: 10.1007/s10858-015-9963-2. [DOI] [PMC free article] [PubMed] [Google Scholar]
- Murray DT, Li C, Gao FP, Qin H, Cross TA. Membrane protein structural validation by oriented sample solid-state NMR: diacylglycerol kinase. Biophys J. 2014;106:1559–1569. doi: 10.1016/j.bpj.2014.02.026. [DOI] [PMC free article] [PubMed] [Google Scholar]
- Nabuurs SB, et al. DRESS: a database of REfined solution NMR structures. Proteins. 2004;55:483–486. doi: 10.1002/prot.20118. [DOI] [PubMed] [Google Scholar]
- Nabuurs SB, Krieger E, Spronk CA, Nederveen AJ, Vriend G, Vuister GW. Definition of a new information-based per-residue quality parameter. J Biomol NMR. 2005;33:123–134. doi: 10.1007/s10858-005-2826-5. [DOI] [PubMed] [Google Scholar]
- Nederveen AJ, et al. RECOORD: a recalculated coordinate database of 500+ proteins from the PDB using restraints from the BioMagResBank. Proteins. 2005;59:662–672. doi: 10.1002/prot.20408. [DOI] [PubMed] [Google Scholar]
- Nilges M, Gronenborn AM, Brunger AT, Clore GM. Determination of three-dimensional structures of proteins by simulated annealing with interproton distance restraints. Application to crambin, potato carboxypeptidase inhibitor and barley serine proteinase inhibitor 2. Protein Eng. 1988;2:27–38. doi: 10.1093/protein/2.1.27. [DOI] [PubMed] [Google Scholar]
- Raman S, et al. NMR structure determination for larger proteins using backbone-only data. Science. 2010;327:1014–1018. doi: 10.1126/science.1183649. [DOI] [PMC free article] [PubMed] [Google Scholar]
- Ramelot TA, et al. Improving NMR protein structure quality by Rosetta refinement: a molecular replacement study. Proteins. 2009;75:147–167. doi: 10.1002/prot.22229. [DOI] [PMC free article] [PubMed] [Google Scholar]
- Roux B, Simonson T. Implicit solvent models. Biophys Chem. 1999;78:1–20. doi: 10.1016/s0301-4622(98)00226-9. [DOI] [PubMed] [Google Scholar]
- Sammalkorpi M, Lazaridis T. Modeling a spin-labeled fusion peptide in a membrane: implications for the interpretation of EPR experiments. Biophys J. 2007;92:10–22. doi: 10.1529/biophysj.106.092809. [DOI] [PMC free article] [PubMed] [Google Scholar]
- Schwieters CD, Clore GM. Internal coordinates for molecular dynamics and minimization in structure determination and refinement. J Magn Reson. 2001;152:288–302. doi: 10.1006/jmre.2001.2413. [DOI] [PubMed] [Google Scholar]
- Schwieters CD, Kuszewski JJ, Tjandra N, Clore GM. The Xplor-NIH NMR molecular structure determination package. J Magn Reson. 2003;160:65–73. doi: 10.1016/s1090-7807(02)00014-9. [DOI] [PubMed] [Google Scholar]
- Schwieters CD, Kuszewski JJ, Marius Clore G. Using Xplor–NIH for NMR molecular structure determination. Prog Nucl Magn Reson Spectrosc. 2006;48:47–62. doi: 10.1016/j.pnmrs.2005.10.001. [DOI] [Google Scholar]
- Sengupta I, Nadaud PS, Jaroniec CP. Protein structure determination with paramagnetic solid-state NMR spectroscopy. Acc Chem Res. 2013;46:2117–2126. doi: 10.1021/ar300360q. [DOI] [PubMed] [Google Scholar]
- Sharma M, et al. Insight into the mechanism of the influenza A proton channel from a structure in a lipid bilayer. Science. 2010;330:509–512. doi: 10.1126/science.1191750. [DOI] [PMC free article] [PubMed] [Google Scholar]
- Shi L, Traaseth NJ, Verardi R, Cembran A, Gao J, Veglia G. A refinement protocol to determine structure, topology, and depth of insertion of membrane proteins using hybrid solution and solid-state NMR restraints. J Biomol NMR. 2009;44:195–205. doi: 10.1007/s10858-009-9328-9. [DOI] [PMC free article] [PubMed] [Google Scholar]
- Spronk CA, Linge JP, Hilbers CW, Vuister GW. Improving the quality of protein structures derived by NMR spectroscopy. J Biomol NMR. 2002;22:281–289. doi: 10.1023/a:1014971029663. [DOI] [PubMed] [Google Scholar]
- Teriete P, Franzin CM, Choi J, Marassi FM. Structure of the Na, K-ATPase regulatory protein FXYD1 in micelles. BioChemistry. 2007;46:6774–6783. doi: 10.1021/bi700391b. [DOI] [PMC free article] [PubMed] [Google Scholar]
- Teriete P, Yao Y, Kolodzik A, Yu J, Song H, Niederweis M, Marassi FM. Mycobacterium tuberculosis Rv0899 adopts a mixed alpha/beta-structure and does not form a transmembrane beta-barrel. Biochemistry. 2010;49:2768–2777. doi: 10.1021/bi100158s. [DOI] [PMC free article] [PubMed] [Google Scholar]
- Tian Y, Schwieters CD, Opella SJ, Marassi FM. A practical implicit solvent potential for NMR structure calculation. J Magn Reson. 2014;243:54–64. doi: 10.1016/j.jmr.2014.03.011. [DOI] [PMC free article] [PubMed] [Google Scholar]
- Tian Y, Schwieters CD, Opella SJ, Marassi FM. A practical implicit membrane potential for NMR structure calculations of membrane proteins. Biophys J. 2015;109:574–585. doi: 10.1016/j.bpj.2015.06.047. [DOI] [PMC free article] [PubMed] [Google Scholar]
- Vanommeslaeghe K, MacKerell AD., Jr CHARMM additive and polarizable force fields for biophysics and computer-aided drug design. Biochim Biophys Acta. 2015;1850:861–871. doi: 10.1016/j.bbagen.2014.08.004. [DOI] [PMC free article] [PubMed] [Google Scholar]
- Vogeley L, Sineshchekov OA, Trivedi VD, Sasaki J, Spudich JL, Luecke H. Anabaena sensory rhodopsin: a photochromic color sensor at 2.0 Å. Science. 2004;306:1390–1393. doi: 10.1126/science.1103943. [DOI] [PMC free article] [PubMed] [Google Scholar]
- Wang Y, Schwieters CD, Tjandra N. Parameterization of solvent-protein interaction and its use on NMR protein structure determination. J Magn Reson. 2012;221:76–84. doi: 10.1016/j.jmr.2012.05.020. [DOI] [PMC free article] [PubMed] [Google Scholar]
- Wang S, et al. Solid-state NMR spectroscopy structure determination of a lipid-embedded heptahelical membrane protein. Nat Methods. 2013;10:1007–1012. doi: 10.1038/nmeth.2635. [DOI] [PubMed] [Google Scholar]
- Ward ME, Brown LS, Ladizhansky V. Advanced solid-state NMR techniques for characterization of membrane protein structure and dynamics: application to Anabaena Sensory Rhodopsin. J Magn Reson. 2015;253:119–128. doi: 10.1016/j.jmr.2014.11.017. [DOI] [PubMed] [Google Scholar]
- Word JM, et al. Visualizing and quantifying molecular goodness-of-fit: small-probe contact dots with explicit hydrogen atoms. J Mol Biol. 1999;285:1711–1733. doi: 10.1006/jmbi.1998.2400. [DOI] [PubMed] [Google Scholar]
- Xia B, Tsui V, Case DA, Dyson HJ, Wright PE. Comparison of protein solution structures refined by molecular dynamics simulation in vacuum, with a generalized Born model, and with explicit water. J Biomol NMR. 2002;22:317–331. doi: 10.1023/a:1014929925008. [DOI] [PubMed] [Google Scholar]
- Xu C, et al. Regulation of T cell receptor activation by dynamic membrane binding of the CD3epsilon cytoplasmic tyrosine-based motif. Cell. 2008;135:702–713. doi: 10.1016/j.cell.2008.09.044. [DOI] [PMC free article] [PubMed] [Google Scholar]