Abstract
We isolated three recessive mutants of Arabidopsis (Arabidopsis thaliana) showing ectopic expression of the xylem-specific marker, pAtxyn3::YFP. Genetic analysis indicated that the phenotypes were caused by mutations in three different genes, designated Abnormal Tracheary Element formation-related gene expression (ate1–3). The ate1 mutants showed a normal DR5::GUS gene expression pattern, and the ate1 mutation did not affect the abnormal vascular pattern formation in the van3 and pin1 mutants, indicating that the ate1 mutation does not affect the vascular pattern organization governed by auxin. The ate mutants showed ectopic lignin deposition, patterned secondary wall thickenings, and cell death, which are characteristic of mature tracheary elements (TEs) in cells ectopically expressing the pAtxyn3::YFP gene. Ectopic TE formation was rapidly induced in parenchymal tissue of the ate mutants in a TE-inducible system with excised hypocotyl. Furthermore, reverse transcription-polymerase chain reaction experiments showed that the expression of TE formation-related genes is up-regulated in the ate mutants. The ate1 mutation also caused ectopic expression of another xylem-specific marker gene, pAt3g62160::YFP. Overall, our results suggest that the ATE genes are responsible for the in situ repression of transdifferentiation into TEs in Arabidopsis and could be participants in the transdifferentiation-masking system.
In contrast to animals, plants have a flexible transdifferentiation ability. Many differentiated plant organs, tissues, and cells retain the ability to regenerate all parts of the plant body. Plants can regenerate in tissue culture, as demonstrated by Stewart (1958), who observed somatic embryogenesis in carrot (Daucus carota). The obvious conclusion from these experiments is that even single vegetative carrot cells retain their totipotency. In organogenesis, plant organs can be produced without embryonic development. Various individual organs such as roots, shoots, flower buds, and inflorescences can be regenerated, in most cases, via callus from somatic tissues or somatic cells (Lu, 2003).
Why is it that transdifferentiation is not expressed during normal plant development? Why can many types of organs (cells) be transdifferentiated from somatic cells? These basic questions may be explained by the transdifferentiation-masking system that exists in normal plant development enabling rapid reorganization of the plant body, depending on external stimulus. In fact, some genes prevent transdifferentiation, such as PICKLE (PKL), a gene identified in Arabidopsis (Arabidopsis thaliana) that prevents roots from making embryos. The roots of pkl mutants express embryo-specific genes. If pkl roots are placed in culture medium without hormones, they will occasionally generate somatic embryos, unlike roots from wild-type plants, which require hormones. Furthermore, overexpression of the LEAFY COTYLEDON gene induces ectopic embryo formation in vegetative tissues such as cotyledons, and the PKL gene is required to repress LEAFY COTYLEDON (Wilt and Hake, 2004).
In the transdifferentiation of somatic cells, reorganization of the gene expression pattern, the methylation pattern of genomic DNA, histone acetylation, telomere elongation, and some other events is required. These events can be modified depending on the transdifferentiating cell (organ) types. Despite the importance of the transdifferentiation system in plant biology, very little is known about the underlying molecular mechanisms.
The first hints about how plants regulate transdifferentiation came from studies on carrot cell cultures (Reghavan, 1986). Pretreatment with a synthetic auxin is essential for inducing the embryogenic potential of callus cells, and the subsequent removal of auxin leads to the formation of somatic embryos (Stewart et al., 1958; Reinhert, 1959). Auxin seems to be one of the key regulators in dedifferentiation and subsequent somatic embryogenesis. However, it is still unknown how auxin regulates transdifferentiation.
Restricted model systems have clarified the difficulties of analyzing the molecular mechanisms of the transdifferentiation system. Dedifferentiation induced by nuclear transplantation, stress, hormone treatment, and other factors, and subsequent callus formation or somatic organogenesis are usually accompanied by many types of cell differentiation, including various types of molecular events such as stress responses, hormone responses, healing, and cell division. Thus, it is difficult to focus on the mechanisms of the transdifferentiation system. In this situation, tracheary element (TE) transdifferentiation is an excellent study example occurring at the cellular level in vascular plants (Fukuda, 1994). TE transdifferentiation may be one of the best indicators for analysis of the molecular mechanisms underlying the plasticity of differentiation potency in plants because the molecular events of single cell transdifferentiation are less complex in comparison with that of organ (tissue) regeneration, which comprises many different types of cell differentiations. Furthermore, TEs are easily identified because of their characteristic pattern of secondary wall thickening and subsequent cell death. By using the simple in vitro TE transdifferentiation system of zinnia (Zinnia elegans), in which isolated mesophyll cells transdifferentiate into TEs, various aspects of the TE development have been revealed (Fukuda, 2004). Nevertheless, it has been difficult to study the transdifferentiation-masking mechanism that occurs in situ using the in vitro zinnia system because the in vitro transdifferentiation processes include various responses to artificial external stimuli such as excision stress, culture stress, and supplied plant hormones.
As genetic analysis of the TE transdifferentiation in situ seems to be the best approach to overcoming such difficulties, we isolated mutants showing ectopic TE transdifferentiation. For effective screening of this type of mutant, we used a transgenic plant harboring a TE-specific marker. We have previously demonstrated the TE-specific expression of the xylanase gene of Z. elegans, Z6874 (Demura et al., 2002). Here we showed that its Arabidopsis homolog, Atxylanase3, is expressed in a TE-specific manner. Using transgenic plants harboring Atxyn3::YFP, we isolated Arabidopsis Abnormal Tracheary Element formation-related gene expression 1 to 3 (ate1–3) mutants, which exhibited ectopic expression of the TE marker, Atxyn3::YFP. From physiological, genetic, and molecular analyses, we suggest that the ATE genes are responsible for the repression of transdifferentiation into TEs in situ, and that the ATE genes may participate in the transdifferentiation-masking system.
RESULTS
Construction of a Xylem Cell Marker Line
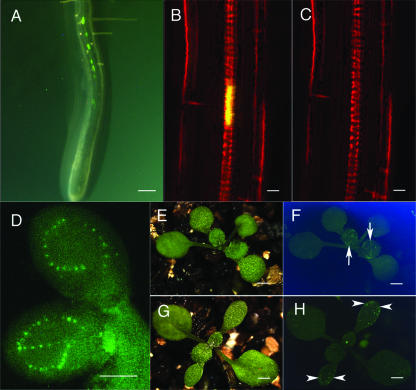
We have shown previously that xylanase gene (Z6874) expression is detected only in developing TEs in Z. elegans (Demura et al., 2002). Arabidopsis Atxylanase 3 (Atxyn3::At4g08160) exhibits significant sequence homology to Z6874 (data not shown). To test the possibility of using the Atxyn3 gene promoter as a TE molecular marker, we analyzed the Atxyn3 promoter region 2 kb upstream of the start codon, using a yellow fluorescence protein (YFP) reporter gene in transgenic Arabidopsis. Four independent transgenic plants showed the same marker gene expression pattern, and we selected one transgenic plant, Atxyn3::YFP, as a xylem marker line. In the root, xylem cell maturation starts in the maturation zone (Fig. 1A), and YFP gene expression was observed in maturing TEs in the root maturation zone (Fig. 1, A and B). In our system, a nuclear localization signal was translationally fused with YFP, and the YFP signal was observed only in the nucleus of the developing TEs (Fig. 1, B and D). The YFP signal appeared transiently. As shown in Figure 1, B and C, the YFP signal appeared just before, and disappeared just after, the vacuole collapsed. Differentiation of TEs in the cotyledon varies greatly with developmental stage. TE development is repressed during embryogenesis and occurs at 2 d after germination (DAG; Busse and Evert, 1999a, 1999b). After 3 DAG, only the differentiating TEs show the YFP signal. Figures 1D, 2E, and 5C show the different developing stages of cotyledons, at 2 DAG, 3 DAG, and 14 DAG, respectively. At 2 DAG, most TEs are developing and show the YFP signal (Fig. 1D). At 14 DAG, most TEs are already mature and show no YFP signal (Fig. 5C). YFP signals were observed only in the developing TEs of all organs tested, i.e. the roots, hypocotyls, cotyledon, leaf, sepal, petal, stamen, and carpel. TE differentiation is accompanied by programmed cell death, and senescence, wound, and pathogen responses also involve programmed cell death. However, the Atxyn3::YFP marker gene was not expressed in wounded tissues or tissues undergoing senescence (data not shown). Tao et al. (2003) performed a comprehensive analysis using the Affymetrix GeneChip to study Arabidopsis responses to a bacterial pathogen and found the Atxyn3 expression was not induced by the pathogen. These results indicate that Atxyn3::YFP can be used as a developing TE-specific marker.
Figure 1.
Atxyn3::YFP marker gene expression. Wild type (A–F) and ate3 mutant (G and H) are shown. YFP signals were examined by fluorescent microscope (A, D, F, and H) and by a confocal laser scanning microscope (B and C). E and G are daylight images. In the wild-type seedlings, YFP fluorescence signals appeared along a line of the vasculatures of the root (A) and cotyledon (D and F). The YFP signal is detected in the nucleus of a developing TE (B), but it is lost during maturation of a TE (C). In the ate mutant, ectopic YFP signals appear independent of vasculatures (H). White arrows in F show YFP signals in the developing TEs. White arrowheads in H show ectopic YFP signals. Scale bars, 100 μm (A), 10 μm (B and C), and 1 mm (D–H).
Figure 2.
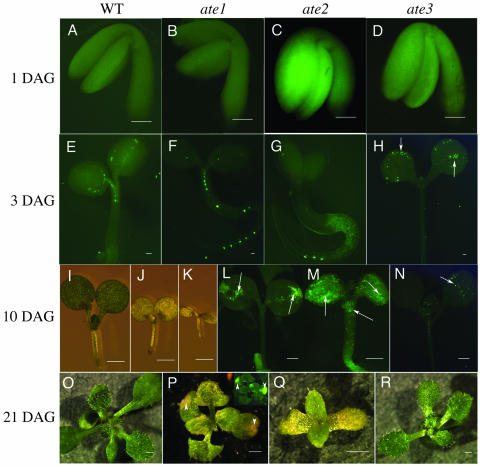
Expression pattern of the Atxyn3::YFP marker gene and phenotypes of seedlings. Wild type (A, E, I, and O), ate1 (B, F, J, L, and P), ate2 (C, G, K, M, and Q), and ate3 (D, H, N, and R) are shown. Seedlings were grown for 1 d (A–D), 3 d (E–H), 10 d (I–N), 14 d (Q), and 21 d (O, P, and R). Arrows in H, L, M, and N show ectopic Atxyn3::YFP marker expression. Arrowheads indicate the ectopic Atxyn3::YFP marker gene expression (P, inset), and dying cell region (P). Scale bars, 100 μm (A–H) and 1 mm (I–R).
Figure 5.
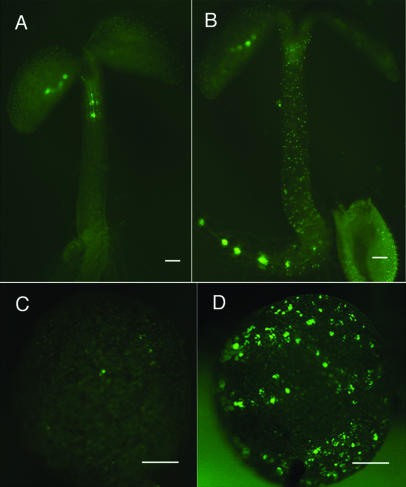
pAt3g62160::YFP marker gene expression. Wild type (A and C) and the ate1 mutant (B and D) are shown. Note the ectopic distribution of fluorescence signals in the hypocotyl (B) and cotyledon (D) of the ate1 mutant. Scale bars, 500 μm (A–D).
Isolation of Mutants Showing Abnormal Xylem Marker Gene Expression
The cotyledon of Arabidopsis has a very simple vein pattern, i.e. one midvein and three or four lateral veins (Fig. 1D). Using this pattern as an index, we examined mutagenized Atxyn3::YFP transgenic lines for mutants showing the ectopic YFP expression pattern, in order to investigate the molecular mechanisms of the transdifferentiation repression system. The screening of 10,000 M2 plants resulted in the isolation of 3 mutants with ectopic marker gene expression (Fig. 1, E–H). In each mutant line, we observed segregation of the seedlings that exhibited aberrancy in the YFP expression pattern in a ratio (3:1) consistent with a single recessive lesion. In the complementation test, by crossing the three mutants with each other, it was found that these three mutants represented single mutant alleles at three genetic loci. These mutants were designated as ate1, ate2, and ate3. We mapped these ATE loci to chromosome 1 between nga280 and nga111 (ATE1), to chromosome 5 between nga151 and nga139 (ATE2), and to chromosome 3, the northern part of nga126 (ATE3).
Vascular cell maturation starts 2 or 3 DAG (Busse and Evert, 1999a, 1999b), and the YFP signal in Atxyn3::YFP transgenic plants was also evident at 3 DAG in Arabidopsis (Fig. 2, A and E). Ectopic expression was observed from 10, 10, and 3 DAG in the ate1, ate2, and ate3 mutants, respectively (Fig. 2, B–D, F–H, and L–N). In the ate1 mutants, patches of YFP-expressing cells were observed (Fig. 2L). YFP signals were present randomly in the parenchyma tissues of the ate2 and ate3 mutants (Fig. 2, H, M, and N). The ate1 and ate2 mutants produced pale green organs (Fig. 2, I–K and O–Q). The plant size of the ate1 mutants was about 70% of the wild type. The ate2 mutant did not germinate in the soil, but it could germinate and produce up to four to five rosette leaves on the agar plates (Fig. 2Q). About 2 weeks after germination, ate2 plants had a diameter of about 1 cm and died without producing any floral buds. The morphology of ate3 plants was almost the same as that of wild-type plants (Fig. 2, O and R). Cell death was also observed in the YFP-expressing cells at about 3 weeks after germination of the ate1 and ate3 mutants, and at about 1 to 2 weeks after germination of the ate2 mutant (Fig. 2P).
Lignin Accumulation in the ate Mutants
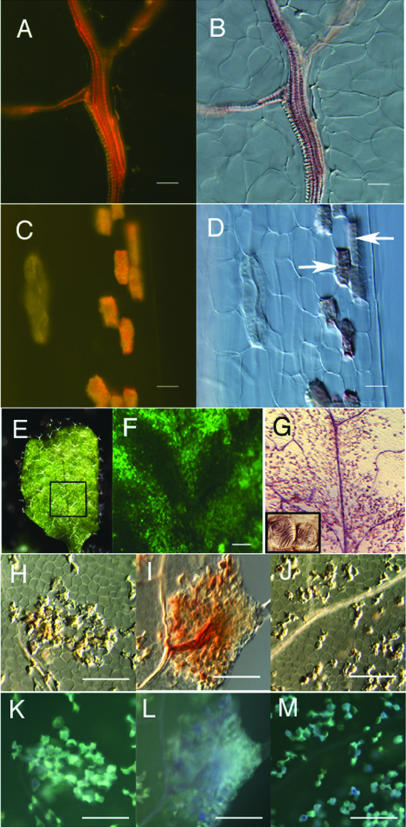
Lignin, a complex phenylpropanoid polymer, is a characteristic component of TEs, and it can be visualized by using UV illumination or the lignin-staining dye, phloroglucinol-HCl (Fig. 3, A and B). To examine whether ate mutants produce ectopic TEs, we examined the pattern of lignin deposition in their leaves and found ectopic lignin deposition occurred in some parenchyma cells (Fig. 3, C, D, and H–M). In some cases, a striped pattern of secondary walls was observed in these cells (Fig. 3, C, D, and G). The ectopic lignin-accumulating region was consistent with the ectopic YFP-expressing region (Fig. 3, E–G). In the ate1 mutant, patches of cells with ectopic lignin accumulation were also observed (Fig. 3, I and L). These results suggest that the parenchyma cells of these mutants transdifferentiated into TEs.
Figure 3.
Observation of the lignin deposition in rosette leaves of 3-week-old plants. Wild type (A and B), ate3 (C–G), ate1 (H, I, K, and L), and ate2 (J and M) are shown. Lignin was visualized by phloroglucinol-HCl staining (B, D, G, and H–J) or UV illumination (A, C, and K–M). A region of the daylight image of ate3 leaf (E, inset) is magnified in F (YFP fluorescent) and G (phloroglucinol staining). The inset of G shows ectopically formed lignified cells with spiral secondary wall thickenings, which indicates TE formation. White arrows in D also indicate ectopically formed TEs with spiral lignin deposition. Scale bars, 25 μm (A–D) and 100 μm (F–M).
Effect of the ate Mutation on the Induction of TE Transdifferentiation
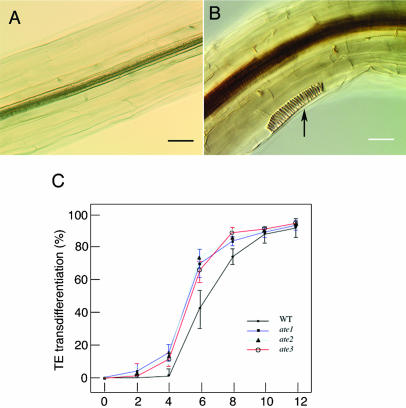
Our finding that the ate mutations cause ectopic induction of TEs prompted us to investigate further the potential of parenchyma cells to transdifferentiate into TE cells in ate mutants. We developed an in vitro system, in which parenchyma cells transdifferentiate into TE cells by incubating the hypocotyl on liquid medium containing brassinosteroids (H. Fukuda, unpublished data). In the wild type, ectopic TEs were transdifferentiated at 5 to 6 d after treatment, when they were identified by the presence of helical secondary wall thickenings. In the ate mutants, TE transdifferentiation was observed 3 to 4 d after treatment (Fig. 4, A and B), and the transdifferentiation was more efficient as compared with the wild type (Fig. 4C). This result suggests that the ate mutations increase the sensitivity of the cells to the induction of TE transdifferentiation, which might lead to the formation of the ectopic TEs.
Figure 4.
In vitro TE induction in the ate mutants. Hypocotyls of the wild type (A) and the ate1 mutant (B) at 4 d after treatment are shown. The frequency of TE transdifferentiation in the ate mutants is shown (C). Twenty-five hypocotyls were examined in each sampling point, and the sd was calculated from data of six independent experiments. Arrows indicate ectopic transdifferentiated TE cell. Scale bars, 50 μm (A–F).
Ectopic Expression of Another TE Marker Gene in the ate1 Mutant
To examine the effect of the ate1 mutation on TE formation steps in planta, we assessed the expression pattern of another xylem-specific marker, the pAt3g62160::YFP chimeric gene in the ate1 mutants. At3g62160 encodes a putative acetyltransferase and exhibits significant sequence similarity to Z3714 and Z9029, which are up-regulated in the TE maturation steps in the zinnia TE transdifferentiation system (Demura et al., 2002). YFP expression in the pAt3g62160::YFP transgenic plant was observed only in developing TEs (Fig. 5, A and C). The ate1 mutation was introduced into the pAt3g62160::YFP transgenic plant by crossing, and YFP was also ectopically expressed, as seen in the ate1 Atxyn3::YFP plants (Fig. 5, B and D).
Effect of the ate Mutations on the Expression of TE Formation-Related Genes
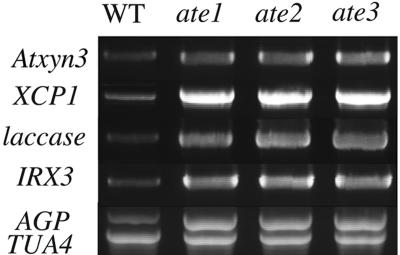
Next, we examined the expression levels of TE formation-related genes in the ate mutants. A semiquantitative reverse transcription (RT)-PCR experiment was performed (Sawa et al., 2002) because there is sequence similarity between the examined genes and their family genes in Arabidopsis and because probes specific to the untranslated region of these genes did not give a clear signal in the northern analysis. The PCR band corresponding to the endogenous Atxyn3 gene demonstrated an obvious, increased intensity in the ate mutants compared with that of the wild type (Fig. 6), indicating that the ate mutations enhance not only the reporter YFP expression but also the endogenous Atxyn3 gene expression. The expression of XCP1, a Cys protease gene that is known to be expressed specifically in the cell death steps of TEs, was also up-regulated in all of the ate mutants (Fig. 6). Expression of the laccase (At2g38080) and cellulose synthase genes (IRX3, At5g17420), which are also related to the secondary wall formation of TEs, were up-regulated in the ate mutants. Furthermore, we examined the expression level of the At1g03820 gene in ate mutants because At1g03820 encodes a putative arabinogalactan-protein and exhibits a significant sequence similarity to the TED3 gene, which is a marker gene of TE precursor cells (Demura and Fukuda, 1994). The intensity of the PCR band corresponding to the At1g03820 gene clearly increased in the ate mutants compared with the wild type (Fig. 6).
Figure 6.
Expression analysis of TE formation-related genes in the ate mutants. Two pairs of primers in the same reaction mixture were used in the quantitative RT-PCR experiment. One pair of primers was used to amplify the internal control gene, TUA4, while other gene-specific primers were used to amplify Atxyn3, XCP1, laccase (At2g38080), IRX3, or AGP (At1g03820). Only the TUA4 control for the AGP amplification is shown.
Effect of the ate1 Mutation in Vascular Pattern Formation
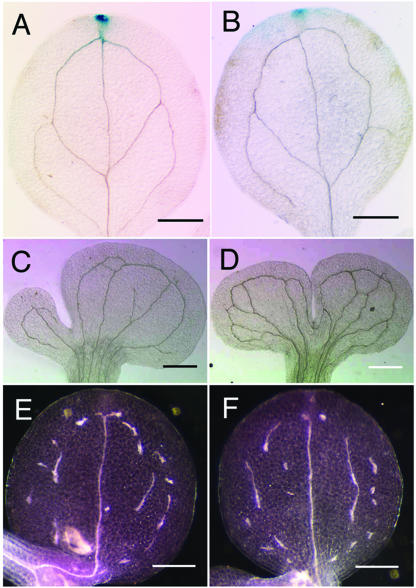
We investigated the role of the ATE1 gene in the determination of vascular patterning. It is well known that auxin affects vascular patterning and xylem development (Sachs, 1991, 2000; Tuominen et al., 1997). To examine the effects of the ate1 mutation on auxin distribution, we introduced the DR5::GUS (β-glucuronidase) reporter gene into the ate1 mutant. The DR5::GUS gene expression pattern in the ate1 mutant was almost the same as that of wild type, and the ate1 mutation did not affect the vascular patterning (Fig. 7, A and B). Furthermore, when the pin1 mutation was introduced into the ate1 mutant, the pin1 venation pattern was not affected (Fig. 7, C and D). We also assessed the effects of the ate1 mutation in the discontinuous vascular network phenotype of the van3 mutants and found that the van3 phenotype was not affected by the ate1 mutation (Fig. 7, E and F). These results suggest that the ATE1 gene is not involved in venation pattern construction.
Figure 7.
Genetic analyses of the ate1 mutant. Histochemical localization of GUS activity in the cotyledon of the 10-d-old wild type (A) and ate1 mutant (B) carrying the pDR5::GUS gene is shown. Cotyledon vein patterns of the 10-d-old pin1 (C), pin1 ate1 (D), van3 (E), and van3 ate1 (F) mutants are shown. The ate1 mutation was confirmed by ectopic YFP signals (data not shown). Light field (A–D) and dark field microscopy was used to clarify the discontinuous vein pattern (E and F). Scale bars, 500 μm (A–F).
DISCUSSION
In spite of its importance, very little is known about the molecular mechanisms of transdifferentiation and the masking system in planta. Here, we isolated and characterized mutants that may be involved in the masking of transdifferentiation in situ.
Ectopic Lignification in the ate Mutants
We isolated three novel ate mutants of Arabidopsis showing an ectopic expression of a TE marker gene. Ectopic lignification was also observed in the cells expressing the TE marker gene in the ate mutants. Ectopic lignification is a characteristic phenotype of ectopic lignification1 and lion tale, which are defective in cell expansion (Cano-Delgado et al., 2000), radially swollen 1, which is defective in a catalytic subunit of cellulase synthase (Arioli et al., 1998), and korrigan, which is defective in a plasma membrane-associated β-1,4-endoglucanase (Nicol et al., 1998). The varying degree of lignification observed in these mutants was correlated with the degree of altered cell expansion, suggesting a meaningful link between the processes of cell expansion and lignification (Cano-Delgado et al., 2000). This linkage is clearly demonstrated by the temperature dependence of both cell expansion and ectopic lignification in the radially swollen 1 allele (Arioli et al., 1998). Ectopic lignification in these mutants could be the secondary effect due to the modulation of cell wall organization. As for the ate mutants, we did not detect alterations in cell shape and cell division, even in the cells ectopically expressing the TE marker gene. Furthermore, the expression profile of genes involved in cellulose synthesis and defense responses, not the TE formation-related genes, are obviously affected in the ectopic lignification mutant (Cano-Delgado et al., 2003), although the ate mutants have a significant increase in transcription of TE formation-related genes. This suggests that the ate mutants with an ectopic lignification are included in the novel category mutants.
ATE Genes in Vascular Pattern Formation
Recently, several factors have been investigated for their possible roles in vein patterning. Auxin is a pivotal molecule that controls the vein patterning. The auxin canalization hypothesis presented by Sachs (1991) has been supported by recent genetic analyses. In addition, the involvement of factors other than auxin in vein patterning has been suggested, as typically shown in van3 mutants (Koizumi et al., 2000). However, all of the ate mutants showed the normal venation pattern, and the ate1 mutation did not affect the expression pattern of the DR5::GUS marker gene, the pin1 mutant phenotype, or the van3 mutant phenotype. These results indicate that the ATE genes do not affect the determination of the venation pattern.
ATE Genes in the TE Transdifferentiation System
All of the ate mutants showed the ectopic marker gene expression in all organs tested, i.e. the roots, hypocotyls, cotyledons, and leaves for ate1 to 3, and sepals, petals, stamens, and carpels for ate1 and ate3. Spatial association of the ectopic YFP signal region, with ectopic lignin deposition and cell death region, was also observed in the ate mutants. Furthermore, we did not observe the ectopic callus formation, altered cell shape, and abnormal cell division in the ate mutants. Together with the result of semiquantitative RT-PCR, it was demonstrated that some parenchyma cells in the ate mutants transdifferentiate into TEs in situ. A master key gene, which determines the identity of each cell type, is expected to be activated in a transdifferentiation system. However, we showed here that the recessive ate mutations ectopically induce transdifferentiation into TEs. This result implies that there is a repression system for transdifferentiation into a specific cell type, and therefore, the masking of transdifferentiation is an active mechanism in planta, although we do not deny the possibilities that the ATE genes are responsible for the regulation of BR sensitivity, biosynthesis, or metabolisms because ate mutants showed rapid TE transdifferentiation in the in vitro TE transdifferentiation system.
Morphologically, we could not detect ectopic formation of cell types other than TEs in ate mutants. However, there is a possibility of a transdifferentiation into other types of cells such as xylem parenchyma cells. These are observed in the zinnia xylogenic culture system as a minor population of transdifferentiated cells, as opposed to a major population of TEs (Shinohara et al., 2000). We may need to examine transdifferentiated cells using a cell type-specific molecular marker in the ate mutants. Nevertheless, distinct morphological features are essential for the function of each type of vascular cell. Therefore, the absence of newly formed cells with distinct morphology (apart from TEs) in the ate mutants strongly suggests that transdifferentiation occurs only into TEs. Interestingly, all three recessive ate mutants showed transdifferentiation only into TEs. This finding implies the presence of a positive TE-specific masking system in situ. If the masking system of transdifferentiation in situ is the common system in all cell types, and if the ATE genes regulate the common system, we would expect to observe ectopic transdifferentiation of TEs and various other types of cells in the ate mutants. This may not be so surprising because TEs are induced preferentially in in vitro cultures (Fukuda, 1992). However, only the ectopic TEs are transdifferentiated in the ate mutants, and ATE genes would be responsible only for the masking of transdifferentiation into the TEs. Fukuda (1997) has suggested that wounding and a combination of auxin and cytokinin are a prerequisite for TE transdifferentiation in vitro. However, TE transdifferentiation occurs in the ate mutants without exogenous phytohormones or wound stress, which suggests that the ATE genes may be crucial for the initiation of TE transdifferentiation downstream of the auxin/cytokinin signaling. Identification and characterization of the ATE genes will provide further insights into the molecular mechanism of transdifferentiation masking in situ.
CONCLUSION
Here we characterized the ate mutants. From the analysis of the ate mutants, we suggested the presence of a transdifferentiation-repressing system, and we provided a new model that plants may prepare cell type-specific transdifferentiation-masking system. Our approach using a TE-specific gene marker led to the isolation of a new type of mutant in which TE transdifferentiation is induced ectopically. This approach may be applicable for analyzing the transdifferentiation-masking system of other types of cells, tissues, and/or organs by using their specific marker genes. The identification and characterization of genes involved in the transdifferentiation machinery will elucidate the general mechanism of masking of transdifferentiation in planta.
MATERIALS AND METHODS
Isolation of Mutants
The YFP cDNA fragment was ligated with the Atxylanase 3 promoter region, which includes a 2,000-bp region upstream of the predicted start codon of Atxylanase 3. The resulting Atxyn3::YFP gene was transformed into Agrobacterium strain MP90 and further introduced into wild-type Columbia. Seeds of Atxyn3::YFP transgenic plants were mutagenized in 0.3% ethane methyl sulfonate (Sigma, St. Louis) for 20 h. The self-fertilized progeny of these seeds were collected, and 10,000 plants were screened for ectopic marker gene expression after 14 d growth on germination medium (0.5× Murashige and Skoog basal salts [Wako], pH 5.7). Seedlings were examined under a microscope using fluorescent light illumination (FLIII; Leica, Wetzlar, Germany).
Histological Analysis
Samples were fixed overnight in a 9:1 mixture of ethanol and acetic acid at room temperature for whole-mount observation. Fixed samples were cleared in a mixture of chloral hydrate, glycerol, and water solution (8 g:1 mL:2 mL) and observed under a light microscope equipped with Nomarski optics (U-DICT; Olympus, Tokyo).
Histochemical Localization of GUS Activity
The ate1 mutation was introduced into the pDR5::GUS transgenic plants by crossing. Samples were fixed in 90% (v/v) acetone for at least 60 min on ice. After washing in water 3 times, they were immersed in a reaction mixture containing 1 mm 5-bromo-4-chloro-3-indolyl glucuronide, 0.5 mm potassium ferricyanide, and 0.5 mm potassium ferrocyanide in 100 mm sodium phosphate buffer, pH 7.2, and incubated for 4 h (pAthb8::GUS) or 24 h (DR5::GUS) in the dark. After the reaction, samples were mounted with a mixture of chloral hydrate, glycerol, and water and observed under a light microscope equipped with Nomarski optics (BX-50; Olympus).
For the lignin observation, samples were mounted with a mixture of chloral hydrate, glycerol, water, and 1% Phloroglucinol (Sigma) in hydrochloric acid (8 g:1 mL:2 mL:50 μL) and observed under a light microscope equipped with Nomarski optics or examined under a microscope using UV illumination (BX-50; Olympus).
Genetic Mapping
Genomic DNA was extracted from 500 (ate1), 96 (ate2), and 24 (ate3) individual F2 mutant seedlings generated from crosses of each mutants to ecotype Landsberg erecta. The DNA samples were genotyped using several microsatellite loci that are polymorphic between ecotypes Landsberg erecta and Columbia (Bell and Ecker, 1994), allowing us to map the chromosomal position of each ate mutant locus.
In Vitro TE-Inducible Experiment
Arabidopsis (Arabidopsis thaliana) plants were grown on agar plates for 5 d in the dark. The hypocotyls were floated on a medium containing 4.41 g Murashige and Skoog medium (Wako), 10 μg thiamin HCl, 5 μg nicotinic acid, 10 μg pyridoxine HCl, 100 μg myo-inositol, 2 μg Gly, 0.5 g MES, 0.5 mg 2, 4-dichlorophenoxyacetic acid, 50 μg kinetin, and 1 μmol brassinolide per liter. After incubation for various periods (2, 4, 6, 8, and 10 d), 25 samples were fixed in each sampling point. Fixation was performed overnight in a 9:1 mixture of ethanol and acetic acid at room temperature for whole-mount observation. Fixed samples were cleared in a mixture of chloral hydrate, glycerol, and water solution (8 g:1 mL:2 mL) and observed under a light microscope equipped with Nomarski optics (U-DICT; Olympus), and the number of hypocotyls containing cells showing spiral lignin deposition were counted.
RT-PCR Analysis
Two pairs of primers in the same reaction mixture were used in the quantitative RT-PCR experiment. RT-PCR analysis for the quantification of the endogenous Atxyn3 transcript was performed according to the instructions for the First-Strand cDNA Synthesis kit (Amersham Pharmacia Biotech, Piscataway, NJ) using a set of endogenous gene specific primers (5′-TGTTTGTTCTGCTCTTGATATGCTC-3′, 5′-CAAAGAAGAGAGATCAATGGAGATA-3′) and a set of primers specific to the internal control gene, TUA4 (5′-CTTCCTTGACTGCTTCTC-3′, 5′-TCATCGTCACCACCTTCA-3′), in the same reaction mixture. We used primer sets to amplify the transcripts of XCP1, 5′-GAGGCTTCAGGAAGAGACTTCCAG-3′, 5′-CACTTGGTCTTGGTAGGATATGAGG-3′; laccase (At2g38080), 5′-GGTGGATGGGTCGTCATGAGATTC-3′, 5′-CGTGGCGTGATGTTGATATGTCGCCC-3′; IRX3, 5′-GGCGTTGTTGCAGGCATCTCAG-3′, 5′-CAGCAGTTGATGCCACACTTGG-3′; and AGP (At1g03820), 5′-GACAATGGGAGAGGTTACGGTAATG-3′, 5′-CTAAGGCTCATACTCTTCTTG-3′.
Sequence data from this article have been deposited with the EMBL/GenBank data libraries under accession number AB194395.
Acknowledgments
The authors thank Thomas J. Guilfoyle for providing transgenic Arabidopsis seeds carrying DR5::GUS, and Hannel Tuominen and Zheng-Hua Ye for critical review of the manuscript.
This work was supported in part by the Nissan Science Foundation, by Yamada Science Foundation, by Inamori Foundation, and by the Ministry of Education, Science, Sports, and Culture of Japan (grants-in-aid 14740442 and 14036205).
Article, publication date, and citation information can be found at www.plantphysiol.org/cgi/doi/10.1104/pp.104.055145.
References
- Arioli T, Peng L, Betzner AS, Burn J, Wittke W, Herth W, Camilleri C, Hofte F, Plazinski J, Birch R, et al (1998) Molecular analysis of cellulose biosynthesis in Arabidopsis. Science 279: 717–720 [DOI] [PubMed] [Google Scholar]
- Bell CJ, Ecker JR (1994) Assignment of 30 microsatellite loci to the linkage map of Arabidopsis. Genomics 19: 137–144 [DOI] [PubMed] [Google Scholar]
- Busse JS, Evert RF (1999. a) Pattern of differentiation of the first vascular elements in the embryo and seedling of Arabidopsis thaliana. Int J Plant Sci 160: 1–13 [Google Scholar]
- Busse JS, Evert RF (1999. b) Vascular differentiation and transition in the seedling of Arabidopsis thaliana (BRASSICAE). Int J Plant Sci 160: 241–251 [Google Scholar]
- Cano-Delgado A, Metzlaff K, Bevan MW (2000) The eli1 mutation reveals a link between cell expansion and secondary cell wall formation in Arabidopsis thaliana. Development 127: 3395–3405 [DOI] [PubMed] [Google Scholar]
- Cano-Delgado A, Penfield S, Smith C, Catley M, Bevan M (2003) Reduced cellulose synthesis invokes lignification and defense responses in Arabidopsis thaliana. Plant J 34: 351–362 [DOI] [PubMed] [Google Scholar]
- Demura T, Fukuda H (1994) Novel vascular cell-specific genes whose expression is regulated temporally and spatially during vascular system development. Plant Cell 6: 967–981 [DOI] [PMC free article] [PubMed] [Google Scholar]
- Demura T, Tashiro G, Horiguchi G, Kishimoto N, Kubo M, Matsuoka N, Minami A, Nagata-Hiwatashi M, Nakamura K, Okamura Y, et al (2002) Visualization by comprehensive microarray analysis of gene expression programs during transdifferentiation of mesophyll cells into xylem cells. Proc Natl Acad Sci USA 99: 15794–15799 [DOI] [PMC free article] [PubMed] [Google Scholar]
- Fukuda H (1992) Tracheary element differentiation as a model system of cell differentiation. Int Rev Cytol 136: 289–332 [Google Scholar]
- Fukuda H (1994) Redifferentiation of single mesophyll cells into tracheary elements. Int J Plant Sci 155: 262–271 [Google Scholar]
- Fukuda H (1997) Tracheary element differentiation. Plant Cell 9: 1147–1156 [DOI] [PMC free article] [PubMed] [Google Scholar]
- Fukuda H (2004) Signals that control plant vascular cell differentiation. Nat Rev Mol Cell Biol 5: 379–391 [DOI] [PubMed] [Google Scholar]
- Koizumi K, Sugiyama M, Fukuda H (2000) A series of novel mutants of Arabidopsis thaliana that are defective in the formation of continuous vascular network: calling the auxin signal flow canalization hypothesis into question. Development 127: 3197–3204 [DOI] [PubMed] [Google Scholar]
- Lu WL (2003) Control of in vitro regeneration of individual reproductive and vegetative organs in Dracaena fragrans cv. Massangeana Hort. Regularities of the direct regeneration of individual organs in vitro. Acta Bot Sin 45: 1453–1464 [Google Scholar]
- Nicol F, His I, Jauneau A, Vernhettes S, Canut H, Hofte H (1998) A plasma membrane-bound putative endo-1,4-β-D-glucanase is required for normal wall assembly and cell elongation in Arabidopsis. EMBO J 17: 5563–5576 [DOI] [PMC free article] [PubMed] [Google Scholar]
- Reghavan V (1986) Embryogenesis in Angiosperms. Cambridge University Press, Cambridge, UK
- Reinhert J (1959) Uber die Kontrolle der Morphogense und die Induktion von Adventivembryonen an Gewebekulturen aus Karotten. Planta 53: 318–333 [Google Scholar]
- Sachs T (1991) Cell polarity and tissue patterning in plants. Dev Suppl 1: 83–93 [Google Scholar]
- Sachs T (2000) Integrating cellular and organismic aspects of vascular differentiation. Plant Cell Physiol 41: 649–656 [DOI] [PubMed] [Google Scholar]
- Sawa S, Ohgishi M, Goda H, Higuchi K, Shimada Y, Yoshida S, Koshiba T (2002) The HAT2 gene, a member of the HD-Zip gene family, isolated as an auxin inducible gene by DNA microarray screening, affects auxin response in Arabidopsis. Plant J 32: 1011–1022 [DOI] [PubMed] [Google Scholar]
- Shinohara N, Demura T, Fukuda H (2000) Isolation of a vascular cell wall-specific monoclonal antibody recognizing a cell polarity by using a phage display subtraction method. Proc Natl Acad Sci USA 97: 2585–2590 [DOI] [PMC free article] [PubMed] [Google Scholar]
- Stewart FC (1958) Growth and development of cultivated cells. III. Interpretations of the growth from free cell to carrot plant. Am J Bot 45: 709–713 [Google Scholar]
- Tao Y, Xie Z, Chen W, Glazebrook J, Chang HS, Han B, Zhu T, Zou G, Katagiri F (2003) Quantitative nature of Arabidopsis responses during compatible and incompatible interactions with the bacterial pathogen Pseudomonas syringae. Plant Cell 15: 317–330 [DOI] [PMC free article] [PubMed] [Google Scholar]
- Tuominen H, Puech L, Fink S, Sundberg B (1997) A radial concentration gradient of indole-3-acetic acid is related to secondary xylem development in hybrid aspen. Plant Physiol 115: 577–585 [DOI] [PMC free article] [PubMed] [Google Scholar]
- Wilt FH, Hake SC (2004) Principles of Developmental Biology. W.W. Norton & Company, New York, pp 204–205


