

Abstract
Lysine Specific Demethylase 1 (LSD1) catalyzes the demethylation of histone 3 to regulate gene expression. With a fundamental role in gene regulation, LSD1 is involved in multiple cellular processes, including embryonic development, cell proliferation, and metastasis. Significantly, LSD1 is overexpressed in multiple cancers and has emerged as a potential anticancer drug target. LSD1 is typically found in association with another epigenetic enzyme, histone deacetylase (HDAC). HDAC and LSD1 inhibitor compounds have been tested as combination anticancer agents. However, the functional link between LSD1 and HDAC has yet to be understood in detail. Here, we used a substrate trapping strategy to identify cellular substrates of HDAC1. Using inactive HDAC1 mutants, we identified LSD1 as an HDAC1 substrate. HDAC1 mediated deacetylation of LSD1 at K374 in the substrate binding lobe, which affected the histone 3 binding and gene expression activity of LSD1. The mechanistic link between HDAC1 and LSD1 established here suggests that HDAC inhibitors influence LSD1 activity, which will ultimately guide drug design targeting epigenetic enzymes.
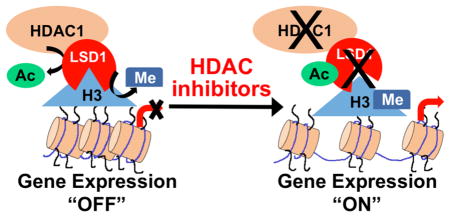
Graphical Abstract
Multiple epigenetic enzymes regulate histone modifications to finely tune gene expression.1 Histone methylation and acetylation represent well-studied epigenetic modifications. For example, histone 3 (H3) lysine 9 can be methylated or acetylated, with methylation linked to repression of transcription and acetylation correlated with transcriptional upregulation.2 In contrast, H3 lysine 4 methylation or acetylation are both associated with upregulation of gene expression.3,4 As these two examples illustrate, the interplay between methylation and acetylation combine to regulate gene expression.
Histone methyltransferase and histone demethylase proteins govern methylation, whereas histone acetyltransferase and histone deacetylase proteins control acetylation. Remarkably, histone demethylase and deacetylase enzymes are found in the same cellular complexes. For example, the CoREST and NuRD corepressor complexes contain two deacetylase isoforms, histone deacetylase 1 (HDAC1) and HDAC2, and one demethylase protein, lysine specific demethylase1 (LSD1).5 In addition, both histone demethylases and deacetylases are aberrantly overexpressed in many diseases, including cancer.6–11 Given the co-overexpression and colocalization of HDAC and LSD1, understanding the functional relationship between these epigenetic enzymes will reveal new cell biology and mechanisms of disease progression.
Inhibitors of HDAC and LSD1 have been helpful in studying the role of histone modifications in gene expression. Gene profiling studies with HDAC inhibitors revealed that HDAC proteins regulate genes linked to cell cycle (p21 and p27, for example) and apoptosis (Fas, FasL, TRAIL, and DR-5, for example), which are dysfunctional in cancers.12–14 With their role in cancer formation, four HDAC inhibitors have been approved by the FDA as cancer therapeutics, including Vorinostat (SAHA, Suberoyl Anilide Hydroxamic Acid, Zolinza) for the treatment of cutaneous T-cell lymphoma.15 Related to the methylation and acetylation crosstalk, HDAC inhibitors influenced H3 methylation,16 which is consistent with a functional link between HDAC and LSD1. In fact, coadministration of HDAC and LSD1 inhibitors shows some promise as a combination anticancer therapy.17 The possible use of HDAC and LSD1 inhibitors for cancer treatment further highlights the importance for studying the functional interplay between histone methylation and acetylation.
Here, we studied the functional link between histone methylation and acetylation by identifying LSD1 as a cellular substrate of HDAC1 using a previously developed mutant trapping approach.18 The data indicated that HDAC1-mediated deacetylation regulates the acetylation state, H3 substrate binding, and gene repression function of LSD1. Therefore, the study uncovered a novel crosstalk between HDAC1 and LSD1. Considering the HDAC inhibitor-mediated derepression of LSD1 target genes identified here, HDAC inhibitors likely block the aberrant activity of both HDAC1 and LSD1 in cancer. This work highlights the importance of characterizing the functional interaction of HDAC1 and LSD1 in physiological and pathological conditions, which will assist in drug development targeting epigenetic enzymes.
RESULTS AND DISCUSSION
HDAC1 regulates gene expression by deacetylating histone proteins.19 Beyond histones, the large and growing list of acetylated proteins20 implicates nonhistone proteins as substrates of HDAC proteins. In fact several nonhistone substrates have been identified for two HDAC family members, HDAC6 and HDAC8, using genetic and pharmacological methods.21–23 However, genetic and pharmacological methods have been ineffective with HDAC1 due to compensation by HDAC2 and lack of HDAC1-selective inhibitors. Consequently, only a few validated substrates of HDAC1 are reported.24,25 Given the steadily growing list of acetylated proteins, HDAC1 is likely to have additional nonhistone substrates. New strategies to identify HDAC1 substrates are needed to characterize the full biological activities of HDAC1.
Substrate trapping mutants have been widely used to identify phosphatase substrates.18 In the trapping strategy, catalytically inactive mutant enzyme binds to substrates relatively stably compared to wild type (Figure 1A,B), allowing effective isolation. Given the significance of identifying nonhistone substrates to explore the role of HDAC1 in the cell, here we used inactive HDAC mutants as traps to identify new substrates from HEK293 cells.
Figure 1.

Substrate trapping by HDAC1 mutants in HEK293 cells. (A) Catalytically active wild type (WT) HDAC1 binds substrates transiently. (B) Inactive HDAC1 mutants (MT) bind more stably, which allows immunoprecipitation and identification of novel substrates. (C) After immunoprecipitation, bound proteins were analyzed by SDS-PAGE. Protein bands present only in the mutant HDAC1 (MT) could be potential substrates (see arrows), which was further confirmed by using an active site HDAC inhibitor (Inh) as a competitor. (D) Wild type (WT) or C151A mutant HDAC1 were expressed as Flag-tagged proteins in SAHA-treated HEK293 cells, immunoprecipitated with anti-Flag agarose in the absence or presence of SAHA, separated by 10% SDS-PAGE, and visualized with Sypro Ruby total protein stain. Arrows indicate immunoprecipitated HDAC1 along with possible substrates (p38, p55, and p100) observed in the absence but not presence of competitive active site inhibitor.
Substrate Trapping Identified LSD1 As a Candidate Substrate of HDAC1
Prior work from our lab characterized a variety of inactive HDAC1 mutant proteins,26,27 which could be substrate traps. Among the inactive mutants, we selected three mutants (H141A, F150A, and C151A) for this study (Figure S1A). All three amino acids (H141, F150, and C151) are highly conserved among all the HDAC proteins. Importantly, mutation of all three residues to alanine resulted in roughly 5 times lower activity compared to the wild type,26,27 which suggests that they could trap substrates.
For the trapping study, wild type HDAC1 and inactive HDAC1 mutants were overexpressed in HEK293 cells, and then cells were treated with SAHA to induce robust acetylation. Wild type and mutant HDAC1 were immunoprecipitated from the lysates in the presence or absence of active site inhibitor. The active site inhibitor competed with bound substrates and assisted in distinguishing substrates from interacting proteins. Bound substrates present in the mutant but not wild type or inhibitor competition immunoprecipitates were visualized using gel methods (Figure 1C). Among the three inactive HDAC1 mutants screened (Figure S1B), C151A HDAC1 displayed the best substrate trapping properties and was used in subsequent experiments. Three new bands (p100, p55, and p38) appeared in the C151A mutant, but not in the wild type immunoprecipitates (Figure 1D, compare lanes 1 and 2). The p100, p55, and p38 bands disappeared when HDAC inhibitor SAHA (Figure S2) was used as an active site competitor (Figure 1D, compare lanes 2 and 4), suggesting that these proteins interacted directly with the active site of HDAC1 and could be potential substrates. We also used the HDAC1/HDAC2-selective inhibitor (SHI-1:2) and HDAC6-selective inhibitor tubastatin (Figure S2) as trapping competitors. The p100, p55, and p38 bands were observed in the presence of tubastatin (Figure S1C, lane 4) but not SHI-1:2 (Figure S1C, lane 3), which indicated that the proteins are substrates of HDAC1 and not HDAC6. As a final control, we compared the level of overexpressed HDAC1-FLAG to endogenous HDAC1 and HDAC2 expression to assess the physiological conditions of the trapping study. The amount of overexpressed HDAC1 was similar to the levels of endogenous HDAC1 and HDAC2 (Figure S1D), confirming that use of overexpressed HDAC1 mutants in substrate trapping studies reasonablely reflects cellular conditions.
To characterize the p100, p55, and p38 proteins interacting with C151A HDAC1, gel bands were excised and trypsin digested and subjected to liquid chromatography tandem mass spectrometric (LC-MS/MS) analysis. With high confidence, p100, p55, and p38 were identified as lysine specific histone demethylase 1 (LSD1 or KDM1A), RuvB-like 2 (Reptin 52), and rRNA 2′-O-methyltransferase fibrillarin (histone-glutamine methyltransferase), respectively (Table S1 and Figures S3–S14). As mentioned earlier, LSD1 is typically found in association with HDAC1 to modulate H3 methylation and gene expression.5 Previous reports also indicated that LSD1 activity and substrate specificity could be regulated by interacting proteins.5,28,29 For example, HDAC-mediated deacetylation of H3 also enhanced histone demethylation by LSD1,30 which suggested a functional link between HDAC and LSD1. Therefore, we selected LSD1 for further validation to characterize a possible novel mechanism of crosstalk between histone methylation and acetylation involving HDAC1-mediated LSD1 deacetylation.
LSD1 Is a Substrate of HDAC1
To initially confirm that the trapped p100 protein (Figure 1D, lane 2) is LSD1, we performed substrate trapping with subsequent Western blot analysis. Wild type and C151A mutant HDAC1 were overexpressed in HEK293 cells and immunoprecipitated in the presence or absence of SHI-1:2, before bound p100 was analyzed by Western blotting with an LSD1 antibody (Figure 2A). Consistent with the LC-MS/MS data, LSD1 was trapped only by the C151A mutant but not by the WT HDAC1 (Figure 2A, top, compare lanes 2 and 3). In addition, SHI-1:2 treatment decreased LSD1 trapping (Figure 2A, top, compare lanes 3 and 5), suggesting that LSD1 interacts with the active site of HDAC1. The Western blot analysis confirmed that the HDAC1 C151A mutant trapped LSD1 in an inhibitor-dependent manner.
Figure 2.

LSD1 is a substrate of HDAC1. (A) Wild type (WT) or C151A HDAC1 were expressed as Flag-tagged fusion proteins in HEK293 cells, and then cells were treated with 10 μM SAHA for 24 h prior to harvesting. After lysis, FLAG-tagged wild type and mutant HDAC1 were immunoprecipitated with anti-Flag agarose in the presence or absence of 10 μM SHI-1:2, separated by SDS-PAGE, and immunoblotted with LSD1 and FLAG antibodies. (B) HEK293 cells were transfected with the LSD1-FLAG expression construct and grown for 48 h. Then, 10 μM SHI-1:2 or 10 μM SAHA was added for another 24 h. Cells were harvested and FLAG-LSD1 was immunoprecipitated with anti-FLAG agarose beads. Immunoprecipitates were analyzed by Western blotting with FLAG and acetyl lysine antibodies. (C) Acetylated recombinant LSD1 was incubated with or without recombinant HDAC1 and SAHA for 2.5 h at 37 °C, separated by SDS-PAGE, and analyzed with AcLys, HDAC1, and LSD1 antibodies. (D) Quantification of the AcLys LSD1 signal from part C. Three independent trials are shown as mean ± standard error in Figure S15A and B. The LSD1-FLAG blot (bottom) was used as a loading control, and quantification is shown in Figure S15C and D. ***p < 0.001, **p < 0.01, ns: not significant. (E) FLAG-tagged wild type (WT) or C151A mutant HDAC1 were cotransfected with FLAG-tagged wild type LSD1 into HEK293 cells. Both FLAG tagged proteins were immunoprecipitated using anti-FLAG agarose beads, separated by SDS-PAGE, and immunoblotted with acetyl lysine (AcLys) and FLAG antibodies. (F) Quantification of the AcLys LSD1 signal from part E. Three independent trials are shown as mean ± standard error in Figure S16A and B. LSD1 blot was used as a loading control, and quantification is shown in Figure S16C and D. ***p < 0.001, ns: not significant.
Since LSD1 must be acetylated to act as an HDAC1 substrate, we analyzed the acetylation status of LSD1. FLAG-tagged LSD1 was expressed in HEK293 cells, and then cells were treated with SHI-1:2, as well as the broad spectrum HDAC inhibitor SAHA, to induce acetylation. FLAG-tagged LSD1 was immunoprecipitated, and the immunoprecipitates were analyzed using an acetyl lysine antibody. The pan HDAC inhibitor SAHA enhanced LSD1 acetylation (Figure 2B, top, compare lanes 2 and 4), confirming that HDAC proteins regulate acetylation of LSD1. Importantly, SHI-1:2 also induced LSD1 acetylation (Figure 2B, top, compare lanes 2 and 3), consistent with the hypothesis that LSD1 is an HDAC1 substrate.
To confirm that HDAC1 deacetylates LSD1, we performed in vitro deacetylation assays using recombinant LSD1 (rLSD1) and recombinant HDAC1 (rHDAC1). Acetylated rLSD1 was incubated in the absence or presence of rHDAC1. As a control, rHDAC1 was preincubated with SAHA prior to the incubation with acetylated rLSD1. Acetylation of rLSD1 was significantly reduced in the presence of rHDAC1 (Figure 2C, top, compare lanes 1 and 2), but not with SAHA-treated rHDAC1 (Figure 2C, top, compare lanes 1 and 3), indicating that HDAC1 deacetylates LSD1. Quantification of the acetylated LSD1 signal in three independent trials also confirmed that HDAC1 reproducibly reduced LSD1 acetylation (Figures 2D and S15). The data indicate that LSD1 is a substrate of HDAC1.
To further validate that LSD1 is a substrate of HDAC1 in cellulo, we performed deacetylation assays using cellular LSD1 and HDAC1. FLAG-tagged LSD1 was overexpressed in the absence or presence of wild type or C151A mutant HDAC1. LSD1 was immunoprecipitated from HEK293 cells, separated by SDS-PAGE, and analyzed by Western blotting with an acetyl lysine antibody. Acetylation of LSD1 was reduced in the presence of WT HDAC1 (Figure 2E, top, compare lanes 2 and 3), but not with the catalytically inactive mutant (Figure 2E, top, compare lanes 2 and 4). Quantification of the acetylated LSD1 signal from three independent trials also confirmed that HDAC1 significantly reduced LSD1 acetylation (Figures 2F and S16). The fact that LSD1 acetylation depended on the presence of active HDAC1 supports the conclusion that LSD1 is a substrate of HDAC1.
HDAC Inhibitors Affected LSD1 Activity in Cellulo
Acetylation can regulate protein activity, stability, and interactions.31 As a first step to characterize LSD1 acetylation, we studied the effect of HDAC-mediated acetylation on LSD1 demethylase activity. FLAG-tagged LSD1 was overexpressed in HEK293 cells before cells were treated with HDAC inhibitors to induce robust LSD1 acetylation (Figure S17A, AcLys blot). After cell lysis, FLAG-LSD1 was immunoprecipitated with anti-FLAG agarose beads and then tested in demethylase assays using a dimethylated histone 3 lysine 4 (H3K4me2) peptide substrate. LSD1 activity was comparable in SHI-1:2-treated, SAHA-treated, and untreated samples (Figure S17). The data indicated that acetylation of LSD1 does not significantly alter its in vitro demethylation activity.
In addition to the in vitro demethylase assay, which utilizes an H3 peptide substrate, we analyzed LSD1 activity in cellulo by monitoring the methylation state of full length H3. LSD1 catalyzes demethylation of H3K4me2,32 making H3K4me2 a cellular marker of LSD1 activity. HEK293 cells were treated with SHI-1:2 or SAHA to promote robust acetylation. Cell lysates were then analyzed for the presence of H3K4me2 using Western blotting (Figure 3A). HDAC inhibitors enhanced H3K4me2 levels compared to untreated cells (Figure 3A, H3K4me2 blot, compare lane 1 to lanes 2–4). Interestingly, SHI and SAHA had differing effects on H3K9ac, H3K4me2, and H3K9Me2 marks (Figure 3A, compare lanes 2 and 3 to 4), which suggest that HDAC isoforms other than HDAC1 and -2 also act upon these modifications. In addition to HEK293 cells, two other cell lines were tested to assess the cell line specificity of HDAC inhibitor-dependent H3 methylation. Similar to HEK293 cells, MCF7 and HeLa cells treated with SHI-1:2 or SAHA showed elevated H3K4 dimethylation compared to untreated cells (Figure 3B, H3K4me2 blot, compare lane 1 to lanes 2 and 3; Figure 3C, H3K4me2 blot, compare lane 2 to lanes 3 and 4). For these cell lines, SHI-1:2 and SAHA had similar effects on all modifications, suggesting that HDAC1 and -2 are primarily responsible for the modifications. In contrast to H3K4 dimethylation, the effect of HDAC inhibitors on dimethylated lysine 9 of H3 (H3K9me2) was inconsistent (Figure 3A and B, H3K9me2 blots), although H3K9 acetylation was consistently elevated (Figure 3, H3K9ac blots). Given that LSD1 mainly targets the H3K4me2 mark when in complex with HDAC1 and -2, we did not study the H3K9me2 mark further.
Figure 3.

HDAC inhibitors increased H3K4 dimethylation. HEK293 (A), MCF7 (B), or HeLa (C) cells were treated with 10 μM SHI-1:2 or 10 μM SAHA for 24 h, harvested, and lysed before proteins were separated by SDS-PAGE and immunoblotted with LSD1, H3, H3K4me2, H3K9me2, H3K9ac, or GAPDH antibodies.
The results demonstrated that HDAC inhibitors have a direct impact on H3K4 dimethylation, suggesting that LSD1 activity is influenced by acetylation. However, the earlier peptide-based demethylation assays indicated that HDAC inhibitor-induced H3K4 methylation is not due to a direct effect on LSD1 catalytic function (Figure S17). We speculate that use of the H3K4me2 peptide substrate in the in vitro assay may not accurately reflect LSD1 activity with the native nucleosome. Instead, acetylation-dependent LSD1 activity might require nucleosomal substrate rather than peptide substrate, which is consistent with prior work.5,33 Given the requirement of full length H3 protein, all subsequent experiments were conducting in cells.
LSD1 Acetylation Altered H3 Binding
In cellulo demethylation assays indicated that HDAC inhibitors influence H3 substrate methylation (Figure 3), although through a mechanism not involving loss of LSD1 catalytic function (Figure S17). LSD1 is typically found in association with HDAC1, HDAC2, BRAF35, and CoREST.5 Previous reports indicated that LSD1 activity and substrate specificity could be regulated by its interacting proteins.5,28,29 For example, CoREST promotes the nucleosome binding and demethylase activity of LSD1 and protects LSD1 from proteasomal degradation.5 Interestingly, HDAC5 also interacted and protected LSD1 from proteasomal degradation to promote breast cancer progression, although not through direct HDAC5-mediated deacetylation.34 Given that acetylation can regulate protein–protein interactions,31 we hypothesized that HDAC1-mediated LSD1 acetylation affects its protein–protein interactions to reduce demethylase activity and elevate H3K4 methylation.31
To assess if LSD1 activity is reduced due to changes in protein–protein associations, coimmunoprecipitation studies were performed. FLAG-tagged LSD1 was overexpressed in HEK293 cells, and cells were treated with HDAC inhibitors to induce acetylation. Cells were then harvested and lysed before LSD1-FLAG was immunoprecipitated. LSD1-bound proteins from the immunoprecipitates were separated by SDS-PAGE and immunoblotted with antibodies to CoREST, along with antibodies to the H3 substrate as a control (Figure 4). Acetylation did not affect the LSD1/CoREST interaction (Figure 4A, CoREST blot, compare lane 2 to lanes 3 and 4). Instead, HDAC inhibitors altered the interaction between LSD1 and its cellular substrate H3 (Figure 4A, H3 blot, compare lane 2 to lanes 3 and 4). The data suggested that HDAC inhibitor-mediated acetylation of LSD1 stabilized interaction between LSD1 and H3. Further, inhibitor-treated, immunoprecipitated H3 displayed elevated methylation at lysine 4 compared to DMSO control (Figure 4A, H3K4me2 blot, compare lane 2 to lanes 3 and 4), while not affecting lysine 9 methylation (Figure 4A, H3K9me2 blot, compare lane 2 to lanes 3 and 4). The elevated methylation at H3K4 suggested a loss of LSD1 enzyme function. Combined, the data implicate a hypothesis where LSD1 acetylation alters its H3 substrate interaction, which affects the methylation state of H3K4.
Figure 4.

Acetylation of LSD1 induced LSD1/H3 interaction. (A) LSD1-FLAG was overexpressed in HEK293 before cells were treated with HDAC inhibitors to induce acetylation. Cells were harvested and lysed, with LSD1-bound proteins immunoprecipitated with anti-FLAG agarose beads. Immunoprecipitates were analyzed by Western blotting with FLAG, acetyl lysine, H3, H3K4me2, H3K9me2, CoREST, and GAPDH antibodies. (B,C) HEK293 cells (B) or HeLa cells (C) were treated with HDAC inhibitors, harvested, and lysed before endogenous LSD1 was immunoprecipitated. Western blotting was performed with LSD1, H3, H3K4me2, and GAPDH antibodies. GAPDH was used as a loading control in all experiments.
To further study acetylation-dependent LSD1/H3 binding, we analyzed the effect of HDAC inhibitors on the H3 interaction with endogenous LSD1. Endogenous LSD1 was immunoprecipitated from HDAC inhibitor treated HEK293 or HeLa cell lysates and analyzed by Western blot (Figure 4B and C). Similar to overexpressed LSD1, endogenous LSD1 interacted more robustly with H3 and methylated H3K4 upon HDAC inhibitor treatment (Figure 4B and C, H3 and H3K4me2 blots, compare lane 2 with lanes 3 and 4). The data were consistent with the hypothesis that LSD1 acetylation altered interaction with H3 and methylation of H3K4. In addition, the similar results with both HEK293 and HeLa cells showed that the acetylation dependence of H3 binding and methylation is general.
Acetylation of LSD1 at K374 Affected H3 Binding
LSD1 consists of three domains—the SWIRM, amine oxidase (AOD), and Tower domains. The AOD comprises the FAD and substrate binding lobes.35 Two alpha helices (Sα1 and Sα3) rich in acidic residues comprise the substrate binding lobe. The presence of acidic residues in the substrate binding lobe promotes interaction with the basic residues of H3 and positions the methylated lysine correctly for catalysis.36,37 We wondered if LSD1 acetylation occurred on or near the substrate binding lobe, which would explain the influence of acetylation on H3 binding.
To identify the location of acetylated lysines on LSD1, we utilized a mass-spectrometry-based approach. FLAG-tagged LSD1 was expressed in HEK293 cells before treatment with or without HDAC inhibitors to monitor HDAC-dependent acetylation. After lysis, immunoprecipitation, and SDS-PAGE separation, protein bands corresponding to LSD1 were excised from the gel, trypsin digested, and subjected to LC-MS/MS analysis. Both SAHA and SHI-1:2 enhanced acetylation of LSD1 at K374 compared to untreated samples (Table S2 and Figure S18), suggesting that K374 is the target site for HDAC1-mediated deacetylation. K374 is a solvent-exposed amino acid that lies in the Sα1 helix of the substrate binding lobe of LSD1 (Figure 5A). Previous studies documented involvement of the Sα1 helix (372–394 residues) in H3 binding, with a conformational change induced upon binding to H3.36–39 Given the placement of K374 in the H3 binding Sα1 helix (Figure 5A, yellow helix), we hypothesized that K374 acetylation is regulated by HDAC1 to influence LSD1/H3 interactions.
Figure 5.

Acetylation at K374 altering the LSD1/H3 interaction. (A) Crystal structure of LSD1 (2V1D, green) bound to histone H3 (red spheres) and FAD (dark blue), with dimethylated lysine 4 of H3 (pink) shown. K364 (light blue) is solvent-exposed and present in the Sα1 helix (yellow) of the substrate binding lobe. (B,C) FLAG-tagged wild type or K374R mutant LSD1 were transfected into HEK293 cells, and cells were treated with HDAC1/2 selective inhibitor SHI-1:2 or broad inhibitor SAHA. LSD1-FLAG was immunoprecipitated with a FLAG antibody and subjected to SDS-PAGE separation and immunoblotting with the indicated antibodies.
To probe the hypothesis, we initially studied whether acetylation at K374 is a major site regulated by HDAC1 using a full length FLAG-tagged LSD1 K374R mutant expression construct. Following transfection of the wild type and K374R LSD1 expression plasmids into HEK293 cells, HDAC inhibitors were added to induce LSD1 acetylation. Then, LSD1 was immunoprecipitated and immunoblotted with an acetyl lysine antibody to detect acetylation. The level of acetylation of the K374R mutant was significantly reduced after HDAC inhibitor treatment compared to that of wild type LSD1 (Figure 5B, top, compare lanes 3 to 6 and lanes 4 to 7). The data suggest that K374 is a major HDAC-dependent acetylation site on LSD1.
To test the effect of acetylation at K374 on LSD1/H3 interaction, HEK293 cells were transfected with the WT or K374R mutant LSD1-FLAG constructs, treated with SHI-1:2 or SAHA to induce acetylation, and harvested, before LSD1 was immunoprecipitated and analyzed by Western blotting (Figure 5C). The K374R LSD1 mutant coimmunoprecipitated reduced H3 compared to wild type after inhibitor treatment (Figure 5C, H3 blot, compare lanes 3 to 6 and lanes 4 to 7). In addition, the quantity of H3 coimmunoprecipitated was similar comparing inhibitor treated versus untreated LSD1 K374R mutant (Figure 5C, H3 blot, compare lanes 5 to 6 and 7), indicating that a low level of H3 binding by the mutant is independent of HDAC-mediated acetylation. Moreover, methylated lysine 4 of H3 (H3K4me2) was reduced in inhibitor-treated mutant K374R LSD1 compared to wild type (Figure 5C, H3K4me2 blot, compare lanes 3 and 4 to lanes 6 and 7). In addition, H3K4me2 levels were similar between untreated and inhibitor treated LSD1 K374R mutants (Figure 5C, H3K4me2 blot, compare lanes 5 to 6 and 7), which suggested that the mutant maintained demethylase activity to efficiently release demethylated H3K4 product. In total, the coimmunoprecipitation data indicated that K374 of LSD1 is critical for altered H3 binding and H3K4 methylation after HDAC inhibitor treatment. The data are consistent with the hypothesis that K374 acetylation results in nonproductive binding between LSD1 and H3, thereby leading to elevated H3 methylation. This hypothesis is supported by a recent report that documents the effect of three disease related mutations of LSD1 (E379K, D556G, Y761H).40 Among these, E379 lies in the Sα1 helix and is important for H3 binding. The E379K LSD1 mutant displayed reduced Vmax and altered KM, suggesting that amino acids in the Sα1 helix are critical for full enzymatic activity.
Acetylation of LSD1 at K374 Reactivated Expression of Target Genes
LSD1 represses target genes through demethylation of H3K4.32 Given the HDAC inhibitor and K374R mutant-dependent alteration of H3 binding and H3K4 methylation observed here, we tested whether acetylation of LSD1 affected the expression of downstream target genes. SCN3A and SCN2A are two known target genes of LSD1 that have been studied in prior LSD1 gene expression studies.5,32 Importantly, the protein products of SCN3A and SCN2A are voltage-gated sodium channels that are aberrantly expressed in prostate cancers and are associated with metastasis,41,42 making them interesting biological targets. Expression of SCN2A and SCN3A was monitored after overexpression of wild type and K374R mutants and HDAC inhibitor treatment using a real time–polymerase chain reaction (RT-PCR). HEK293 cells were transfected with WT or K374R mutant LSD1-FLAG, treated with SHI-1:2, and lysed, before RNA was isolated, converted to cDNA, and then used as the template in PCR reactions using gene-specific primers. SHI-1:2 treatment of wild type LSD1-containing cells resulted in increased expression of both SCN2A (5.4 ± 1 fold, Figure S19) and SCN3A (2.4 ± 0.1 fold, Figure S19) compared to the DMSO control (Figures 6A and 7B, column 3 compared to column 2), which confirmed that LSD1-mediated gene expression is HDAC inhibitor-dependent. In contrast, SHI-1:2 treatment of K374R mutant LSD1-containing cells showed values comparable to the DMSO control (Figure 6B, column 4 compared to column 2, and Figure S19). The combined data indicated that K374 is critical for efficient HDAC inhibitor-dependent LSD1 gene regulation.
Figure 6.

Acetylation of LSD1 at K374 altered expression of target genes. HEK293 cells were not transfected (NT) or transfected with WT or K374R mutant LSD1-FLAG, treated with either DMSO (column 2) or SHI-1:2 (columns 3 and 4), and lysed, before RNA was isolated from cells, converted to cDNA, and then used as the template in PCR reactions using gene specific primers for SCN2A (A), SCN3A (B), and GAPDH genes. Fold change was calculated compared to DMSO treated WT LSD1 transfected sample, which was normalized to 1.0 (column 2). Relative mRNA expression was calculated from four independent trials with mean and standard error shown in Figure S19. **p < 0.01, ***p < 0.001, ns: not significant.
Figure 7.

Schematic model depicting the combined activities of HDAC1 and LSD1 on gene expression and tumorigenesis. (A) In cancer cells, HDAC1 activity is elevated to deacetylate LSD1, which leads to proper binding and demethylation of H3 at lysine 4 (H3K4) to repress target genes and promote tumorigenesis. HDAC1 also mediates gene repression through deacetylation of H3 at lysine 9 (H3K9) and lysine 14 (H3K14). (B) HDAC inhibitors enhance LSD1 acetylation, leading to reduced LSD1 activity, elevated H3K4 methylation, and derepression of target genes to inhibit tumorigenesis. HDAC inhibitors also promote acetylation of H3K9 and H3K14 to reactivate gene expression.
A Model of HDAC1/LSD1 Crosstalk
The experimental data showed that HDAC1 deacetylated LSD1 both in vitro and in cellulo, and LSD1 is acetylated at K374 to regulate productive binding of H3. Moreover, nonproductive H3 binding is accompanied by reduced LSD1 demethylation of H3K4, which leads to a derepression of LSD1 target gene expression. On the basis of the data, we propose a model where deacetylated LSD1 binds to H3 in a productive conformation to promote the demethylation and repression of LSD1 target genes (Figure 7A). Simultaneously, HDAC1 can also deacetylate H3 to further down-regulate transcription. The combined activity of LSD1 and HDAC1 promotes H3K4 demethylation and H3K9/H3K14 deacetylation, respectively, to fully control gene repression.30 Given the overexpression of HDAC1 and LSD1 in multiple cancer cell types,7–11,43–48 elevated HDAC1 and LSD1 activities result in repressed expression of tumor suppressor genes, which promote cancer progression (Figure 7A). The model suggests a functional synergy between HDAC1 and LSD1 activities in promoting cancer progression.
The overexpression of HDAC activity in cancer tissues has led to the development of multiple HDAC inhibitors as anticancer agents.15,49–51 The mechanism of HDAC inhibitor action is generally attributed to elevated acetylation of H3K9 and H3K14 due to inhibition of HDAC activity, which consequently mediates re-expression of tumor suppressor genes (Figure 7B).52 Here, we uncovered a secondary mechanism of HDAC inhibitor action due to enhanced LSD1 acetylation. The data are consistent with a model where HDAC inhibitor-mediated LSD1 acetylation at K374 alters LSD1/H3 binding, reduces its demethylase activity, augments the active chromatin mark H3K4me2, and reactivates the expression of LSD1 target genes (Figure 7B). Moreover, the combined inhibition of HDAC and LSD1 activities leads to accumulation of active chromatin marks and derepression of tumor suppressors, which fully inhibits cancer progression. The model suggests that HDAC inhibitors take advantage of the functional synergy between HDAC1 and LSD1 to fully repress tumorigenesis. Combined, the data uncovered that HDAC1 acts upstream of LSD1 to regulate its activity through acetylation, which is a previously unidentified mechanistic relationship between HDAC1 and LSD1.
Although LSD1 acetylation is relatively underexplored, a recent paper documented that LSD1 acetylation suppressed epithelial to mesenchymal transition (EMT).33 MOF (male absent on the first) acetyltransferase was responsible for acetylation of LSD1 in epithelial cells, whereas acetylation was not observed in mesenchymal cells. The lack of acetylation in mesenchymal cells could be partly due to the overexpression of HDAC1.33 Acetylation of LSD1 disrupted nucleosomal binding, inhibited demethylase activity, and reactivated LSD1 target genes, which is consistent with the model proposed here (Figure 7). Using in silico analysis and global proteomics data, three lysines in the tower domain of LSD1 (K432, K433, and K436) were speculated to be critical for H3 binding.33 Although these lysines are sites for MOF-mediated acetylation, we propose that acetylation of LSD1 at K374 also contributes to the LSD1 activity observed. Further studies are needed to identify the acetyltransferase responsible for mediating K374 acetylation in LSD1. The combined studies suggest that acetylation of LSD1 affects H3 binding, impairs demethylase activity, and mediates derepression of target genes involved in important processes, such as cell cycle and EMT. Given that HDAC1 is highly expressed in cancer cells, HDAC1 might compete with MOF to regulate LSD1 acetylation and influence tumor progression.
In this report, we document for the first time use of inactive HDAC1 mutants for trapping and identification of substrates. HDAC1 substrate identification suffers from a lack of discovery tools, making the trapping strategy valuable and enabling. The C151 residue is strictly conserved among all HDAC isoforms,27,53 suggesting that the method can be applied to identify cellular substrates of other HDAC isoforms. Given the role of HDAC proteins in cancer formation and use of HDAC inhibitor drugs in anticancer therapy, substrate trapping studies will have a direct impact on cancer biology and drug design research by revealing new functional roles of HDAC proteins in cellular events.
In summary, a novel mechanism of crosstalk between HDAC and LSD1 was uncovered using an HDAC1 substrate trapping mutant stratetgy. The findings document the importance of discovering new substrates to fully characterize HDAC activity in cells. Significantly, the study revealed a connection between histone acetylation and methylation in epigenetic regulation of gene expression. As a result, a new mechanistic model of HDAC inhibitor action through the combined activities of HDAC and LSD1 is proposed (Figure 7B). With the involvement of HDAC1 and LSD1 in cancer formation and use of HDAC inhibitors as anticancer drugs, these studies broaden our understanding of the diverse functional roles played by HDAC1 and LSD1 in pathological conditions and assist in deciphering the anticancer drug mechanism of action.
METHODS
Antibodies and Reagents
FLAG (catalog number: F3165), HDAC1 (catalog number: H3284), HDAC2 (catalog number: H3159), and LSD1 (catalog number: L4418) antibodies, as well as anti-FLAG agarose beads (catalog number: A2220) and proteomic grade trypsin (catalog number: T6567), were purchased from Sigma. Acetyl lysine (catalog number: 9814S), histone 3 (catalog number: 4499), acetyl-H3 (catalog number: 9649P), H3K4me2 (catalog number: 9725P), H3K9me2 (catalog number: 4658P), GAPDH (catalog number: 5174P), and secondary HRP conjugated rabbit (catalog number: 7074) antibodies were purchased from Cell Signaling. The CoREST antibody was obtained from Bethyl laboratories (catalog number: A300-130A-T). Protein A/G plus agarose beads were purchased from Santa Cruz. Secondary rabbit (Alexa fluoro 488; catalog number: A11008) and mouse (Alexa Fluoro 647; catalog number: A21235) antibodies were obtained from Molecular Probes. Recombinant HDAC1 (catalog number: 50051) was purchased from BPS Biosciences. A first strand cDNA synthesis kit was purchased from New England Bioloabs, and a Trizol plus RNA easy kit was purchased from Invitrogen. Fast Sybr green master mix (catalog number: 4385612) and the 96 well PCR reaction plates (catalog number: 4360954) were purchased from Applied Biosystems. A LSD1 fluorometric drug discovery kit was purchased from Enzo Life Sciences (catalog number: BML-AK544-0001).
Expression Plasmids, Cell Culture, and Transient Transfections
HDAC1 single point mutants were generated as previously described.26,27 The pCAGGs-LSD1-FLAG expression construct was a generous gift from Dr. Ryuji Hamamoto (University of Chicago).54 The pCAGGs-LSD1-FLAG K374R mutant was created by Quick change site directed mutagenesis using pCAGGS-LSD1-FLAG as a template (K374R forward primer, 5′-GGA CAA GCT GTT CCT AAA GAG AGA GAT GAA ATG GTA GAG CAA GAG-3′; K374R reverse primer, 5′-CTC TTG CTC TAC CAT TTC ATC TCT CTC TTT AGG AAC AGC TTG TCC-3′), and the mutation was confirmed by DNA sequencing. HEK293 cells were grown in Dulbecco’s Modified Eagle’s Medium (DMEM) supplemented with 10% Fetal Bovine Serum (Life technologies) and 1% antibiotic/antimycotic (Hyclone) at 37 °C in a 5% CO2 incubator. HeLa cells were grown in Ham’s F12 medium supplemented with 10% Fetal Bovine Serum (Life technologies) and 1% antibiotic/antimycotic (Hyclone) at 37 °C in a 5% CO2 incubator. MCF7 cells were maintained in Eagle’s Minimum Essential Medium (EMEM) supplemented with 10% Fetal Bovine Serum (Life Technologies) at 37 °C in a 5% CO2 environment. Jetprime reagent (VWR) was used for tranfection of pasmid DNA (5 μg) into HEK293 cells (20 × 106) at 60% confluency. After a 48 h growth period, cells were harvested and washed 2 times with DPBS (Hyclone, Dulbecco’s Phosphate Buffered Saline, 10 mM Na2HPO4, 1.8 mM KH2PO4, 137 mM NaCl, 2.7 mM KCl, pH 7.4), and either used immediately or stored at −80 °C as a cell pellet. For inhibitor treatments, cells were grown in the presence of an inhibitor (10 μM in growth media containing <2% DMSO) for an additional 24 h after the 48 h growth period.
Substrate Trapping and Inhibitor Competition
Following transfection of HEK293 cells with pBJ5-HDAC1 wild type or mutant plasmids,26,27 as described above, cells were grown for 48 h and then subsequently treated with SAHA (10 μM in growth media containing DMEM, 10% FBS, 1% antibiotic/antimycotic, and <2% DMSO) for another 24 h before harvesting. Cells (20 × 106) were lysed in lysis buffer (500 μL; 50 mM Tris-Cl at pH 8.0, 150 mM NaCl, 10% glycerol, and 0.5% triton-X100) containing 1× protease inhibitor cocktail (GenDEPOT) at 4 °C for 30 min with rotation. The supernatant was collected using centrifugation at 13.2 × 10³ rpm for 10 min at 4 °C. Prior to immunoprecipitation, anti-FLAG agarose beads (20 μL bead slurry) were washed with cold TBS (tris buffered saline; 20 mM Tris-Cl at pH 8.0, 150 mM NaCl) two times with spinning at 5000 rcf for 1 min at 4 °C. Wild type or mutant HDAC proteins were immunoprecipitated using the prewashed anti-FLAG agarose beads by incubating at 4 °C overnight with rotation. For inhibitor competition experiments, SHI-1:2 (10 μM in lysis buffer) or tubastatin (10 μM in lysis buffer) was included during immunoprecipitation. After immunoprecipitation, beads were washed three times with lysis buffer (1 mL), and bound proteins were eluted by incubating for 30 min at 4 °C using 3× FLAG peptide (APEXBIO; 50 μL; 0.25 mg mL−1 in TBS). The eluted proteins were mixed with 4× SDS loading dye (25 μL; 100 mM Tris-Cl at pH 6.8, 4% SDS, 20% glycerol, 0.008% bromophenol blue, and 10% v/v β-mercaptoethanol), separated by 10% SDS-PAGE, and visualized with Sypro Ruby total protein stain (Molecular Probes) according to the manufacturer’s instructions.
Mass Spectrometric Analysis
To identify proteins bound to the HDAC1 mutant, LC-MS/MS analysis was performed. Gel bands corresponding to p100 (from three independent trials) or p55 and p38 (from two independent trials) were excised from the Sypro Ruby stained gel, washed with destaining buffer (50 μL; 1:1 (v/v) acetonitrile/50 mM ammonium bicarbonate in water) for 15 min at RT, and dehydrated in acetonitrile (50 μL). The gel pieces were incubated (rehydrated) with 50 mM ammonium bicarbonate (50 μL). After rehydrating for 5 min, an equal volume (50 uL) of acetonitrile was added. Gel pieces were incubated at RT for 15 min and dehydrated again in acetonitrile (50 μL). Following removal of the acetonitrile, gel slices were dried using a speedvac concentrator (ThermoSavant). Then, gel pieces were swelled with reducing buffer (100 μL; 50 mM TCEP in 25 mM ammonium bicarbonate) for 10 min at 37 °C. After incubation, reducing buffer was removed and gel slices were mixed with alkylation buffer (100 μL; 55 mM iodoacetamide in 25 mM ammonium bicarbonate) for 1 h at RT in the dark while shaking. Then, gel pieces were washed two times with destaining buffer (50 μL) for 5 min at RT, dehydrated with acetonitrile (50 μL), and dried. To digest proteins, gel slices were incubated in the digestion buffer (50 μL; 20 ng/μL trypsin in 40 mM ammonium bicarbonate and 9% acetonitrile) overnight at 37 °C. The resultant digest solution was removed and tranferred to a new tube. The remaining proteins in the gel pieces were extracted using extraction buffer (50 μL; 50% acetonitrile and 0.2% formic acid). The peptides in the combined digestion and extraction solutions were dried and stored at −20 °C in preparation for LC-MS/MS analysis at the Wayne State University and Karmanos Cancer Center Proteomics Core facility.
Dried peptides were resuspended in a solution of 5% acetonitrile, 0.1% formic acid, and 0.005% trifluoroacetic acid. Samples were separated by ultra high pressure reverse phase chromatography using an Acclaim PepMap RSLC column and an Easy nLC 1000 UHPLC system (Thermo). Peptides were analyzed with a Q-Exactive mass spectrometer (Thermo) with a 70 000 resolution MS1 scan over 375–1600 m/z, followed by 17 500 resolution MS2 scans using a 1.6 m/z window and 29% normalized collision energy for HCD on the top 15 ions. Dynamic exclusion was turned on (15 s). Peak lists were generated with Proteome Discoverer (ver 1.4; Thermo), and peptides scored using Mascot (ver 2.4; Matrix Science) and SEQUEST. The search parameters included parent and fragment ion tolerances of 10 ppm and 0.02 Da, respectively, fixed modification of +57 on C (carbamidomethylation), variable modifications of +16 on M (oxidation) and +80 on STY (phosphorylation), and a tryptic digest with up to two missed cleavages. MS2 spectra were searched against a consensus human protein database from UniProt and simultaneously against a scrambled database to calculate the false discovery rate (FDR). Results were imported into Scaffold (ver 4.3; Proteome Software). Protein identification was considered to be positive if at least one unique peptide was scored as ≤1% FDR, and the protein threshold was ≤1% FDR (Table S1).
LSD1 Validation
For LSD1 validation, trapping experiments were performed as described above, with SHI-1:2 used as an immunoprecipitation competitor. Eluted proteins were separated by 10% SDS-PAG, transferred to a PVDF membrane (Immobilin P), and immunoblotted with LSD1 and FLAG antibodies.
LSD1 Acetylation Assessment
The FLAG-tagged LSD1 expression plasmid was transfected into HEK293 cells (20 × 106) and grown for 48 h. After 48 h, cells were incubated without (growth media containing <2% DMSO) or with SHI-1:2 (10 μM in growth media containing <2% DMSO) or SAHA (10 μM in growth media containing <2% DMSO) for another 24 h, harvested, and lysed as described earlier. FLAG-tagged LSD1 was immunoprecipitated using prewashed anti-FLAG agarose beads (20 μL bead slurry) at 4 °C overnight with rocking. After immunoprecipitation, beads were washed three times with lysis buffer (1 mL), and bound proteins were eluted using 4 × SDS loading dye (25 μL), separated by 10% SDS-PAGE, transferred to a PVDF membrane (Immobilon P), and immunoblotted with the FLAG and acetyllysine antibodies.
Deacetylation Assays
For in vitro deacetylation assays, recombinant LSD1 (gift from Dr. Ryuji Hamamoto)54 was subjected to chemical acetylation using acetic anhydride. Recombinant LSD1 (20 μg) was incubated with acetic anhydride (0.2 mM) in ammonium bicarbonate buffer (50 mM, pH 7.0) containing 0.002% methanol (100 uL total volume) for 1 h at RT. Excess acetic anhydride was removed using centriprep columns (3 kDa molecular weight cutoff, Amicon Ultra). Acetylated LSD1 was then used in in vitro deacetylation assays. Prior to the addition of acetylated LSD1, recombinant HDAC1 (4 μg, BPS Biosciences) was first incubated without (2% DMSO) or with SAHA (1 mM in 2% DMSO) in the HDAC assay buffer (50 uL; 50 mM Tris-Cl at pH 8.0, 137 mM NaCl, 2.7 mM KCl, 1 mM MgCl2) for 1 h at 37 °C while shaking at 400 rpm. After the preincubation period, acetylated recombinant LSD1 (1 μg) was incubated with HDAC1 with or without SAHA for another 2.5 h at 37 °C while shaking at 400 rpm. A negative control without HDAC1 contained recombinant LSD1 (1 μg) resuspended in HDAC asssay buffer (48 uL) only. The reactions were stopped by adding 4 × SDS loading dye (10 μL), and the reaction mixture was separated by 10% SDS-PAGE, transferred to a PVDF membrane (Immobilin P), and immunoblotted with acetyl lysine, LSD1, and HDAC1 antibodies.
For in cellulo deacetylation assays, pBJ5 expression constructs of wild type or C151A mutant HDAC1 were cotransfected with the pCAGG construct of FLAG tagged LSD1 into HEK293 cells, as described, and grown for 48 h. For the HDAC negative control, FLAG-tagged LSD1 alone was overexpressed in HEK293. After the 48 h growth period, cells were incubated with SAHA (10 μM in growth media containing <2% DMSO) for another 24 h, before harvesting and lysis, as described. FLAG-tagged HDAC1 and LSD1 proteins were immunoprecipitated using prewashed anti-FLAG agarose beads (25 μL bead slurry) at 4 °C overnight with rocking. Bound beads were washed three times with lysis buffer (1 mL), and bound proteins were eluted using 3 × FLAG peptide, as described, separated by 10% SDS-PAGE, transferred to a PVDF membrane (Immobilin P), and immunoblotted with acetyl lysine and FLAG antibodies.
In Vitro Demethylation Assay
The pCAGGs-LSD1-FLAG construct was transfected into HEK293 cells (20 × 106) and grown for 48 h, as described. A negative control reaction was also performed where no expression construct was present for the transfection. After 48 h, cells were incubated without HDAC inhibitor (growth media containing <2% DMSO) or with SHI-1:2 (10 μM in growth media containing <2% DMSO) or SAHA (10 μM in growth media containing <2% DMSO) for another 24 h, harvested, and lysed, as described earlier. FLAG-tagged LSD1 protein was immunoprecipitated using prewashed anti-FLAG agarose beads (20 μL bead slurry) at 4 °C overnight with rocking. After washing three times with lysis buffer (1 mL), beads were divided into two halves. One half of the immunoprecipitate was used for in vitro demethylation assays using the LSD1 fluorometric drug discovery kit according to the manufacturer’s instructions (Enzo Life Sciences). The other half was eluted using 2 × SDS loading dye (25 uL; 50 mM Tris-Cl at pH 6.8, 2% SDS, 10% glycerol, 0.004% bromophenol blue, and 10% v/v β-mercaptoethanol), separated by 10% SDS-PAGE, and immunoblotted with FLAG antibody. The fluorescence signal from the demethylation assay was background corrected using a reaction with all the components except the LSD1 enzyme. Then, the background-corrected signal of each sample was normalized to LSD1 immunoprecipitated from untreated cells (no inhibitor, set to 100%). The mean and the standard error from at least three independent trials are shown in Figure S17.
In Cellulo Demethylation Assay
HEK293, HeLa, and MCF7 cells were treated with HDAC inhibitors for 24 h. For HEK293 and HeLa, SHI-1:2 or SAHA were used at a 10 μM concentration in <2% DMSO, whereas 5 μM in <2% DMSO was used with MCF7. For the no inhibitor control, cells were treated with <2% DMSO only. After the 24 h incubation period, cells were harvested and lysed, as described, before lysates (50 μg) were mixed with 4 × SDS loading dye (3 μL), separated by 12% SDS-PAGE, transferred to a PVDF membrane (Immobilon P), and immunoblotted with H3K9ac, H3K4me2, H3K9me2, H3, and GAPDH antibodies.
Coimmunoprecipitation
For coimmunoprecipitation experiments using overexpressed LSD1 protein, pCAGGs-LSD1-FLAG was transfected into HEK293 cells and grown for 48 h, as described. Cells were subsequently treated without inhibitor (<2% DMSO in growth media), or with SHI-1:2 (10 μM in growth media containing <2% DMSO) or SAHA (10 μM in growth media containing <2% DMSO) for an additional 24 h. Cells were lysed as described before proteins were immunoprecipitated using prewashed anti-FLAG agarose beads (20 uL bead slurry) overnight at 4 °C with rocking. For endogenous LSD1 coimmunoprecipitation experiments, HEK293 or HeLa cells were treated with SHI-1:2 (10 μM in growth media containing <2% DMSO) or SAHA (10 μM in growth media containing <2% DMSO) for 24 h before harvesting and lysis. Cell lysates were then incubated with LSD1 antibody (5 μg) at 4 °C for 1 h and then further incubated with prewashed protein A/G plus agarose beads (20 μL bead slurry) overnight at 4 °C. Bound proteins were washed three times with lysis buffer (1 mL) and eluted using 4 × SDS loading dye (25 μL), separated by 10% SDS-PAGE, transferred to a PVDF membrane (Immobilon P), and immunoblotted with acetyllysine, FLAG, CoREST, LSD1, H3, H3K4me2, and GAPDH antibodies.
Identification of Acetylated Lysines in LSD1
To identify acetylated lysines on LSD1 that are regulated by HDAC1, HEK293 cells at 60% confluency (20 × 106) were transfected with the pCAGGs-LSD1-FLAG plasmid and allowed to grow for 48 h. After the 48 h recovery period, cells were treated without (growth media containing <2% DMSO) or with SHI-1:2 (10 μM in growth media containing <2% DMSO) or SAHA (10 μM in growth media with <2% DMSO) for an additional 24 h before harvesting and washing, as described. Cells were lysed as described, and LSD1 was immunoprecipitated using prewashed anti-FLAG agarose beads (25 uL bead slurry), separated by SDS-PAGE (10%), and visualized by Sypro Ruby total protein stain (Molecular Probes) according to the manufacturer’s instructions. Bands corresponding to LSD1 were excised from the gel and subjected to in-gel trypsin digestion, as described above. Peptides were analyzed with an Orbitrap Fusion mass spectrometer (Thermo) with a 120 000 resolution MS1 scan over 375–1600 m/z, followed by 30 000 resolution MS2 scans using a 1.6 m/z window and 30% normalized collision energy for CID. Dynamic exclusion was turned on (20 s). Peak lists were generated with Proteome Discoverer (ver 1.4; Thermo) and peptides scored using Mascot (ver 2.4; Matrix Science) and SEQUEST. The search parameters included parent and fragment ion tolerances of 10 ppm and 0.6 Da, respectively, a fixed modification of +57 on C (carbamidomethylation); variable modifications of +16 on M (oxidation), + 1 on NQ (deamidation), and +42 on K (acetylation); and a tryptic digest with up to two missed cleavages. MS2 spectra were searched against a consensus human protein database from UniProt and simultaneously against a scrambled database to calculate the false discovery rate (FDR). Results were imported into Scaffold (ver 4.3; Proteome Software). Protein identification was considered to be positive if at least one unique peptide was scored as ≤1% FDR, and the protein threshold was ≤1% FDR (Table S2).
RT-PCR
Wild type or K374R mutant pCAGGs-LSD1-FLAG plasmids were transfected separately into HEK293 cells (20 × 106) and grown for 48 h. A negative control reaction was also performed where no expression construct was present for the transfection (NT: not transfected). Following the 48 h growth period, cells were incubated without (growth media containing <2% DMSO) or with SHI-1:2 (10 μM in growth media containing <2% DMSO) for an additional 24 h. RNA was isolated using a Trizol plus RNA purification kit (Invitrogen). Then, the RNA (1 μg) was used to synthesize cDNA using a first strand cDNA synthesis kit (NEB). A real time PCR reaction (20 μL) included cDNA (50 ng), forward and reverse primers (0.5 μM), and SYBR green reagent (1×, Applied Biosystems). PCR was performed on a FAST 7500 instrument (Applied biosystems). Gene specific primers for SCN2A, SCN3A, and GAPDH are listed here (SCN2A forward primer, 5′-GAT GAG GAT GAT GAA AAT GGC-3′; SCN2A reverse primer, 5′-CTA ATT TTC TAA TAG GGT TGA AGG G-3′; SCN3A forward primer, 5′-CAC CAC TTC CTA CTT TAA TGG CA-3′; SCN3A reverse primer, 5′-AAA TAG AGA CAG GAA AGC CCA G-3′; GAPDH forward primer, 5′-GAA GGT GAA GGT CGG AGT C-3′; GAPDH reverse primer, 5′-GAA GAT GGT GAT GGG ATT TC-3′).32 Expression values were normalized to the GAPDH control, and fold change was calculated compared to DMSO treated wild type LSD1, which was set to 1.0. The mean and the standard error from at least three independent trials are shown in Figures 6 and S19.
Statistical Analysis
All the data were presented as mean ± standard error from at least three independent trials. A one way ANOVA test was used to compare the data sets using GraphPad Prism software (version 5.01).
Supplementary Material
Acknowledgments
We thank the National Institutes of Health (GM121061) and Wayne State University for funding; R. Hamamoto (University of Chicago) for the full length pCAGGs-LSD1 plasmid and baculovirus expressed recombinant LSD1; S. L. Schreiber (Harvard University) for the pBJ5-HDAC1 construct; Wayne State University and Karmanos Cancer Center Proteomics Core, which is supported by National Institutes of Health Grants P30 ES020957, P30 CA022453, and S10 OD010700; and A. Negmeldin and I. Gomes for comments on the manuscript.
Footnotes
Author Contributions
D.A.N. performed all experiments. M.K.H.P. conceived of the project. Both authors wrote the manuscript.
Notes
The authors declare no competing financial interest.
DEDICATION
This paper is dedicated to Dr. Stuart L. Schreiber on the occasion of his 60th birthday.
The Supporting Information is available free of charge on the ACS Publications website at DOI: 10.1021/acschembio.6b00776.
Additional trapping data, MS spectra, and sequences for identified proteins; quantification of Western blots; in vitro demethylation assay; independent trials for real time PCR analysis (PDF)
References
- 1.Kramer OH, Gottlicher M, Heinzel T. Histone deacetylase as a therapeutic target. Trends Endocrinol Metab. 2001;12:294–300. doi: 10.1016/s1043-2760(01)00438-6. [DOI] [PubMed] [Google Scholar]
- 2.Park JA, Kim AJ, Kang Y, Jung YJ, Kim HK, Kim KC. Deacetylation and Methylation at Histone H3 Lysine 9 (H3K9) Coordinate Chromosome Condensation during Cell Cycle Progression. Mol Cells. 2011;31:343–349. doi: 10.1007/s10059-011-0044-4. [DOI] [PMC free article] [PubMed] [Google Scholar]
- 3.Bernstein BE, Humphrey EL, Erlich RL, Schneider R, Bouman P, Liu JS, Kouzarides T, Schreiber SL. Methylation of histone H3 Lys 4 in coding regions of active genes. Proc Natl Acad Sci U S A. 2002;99:8695–8700. doi: 10.1073/pnas.082249499. [DOI] [PMC free article] [PubMed] [Google Scholar]
- 4.Guillemette B, Drogaris P, Lin HHS, Armstrong H, Hiragami-Hamada K, Imhof A, Bonneil É, Thibault P, Verreault A, Festenstein RJ. H3 Lysine 4 Is Acetylated at Active Gene Promoters and Is Regulated by H3 Lysine 4 Methylation. PLoS Genet. 2011;7:e1001354. doi: 10.1371/journal.pgen.1001354. [DOI] [PMC free article] [PubMed] [Google Scholar]
- 5.Shi YJ, Matson C, Lan F, Iwase S, Baba T, Shi Y. Regulation of LSD1 histone demethylase activity by its associated factors. Mol Cell. 2005;19:857–864. doi: 10.1016/j.molcel.2005.08.027. [DOI] [PubMed] [Google Scholar]
- 6.Lund AH, van Lohuizen M. Epigenetics and cancer. Genes Dev. 2004;18:2315–2335. doi: 10.1101/gad.1232504. [DOI] [PubMed] [Google Scholar]
- 7.Miyake K, Yoshizumi T, Imura S, Sugimoto K, Batmunkh E, Kanemura H, Morine Y, Shimada M. Expression of hypoxia-inducible factor-1alpha, histone deacetylase 1, and metastasis-associated protein 1 in pancreatic carcinoma: correlation with poor prognosis with possible regulation. Pancreas. 2008;36:e1–9. doi: 10.1097/MPA.0b013e31815f2c2a. [DOI] [PubMed] [Google Scholar]
- 8.Rikimaru T, Taketomi A, Yamashita Y, Shirabe K, Hamatsu T, Shimada M, Maehara Y. Clinical significance of histone deacetylase 1 expression in patients with hepatocellular carcinoma. Oncology. 2007;72:69–74. doi: 10.1159/000111106. [DOI] [PubMed] [Google Scholar]
- 9.Weichert W. HDAC expression and clinical prognosis in human malignancies. Cancer Lett. 2009;280:168–176. doi: 10.1016/j.canlet.2008.10.047. [DOI] [PubMed] [Google Scholar]
- 10.Weichert W, Roske A, Gekeler V, Beckers T, Ebert MP, Pross M, Dietel M, Denkert C, Rocken C. Association of patterns of class I histone deacetylase expression with patient prognosis in gastric cancer: a retrospective analysis. Lancet Oncol. 2008;9:139–148. doi: 10.1016/S1470-2045(08)70004-4. [DOI] [PubMed] [Google Scholar]
- 11.Sasaki H, Moriyama S, Nakashima Y, Kobayashi Y, Kiriyama M, Fukai I, Yamakawa Y, Fujii Y. Histone deacetylase 1 mRNA expression in lung cancer. Lung cancer. 2004;46:171–178. doi: 10.1016/j.lungcan.2004.03.021. [DOI] [PubMed] [Google Scholar]
- 12.Glaser KB, Li J, Staver MJ, Wei RQ, Albert DH, Davidsen SK. Role of Class I and Class II histone deacetylases in carcinoma cells using siRNA. Biochem Biophys Res Commun. 2003;310:529–536. doi: 10.1016/j.bbrc.2003.09.043. [DOI] [PubMed] [Google Scholar]
- 13.Mariadason JM, Corner GA, Augenlicht LH. Genetic Reprogramming in Pathways of Colonic Cell Maturation Induced by Short Chain Fatty Acids: Comparison with Trichostatin A, Sulindac, and Curcumin and Implications for Chemoprevention of Colon Cancer. Cancer Res. 2000;60:4561–4572. [PubMed] [Google Scholar]
- 14.Hughes TR, Marton MJ, Jones AR, Roberts CJ, Stoughton R, Armour CD, Coffey E, Bennett HA, Dai H, He YD, Kidd MJ, King AM, Meyer MR, Slade D, Lum PY, Stepaniants SB, Shoemaker DD, Gachotte D, Chakraburtty K, Simon J, Bard M, Friend SH. Functional Discovery via a Compendium of Expression Profiles. Cell. 2000;102:109–126. doi: 10.1016/s0092-8674(00)00015-5. [DOI] [PubMed] [Google Scholar]
- 15.Grant S, Easley C, Kirkpatrick P. Vorinostat. Nat Rev Drug Discovery. 2007;6:21–22. doi: 10.1038/nrd2227. [DOI] [PubMed] [Google Scholar]
- 16.Huang PH, Chen CH, Chou CC, Sargeant AM, Kulp SK, Teng CM, Byrd JC, Chen CS. Histone Deacetylase Inhibitors Stimulate Histone H3 Lysine 4 Methylation in Part Via Transcriptional Repression of Histone H3 Lysine 4 Demethylases. Molecular pharmacology. 2011;79:197–206. doi: 10.1124/mol.110.067702. [DOI] [PMC free article] [PubMed] [Google Scholar]
- 17.Huang Y, Vasilatos SN, Boric L, Shaw PG, Davidson NE. Inhibitors of histone demethylation and histone deacetylation cooperate in regulating gene expression and inhibiting growth in human breast cancer cells. Breast Cancer Res Treat. 2012;131:777–789. doi: 10.1007/s10549-011-1480-8. [DOI] [PMC free article] [PubMed] [Google Scholar]
- 18.Flint AJ, Tiganis T, Barford D, Tonks NK. Development of “substrate-trapping” mutants to identify physiological substrates of protein tyrosine phosphatases. Proc Natl Acad Sci U S A. 1997;94:1680–1685. doi: 10.1073/pnas.94.5.1680. [DOI] [PMC free article] [PubMed] [Google Scholar]
- 19.Das C, Kundu TK. Transcriptional regulation by the acetylation of nonhistone proteins in humans – a new target for therapeutics. IUBMB Life. 2005;57:137–149. doi: 10.1080/15216540500090629. [DOI] [PubMed] [Google Scholar]
- 20.Zhao S, Xu W, Jiang W, Yu W, Lin Y, Zhang T, Yao J, Zhou L, Zeng Y, Li H, Li Y, Shi J, An W, Hancock SM, He F, Qin L, Chin J, Yang P, Chen X, Lei Q, Xiong Y, Guan KL. Regulation of cellular metabolism by protein lysine acetylation. Science. 2010;327:1000–1004. doi: 10.1126/science.1179689. [DOI] [PMC free article] [PubMed] [Google Scholar]
- 21.Olson DE, Udeshi ND, Wolfson NA, Pitcairn CA, Sullivan ED, Jaffe JD, Svinkina T, Natoli T, Lu X, Paulk J, McCarren P, Wagner FF, Barker D, Howe E, Lazzaro F, Gale JP, Zhang YL, Subramanian A, Fierke CA, Carr SA, Holson EB. An unbiased approach to identify endogenous substrates of “histone” deacetylase 8. ACS Chem Biol. 2014;9:2210–2216. doi: 10.1021/cb500492r. [DOI] [PMC free article] [PubMed] [Google Scholar]
- 22.Scholz C, Weinert BT, Wagner SA, Beli P, Miyake Y, Qi J, Jensen LJ, Streicher W, McCarthy AR, Westwood NJ, Lain S, Cox J, Matthias P, Mann M, Bradner JE, Choudhary C. Acetylation site specificities of lysine deacetylase inhibitors in human cells. Nat Biotechnol. 2015;33:415–423. doi: 10.1038/nbt.3130. [DOI] [PubMed] [Google Scholar]
- 23.Zhang L, Liu S, Liu N, Zhang Y, Liu M, Li D, Seto E, Yao TP, Shui W, Zhou J. Proteomic identification and functional characterization of MYH9, Hsc70, and DNAJA1 as novel substrates of HDAC6 deacetylase activity. Protein Cell. 2015;6:42–54. doi: 10.1007/s13238-014-0102-8. [DOI] [PMC free article] [PubMed] [Google Scholar]
- 24.Luo J, Su F, Chen D, Shiloh A, Gu W. Deacetylation of p53 modulates its effect on cell growth and apoptosis. Nature. 2000;408:377–381. doi: 10.1038/35042612. [DOI] [PubMed] [Google Scholar]
- 25.Martinez-Balbas MA, Bauer UM, Nielsen SJ, Brehm A, Kouzarides T. Regulation of E2F1 activity by acetylation. EMBO J. 2000;19:662–671. doi: 10.1093/emboj/19.4.662. [DOI] [PMC free article] [PubMed] [Google Scholar]
- 26.Weerasinghe SVW, Estiu G, Wiest O, Pflum MKH. Residues in the 11Å Channel of Histone Deacetylase 1 Promote Catalytic Activity: Implications for Designing Isoform-Selective Histone Deacetylase Inhibitors. J Med Chem. 2008;51:5542–5551. doi: 10.1021/jm800081j. [DOI] [PMC free article] [PubMed] [Google Scholar]
- 27.Wambua MK, Nalawansha DA, Negmeldin AT, Pflum MK. Mutagenesis Studies of the 14 Å Internal Cavity of Histone Deacetylase 1: Insights towards the Acetate Escape Hypothesis and Selective Inhibitor Design. J Med Chem. 2014;57:642–650. doi: 10.1021/jm401837e. [DOI] [PMC free article] [PubMed] [Google Scholar]
- 28.Metzger E, Wissmann M, Yin N, Muller JM, Schneider R, Peters AH, Gunther T, Buettner R, Schule R. LSD1 demethylates repressive histone marks to promote androgen-receptor-dependent transcription. Nature. 2005;437:436–439. doi: 10.1038/nature04020. [DOI] [PubMed] [Google Scholar]
- 29.Lee MG, Wynder C, Cooch N, Shiekhattar R. An essential role for CoREST in nucleosomal histone 3 lysine 4 demethylation. Nature. 2005;437:432–435. doi: 10.1038/nature04021. [DOI] [PubMed] [Google Scholar]
- 30.Lee MG, Wynder C, Bochar DA, Hakimi MA, Cooch N, Shiekhattar R. Functional Interplay between Histone Demethylase and Deacetylase Enzymes. Mol Cell Biol. 2006;26:6395–6402. doi: 10.1128/MCB.00723-06. [DOI] [PMC free article] [PubMed] [Google Scholar]
- 31.Singh BN, Zhang G, Hwa YL, Li J, Dowdy SC, Jiang SW. Nonhistone protein acetylation as cancer therapy targets. Expert Rev Anticancer Ther. 2010;10:935–954. doi: 10.1586/era.10.62. [DOI] [PMC free article] [PubMed] [Google Scholar]
- 32.Shi Y, Lan F, Matson C, Mulligan P, Whetstine JR, Cole PA, Casero RA, Shi Y. Histone demethylation mediated by the nuclear amine oxidase homolog LSD1. Cell. 2004;119:941–953. doi: 10.1016/j.cell.2004.12.012. [DOI] [PubMed] [Google Scholar]
- 33.Luo H, Shenoy AK, Li X, Jin Y, Jin L, Cai Q, Tang M, Liu Y, Chen H, Reisman D, Wu L, Seto E, Qiu Y, Dou Y, Casero RA, Jr, Lu J. MOF Acetylates the Histone Demethylase LSD1 to Suppress Epithelial-to-Mesenchymal Transition. Cell Rep. 2016;15:2665–2678. doi: 10.1016/j.celrep.2016.05.050. [DOI] [PubMed] [Google Scholar]
- 34.Cao C, Vasilatos SN, Bhargava R, Fine JL, Oesterreich S, Davidson NE, Huang Y. Functional interaction of histone deacetylase 5 (HDAC5) and lysine-specific demethylase 1 (LSD1) promotes breast cancer progression. Oncogene. 2016 doi: 10.1038/onc.2016.186. [DOI] [PMC free article] [PubMed] [Google Scholar]
- 35.Forneris F, Battaglioli E, Mattevi A, Binda C. New roles of flavoproteins in molecular cell biology: histone demethylase LSD1 and chromatin. FEBS J. 2009;276:4304–4312. doi: 10.1111/j.1742-4658.2009.07142.x. [DOI] [PubMed] [Google Scholar]
- 36.Chen Y, Yang Y, Wang F, Wan K, Yamane K, Zhang Y, Lei M. Crystal structure of human histone lysine-specific demethylase 1 (LSD1) Proc Natl Acad Sci U S A. 2006;103:13956–13961. doi: 10.1073/pnas.0606381103. [DOI] [PMC free article] [PubMed] [Google Scholar]
- 37.Forneris F, Binda C, Adamo A, Battaglioli E, Mattevi A. Structural basis of LSD1-CoREST selectivity in histone H3 recognition. J Biol Chem. 2007;282:20070–20074. doi: 10.1074/jbc.C700100200. [DOI] [PubMed] [Google Scholar]
- 38.Baron R, Vellore NA. LSD1/CoREST is an allosteric nanoscale clamp regulated by H3-histone-tail molecular recognition. Proc Natl Acad Sci U S A. 2012;109:12509–12514. doi: 10.1073/pnas.1207892109. [DOI] [PMC free article] [PubMed] [Google Scholar]
- 39.Vellore NA, Baron R. Molecular dynamics simulations indicate an induced-fit mechanism for LSD1/CoREST-H3-histone molecular recognition. BMC Biophys. 2013;6:15. doi: 10.1186/2046-1682-6-15. [DOI] [PMC free article] [PubMed] [Google Scholar]
- 40.Pilotto S, Speranzini V, Marabelli C, Rusconi F, Toffolo E, Grillo B, Battaglioli E, Mattevi A. LSD1/KDM1A mutations associated to a newly described form of intellectual disability impair demethylase activity and binding to transcription factors. Hum Mol Genet. 2016:ddw120. doi: 10.1093/hmg/ddw120. [DOI] [PubMed] [Google Scholar]
- 41.Shan B, Dong M, Tang H, Wang N, Zhang J, Yan CQ, Jiao XC, Zhang HL, Wang C. Voltage-gated sodium channels were differentially expressed in human normal prostate, benign prostatic hyperplasia and prostate cancer cells. Oncol Lett. 2014;8:345–350. doi: 10.3892/ol.2014.2110. [DOI] [PMC free article] [PubMed] [Google Scholar]
- 42.Roger S, Potier M, Vandier C, Besson P, Le Guennec JY. Voltage-gated sodium channels: New targets in cancer therapy? Curr Pharm Des. 2006;12:3681–3695. doi: 10.2174/138161206778522047. [DOI] [PubMed] [Google Scholar]
- 43.Crunkhorn S. Cancer: Targeting LSD1 in small cell lung cancer. Nat Rev Drug Discovery. 2015;14:602–602. [Google Scholar]
- 44.Hayami S, Kelly JD, Cho HS, Yoshimatsu M, Unoki M, Tsunoda T, Field HI, Neal DE, Yamaue H, Ponder BA, Nakamura Y, Hamamoto R. Overexpression of LSD1 contributes to human carcinogenesis through chromatin regulation in various cancers. Int J Cancer. 2011;128:574–586. doi: 10.1002/ijc.25349. [DOI] [PubMed] [Google Scholar]
- 45.Ropero S, Esteller M. The role of histone deacetylases (HDACs) in human cancer. Mol Oncol. 2007;1:19–25. doi: 10.1016/j.molonc.2007.01.001. [DOI] [PMC free article] [PubMed] [Google Scholar]
- 46.Jie D, Zhongmin Z, Guoqing L, Sheng L, Yi Z, Jing W, Liang Z. Positive expression of LSD1 and negative expression of E-cadherin correlate with metastasis and poor prognosis of colon cancer. Dig Dis Sci. 2013;58:1581–1589. doi: 10.1007/s10620-012-2552-2. [DOI] [PubMed] [Google Scholar]
- 47.Lim S, Janzer A, Becker A, Zimmer A, Schule R, Buettner R, Kirfel J. Lysine-specific demethylase 1 (LSD1) is highly expressed in ER-negative breast cancers and a biomarker predicting aggressive biology. Carcinogenesis. 2010;31:512–520. doi: 10.1093/carcin/bgp324. [DOI] [PubMed] [Google Scholar]
- 48.Lv T, Yuan D, Miao X, Lv Y, Zhan P, Shen X, Song Y. Over-expression of LSD1 promotes proliferation, migration and invasion in non-small cell lung cancer. PLoS One. 2012;7:e35065. doi: 10.1371/journal.pone.0035065. [DOI] [PMC free article] [PubMed] [Google Scholar]
- 49.Laubach JP, Moreau P, San-Miguel JF, Richardson PG. Panobinostat for the Treatment of Multiple Myeloma. Clin Cancer Res. 2015;21:4767–4773. doi: 10.1158/1078-0432.CCR-15-0530. [DOI] [PubMed] [Google Scholar]
- 50.Lee HZ, Kwitkowski VE, Del Valle PL, Ricci MS, Saber H, Habtemariam BA, Bullock J, Bloomquist E, Li Shen Y, Chen XH, Brown J, Mehrotra N, Dorff S, Charlab R, Kane RC, Kaminskas E, Justice R, Farrell AT, Pazdur R. FDA Approval: Belinostat for the Treatment of Patients with Relapsed or Refractory Peripheral T-cell Lymphoma. Clin Cancer Res. 2015;21:2666–2670. doi: 10.1158/1078-0432.CCR-14-3119. [DOI] [PubMed] [Google Scholar]
- 51.Prince HM, Dickinson M. Romidepsin for cutaneous T-cell lymphoma. Clin Cancer Res. 2012;18:3509–3515. doi: 10.1158/1078-0432.CCR-11-3144. [DOI] [PubMed] [Google Scholar]
- 52.Drogaris P, Villeneuve V, Pomiès C, Lee EH, Bourdeau V, Bonneil É, Ferbeyre G, Verreault A, Thibault P. Histone Deacetylase Inhibitors Globally Enhance H3/H4 Tail Acetylation Without Affecting H3 Lysine 56 Acetylation. Sci Rep. 2012;2:220. doi: 10.1038/srep00220. [DOI] [PMC free article] [PubMed] [Google Scholar]
- 53.Weerasinghe SV, Estiu G, Wiest O, Pflum MK. Residues in the 11 A channel of histone deacetylase 1 promote catalytic activity: implications for designing isoform-selective histone deacetylase inhibitors. J Med Chem. 2008;51:5542–5551. doi: 10.1021/jm800081j. [DOI] [PMC free article] [PubMed] [Google Scholar]
- 54.Piao L, Suzuki T, Dohmae N, Nakamura Y, Hamamoto R. SUV39H2 methylates and stabilizes LSD1 by inhibiting polyubiquitination in human cancer cells. Oncotarget. 2015;6:16939–16950. doi: 10.18632/oncotarget.4760. [DOI] [PMC free article] [PubMed] [Google Scholar]
Associated Data
This section collects any data citations, data availability statements, or supplementary materials included in this article.