Abstract
Pathogenesis of osteoarthritis (OA) is multifactorial but interleukin-1β (IL-1β) is known to be an important mediator of cartilage degradation. Autophagy is an essential cellular homeostasis mechanism and has been proposed to protect against cartilage degradation and chondrocyte death under pathological conditions. We investigated the role of autophagy activated by sucrose, a natural disaccharide, in suppressing inflammatory mediator’s expression and cell death under pathological conditions in human chondrocytes. Autophagy activation was investigated by Western blotting for LC3 and Beclin-1, immunofluorescence staining for LC3 puncta, and measuring autophagic flux. Activation of mTOR, AKT and P70S6K was evaluated by Western blotting. Chondrocyte apoptosis was evaluated by propidium iodide (PI) staining using flowcytometry, expression of Bax by Western blotting, gene expression by TaqMan assays and caspase 3/7 activity was measured using a luminescence-based assay. We found that sucrose induced active autophagy in OA chondrocytes in vitro dependent on the activation of AKT/mTOR/P70S6K signaling pathways and independent of reactive oxygen species (ROS) production. Sucrose activated autophagy blocked IL-1β-induced apoptosis and mRNA expression of MMP-13, COX-2 and IL-6 in human OA chondrocytes. Glucose or fructose, the two metabolites of sucrose, failed to induce autophagy indicating that autophagy was specifically mediated by sucrose. In conclusion, sucrose attenuate IL-1β induced apoptosis and the expression of catabolic mediators by inducing autophagy, and the autophagy in part was mediated through the activation of AKT/mTOR/P70S6K signaling pathway in human chondrocytes.
Keywords: Osteoarthritis, Sucrose, Autophagy, Chondrocytes
Osteoarthritis (OA), the most common joint disorder, is characterized by degradation of cartilage extracellular matrix (ECM), reduced cartilage cellularity, synovial inflammation and subchondral sclerosis [Haseeb and Haqqi, 2013]. Cartilage degradation is considered as central feature of OA and results from the imbalance between ECM production and its enzymatic degradation [Pennock et al., 2007]. Chondrocytes, the only cell type in articular cartilage, maintains the dynamic equilibrium between matrix anabolism and catabolism, however it has very low rate of cell turnover hence has limited capacity to regenerate the normal ECM architecture [Loeser, 2009]. Accumulating evidence indicates that inflammation is a critical component of disease pathogenesis [Berenbaum, 2013; Sokolove and Lepus, 2013]. The cartilage degradation in OA is always accompanied by activation of catabolic pathways and increased apoptosis of articular chondrocytes [Goldring, 2012; Heraud et al., 2000; Ryu et al., 2012; Yang et al., 2010]. Pharmaceutical and dietary strategies have targeted the inflammatory components and studies using pharmacologic inhibitors and anti-inflammatory drugs demonstrated beneficial effects in preclinical studies in OA but failed to show efficacy in clinical trials [Hellio Le Graverand-Gastineau, 2009]. Many natural products with desirable pharmacological properties have been suggested for the prevention or inhibition of disease progression [Akhtar and Haqqi, 2012; Mobasheri, 2012].
Autophagy is a cellular homeostasis mechanism that plays an essential role in cell survival and removal of damaged and dysfunctional macromolecules and organelles under stress and in disease [Levine and Kroemer, 2008; Mizushima et al., 2008]. Earlier studies suggest that activation of autophagy appears to be beneficial in joint disease and protect against the development of OA [Lotz and Carames, 2011]. Recent studies demonstrate that compromised autophagy is accompanied by an increased apoptosis of chondrocytes and contribute to the development of OA, whereas pharmacologic activation of autophagy showed protective response against matrix degradation and cartilage homeostasis in human cartilage explants in vitro and in surgically induced OA in mice [Carames et al., 2012; Carames et al., 2013; Carames et al., 2010]. Additionally, reduced expression of various autophagy regulators in human and experimental model of OA and modulation of OA like gene expression by autophagy induction suggest that activation of autophagy in articular chondrocytes may have chondroprotective and beneficial effects in OA [Carames et al., 2013; Sasaki et al., 2012]. Although, several autophagic activators such as rapamycin were used for studies in OA models, drug toxicity and potential adverse events are major concerns for long-term therapy in the treatment of OA [Carames et al., 2013].
Sucrose, a natural occurring disaccharide found in several plants has earlier been shown to upregulate the gene expression and activity of lysosomal enzyme and accumulation of lysosomes associated vaccoules in cultured mammalian cells [Helip-Wooley and Thoene, 2004; DeCourcy and Storrie, 1991; Karageorgos et al., 1997]. Furthermore, in recent studies demonstrated that sucrose treatment induced vesicle formation in lysosomes and activate autophagy in mouse embryonic fibroblast cells and HaCaT human keratinocytes [Higuchi et al., 2015; Xu Chen et al., 2016]. However, studies concerning the effect of sucrose in human OA and in chondrocytes, the cell type most directly affected, are lacking. In the present study, we investigated whether sucrose induce autophagy in human OA chondrocytes and whether sucrose mediated induction of autophagy was chondroprotective in vitro. Our results demonstrate that sucrose induced active autophagy via AKT/mTOR/P70S6K pathways and activation of autophagy suppressed apoptosis in human OA chondrocytes under pathological conditions. We also demonstrate for the first time that sucrose activated autophagy inhibited IL-1β-induced expression of inflammatory mediators in human OA chondrocytes.
Materials and Methods
Reagents
Dulbecco's modified Eagle's medium (DMEM)/Nutrient Mixture F-12 (DMEM/F-12) media and other reagents for cell culture were purchased from HyClone Laboratories (Logan, UT, USA). Pronase, Collagenase and Complete Protease inhibitor tablets were from Roche Diagnostics (Indianapolis, IN, USA). Recombinant human IL-1β was from R&D Systems. Antibodies specific for LC3 and Beclin-1 were purchased from Cell Signaling Technology (Danvers, MA) and anti-β-Actin and anti-Bax antibodies were from Santa Cruz Biotechnology (Santa Cruz, CA, USA). Sucrose, Glucose, Fructose, Chloroquine, Bafilomycin, Ammonium chloride, 3-Methyl adenine (3-MA) were purchased from Fischer Scientific (USA). Propidium iodide (PI) was obtained from Sigma Aldrich (USA).
Preparation of primary human chondrocytes
The study protocol to use de-identified, discarded human cartilage samples was reviewed and approved by the Institutional Review Board of North East Ohio Medical University, Rootstown, OH and SUMMA Health Systems, Akron, OH. Human cartilage samples were obtained from the knee joints of OA patients aged 45–72 years who underwent total joint arthroplasty at Summa St. Thomas Hospital, Akron, OH. OA chondrocytes were prepared by enzymatic digestion as previously described [Haseeb et al., 2013; Haseeb et al., 2014]. OA cartilage was examined for histopathology grading according to Mankin scoring system [Mankin HJ et al., 1971]. In this system the scores are defined as follows: 0=Normal, 1= Superficial fibrillation, 2= Pannus and superficial fibrillation, 3= Fissures to the middle zone, 4= Fissures to the deep zone and 5= Fissures to the calcified zone. We have used OA cartilage with Mankin score of 1 for the preparation chondrocytes in the present study. To maintain the chondrogenic phenotypes, chondrocytes were seeded at high density (1×10⁶/ well of 6-well plate). Further to confirm the phenotype, the chondrocytes phenotype marker such as COL2A1, ACAN and COL10A1 mRNA expression were analyzed and the real time PCR data showed that COL2A1 and ACAN were highly expressed while the expression of COL10A1 was low showing that the chondrocyte’s phenotype was maintained at the time of analyses (Supplementary Fig.1).
Treatment of Primary human OA chondrocytes with sucrose or glucose/ Fructose and IL-1β
Primary human OA chondrocytes (1×10⁶/ well of 6-well plate) were seeded in Dulbecco's modified Eagle's medium (DMEM)/Nutrient Mixture F-12 (DMEM/F-12) supplemented with 10% fetal calf serum (FCS), 100 units/ml penicillin, and 100 mg/ml streptomycin for 2–3 days after plating. When 80% confluent, OA chondrocytes were treated with different concentrations of sucrose (10–100mM) or glucose (100mM) or fructose (100mM) for 24h or indicated time intervals. For inhibitor studies, chondrocytes were treated with 3-MA (5mM) or Bafilomycin (100nM), or Chloroquine (25µM) or Ammonium Chloride (25mM) for 1h, followed by treatment with sucrose (100mM) for 2h and then treated with IL-1β (10ng/ml). Untreated chondrocytes served as control.
Reactive oxygen species (ROS) measurement
OA chondrocytes (0.5×10⁶/well of 12-well plate) were incubated with H2-DCFDA (200µM) or DHR123 (5µM) for 0.5h, followed by treatment with sucrose (100mM) for indicated time in serum free DMEM. Cells were then washed with 1X-PBS and single cell suspension was prepared by treatment of chondrocytes with 1X-PBS supplemented with EDTA (1mM). ROS generation was measured using BD Accuri C6 Flowcytometer. A total of 20,000 cells were acquired and ROS levels were estimated by analyzing DCF or DHR123 positive cells using FlowJo software.
Cell viability assay
After pretreatment of OA chondrocytes (6×10³/well) with sucrose (100mM, 2h) followed by treatment with IL-1β for 24h, chondrocytes were incubated with 20µl of 0.5% MTT for 4h. The supernatant was removed and 150µl of DMSO was added. Absorbance at 570nm was measured using the Synergy reader (Bio-Tek instruments, USA).
Estimation of apoptosis by PI staining
Chondrocytes (1×10⁶/ well of 6-well plate) were pretreated with sucrose (100mM) for 2h followed by treatment with IL-1β for 24h in DMEM supplemented with 10% FCS in 5% CO2 atmosphere. These cells were washed with 10mM PBS and incubated with 1ml staining solution containing 0.5µg/ml PI, 0.1% sodium citrate, and 0.1% Triton X-100 overnight at 4°C. A total of 20,000 cells were acquired in BDAccuri C6 Flowcytometer and percent apoptotic cells were determined by analyzing a sub-G1 population (<2 n DNA content) using FlowJo software.
LC3 turnover assay
The estimation of autophagic flux is important to distinguish increased autophagosome formation from impaired degradation. To measure autophagic flux, cells were incubated with sucrose in the presence or absence of the inhibitor Bafilomycin A1 or Chloroquine or Ammonium Chloride to prevent lysosomal acidification, followed by Western blot analyses using LC3 antibody.
Total RNA isolation and real time PCR
Chondrocytes (1×10⁶/well of 6-well plate) were pretreated with sucrose for 2h followed by treatment with IL-1β (10ng/ml) for 24h. Total RNA from isolated chondrocytes was prepared essentially as previously described [Haseeb et al., 2013]. For mRNA expression analysis cDNA was synthesized from 1µg of total RNA using high-capacity cDNA reverse transcription kit (Life Technologies) and mRNA expression of MMP13, IL-6 and COX-2 was quantified using TaqMan Gene Expression Assays as previously described [Haseeb et al., 2013]. Relative expression levels were calculated using the 2−ΔΔCT method [Livak and Schmittgen, 2001].
GFP–LC3 transfection and confocal microscopy
Briefly, 4×10⁶ OA chondrocytes were cultured into 10 cm culture dishes for three days and digested with pronase and collagenase. Chondrocytes were transfected with GFP-LC3 plasmid using Amaxa Nucleofactor System (Lonza AG, Walkersville, MD) according to the manufacturer’s instructions. Plasmid was diluted in 100µlnucleofactor solution Rl and chondrocytes were transfected using P01 program, transferred to complete medium and seeded in 8-chamber slides for 48h, followed by treatment with sucrose (100mM) for next 24h at 37°C. Cells were then washed with1X PBS and fixed with 4% formaldehyde. LC3 puncta formation was analyzed by imaging with an Olympus FV1000 confocal microscope using a 60X oil immersion lens.
Western Immunoblotting
After treatments, OA chondrocytes were harvested, washed with cold PBS and lysed in ice-cold protein lysis buffer (50 mMTris pH 7.6, 400 mMNaCl, 0.5% NP-40, 1 mM PMSF and 1X protease inhibitor cocktail (Roche) as described previously[Haseeb et al., 2013]. Lysates were centrifuged (15000g for 15 min at 4°C) and the supernatant was used for estimation of protein. Equivalent amounts of lysate protein (20µg) were resolved by 12% SDS–PAGE and transferred to a PVDF membrane (Bio-Rad, USA) and the blots were incubated with diluted anti-LC3 (1:1000), or anti-Beclin-1 (1:1000) or anti-β-Actin (1:2000) primary antibodies in TBST overnight at 4°C. Blots were then incubated with horse radish peroxidase-conjugated secondary antibody and the antibody reactive proteins were visualized and analyzed using the Syngene Pxi imager and the Syngene Image analysis software respectively.
Statistical Analyses
The values are presented as the Mean±SD and the statistically significant difference between the experimental groups and controls was determined using Student’s t-test. Each experiment was repeated three times using three independent samples. P<0.05 was considered to be statistically significant.
Results
Sucrose was not toxic to human OA chondrocytes
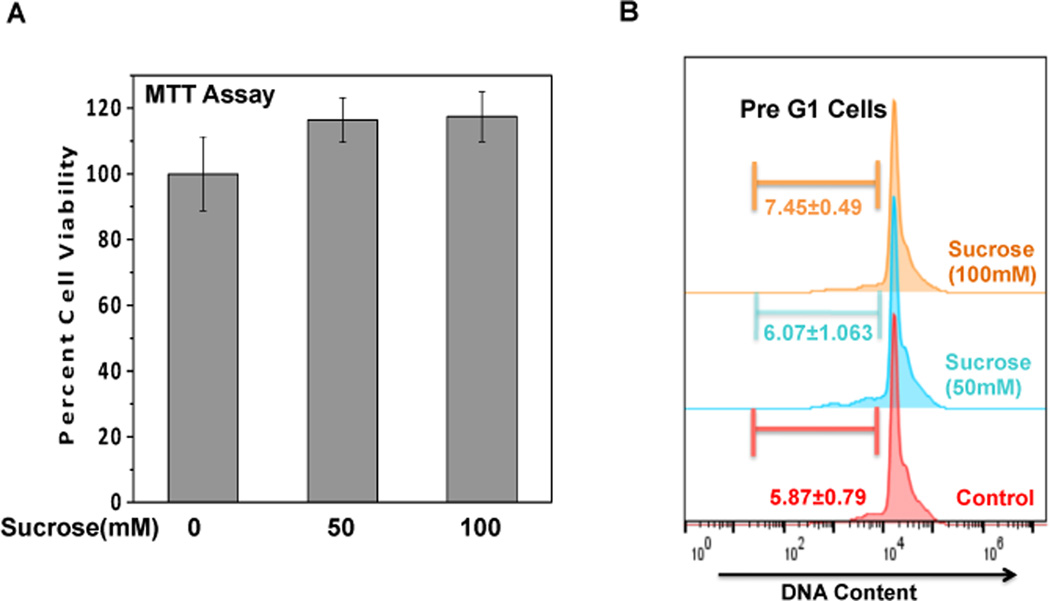
We first examined the potential cytotoxic effect of sucrose concentrations on human OA chondrocytes. Compared with untreated control, treatment of OA chondrocytes with sucrose (50–100mM, 24h) had no effect on cell viability (Fig. 1A). Further, absence of cytotoxic effect of sucrose was confirmed by PI staining and flowcytometric histograms of PI stained cells as shown in Fig.1B revealed that OA chondrocytes incubated with sucrose (100mM) for 24h did not show any increase in apoptosis (pre-G1 peak) compared to untreated control chondrocytes.
Fig. 1. Sucrose is not toxic to human OA chondrocytes.
(A) Human OA chondrocytes were treated with or without indicated concentration of sucrose for 24h and cells viability were analyzed using MTT assays with viability expressed relative to untreated control cells. Values are mean±SD (n=3). (B) Flow cytometric histograms of chondrocytes treated in presence or absence of sucrose and stained with PI. Cells were harvested at 24h of incubation and stained with PI. Twenty thousand cells in each group were acquired using a flowcytometer. The Sub-G1 region represents the percentage of cells undergoing apoptosis.
Sucrose induced autophagy in OA chondrocytes
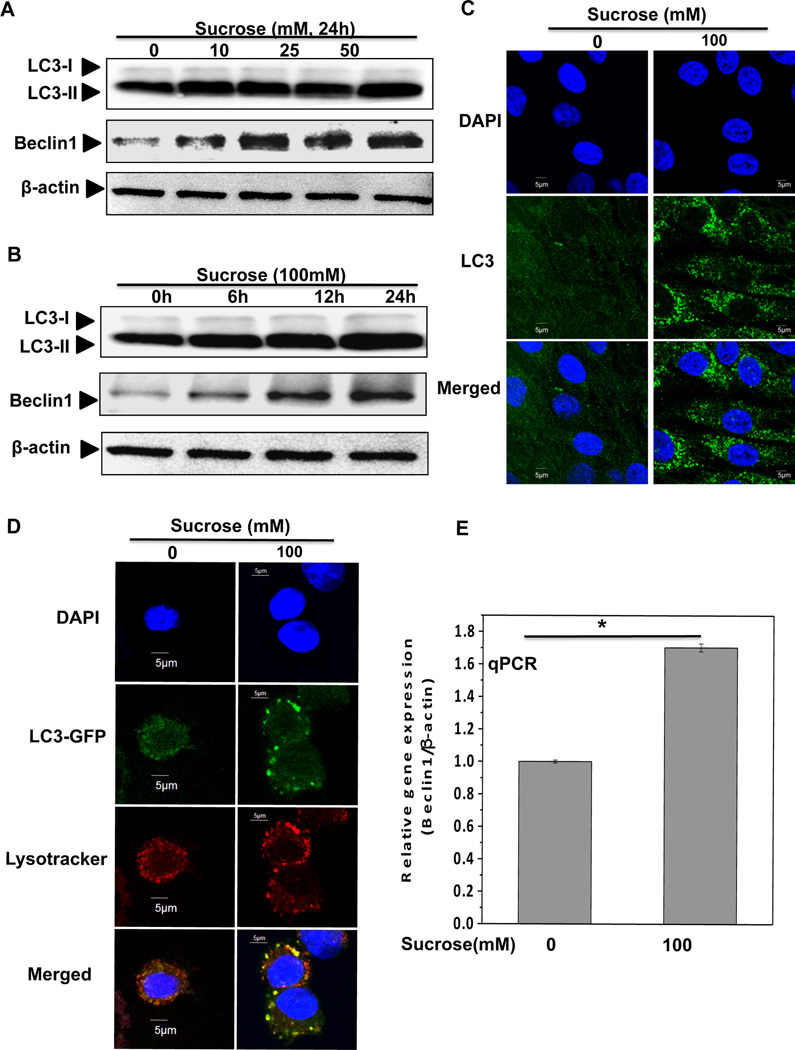
To test whether sucrose activate autophagy in human OA chondrocytes, we investigated the expression of LC3 and Beclin-1. LC3 consists of LC3-I and LC3-II, and upon autophagy activation LC3-I converts into LC3-II through lipidation and adheres to the membrane of phagophore for the formation of autophagosome, therefore, conversion of LC3-I into LC3-II is considered as a marker of autophagy activation and autophagosome formation [Mizushima et al., 2010]. Western blot analysis indicated a dose and time dependent increase in the LC3-II expression (Figure 2A–B). Immunofluorescence staining and confocal microscopy showed that sucrose treatment resulted in increased bright LC3 puncta compared with untreated control chondrocytes (Figure 2C). In additional studies, we transfected OA chondrocytes with green fluorescence protein (GFP)–LC3 expression plasmid and then cultured them in the presence or absence of sucrose (100mM) for 24h and analyzed using confocal microscopy. The GFP–LC3 containing puncta were clearly defined and the number was greatly increased in OA chondrocytes treated with sucrose, whereas GFP–LC3 containing puncta in control chondrocytes were diffused and fewer in number (Fig. 2D). Furthermore, we also monitored the co-localization of autophagosomes and lysosomes by staining GFP-LC3 transfected OA chondrocytes with Lysotracker red and the results showed that in sucrose treated OA chondrocytes, red-stained lysosomes co-localized with the GFP-LC3 autophagosomes indicating active autophagy induction by sucrose treatment in human OA chondrocytes (Fig. 2D).
Fig. 2. Sucrose induced autophagy in OA chondrocytes.
(A) The expression of LC3-II and beclin-1 increased in a dosage dependent manner. Human OA chondrocytes were treated with 0, 10, 25, 50 and 100mM of sucrose for 24 h. LC3-II was measured by Western blotting. (B) LC3-II and beclin-1 increased in a time dependent manner. Chondrocytes were treated with 100mM sucrose for 0, 6, 12 and 24h. (C) LC3-II puncta increased after sucrose treatment. LC3 immunostaining in chondrocytes was performed at 24h after sucrose treatment (100mM). Significant increased green bright puncta showed the formation of autophagosome. (D) LC3 immunostaining in GFP-LC3 transfected chondrocytes treated with or without sucrose (100mM) for 24h and LC3-II puncta were visualized by confocal microscopy. (E) The mRNA expression of beclin-1 was up-regulated in sucrose treated chondrocytes (100mM, 24h). At the end of treatment chondrocytes were harvested, total RNA were isolated and mRNA expression were quantified using sybergreen qPCR assay. Expression of β-actin was used as endogenous expression control. *P≤ 0.05 compared control group, n=3
Beclin-1 is a major regulator of the autophagy pathway and forms a complex with type III phosphatidyl-inositol 3-kinase and allows nucleation of the autophagic vesicle [Carames et al., 2010]. Immunoblot analyses showed that sucrose treatment resulted in significantly increased Beclin-1expression in a dose and time dependent manner (Fig. 2A–B). Additionally, TaqMan analyses showed that the expression of Beclin-1mRNA was significantly increased in OA chondrocytes treated with sucrose (100mM, 24h) compared with untreated OA chondrocytes (Fig. 2E). Taken together, these results suggest that treatment of human OA chondrocytes with sucrose results in induction of active autophagy.
To examine whether induction of autophagy in OA chondrocytes was due to sucrose itself or by its metabolites-glucose and fructose, we measured cellular uptake and metabolism of sucrose in OA chondrocytes. It was found that sucrose uptake increased in a time dependent manner and no significant change were observed in the level of free glucose indicating that sucrose is not metabolized in OA chondrocytes (Supplementary Fig. 2A). Furthermore, Western blot analyses showed that treatment of OA chondrocytes with glucose or fructose did not induce autophagy in OA chondrocytes (Supplementary Fig. 2B). These results suggest that induction of autophagy in OA chondrocytes was due to sucrose and not by its metabolites.
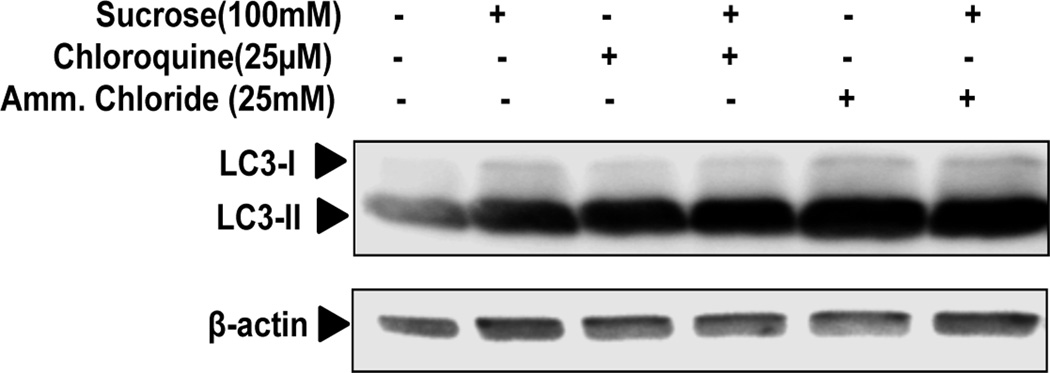
To determine whether sucrose mediated increased autophagic activity in OA chondrocytes, as detected by LC3-II expression, represents either increased autophagosome generation or inhibition of autophagosome and lysosomal fusion as a result of reduced turnover of autophagosomes. We investigated the effect of sucrose on autophagic flux using LC3 turnover assay. We treated OA chondrocytes with sucrose (100mM) in the presence or absence of Chloroquine or Ammonium Chloride (both are inhibitors of lysosomal acidification) for 24h and LC3-II expression was analyzed. As shown in Fig.3 autophagy inhibitors increased the LC3-II expression in the absence of sucrose, suggesting basal activation of autophagy in OA chondrocytes. When sucrose was added in the presence of Chloroquine or Ammonium Chloride, LC3-II levels further increased in OA chondrocytes as compared with control culture treated with sucrose (Fig. 3). These results thus indicated that sucrose enhances autophagy flux in human OA chondrocytes.
Fig. 3. Sucrose induced autophagic flux in human OA chondrocytes.
Human OA chondrocytes were left untreated or were treated with 100mM sucrose for 24h, with or without chloroquine or ammonium chloride. LC3-II was measured by Western blotting. Values are the mean± SD of 2 individual experiments.
Sucrose-induced autophagy was independent of ROS
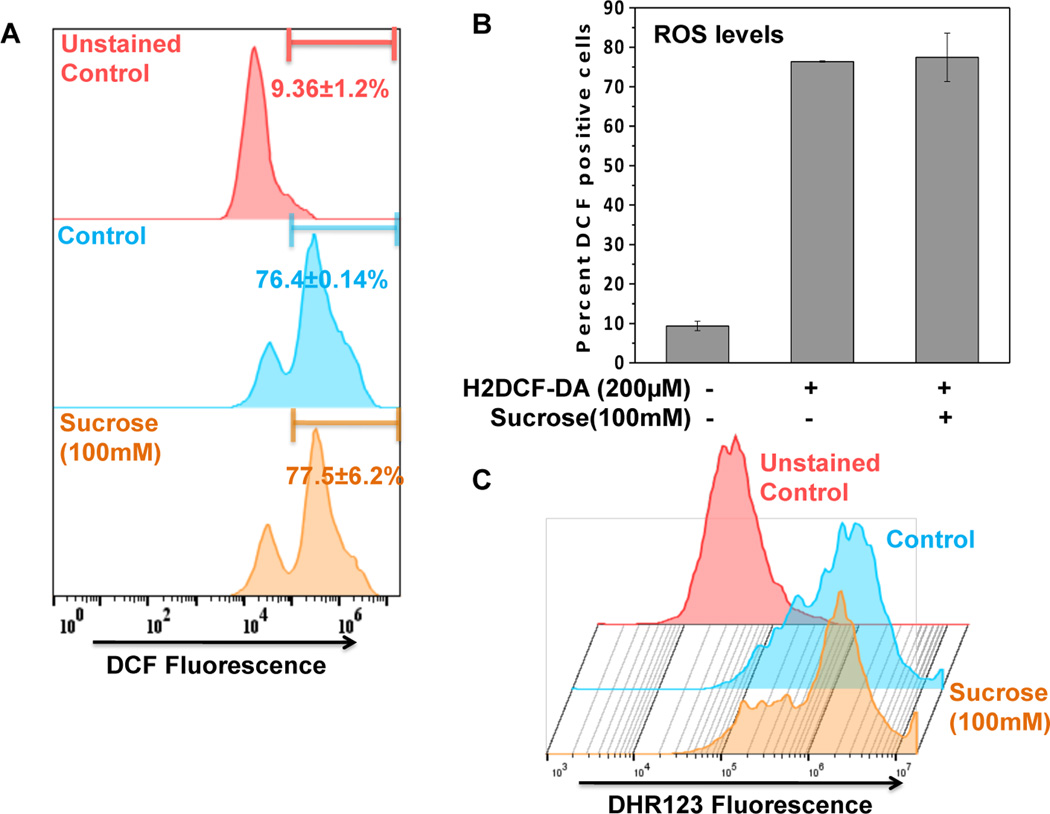
The basic underlying mechanism of autophagy induction is the generation of ROS which is essential for the initiation of autophagic flux [Scherz-Shouval et al., 2007]. Therefore, to confirm whether ROS is involved in the sucrose-induced autophagy, we monitored the ROS production in sucrose treated OA chondrocytes. Flowcytometric analysis of H2-DCFDA stained OA chondrocytes revealed that ROS levels did not change significantly in sucrose treated OA chondrocytes compared tountreated controls (Fig. 4A–B). The result was further confirmed by DHR123 staining of chondrocytes for measuring the mitochondrial ROS generation known to play a major role in autophagy induction [Wang et al., 2012]. Flowcytometric analysis of DHR123 stained chondrocytes showed absence of ROS production in sucrose treated cells indicating that sucrose mediated autophagy induction was independent of mitochondrial ROS production in human OA chondrocytes (Fig. 4C).
Fig. 4. Sucrose induced autophagy was independent of ROS.
(A-B) DCFH2-DA (200µM, 0.5h) stained chondrocytes were treated with sucrose for 0.5 h at 37°C and twenty thousand cells in each group were acquired using a flowcytometer. Flow cytometric histograms (A) and corresponding bar graph showing DCF+ve cells were analyzed using FlowJo software. (C) DHR123 staining (5µM, 0.5h) staining was performed to estimate mitochondrial ROS levels induced by treatment with sucrose (100mM, 0.5h). Flow cytometric histograms showing DHR+ve cells were analyzed using FlowJo software.
Sucrose induced autophagy via activation of AKT/mTOR/P70S6K pathways in OA chondrocytes
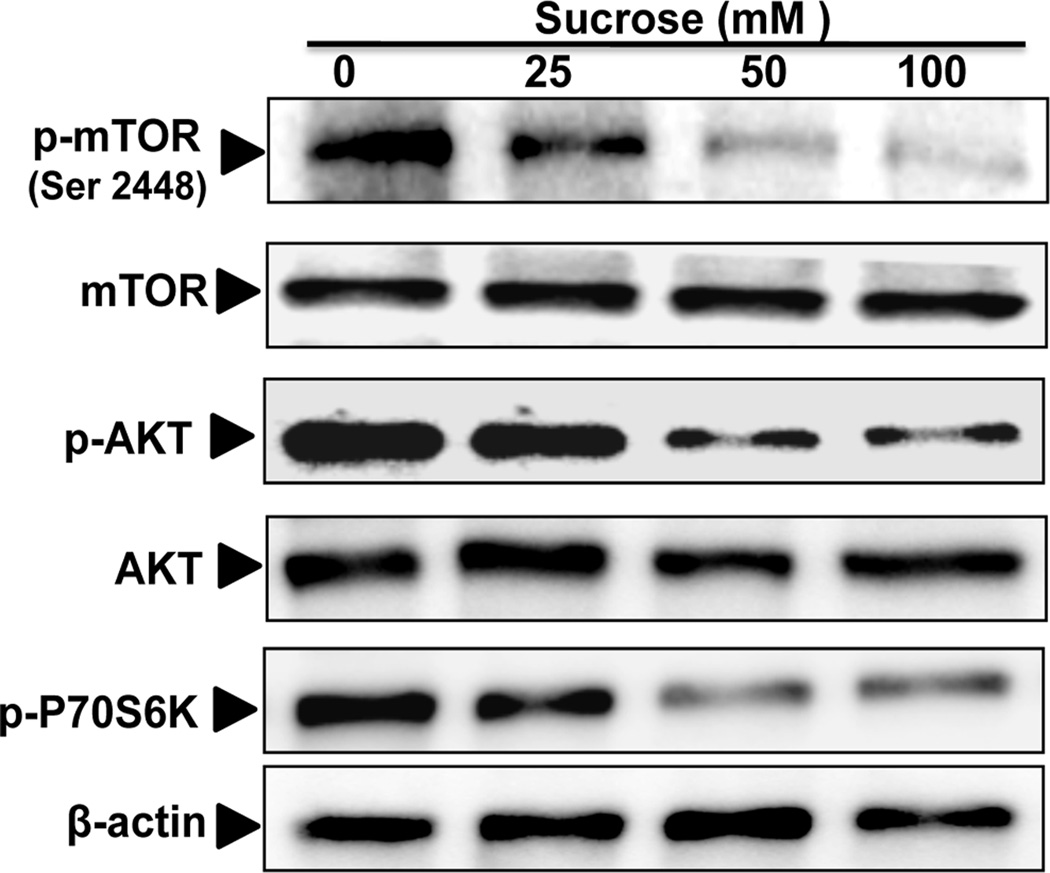
To investigate the molecular mechanism of autophagy induction by sucrose, we examined the activation of mTOR signaling pathway in sucrose treated OA chondrocytes. Our results demonstrated that sucrose treatment inhibited the phosphorylation of mTOR (Ser 2448) and ribosomal protein S6 Kinase, a direct and downstream target of mTOR (Fig. 5). To address how mTOR is regulated by sucrose, we examined the phosphorylation of upstream regulator of mTOR and it was found that sucrose inhibited the phosphorylation of AKT (Ser473)(Fig. 5) which is known to regulate mTOR signaling [Kim and Guan, 2015]. These results suggested that sucrose mediated induction of autophagy was associated with the inhibition of mTOR signaling in OA chondrocytes.
Fig. 5. Sucrose induced autophagy via activation of AKT/mTOR pathways.
The phosphorylation of mTOR (Ser2448), AKT(Ser473) and P-70S6K was downregulated by sucrose treatment in a dosage dependent manner. Human OA chondrocytes were treated with 0, 25, 50 and 100mM of sucrose for 24 h and whole cell lysate were prepared and phosphorylation of mTOR, AKT and P-70S6K was measured by Western blotting.
Sucrose inhibited the IL-1β induced apoptosis in human OA chondrocytes
Functional interplay exists between autophagy and apoptosis under various stress conditions and it has been reported that autophagy suppresses apoptosis by inhibiting the activity of apoptotic proteins [Marino et al., 2014; Mukhopadhyay et al., 2014]. Cartilage degradation in OA is primarily attributed to increased expression of catabolic cytokines, like IL-1β, that mediate the induction of chondrocyte’s apoptosis and the enhanced expression of matrix degrading proteases resulting in loss of cartilage cellularity and cartilage matrix degradation in OA joints [Goldring, 2000; Hui et al., 2016]. Therefore to mimic OA condition, IL-1β was used to induce chondrocytes apoptosis in vitro.
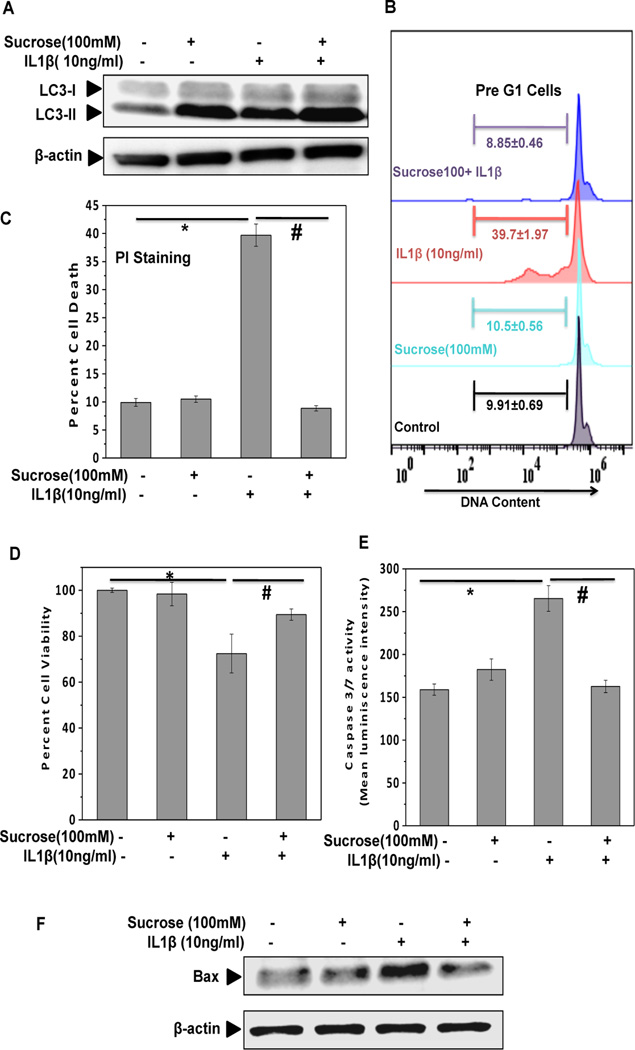
We first examined whether sucrose treatment induced autophagy in OA chondrocytes treated with IL-1β. Western blot analysis showed that sucrose treatment up-regulated the expression of LC3-II in human OA chondrocytes treated with IL-1β suggesting that sucrose induce active autophagy in articular chondrocytes under pathological conditions (Fig. 6A). Further analyses using PI staining demonstrated that pathological condition-induced chondrocyte apoptosis was significantly inhibited by treatment with sucrose (Fig. 6B–C). MTT assay also confirmed the protective effect of sucrose on OA chondrocytes viability under pathological conditions (Fig. 6D). We also evaluated changes in the levels of apoptotic markers and found that IL-1β induced activation of caspase 3/7 and expression of pro-apoptotic protein Bax was significantly down-regulated in IL-1β-stimulated OA chondrocytes treated with sucrose (Fig. 6E–F). Taken together these results suggest that sucrose exerts anti-apoptotic effectsin OA chondrocytes under pathological conditions.
Fig. 6. Sucrose inhibit IL-1β induced apoptosis by in human OA chondrocytes.
(A) Chondrocytes were treated with IL-1β (10ng/ml) in presence and absence of sucrose (100mM) for 24h. The expression of LC3-II slightly increased after IL-1β treatment, while it dramatically up-regulated in sucrose+IL-1β group. (B-C) Sucrose pretreatment protects chondrocytes apoptosis induced by IL-1β (10ng/ml, 48 h). Flow cytometric histograms and corresponding bar graph of sucrose treated cells stimulated with IL-1β. Cells were harvested at end of 48 h and stained with PI. Twenty thousand cells in each group were acquired using a flowcytometer. The Sub-G1 region represents the percentage of cells undergoing apoptosis. Each bar shows the mean±SD from two replicates, and two such independent experiments were carried out. *p≤0.05, compared to control, and #p≤0.05, compared to IL-1β treated group.(D)The findings of (B-C) were confirmed by the data of MTT assay. Viability was expressed relative to untreated control cells. *p≤0.05, compared to control, and #p≤0.05, compared to IL-1β treated group. Values are mean±SD (n=3).(E) Sucrose pretreatment inhibits caspases activation by IL-1β in chondrocytes. Activation of caspase-3/7 in response to IL-1β treatment was detected by luminescence measurement using caspase-glo 3/7 assay. *p≤0.05, compared to control, and #p≤0.05, compared to IL-1β treated group. Values are mean±SD (n=3). (F) Sucrose pretreatment suppresses the activation of pro-apoptotic protein in response to IL-1β in chondrocytes. Chondrocytes were treated with IL-1β (10ng/ml) in presence and absence of sucrose (100mM) for 24h and expression of Bax was measured by Western blotting.
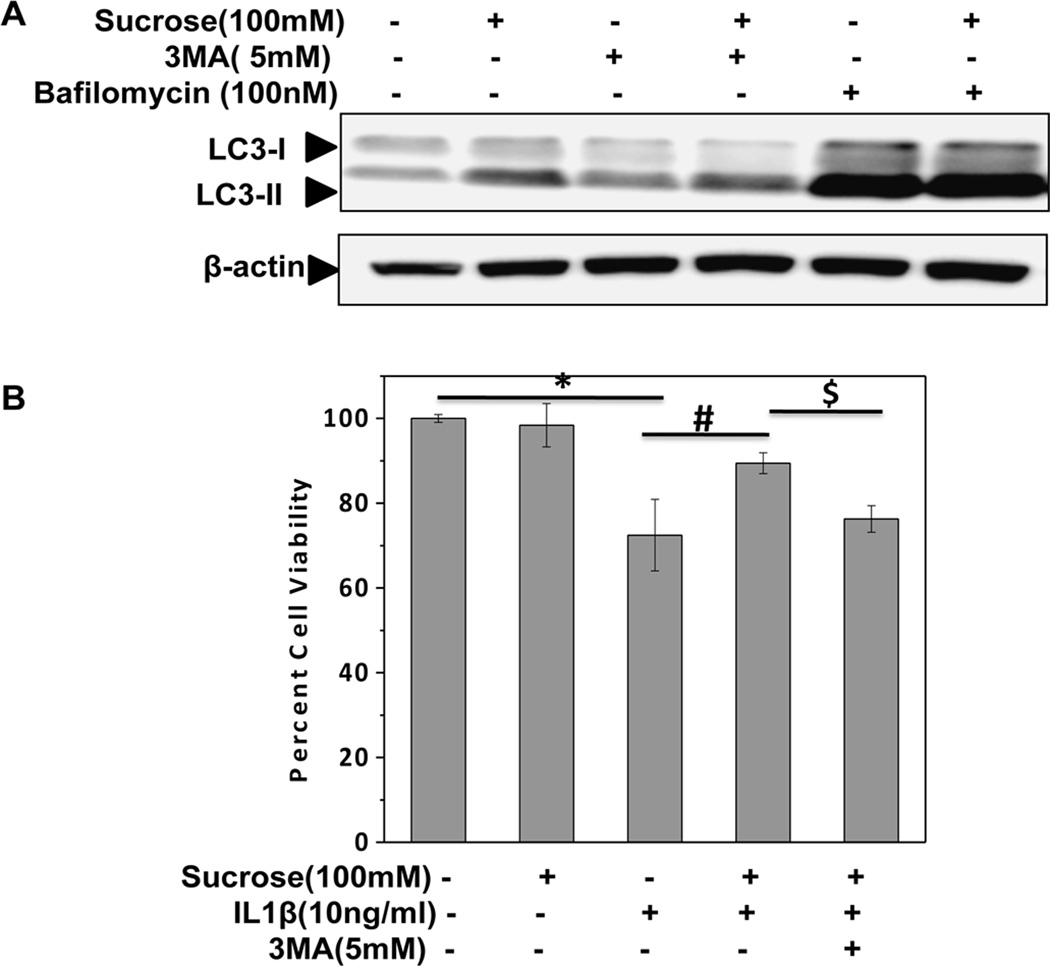
To determine whether the observed cytoprotective effect of sucrose was due to autophagy activation, Bafilomycin A1 and 3-methyl Adenine (3-MA) were used to inhibit autophagy. Bafilomycin A1 is a known inhibitor of late phase of autophagy which prevents maturation of autophagic vacuoles by inhibiting fusion between autophagosome and lysosome resulting in an accumulation of LC3-II [Carames et al., 2013]. 3-MA is a potent and specific phosphatidyl-inositol 3-kinase class III (PI3-K) inhibitor and inhibits autophagy at the initial stage resulting in decreased LC3-II level [Wu et al., 2010]. As shown in Figures 7A, treatment with Bafilomycin increased the expression of LC3-II in sucrose-treated OA chondrocytes whereas 3-MA exhibited opposite effects (Fig. 7A). Additionally, MTT assay revealed that sucrose-mediated protection of chondrocytes viability under pathological condition was significantly abrogated by pretreatment with 3-MA (Fig.7B). Taken together these results revealed that anti-apoptotic effects of sucrose were mediated by induction of autophagy in human OA chondrocytes.
Fig. 7. Sucrose exert anti-apoptotic effects via induction of autophagy in human OA chondrocytes.
(A) Bafilomycin (100nM) or 3-MA (5mM) was used to inhibit chondrocytes autophagy which was induced by sucrose (100mM). The expression of LC3-II drastically increased in sucrose+bafilomycin group, while it decreased in sucrose+3-MA group. (B) Inhibition of sucrose induced autophagy abolished its cytoprotective effects in preventing chondrocyte apoptosis. Chondrocytes viability decreased after the inhibition of sucrose induced autophagy by pretreatment with 3-MA. The cell viability was determined by MTT assay.*p≤0.05, compared to control, #p≤0.05, compared to IL-1β group and $p≤0.05, compared to sucrose+ IL-1β group. Values are represented as mean±SD (n=3).
Sucrose inhibited the expression of catabolic molecules in OA chondrocytes under pathological conditions
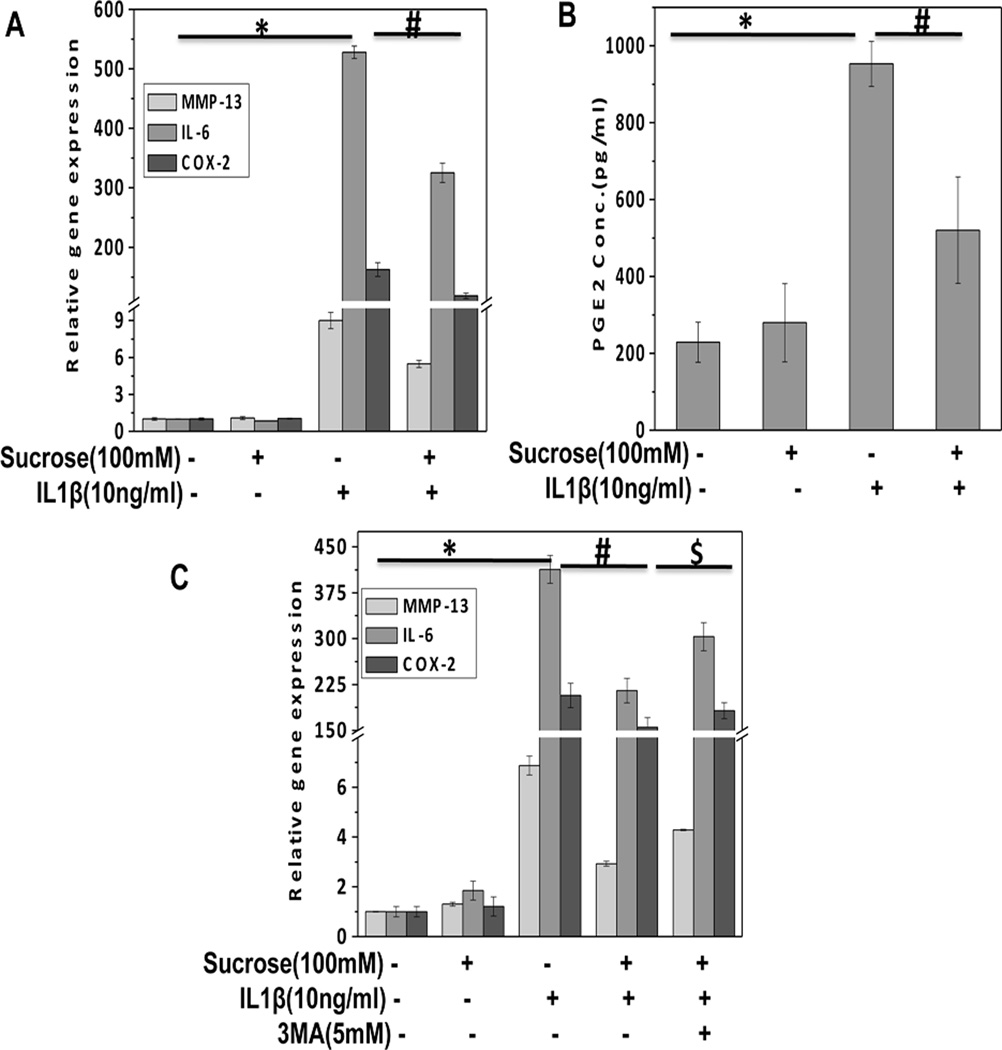
In OA, cartilage matrix degeneration is mediated by IL-1β-induced expression of matrix degrading proteases that are involved in the degradation of cartilage collagens and proteoglycans. Type II collagen, a major component of the extracellular matrix is degraded by MMP-13 which is highly induced by IL-1β in OA [Akhtar et al., 2011]. TaqMan analysis revealed that sucrose treatment significantly inhibited the expression of MMP-13 induced by IL-1β in OA chondrocytes (Fig. 8A). Furthermore, stimulation with IL-1β results in up-regulation of interleukin-6 (IL-6) and Cyclooxygenase-2 (COX-2) in chondrocytes which lead to up-regulation of inflammatory and apoptotic response that probably contributes to pathogenesis of OA. Sucrose pretreatment of OA chondrocytes significantly inhibited the IL-1β induced expression of IL-6 and COX-2 (Fig. 8A). We also measured the production of PGE2, an enzymatic product of COX-2 in culture supernatant and it was found that sucrose effectively suppressed IL-1β-induced PGE2 production in OA chondrocytes (Fig. 8B). To determine, if the observed inhibition of catabolic mediators was due to activation of autophagy, OA chondrocytes were treated with autophagy inhibitor 3-MA and then stimulated with IL-1β. TaqMan analysis of MMP-13, IL-6 and COX-2 gene expression showed that sucrose mediated suppression of catabolic gene expression was significantly abrogated by pretreatment with 3-MA (Fig. 8C). Taken together these results indicate that sucrose exerts chondroprotective effect through the activation of autophagy.
Fig. 8. Sucrose inhibited the expression of catabolic molecules in human OA chondrocytes.
(A) Human OA chondrocytes were pretreated with or without sucrose (100mM) for 2h and then stimulated in the absence or presence of IL-1β (10ng/ml) for 24h. At the end of treatment chondrocytes were harvested, total RNA were isolated treated and mRNA expression were quantified using TaqMan assay. Expression of β-actin was used as endogenous expression control. (B). Sucrose inhibited the production of PGE2 in response to IL-1β (10ng/ml) as measured by ELISA in the culture supernatant of sucrose treated OA chondrocytes. (C) Inhibition of sucrose induced autophagy by pretreatment with 3-MA significantly abrogated sucrose mediated suppression of MMP-13, IL-6 and COX-2 in OA chondrocytes.*P≤ 0.05 compared to control group, #p≤0.05, compared to IL-1β group, $p≤0.05, compared to sucrose+ IL-1β group. n=3
Discussion
Disruption of the articular cartilage matrix and reduced cartilage cellularity are major histologic features of OA. Chondrocyte is the only resident cells found in articular cartilage and have poor ability of cartilage repair in adult [Goldring, 2012]. Chondrocytes are responsible for anabolism and catabolism balance of ECM, which resists load and reduces friction force in joints. Present study was designed to investigate effect of sucrose treatment on induction of autophagy in human OA chondrocytes and to examine the chondroprotective effects of sucrose in cellular system. It was found that sucrose activate macroautophagy that involve the formation of double-membrane vesicle-autophagosomes in OA chondrocytes in a dose and time dependent manner as demonstrated by increased expression of LC3-II, elevated numbers of LC3-II puncta revealed by immunoflurescence staining and increased autophagy flux (Fig.2A–D and Fig. 3). Since sucrose is metabolized into its monomeric units-glucose and fructose by enzymatic action of invertase and hydrolase, therefore to confirm whether autophagy induction observed here was due to sucrose or by its metabolites, we studied the uptake and metabolism of sucrose in chondrocytes. It was found that no significant change were observed in the level of free glucose after incubation of sucrose for various time indicating that sucrose is not metabolized in OA chondrocytes. Furthermore, absence of autophagy induction by glucose or fructose treatment to chondrocytes confirmed that autophagy induction in OA chondrocytes was due to sucrose and not by its metabolites. An earlier study using cultured mammalian cells showed that glucose induces autophagy by inhibition of mTOR signaling [Ravikumar B et al., 2002]. However, in OA chondrocytes, glucose treatment did not induce autophagy. These differences might be attributed to various reasons including the differences in cell type, genetics, culture conditions, dose-response of glucose etc.
Our data revealed that sucrose mediated autophagy induction was mainly dependent on the activation of AKT/mTOR/P-70S6K signaling pathways (Fig. 5). Furthermore, chondrocyte apoptosis under pathological condition was significantly decreased after sucrose treatment, whereas anti-apoptotic effect of sucrose was abrogated by inhibition of autophagy suggesting that protective effect of sucrose was mediated via activation of autophagy (Fig. 6B–F and Fig. 7B). Additionally, sucrose mediated autophagy inhibited the mRNA expression of MMP-13, COX-2 and IL-6 and production of PGE2 in human OA chondrocytes stimulated with IL-1β suggesting that activation of autophagy was crucial in exerting the chondroprotective effects (Fig.8A–C).
In OA, production of high levels of pro-inflammatory molecules such as MMP-13, IL-1β and TNF-α in joints results in chondrocytes apoptosis and matrix degradation, a hallmark of OA. Currently, intra-articular injections of glucocorticoids and hyaluronic acid and symptom modifying drugs are not capable of reversing the pathophysiological progression of OA [Gerwin et al., 2006]. Therefore, development of novel therapeutic agents targeting the apoptotic and catabolic phenotypes of OA chondrocytes and characterization of novel pathways that can suppress disease progression is of importance for the effective management of OA.
In the recent past, autophagy has gained interest due to its role in the regulation of the aging process and pathogenesis of various diseases. Autophagy has been characterized as a highly regulated cellular mechanism with both beneficial and pathogenic effects [Dwivedi and Ahnn, 2009]. Autophagy is an essential cellular homeostasis mechanism that removes dysfunctional organelles and macromolecules and manifestations of autophagy defects are cell dysfunction, whereas pharmacologic augmentation of autophagy protects against cell dysfunction and disease. Recent studies provide evidence that autophagy protects against diverse pathologies, such as neurodegeneration, heart diseases, infections, cancer, and aging [Levine and Kroemer, 2008]. Rapamycin, a well-known mTORC-1 inhibitor can lead to autophagy activation in human chondrocytes[Carames et al., 2012]. In surgically induced mice model of OA, rapamycin reduced the severity of joint pathology suggesting that autophagy activation has protective effects against cartilage degradation [Carames et al., 2012]. These observations led us to investigate whether autophagy activation by sucrose treatment showed protective effect against chondrocytes apoptosis.
Our results demonstrated that sucrose is an autophagy inducer in human OA chondrocytes at least in vitro and sucrose-induced autophagy blocked the IL-1β-mediated production of inflammatory and catabolic molecule and thus may be a potential agent for the management of OA. ROS is stress inducer and has been regarded as a common signaling molecule for autophagy induction. However, sucrose treatment did not promote the generation of ROS, suggesting no induction of cell stress in chondrocytes (Fig.4A–C). Activation of mTOR is known repressors of the autophagy pathway and rapamycin, a specific inhibitor of mTORC1 has been shown to induce autophagy in articular chondrocytes in human and in experimental mouse model [Carames et al., 2012; Lopez de Figueroa et al., 2015]. Our results showed that sucrose treatment inhibited the phosphorylation of mTOR (Ser 2448) in a dose-dependent manner suggesting that mTOR signaling pathway is a major target of sucrose in human OA chondrocytes. Since mTOR has been reported to control protein synthesis through phosphorylation of downstream p70S6K and 4E-BP1, we monitored the activity of mTORC1 by analyzing the levels of phosphorylation of S6K. As shown in Fig. 5, sucrose treatment dephosphorylated p70S6K in a dose-dependent manner in OA chondrocytes. To examine the regulation of mTOR by sucrose treatment, we investigated upstream kinase. AKT is one of the major kinase that activates mTORC1 through direct phosphorylation of tuberous sclerosis complex 2 (TSC2) thus leading to activation of mTORC1 and subsequent blockade of autophagy [Shintani and Klionsky, 2004]. Our results revealed that sucrose inhibited the phosphorylation of AKT in OA chondrocytes, thus preventing the phosphorylation of mTOR signaling and suppressing mTOR activity (Fig. 5). Accumulating evidence indicates that mTOR act as a central node of complex signaling cascades and have varieties of biological effects including autophagy induction, cell proliferation, changes in gene transcription, protein synthesis, and cell growth. Therefore, as a direct and indirect consequence of mTOR inhibition, other signaling pathways such as p70S6 kinase and PI3K/AKT signaling pathway are affected. PI3K/AKT pathway regulating mTORC1 signaling is involved in sustaining chondrocytes survival and promoting the extracellular matrix synthesis. Our data demonstrate that sucrose-mediated inhibition of mTOR also block AKT phosphorylation in OA chondrocytes and increases survival under stimulation with IL-1β. This data is in agreement with previously published data derived using a different agent [Carames et al., 2013].
In the present study, we used OA chondrocytes treated with IL-1β to test the efficacy of sucrose, as this model is characterized by the increased apoptosis and matrix degradation mimicking chondrocytes damage in OA [Goldring, 2012]. We found that treatment with IL-1β slightly increased the expression of LC3-II at 24 h, suggesting that IL-1β on its own also may induce autophagy in OA chondrocytes (Fig. 6A). This is supported by a recent study demonstrating that IL-1β mediate the induction of autophagy by translocating into a vesicle intermediate in non-macrophage cells [Zhang M et al., 2016]. Further, sucrose can enhance autophagy in IL-1β treated chondrocytes and suppress the apoptosis induced by IL-1β in OA chondrocytes (Fig. 6 A–D). This finding was also confirmed by analyzing the expression and activity of pro-apoptotic markers such as caspase 3/7 and Bax (Fig. 6E–F). Furthermore, two autophagy inhibitors (Bafilomycin and 3-MA) based on different principles were used for verifying the role of sucrose-induced autophagy. The expression pattern of LC3-II revealed that sucrose induced autophagy was blocked slightly by pretreatment with 3-MA in chondrocytes at 24h and the chondroprotective effect of sucrose was significantly abrogated by autophagy inhibition (Fig. 7A–B). Taken together, our data suggested that sucrose decreased chondrocytes apoptosis via autophagy induction.
The cartilage degradation in OA is primarily mediated by increased expression of MMPs. Our investigation showed that sucrose represses MMP-13 expression in response to IL-1β stimulus in OA chondrocytes (Fig. 8A). Pretreatment with sucrose led to a significant reduction in IL-1β induced COX-2 expression and PGE2 productions which are major inflammatory mediators that contribute to the pathogenesis of OA (Fig. 8A, B). Furthermore, induction of IL-6, an inflammatory cytokine was significantly inhibited by sucrose treatment in OA chondrocytes (Fig. 8A). These results indicate that sucrose treatment reduced overall inflammatory response in human OA chondrocytes and thereby may have the potential to exhibit chondroprotective effects in vitro. Additionally, sucrose mediated suppression of inflammatory mediators gene expression was significantly abrogated by pretreatment with autophagy inhibitor suggesting that sucrose mediated chondroprotective effect through the activation of autophagy (Fig. 8C).
In conclusion, these results revealed that sucrose treatment induced autophagy and effectively suppressed chondrocytes apoptosis and expression of pro-inflammatory cytokines and matrix degrading enzyme-MMP-13 in OA chondrocytes. Although further studies are needed to delineate the exact molecular mechanism of the observed protective response, these results for the first time demonstrate that autophagy activation by sucrose exerts protective effects in human OA chondrocytes suggesting that sucrose may represent a novel therapeutic approach for the management of OA.
Supplementary Material
Human OA chondrocytes were cultured in monolayer and total RNA were isolated treated and mRNA expression of Col2A1, ACAN and COL10A1 were quantified using TaqMan assay. Gene expression was determined by the ΔCt method and results were normalized to β-actin expression.
(A) Human OA chondrocytes were treated with sucrose (100mM) for 4h or 24h and then cell lysate were prepared and sucrose uptake was measured by fluorometric assay using sucrose assay kit (Abcam) for 24h. (B). Human OA chondrocytes were treated with glucose or fructose (100mM) for 24 h. LC3-II expression was measured by Western blotting. Expression of β-actin was used as endogenous expression control. *P≤ 0.05 compared control group, n=3
Acknowledgments
This work was supported in part by National Institute of Health grants (RO1-AT-005520; RO1-AT-007373; RO1-AR- 067056; R21-AR- 064890) and funds from the Northeast Ohio Medical University to TMH.
References
- Akhtar N, Haqqi TM. Current nutraceuticals in the management of osteoarthritis: a review. Ther Adv Musculoskelet Dis. 2012;4:181–207. doi: 10.1177/1759720X11436238. [DOI] [PMC free article] [PubMed] [Google Scholar]
- Akhtar N, Miller MJ, Haqqi TM. Effect of a Herbal-Leucine mix on the IL-1beta-induced cartilage degradation and inflammatory gene expression in human chondrocytes. BMC Complement Altern Med. 2011;11:66. doi: 10.1186/1472-6882-11-66. [DOI] [PMC free article] [PubMed] [Google Scholar]
- Berenbaum F. Osteoarthritis as an inflammatory disease (osteoarthritis is not osteoarthrosis!) Osteoarthritis Cartilage. 2013;21:16–21. doi: 10.1016/j.joca.2012.11.012. [DOI] [PubMed] [Google Scholar]
- Carames B, Hasegawa A, Taniguchi N, Miyaki S, Blanco FJ, Lotz M. Autophagy activation by rapamycin reduces severity of experimental osteoarthritis. Ann Rheum Dis. 2012;71:575–581. doi: 10.1136/annrheumdis-2011-200557. [DOI] [PMC free article] [PubMed] [Google Scholar]
- Carames B, Kiosses WB, Akasaki Y, Brinson DC, Eap W, Koziol J, Lotz MK. Glucosamine activates autophagy in vitro and in vivo. Arthritis Rheum. 2013;65:1843–1852. doi: 10.1002/art.37977. [DOI] [PMC free article] [PubMed] [Google Scholar]
- Carames B, Taniguchi N, Otsuki S, Blanco FJ, Lotz M. Autophagy is a protective mechanism in normal cartilage, and its aging-related loss is linked with cell death and osteoarthritis. Arthritis Rheum. 2010;62:791–801. doi: 10.1002/art.27305. [DOI] [PMC free article] [PubMed] [Google Scholar]
- DeCourcy K, Storrie B. Osmotic swelling of endocytic compartments induced by internalized sucrose is restricted to mature lysosomes in cultured mammalian cells. Exp Cell Res. 1991;192:52–60. doi: 10.1016/0014-4827(91)90156-o. [DOI] [PubMed] [Google Scholar]
- Dwivedi M, Ahnn J. Autophagy--is it a preferred route for lifespan extension? BMB Rep. 2009;42:62–71. [PubMed] [Google Scholar]
- Gerwin N, Hops C, Lucke A. Intraarticular drug delivery in osteoarthritis. Adv Drug Deliv Rev. 2006;58:226–242. doi: 10.1016/j.addr.2006.01.018. [DOI] [PubMed] [Google Scholar]
- Goldring MB. The role of the chondrocyte in osteoarthritis. Arthritis Rheum. 2000;43:1916–1926. doi: 10.1002/1529-0131(200009)43:9<1916::AID-ANR2>3.0.CO;2-I. [DOI] [PubMed] [Google Scholar]
- Goldring MB. Articular cartilage degradation in osteoarthritis. Hss J. 2012;8:7–9. doi: 10.1007/s11420-011-9250-z. [DOI] [PMC free article] [PubMed] [Google Scholar]
- Haseeb A, Chen D, Haqqi TM. Delphinidin inhibits IL-1beta-induced activation of NF-kappaB by modulating the phosphorylation of IRAK-1(Ser376) in human articular chondrocytes. Rheumatology (Oxford) 2013;52:998–1008. doi: 10.1093/rheumatology/kes363. [DOI] [PMC free article] [PubMed] [Google Scholar]
- Haseeb A, Haqqi TM. Immunopathogenesis of osteoarthritis. Clin Immunol. 2013;146:185–196. doi: 10.1016/j.clim.2012.12.011. [DOI] [PMC free article] [PubMed] [Google Scholar]
- Haseeb A, Makki MS, Haqqi TM. Modulation of ten-eleven translocation 1 (TET1), Isocitrate Dehydrogenase (IDH) expression, alpha-Ketoglutarate (alpha-KG), and DNA hydroxymethylation levels by interleukin-1beta in primary human chondrocytes. J Biol Chem. 2014;289:6877–6885. doi: 10.1074/jbc.M113.512269. [DOI] [PMC free article] [PubMed] [Google Scholar]
- Helip-Wooley A, Thoene JG. Sucrose-induced vacuolation results in increased expression of cholesterol biosynthesis and lysosomal genes. Exp Cell Res. 2004;292:89–100. doi: 10.1016/j.yexcr.2003.09.003. [DOI] [PubMed] [Google Scholar]
- Hellio Le Graverand-Gastineau MP. OA clinical trials: current targets and trials for OA. Choosing molecular targets: what have we learned and where we are headed? Osteoarthritis Cartilage. 2009;17:1393–1401. doi: 10.1016/j.joca.2009.04.009. [DOI] [PubMed] [Google Scholar]
- Heraud F, Heraud A, Harmand MF. Apoptosis in normal and osteoarthritic human articular cartilage. Ann Rheum Dis. 2000;59:959–965. doi: 10.1136/ard.59.12.959. [DOI] [PMC free article] [PubMed] [Google Scholar]
- Higuchi T, Nishikawa J, Inoue H. Sucrose induces vesicle accumulation and autophagy. J Cell Biochem. 2015;116:609–617. doi: 10.1002/jcb.25012. [DOI] [PubMed] [Google Scholar]
- Hui W, Young DA, Rowan AD, Xu X, Cawston TE, Proctor CJ. Oxidative changes and signalling pathways are pivotal in initiating age-related changes in articular cartilage. Ann Rheum Dis. 2016;75:449–458. doi: 10.1136/annrheumdis-2014-206295. [DOI] [PMC free article] [PubMed] [Google Scholar]
- Karageorgos LE, Isaac EL, Brooks DA, Ravenscroft EM, Davey R, Hopwood JJ, Meikle PJ. Lysosomal biogenesis in lysosomal storage disorders. Exp Cell Res. 1997;234:85–97. doi: 10.1006/excr.1997.3581. [DOI] [PubMed] [Google Scholar]
- Kim YC, Guan KL. mTOR: a pharmacologic target for autophagy regulation. J Clin Invest. 2015;125:25–32. doi: 10.1172/JCI73939. [DOI] [PMC free article] [PubMed] [Google Scholar]
- Levine B, Kroemer G. Autophagy in the pathogenesis of disease. Cell. 2008;132:27–42. doi: 10.1016/j.cell.2007.12.018. [DOI] [PMC free article] [PubMed] [Google Scholar]
- Livak KJ, Schmittgen TD. Analysis of relative gene expression data using real-time quantitative PCR and the 2(-Delta C(T)) Method. Methods. 2001;25:402–408. doi: 10.1006/meth.2001.1262. [DOI] [PubMed] [Google Scholar]
- Loeser RF. Aging and osteoarthritis: the role of chondrocyte senescence and aging changes in the cartilage matrix. Osteoarthritis Cartilage. 2009;17:971–979. doi: 10.1016/j.joca.2009.03.002. [DOI] [PMC free article] [PubMed] [Google Scholar]
- Lopez de Figueroa P, Lotz MK, Blanco FJ, Carames B. Autophagy activation and protection from mitochondrial dysfunction in human chondrocytes. Arthritis Rheumatol. 2015;67:966–976. doi: 10.1002/art.39025. [DOI] [PMC free article] [PubMed] [Google Scholar]
- Lotz MK, Carames B. Autophagy and cartilage homeostasis mechanisms in joint health, aging and OA. Nat Rev Rheumatol. 2011;7:579–587. doi: 10.1038/nrrheum.2011.109. [DOI] [PMC free article] [PubMed] [Google Scholar]
- Mankin HJ, Dorfman H, Lippiello L, Zarins A. Biochemical and metabolic abnormalities in articular cartilage from osteoarthritic human hips. J Bone Joint Surg. 1971;53-A:523e37.4. [PubMed] [Google Scholar]
- Marino G, Niso-Santano M, Baehrecke EH, Kroemer G. Self-consumption: the interplay of autophagy and apoptosis. Nat Rev Mol Cell Biol. 2014;15:81–94. doi: 10.1038/nrm3735. [DOI] [PMC free article] [PubMed] [Google Scholar]
- Mizushima N, Levine B, Cuervo AM, Klionsky DJ. Autophagy fights disease through cellular self-digestion. Nature. 2008;451:1069–1075. doi: 10.1038/nature06639. [DOI] [PMC free article] [PubMed] [Google Scholar]
- Mizushima N, Yoshimori T, Levine B. Methods in mammalian autophagy research. Cell. 2010;140:313–326. doi: 10.1016/j.cell.2010.01.028. [DOI] [PMC free article] [PubMed] [Google Scholar]
- Mobasheri A. Intersection of inflammation and herbal medicine in the treatment of osteoarthritis. Curr Rheumatol Rep. 2012;14:604–616. doi: 10.1007/s11926-012-0288-9. [DOI] [PMC free article] [PubMed] [Google Scholar]
- Mukhopadhyay S, Panda PK, Sinha N, Das DN, Bhutia SK. Autophagy and apoptosis: where do they meet? Apoptosis. 2014;19:555–666. doi: 10.1007/s10495-014-0967-2. [DOI] [PubMed] [Google Scholar]
- Pennock AT, Robertson CM, Emmerson BC, Harwood FL, Amiel D. Role of apoptotic and matrix-degrading genes in articular cartilage and meniscus of mature and aged rabbits during development of osteoarthritis. Arthritis Rheum. 2007;56:1529–1536. doi: 10.1002/art.22523. [DOI] [PubMed] [Google Scholar]
- Ravikumar B, Stewart A, Kita H, Kato K, Duden R, Rubinsztein DC. Raised intracellular glucose concentrations reduce aggregation and cell death caused by mutant huntingtin exon 1 by decreasing mTOR phosphorylation and inducing autophagy. Hum. Mol. Genet. 2003;12:985–994. doi: 10.1093/hmg/ddg109. [DOI] [PubMed] [Google Scholar]
- Ryu JH, Shin Y, Huh YH, Yang S, Chun CH, Chun JS. Hypoxia-inducible factor-2alpha regulates Fas-mediated chondrocyte apoptosis during osteoarthritic cartilage destruction. Cell Death Differ. 2012;19:440–450. doi: 10.1038/cdd.2011.111. [DOI] [PMC free article] [PubMed] [Google Scholar]
- Sasaki H, Takayama K, Matsushita T, Ishida K, Kubo S, Matsumoto T, Fujita N, Oka S, Kurosaka M, Kuroda R. Autophagy modulates osteoarthritis-related gene expression in human chondrocytes. Arthritis Rheum. 2012;64:1920–1928. doi: 10.1002/art.34323. [DOI] [PubMed] [Google Scholar]
- Scherz-Shouval R, Shvets E, Fass E, Shorer H, Gil L, Elazar Z. Reactive oxygen species are essential for autophagy and specifically regulate the activity of Atg4. Embo J. 2007;26:1749–1760. doi: 10.1038/sj.emboj.7601623. [DOI] [PMC free article] [PubMed] [Google Scholar]
- Shintani T, Klionsky DJ. Autophagy in health and disease: a double-edged sword. Science. 2004;306:990–995. doi: 10.1126/science.1099993. [DOI] [PMC free article] [PubMed] [Google Scholar]
- Sokolove J, Lepus CM. Role of inflammation in the pathogenesis of osteoarthritis: latest findings and interpretations. Ther Adv Musculoskelet Dis. 2013;5:77–94. doi: 10.1177/1759720X12467868. [DOI] [PMC free article] [PubMed] [Google Scholar]
- Wang Y, Nartiss Y, Steipe B, McQuibban GA, Kim PK. ROS-induced mitochondrial depolarization initiates PARK2/PARKIN-dependent mitochondrial degradation by autophagy. Autophagy. 2012;8:1462–1476. doi: 10.4161/auto.21211. [DOI] [PubMed] [Google Scholar]
- Wu YT, Tan HL, Shui G, Bauvy C, Huang Q, Wenk MR, Ong CN, Codogno P, Shen HM. Dual role of 3-methyladenine in modulation of autophagy via different temporal patterns of inhibition on class I and III phosphoinositide 3-kinase. J Biol Chem. 2010;285:10850–10861. doi: 10.1074/jbc.M109.080796. [DOI] [PMC free article] [PubMed] [Google Scholar]
- Yang S, Kim J, Ryu JH, Oh H, Chun CH, Kim BJ, Min BH, Chun JS. Hypoxia-inducible factor-2alpha is a catabolic regulator of osteoarthritic cartilage destruction. Nat Med. 2010;16:687–693. doi: 10.1038/nm.2153. [DOI] [PubMed] [Google Scholar]
- Zhang M, Kenny SJ, Ge L, Xu K, Schekman R. Translocation of interleukin-1β into a vesicle intermediate in autophagy-mediated secretion. eLife. 2015;4:e11205. doi: 10.7554/eLife.11205. [DOI] [PMC free article] [PubMed] [Google Scholar]
Associated Data
This section collects any data citations, data availability statements, or supplementary materials included in this article.
Supplementary Materials
Human OA chondrocytes were cultured in monolayer and total RNA were isolated treated and mRNA expression of Col2A1, ACAN and COL10A1 were quantified using TaqMan assay. Gene expression was determined by the ΔCt method and results were normalized to β-actin expression.
(A) Human OA chondrocytes were treated with sucrose (100mM) for 4h or 24h and then cell lysate were prepared and sucrose uptake was measured by fluorometric assay using sucrose assay kit (Abcam) for 24h. (B). Human OA chondrocytes were treated with glucose or fructose (100mM) for 24 h. LC3-II expression was measured by Western blotting. Expression of β-actin was used as endogenous expression control. *P≤ 0.05 compared control group, n=3


