

Abstract
We implement an agent-based model for Clostridium difficile transmission in hospitals that accounts for several processes and individual factors including environmental and antibiotic heterogeneity in order to evaluate the efficacy of various control measures aimed at reducing environmental contamination and mitigating the effects of antibiotic use on transmission. In particular, we account for local contamination levels that contribute to the probability of colonization and we account for both the number and type of antibiotic treatments given to patients. Simulations illustrate the relative efficacy of several strategies for the reduction of nosocomial colonizations and nosocomial diseases.
Keywords: Clostridium difficile, control, agent-based model
1 Introduction
Healthcare-associated infections (HAI) are a very significant problem in the U.S. health care system, exacting a severe cost in both lives and dollars (U.S. Department of Health and Human Services, 2013). One of the most common cause of HAI in the U.S. is the enteric pathogen Clostridium difficile (Lessa et al., 2015). Clostridium difficile is an anaerobic bacterium that produces spores and toxins (Leffler and Lamont, 2015). Clostridium difficile toxins cause a range of clinical signs including mild to severe or bloody diarrhea and colon perforation and peritonitis (Leffler and Lamont, 2015). Antibiotic therapy in hospitalized patients is a strong risk factor for C. difficile infections (CDI). Patients become susceptible to C. difficile colonization during and after antibiotic treatment. Antibiotics are given to treat a bacterial infection, but they also damage the gut microbiota, a negative side effect of antibiotics. Gut microbiota protects against C. difficile colonization by competing with C. difficile for nutrients and producing substances that inhibit C. difficile growth. Antibiotics vary on their effects on the gut microbiota based on their spectrum of action (Sullivan et al., 2001). Broad-spectrum antibiotics kill a wide range of bacteria, and therefore, they cause a severe damage on the gut microbiota and subsequently pose a greater risk for C. difficile colonization (Owens et al., 2008).
The incidence of CDI in the U.S. healthcare system has risen in the last decade. The rate of discharges in which the patient received the diagnosis of CDI more than doubled from 2001 to 2010 (Steiner et al., 2012). In 2011, the number of C. difficile infections (CDI) was estimated to be about 500,000 and the number of deaths linked to the pathogen was estimated at 29,000 (Lessa et al., 2015). The cost attributable to CDI in U.S. acute care facilities is estimated to be as much as $4.8 billion per year (Dubberke and Olsen, 2012). Control measures against C. difficile have not changed sufficiently to manage these rising numbers. Upon colonization with the pathogen, patients can remain asymptomatically colonized (refered here as “colonized” patients) or they may present clinical signs (refered here as “diseased” patients). Clinical signs are the result of tissue damage caused by C. difficile toxins. Both colonized and diseased patients can transmit the pathogen. But the focus of current control measures is on testing patients with diarrhea in order to identify diseased patients with CDI so that isolation and contact precautions can be taken place (Cohen et al., 2010; Dubberke et al., 2008). Recent studies, however, point out the significance to transmission within the ward of both transmission pathways beyond the ward itself and additional sources of CDI infections
Mathematical models have been developed to describe nosocomial transmission; these studies often used ordinary differential equations (ODEs) to model the transmission dynamics (Brauer, 2015; Webb et al., 2004; Yahdi et al., 2012; Hsieh et al., 2014). In a study closely related to our work, Lanzas et al. (2011) developed and analyzed an ODE model for C. difficile transmission within a medical ward. A threshold value for within ward transmission assuming no admission of colonized or diseased individuals was calculated. One may think of this as the relative contribution of the hospital ward itself to transmission with respect to some larger population. In the absence of the admission of colonized and diseased patients, the basic reproductive number, R0, is less than one. The basic reproductive number in this case is defined as the average number of secondary infections caused by the introduction of a single infected individual into a disease free hospital ward. This suggests that the nosocomial infection rates of C. difficile may not be able attribute solely to transmission due to diseased patients. The role of asymptomatic carriers, for example, is significant to within-ward transmission. Lanzas and Dubberke (2014) developed an agent-based model (ABM) to study the effectiveness of identifying asymptomatic carriers by screening upon admission in reducing the incidence of CDI. Sources of transmission such as admitted colonized and undetected diseased patients are significant in sustaining nosocomial transmission. A better understanding of transmission, therefore, requires a better understanding of the patients' pre-admission history with respect to factors pertinent to CDI and how these factors contribute to within-ward transmission.
Another important source of nosocomial transmission is the hospital environment (Dubberke et al., 2008; Gerding et al., 2008). Clostridium difficile produces spores that survive for prolonged periods of time in environmental surfaces (Bartlett, 2002). The risk of a susceptible patient becoming colonized by C. difficile depends significantly on the local pathogen contamination level (Dubberke et al., 2014). Health-care workers are an important vector of transmission and the hands of health-care workers can become contaminated when contacting surfaces with C. difficile spores (McMaster-Baxter and Musher, 2007; Donskey, 2010). The level of contamination in one hospital ward may vary significantly from that of another ward in the same hospital. One important control measure is to place symptomatic patients under quarantine in order for contact precautions to be initiated that decrease the spread of contamination associated with diarrhea (Gerding et al., 2008). Cleaning and disinfecting of the environment are also important control measures for reducing local contamination levels (Gerding et al., 2008).
Antibiotic treatments in hospitals provide a source of transmission heterogeneity. Antibiotics disrupt the intestinal microbiota, which facilitates the colonization of Clostridium difficile (Rupnik et al., 2009). The degree of microbiota disturbance, and subsequent risk of CDI, depends on the spectrum, duration and number of antibiotics (Slimings and Riley, 2014; Dancer et al., 2013). Antibiotic stewardship programs that reduce either the number of antibiotic treatments or the relative proportion of high risk antibiotic treatments are, therefore, important for the prevention and control of CDI (Feazel et al., 2014; Talpaert et al., 2011).
In this modeling study we will take into account these sources of transmission and transmission heterogeneity in order to better understand C. difficile transmission in hospitals and, thereby, more accurately evaluate the efficacy of control measures. In particular, our model includes individual patient characteristics important to pathogen transmission. We also incorporate certain stochastic effects that are significant to transmission dynamics in small populations such as a hospital. Agent-based models are well suited to simulate such individual (or agent) characteristics and behaviors as well as incorporating various stochastic effects. D'Agata et al. (2007) used an ABM to consider three processes: admission and discharge of patients, infection of patients by health-care workers and contamination of health-care workers by patients. It considered only one individual trait, the bacterial load of infected patients. The goal of their study was to “identify the key parameters contributing to the spread of a typical antimicrobial resistant bacteria in a typical hospital setting.” Notably absent from this work, however, were important individual patient characteristics such as patient history that are more important with respect to CDI than for other healthcare-associated infections. Critically important to within-ward transmission is the precise state of individual patients with respect to CDI upon admission. Patients who are colonized upon admission, for example, are a significant source contributing to within-ward transmission (Curry et al., 2013).
D'Agata et al. (2007) also lacks within-hospital patient history such as when antibiotic treatment began and what level of risk is associated with this antibiotic. This is also the case for the ABM found in Codella et al. (2015). The probability associated with a susceptible patient becoming colonized varies significantly with the both of these factors and should not be considered constant (Slimings and Riley, 2014; Dancer et al., 2013; Feazel et al., 2014; Talpaert et al., 2011). Not only are such components important for understanding transmission, they are important for intervention and control measures.
The ABM model developed by Rubin et al. (2013) features several components that are important for transmission such as patient-health care worker interactions, room contamination and hand hygiene. This study also incorporates antibiotic treatment. It does not, however, consider antimicrobial stewardship as a control measure. In an evidence-based systematic review, Hsu et al. (2010) conclude that antimicrobial stewardship is one of the control measures with the greatest evidence for preventing healthcare-associated CDI and, so, in this study we consider antimicrobial stewardship as a control measure.
The goal of this study is to evaluate the efficacy of various control measures aimed at reducing environmental contamination and mitigating the effects of antibiotic use on transmission for reducing the nosocomial incidence of colonization and infection. To clarify, antibiotic prescriptions given for a variety of infections, not just for CDI, are a key focus of our modeling work. We, therefore, propose and implement an ABM for C. difficile transmission in hospitals that accounts for several additional processes and individual factors that are relevant to C. difficile transmission in healthcare settings, including the environmental and antibiotic heterogeneities discussed above. Environmental decontamination strategies (Gerding et al., 2008) will result in lower probabilities of susceptible patients becoming colonized which, in turn, will further contribute to the decontamination of the environment. We account for local contamination levels in our ABM which contribute to the probability of colonization. These levels are influenced in our model by the probability of effective cleaning and this, then, is a control for modeling environmental decontamination.
There are two basic strategies employed in the implementation of an antimicrobial stewardship program (Dancer et al., 2013; Feazel et al., 2014; Talpaert et al., 2011; Gerding et al., 2008). One strategy is to reduce the overall number of antibiotic prescriptions by some proportion. This will result in a smaller number of susceptible patients and will lead, therefore, to a smaller number of colonizations. Alternatively, the relative proportions of antibiotics prescribed by type are changed. In particular, we are interested in differentiating antibiotics by the level of CDI risk with which they are associated. This will result in lower probabilities of susceptible patients becoming colonized. We account for both the number and type of antibiotic treatments given to patients in our model and thereby they are controls for modeling antimicrobial stewardship.
In order to describe the model in such a way that facilitates replication, we give a summary of its features in the next section and give the updated ODD (Overview, Design concepts, Details) protocol in the appendix (Grimm et al., 2010). Section 3 describes our control strategies for antimicrobial stewardship and environmental decontamination. Our simulation results for these strategies are reported in section 4 and our conclusions are in the final section.
2 Model Summary
We present an ABM that simulates the transmission of Clostridium difficile to evaluate the efficacy of antimicrobial and environmental (cleaning) stewardship in reducing the number of colonizations and infections occurring in a hospital. As described in the appendix, some of the rate parameters and the basic layout come from an epidemiological data set from Barnes-Jewish Hospital in St. Louis, Missouri used in Lanzas et al. (2011). The spatial scale of the model is one hospital consisting of six medical wards, each containing thirty-five rooms. We assume that at most one patient can occupy a room. The time step is one half-day and the simulations are run for one year. The length of stay for patients is assigned by resampling from that the distribution of length of stay, generated from the length of stay data for patients with that disease status.
The two kinds of entities in this model are hospital patients and rooms. A room has a certain level of contamination – low, medium, or high – and a room either is or is not occupied by a patient under quarantine. Diseased patients are placed in quarantine or isolation for the purpose of implementing contact precautions that decrease the environmental bioburden associated with diarrhea (Gerding et al., 2008). While healthcare workers are not explicitly present in this model, their effect as vectors for disease transmission is implicit in the fact that ward-level contamination levels contribute to patient colonization. The probability that a susceptible patient in a particular ward room will become colonized depends in part on the contamination level of the entire ward.
A patient can be resistant to colonization, susceptible to colonization, colonized, or diseased. A patient resistant to colonization cannot be colonized by C. difficile upon exposure. On the contrary, a patient susceptible to colonization can acquire C. difficile upon exposure. A patient who carries C. difficile in the gut without clinical signs is defined here as colonized patient. If the patient has clinical signs associated with C. difficile carriage, the patient is referred as diseased. Each patient is assigned a (hospital) length of stay and the patient's time since being admitted is tracked. The time since a patient's current disease status is tracked. If a patient goes on an antibiotic, the time since beginning the antibiotic treatment is tracked as well as the level of CDI risk associated with the antibiotic with which they are being treated. This model considers three such levels of risk – low, high, and very high risk. The number of antibiotics a patient has received during hospitalization is also tracked. Colonized patients either will or will not mount an immune response. Those who will not are said to be immunocompromised. Diseased patients either will or will not be identified as diseased upon screening and those that are treated for the disease either will or will not be treated successfully. See the appendix for details of the transition rates, including the probabilities that a patient will begin an antibiotic treatment with low, high or very-high risk with respect to CDI. The probabilities associated with different antibiotic risk levels are determined using odds ratios, which measure the association between an exposure to antibiotic treatment and the outcome of becoming colonized.
The model hospital is initially populated with patients who have various hospital and pre-hospital histories. The occupancy level is kept constant. The environment is also initialized. As the patients from this initial population are discharged, new patients are admitted. In order for the initial hospital population not to have influence on model outputs, the simulation runs 200 time steps before recording outputs. Each room has a contamination status of clean, contaminated, or very contaminated represented by the values 0, 1, and 2 respectively, and these values are changed by the cleaning procedure. The ward-level contamination is the sum of the contamination values of all the rooms in the same ward. Colonized and diseased patients shed C. difficile spores in feces. Surfaces and equipment in rooms become contaminated with spores through hand contact of colonized and diseased patients or objects exposed to fecal matter. Spores remain viable on surface for months and are resistant to commonly used hospital cleaners and disinfectants.
The contamination level of a room with a quarantined patient does not contribute to the overall ward-level contamination, representing the effect of isolation and contact precautions that decrease the environmental bioburden associated with diarrhea. When a patient is quarantined due to CDI, they begin treatment for CDI and will be assigned an antibiotic, and the time of beginning treatment is initialized.
3 Control Strategies
The control measures considered in this study are antimicrobial stewardship and decontamination by cleaning. There are two basic strategies employed in the implementation of an antimicrobial stewardship program.
One strategy is to reduce the overall number of antibiotic prescriptions by some proportion. Here we consider three values for such reduction, 0, 0.1, and 0.2, where no reduction is considered the baseline value. Let qr be the reduction proportion. This reduction is achieved in the model by first deciding whether a patient would receive an antibiotic according to the global variable prob-antib with value 0.27 (Table 5), and then, if they were to receive one in the situation with no reduction, there is now a probability of 1 – qr that they will receive an antibiotic. Thus the probability of receiving an antibiotic with qr reduction strategy would be 0.27(1 – qr)
Table 5.
Description of global variables of the agent based model.
| Variable | Description | Baseline Value | |
|---|---|---|---|
| occupancy | occupancy level of the hospital | 0.85 | |
| prob-R | probability a patient is resistant upon admission | 0.58 | |
| prob-S | probability a patient is susceptible upon admission | [0.21, 0.40] | |
| prob-C | probability a patient is colonized upon admission | [0.01, 0.20] | |
| prob-D | probability a patient is diseased upon admission | 0.01 | |
| immcomp-prob | probability a colonized patient is immunocompromised | 0.1 | |
| pmin | minimum probability of regaining resistance | 0.2 | |
| prob-antib | half-daily probability that a patient will begin an antibiotic treatment | 0.27 | |
| prob-low-risk | probability a hospital assigned antibiotic is low-risk with respect to CDI | 0.4 | |
| prob- high-risk | probability a hospital assigned antibiotic is high-risk with respect to CDI | 0.26 | |
| prob-vhigh-risk | probability a hospital assigned antibiotic is very high-risk with respect to CDI | 0.34 | |
| ORh | odds ratio value for high risk antibiotics | 4 | |
| ORvh | odds ratio value for very-high risk antibiotics | 8 | |
|
|
probability of becoming colonized if treated with low risk antibiotic in highly contaminated environment | 0.15 | |
| prob-eff-clean | probability of effective cleaning | 0.5 | |
| sensitivity | sensitivity of the screening test for CDI | 0.91 | |
| turnover | turnover time for the screening test for CDI | 2 | |
| prob-succ-treat | probability of successful treatment of CDI | 0.8 |
Alternatively, rather than reducing the number of prescriptions, the relative proportions of antibiotics prescribed by type are changed. In particular, we are interested in differentiating antibiotics by the level of CDI risk with which they are associated. There are three categories of risk in this model, ‘low’, ‘high’, and ‘very high.’ We consider three scenarios. The baseline scenario, established from the hospital dataset, has the proportions 0.4, 0.26, and 0.34 for ‘low’, ‘high’, and ‘very high’ respectively. For a second scenario, we consider replacing half of the very high risk prescriptions with high risk antibiotics. The corresponding proportions for this scenario are 0.4, 0.43, and 0.17. Finally, in addition to replacing half of the very high risk prescriptions with high risk antibiotics, we also replace half of the high risk prescriptions with low risk antibiotics. The resulting proportions for this scenario are 0.53, 0.3, and 0.17. These scenarios are summarized in Table 1. Our scenarios were chosen to reflect changes of antibiotic use that could be feasible in an antibiotic stewardship program. More extreme changes on antibiotic use (e.g. setting the use of antibiotic to zero) are unlikely. Antibiotics are given to treat a variety of infections encountered in hospitalized patients (e.g. urinary tract infection, pneumonia, bloodstream infection), and even when the hospital was able to reduce all the antibiotic prescriptions that are inadequate or unnecessary, there are some antibiotic prescriptions (including for antibiotics that fall in the very high risk category) that are necessary and unavoidable.
Table 1.
Antibiotic risk proportion scenarios.
| Scenario | Proportion low-risk | Proportion high-risk | Proportion very high-risk |
|---|---|---|---|
| 1 | 0.4 | 0.26 | 0.34 |
| 2 | 0.4 | 0.43 | 0.17 |
| 3 | 0.53 | 0.3 | 0.17 |
As described in the Appendix (Section 7.6), there is a global variable in the model assigning a probability of effective cleaning. We select three values for this variable to represent the effect of certain levels of the effectiveness of a cleaning strategy. A baseline value of 0.5 was assigned to this variable under the assumption that the basline value reflects standard cleaning practices, without additional cleaning or disinfection interventions. Accordingly, the other two values considered are 0.2 and 0.8.
Separately from the control strategies, we evaluated the effect of the three parameters we considered to be the most uncertain on the model predictions. Specifically, we varied the probability of a patient being immunocompromised, the length of the incubation period with respect to antibiotic risk, and the length of time for the restoration of a normal gut flora. We vary these three parameters over three values for each (baseline and +/- 25%) and measured the response in terms of normalized nosocomial infections and colonizations. For each of the twenty-seven combinations of these three parameters, one hundred yearlong simulations were run. We kept the other parameters and stewardship strategies at baseline. The effect of the varied parameters on the outputs was evaluated using a three-way ANOVA analysis.
4 Simulation Results
for Stewardship Strategies A complete factorial design for the combination of these three strategies with each of their respective three scenarios was implemented. The 27 strategies are summarized in Table 2. One hundred runs were completed for each strategy. In the figures to follow, the combination strategy will be referred to by its corresponding number in this table. Note that combination strategy number 2 is the baseline scenario. Recall that the baseline scenario is the scenario that corresponds to the data set used to design the model (see Section 6.2) and reflects current strategies for controlling disease transmission. Strategy number 2 reflects no reduction in the number of antibiotic treatments given and, so, the baseline value for the proportion reduction is 0. The relative proportions of treatments from the hospital dataset that were low, high, and very-high risk with respect to CDI are 0.4,0.26 and 0.34 respectively. These are, therefore, the baseline risk-scenario. Finally, as described above, the baseline value for effective cleaning, 0.5 was chosen in order to compare strategies that are both more effective and less effective in this regard.
Table 2.
Numbering of combination strategies.
| Combination | Proportion reduction | Risk-scenario | Probability of effective cleaning |
|---|---|---|---|
| 1 | 0 | 1 | 0.2 |
| 2 | 0 | 1 | 0.5 |
| 3 | 0 | 1 | 0.8 |
| 4 | 0 | 2 | 0.2 |
| 5 | 0 | 2 | 0.5 |
| 6 | 0 | 2 | 0.8 |
| 7 | 0 | 3 | 0.2 |
| 8 | 0 | 3 | 0.5 |
| 9 | 0 | 3 | 0.8 |
| 10 | 0.1 | 1 | 0.2 |
| 11 | 0.1 | 1 | 0.5 |
| 12 | 0.1 | 1 | 0.8 |
| 13 | 0.1 | 2 | 0.2 |
| 14 | 0.1 | 2 | 0.5 |
| 15 | 0.1 | 2 | 0.8 |
| 16 | 0.1 | 3 | 0.2 |
| 17 | 0.1 | 3 | 0.5 |
| 18 | 0.1 | 3 | 0.8 |
| 19 | 0.2 | 1 | 0.2 |
| 20 | 0.2 | 1 | 0.5 |
| 21 | 0.2 | 1 | 0.8 |
| 22 | 0.2 | 2 | 0.2 |
| 23 | 0.2 | 2 | 0.5 |
| 24 | 0.2 | 2 | 0.8 |
| 25 | 0.2 | 3 | 0.2 |
| 26 | 0.2 | 3 | 0.5 |
| 27 | 0.2 | 3 | 0.8 |
The outputs to measure the relative effectiveness of these strategies were the incidence numbers of nosocomial colonizations and diseases per year, normalized to 10,000 patients admitted per year. In order to compare scenarios that differ in number of admitted patients, we divide the number of diseased (or colonized) patients by the number of admitted patients, and expressed as number of diseased (or colonized) patients per 10,000 admissions. This type of normalization is common practice in hospital epidemiology. The number of patients admitted in hospitals change over time and varies among hospitals, therefore comparing total number of diseased or colonized patients without normalization can be misleading. In the box plots shown in Figure 1, the 27 combined strategies are ranked according to their respective median values of nosocomial colonizations. These median values are indicated by the circles with dots in the center. The top chart contains box plots for the number of new colonizations by strategy and they are plotted in increasing order by median values. The bottom chart indicates the corresponding box plots for the number of new diseases.
Fig. 1.

Box plots for strategies ranked by number of new colonizations at top and corresponding box plots for number of new diseases on bottom. The white dot in the center of each box plot represents the median. The upper and lower areas of each center box indicate the 75th and 25th percentiles respectively (50% of the values are included; the interquartile range (H) is the difference between the 2 percentiles). The whiskers on the lines are values that fall within 1.5 times H.
Note, for example, the rank of the baseline scenario, scenario 2. There are 5 scenarios that, on average, resulted in more new colonizations. As one would expect, each of these 5 scenarios (13, 7, 10, 4, 1) are cases where the probability of effective cleaning is less than the baseline value for this probability. Recall that the baseline value for this probability is 0.5 and in those 5 scenarios it is 0.2. It is worth pointing out, however, that there are 4 scenarios (16, 19, 22, 25) with probability 0.2 of effective cleaning that, on average, resulted in fewer new colonizations. For scenario 22, the median number of new colonizations is 5747 which is 8% less than the 6261 colonizations for the baseline scenario. Scenario 16 results in 7% fewer colonizations. In scenario 25, however, the median number of new colonizations was 5286 compared to the baseline median value of 6261, which is a 16% reduction. The strategy implemented in scenario 25 involved both a reduction in overall antibiotic treatments as well as a reduction in the relative proportions of antibiotic treatments that are high and very-high risk with respect to CDI. This suggests that it is possible for an aggressive antibiotic stewardship strategy reduce the number of new colonizations even in the event of less effective cleaning.
The bottom chart in Figure 1 shows the corresponding numbers of nosocomial diseases. These numbers do not necessarily increase respectively by scenario to the numbers of new colonizations. As noted above, compared to the baseline scenario, the reduction in new colonizations for scenario 22 was modest compared to that for scenario 25: 8% compared to 16%. The corresponding comparison of these scenarios for the reduction in new diseases is closer: 26% compared to 31%. The only difference between these two strategies is that scenario 22 represents risk-scenario number 2 while scenario 25 represents risk-scenario number 3 (see Table 1). This suggests that there are strategies that may be similarly effective with respect to reducing the number of nosocomial colonizations but differ in terms of reducing nosocomial diseases.
In Figure 2, the 27 combined strategies are ranked according to their respective median values of nosocomial diseases. The bottom chart contains box plots for the number of new diseases by strategy and they are plotted in increasing order by median values. The top chart indicates the corresponding box plots for the number of new colonizations. By this ranking there are only 2 scenarios (10,1) that, on average, resulted in more new diseases than the baseline scenario. And, again, each of these 2 are scenarios where the probability of effective cleaning is less than that of the baseline scenario. There are, therefore, 7 scenarios in which the probability of effective cleaning is less than that of the baseline scenario and, yet, are more effective in reducing the number of new diseases. Of these, scenario 25 represents the largest reduction and was discussed above as having 31% less disease incidence than the baseline scenario.
Fig. 2.

Box plots for strategies ranked by number of new diseases on bottom and corresponding box plots for number of new colonizations on top. The white dot in the center of each box plot represents the median. The upper and lower areas of each center box indicate the 75th and 25th percentiles respectively (50% of the values are included; the interquartile range (H) is the difference between the 2 percentiles). The whiskers on the lines are values that fall within 1.5 times H.
What stands out when ranked according to the number of new diseases is the corresponding change in the number of new colonizations. In particular, we note a significant change in the number of new colonizations between scenarios 4 and 21 (see Figure 2). The median numbers of new diseases for these two scenarios are close to the same, 146 and 144 respectively. The median number, 6860, of new colonizations represented by scenario 4 is, however, 45% more than the 4726 new colonizations represented by scenario 21. The strategy for scenario 4 involves no reduction in the overall proportion of antibiotic treatments but it does represent stewardship of the relative proportions of treatments according to risk using risk scenario 2 (see Table 1). Scenario 21, on the other hand, does not implement a stewardship of risk proportions, but, rather, it implements an overall reduction in the number of treatments and a more effective cleaning strategy. This suggests that there are strategies that may be similarly effective with respect to reducing the number of nosocomial diseases but differ significantly in terms of reducing nosocomial colonizations. In terms of policy, it is important to consider strategies the efficacy of which are evaluated in terms of reducing both nosocomial diseases and colonizations. One important consequence of ignoring the reduction of nosocomial colonizations is that some of these individuals could develop the disease after leaving the hospital. This will inevitably lead to an increase in the admission rate of diseased patients (Otten et al., 2010).
Suppose one wants to implement only one of the three strategies and wants to know the relative efficacy of one strategy over another in reducing nosocomial colonizations and/or diseases. Table 3 summarizes the relevant values from our simulations for making this evaluation. There is no single strategy that ranks first for both colonization and disease (Table 3). The scenario with a risk-scenario 3 (i.e., reducing the proportion of very-high and high risk antibiotic) was the best scenario when considered the rank for decreasing colonizations and diseases simultaneously. The median number of new colonizations for this strategy is 5213 which is 17% less than the baseline number of new colonizations which is 6261. The median number of new diseases for this strategy is 122 which is 29% less than the baseline number of new diseases which is 173. In fact, in terms of reducing nosocomial diseases, the other strategy in this risk-scenario category ranks 2nd, with 136 new diseases which is 21% less than the baseline. This is the strategy that reduces the relative proportion of antibiotic treatments that are very-high risk with respect to CDI but does not reduce the relative proportion of antibiotic treatments that are high risk with respect to CDI. If the more aggressive strategy is unrealizable or, perhaps, too expensive, then one might choose the same type of, but less aggressive, stewardship policy. This would be, however, another example of ignoring the value of reducing the number of nosocomial colonizations. Notice that this strategy, while ranking 2nd with respect to reducing the number of diseases, ranks 5th with respect to reducing the number of colonizations; only slightly better than the baseline scenario. If one wishes to take into account both goals of reducing disease and colonization (and the more aggressive strategy is not available), then the next best strategy is the other type of stewardship policy that reduces the overall number of antibiotic treatments by 20%. This highlights the importance of understanding the complexities of Clostridium difficile transmission in order to make the best decisions with respect to implementing control measures.
Table 3. Median colonizations and diseases for employing a single strategy.
| Parameter to vary | Parameter value | Median colonizations | Median diseases | Rank by colonizations | Rank by diseases |
|---|---|---|---|---|---|
| Probability of effective cleaning | 0.2 | 7091 | 189 | 7 | 7 |
| 0.8 | 5781 | 170 | 4 | 5 | |
|
| |||||
| Risk-scenario from Table 1 | 2 | 5878 | 136 | 5 | 2 |
| 3 | 5213 | 122 | 2 | 1 | |
|
| |||||
| Proportion reduction | 0.1 | 5676 | 165 | 3 | 4 |
| 0.2 | 5071 | 152 | 1 | 3 | |
|
| |||||
| Baseline: | 6261 | 173 | 6 | 6 | |
We varied the most uncertain parameters; the probability of a patient being immunocompromised, the length of the incubation period with respect to antibiotic risk, and the length of time for the restoration of a normal gut flora. When the three parameters were varied, the mean predicted number of colonized patients per 10,000 admissions was 6,295 with a standard deviation of 135.21. These outputs compare to the corresponding baseline outputs of The mean number of colonized was only sensitive to the probability of being immunocompromised as indicated by the ANOVA analysis. The number of diseased patients per 10,000 admissions was 176.2 with a standard deviations of 44.7 The number of diseased patients was sensitive to the scenario chosen for the incubation time and the probability of being immunocompromised. The parameter time to normal was not influential for either outcome. Comparing to such outputs for our baseline scenario, our outputs seem reasonably robust to these three parameters.
5 Conclusions
In this study we have pointed out the significance to nosocomial transmission of Clostridium difficile as influenced by the presence of asymptomatic carriers, environmental contamination, and antibiotic treatments in hospitals.
We implemented an ABM for Clostridium difficile transmission in hospitals that accounts for several processes and individual factors including environmental and antibiotic heterogeneity in order to evaluate the efficacy of various control measures aimed at reducing environmental contamination and mitigating the effects of antibiotic use on transmission. In particular, we accounted for local contamination levels in our ABM which contribute to the probability of colonization. These levels are influenced in our model by the probability of effective cleaning and, so, served as a control for modeling environmental decontamination. We also accounted for both the number and type of antibiotic treatments given to patients in our model and, so, served as controls for modeling antimicrobial stewardship.
Our model showed that it is possible for an aggressive antibiotic stewardship strategy to reduce the number of new colonizations even in the event of less effective cleaning. We showed that there are strategies that may be similarly effective with respect to reducing the number of nosocomial colonizations but differ significantly in terms of reducing nosocomial diseases. We showed that there are, likewise, strategies that may be similarly effective with respect to reducing the number of nosocomial diseases but differ significantly in terms of reducing nosocomial colonizations.
Antimicrobial stewardship encompasses a variety of practices such as physician education, removal of specific drugs from the hospital pharmacy, or prescriptions reviews. These practices reduce the number of antibiotic prescriptions and the relative proportion of prescriptions for the high-risk antibiotics. Our model evaluates these two strategies independently and shows that both strategies are effective in reducing C. difficile disease. In an evidence-based systematic review, Hsu et al. (2010) evaluated the efficacy of interventions for the prevention of CDI in healthcare institutions. Corroborating our modeling results, this study concludes that there is good evidence to support the effectiveness of antimicrobial stewardship for preventing healthcare-associated CDI. Note that our outputs of numbers of diseased and colonized patients was robust from the ANOVA analysis including three key parameters. Similarly, a meta-analysis of quasi-experimental and observational studies found that restricting the use of high risk antibiotics had a protective effect against C. difficile (Feazel et al., 2014).
We also considered the situation wherein one implements only one of the three strategies for the control of C. difficile transmission. We showed the relative efficacy of one strategy over another in reducing nosocomial colonizations and/or diseases. Our study illustrates that choosing a strategy for the goal of reducing nosocomial diseases does not necessarily achieve the same relative success for the goal of reducing nosocomial colonizations. This is an important oversight since discharging more patients who are colonized by C. difficile could lead to more individuals that develop the disease after leaving the hospital. This could inevitably lead to an increase in the admission rate of diseased patients.
The agent-based model presented here is a useful tool for investigating strategies for reducing the overall C. difficile burden in healthcare settings. In the future, we plan to design simulations for evaluating additional management strategies that are connected to current practices in order to predict their expected impact on C. difficile burden. For example, an aggressive antimicrobial stewardship policy may be difficult to implement and will likely be influenced by both the needs of patients and the actual pathogens involved. Our model can easily incorporate the compliance habits of healthcare workers and can be adapted to other hospital settings and management protocols.
Acknowledgments
The work of all the authors was partially supported by the National Institute of Mathematical and Biological Synthesis (NIMBioS), an Institute sponsored by National Science Foundation, the U.S. Department of Homeland Security, and the U.S. Department Agriculture through NSF Awards #EF-0832858 and #DBI-1300426, with additional support from University of Tennessee, Knoxville. This work was also supported by the joint NSF/NIGMS Mathematical Biology Program through NIH award R01GM113239. Lenhart's work is also partially supported by the University of Tennessee Center for Business and Economic Research.
Appendix
6 Appendix: ODD Protocol: Overview
6.1 Purpose
We present an ABM that simulates the transmission of C. difficile in healthcare settings in order to evaluate the efficacy of various control measures (e.g. antimicrobial and environmental stewardship) in reducing the nosocomial incidence of colonization and infection.
6.2 Input Data
The model layout and agent behaviors as well as rate parameters and initial conditions come from published studies as well as previously collected epidemiological data from Barnes-Jewish Hospital in St. Louis, Missouri. These data are for a retrospective cohort of 11046 admissions in medicine wards at a large tertiary care hospital, which included laboratory-confirmed cases of CDI, admission, discharge, and confirmed laboratory dates, and antimicrobial exposures. Summary data from this set were provided by Lanzas and further description of these can be found in Lanzas et al. (2011).
Control measures for reducing nosocomial colonization and infection are model inputs. The level of contamination is one factor contributing to the probability of a susceptible patient becoming colonized. We regard effective cleaning to be cleaning that reduces the contamination level of a ward room (see Section 7.6). The probability that a vacant room will be effectively cleaned (terminal cleaning) is a global variable. Changing the value of this probability is a control input for the model representing different cleaning programs.
Another control strategy of the model is to reduce the overall number of antibiotic treatments by a certain proportion. This is implemented in the following way. Let q be the proportion reduction to be implemented. Of all the patients that were assigned to receive a treatment each half day according to the half-daily probability of receiving an antibiotic (see Table 5), only 1 – q of them will now actually receive a treatment.
Alternatively, one may change the relative proportions of the types of antibiotic treatments that are prescribed. Each time an antibiotic treatment is prescribed, there is a probability that it will be low, high, or very-high risk with respect to CDI. The baseline values for these probabilities were taken from the data and are 0.4,0.26 and 0.34 respectively (see Table 5). These proportions can be changed in accordance with a specified stewardship program.
6.3 Entities, State Variables, and Scales
The model has two kinds of entities: hospital patients and rooms. Individual rooms are classified by two state variables. A room has a certain level of contamination - low, medium, or high - and a room either is or is not occupied by a patient under quarantine. Symptomatic patients are placed in quarantine or isolation for the purpose of implementing contact precautions that decrease the environmental bioburden associated with diarrhea (Gerding et al., 2008). While healthcare workers are not agents of this model, their effect as vectors for disease transmission is implicit in the fact that ward-level contamination levels contribute to patient colonization. That is, the probability that a susceptible patient in a particular ward room will become colonized depends in part on the contamination level of the entire ward. We regard the contamination level of a hospital ward a reasonable measure of the scope of a healthcare worker's interaction with patients.
Patients are classified by several state variables. These are summarized in Table 4. With respect to C. difficile infection (CDI), a patient can be resistant to colonization, susceptible to colonization, colonized, or diseased. Each patient is assigned a (hospital) length of stay (LOS) and the patient's time since being admitted is tracked. The time since a patient's current disease status is tracked. If a patient goes on an antibiotic, the time since beginning the antibiotic treatment is tracked as well as the level of CDI risk associated with the antibiotic with which they are being treated. This model considers three such levels of risk – low, high, and very high risk. The number of antibiotics a patient has received during hospitalization is also tracked. Colonized patients either will or will not mount an immune response against C. difficile. Those who will not are said to be immunocompromised. Diseased patients either will or will not be identified as diseased upon screening and those that are treated for the disease either will or will not be treated successfully.
Table 4.
Description of room and patient variables of the agent based model.
| Description | Values | |
|---|---|---|
| Room Variable | ||
|
| ||
| number-ward-rooms | number of rooms per ward | 35 |
| contamination-status | room-level contamination measure | 0, 1, 2 |
| contamination-quotient | ward-level contamination measure | 0, 1, …, 70 |
| quarantine-patient-here | indicates whether the occupant is under quarantine | Yes, No |
|
| ||
| Patient Variable | ||
|
| ||
| length-of-stay | patient's hospital length of stay | [0, 160] |
| time-since-admission | patient's time since being admitted | 0, 1, 2, … |
| disease-status | patient disease status | R,S,C,D |
| time-since-current-status | patient's time since their current disease status | 0, 1, 2, … |
| time-since-began-antib | patient's time since beginning their current antibiotic treatment | 0, 1, 2, … |
| treatment-length | prescribed length of the current antibiotic treatment | 14 |
| time-to-normal | time until patient's gut flora is considered normal | |
| low risk: | 28 | |
| high risk: | 28 | |
| very-high risk: | 70 | |
| antib-risk-level | risk level of the current antibiotic with respect to CDI | low, high, very-high |
| number- hosp-antibs | number of hospital antibiotics the patient has received | 0, 1, 2, … |
| immunocompromised | indicates if a colonized patient is immunocompromised | yes, no |
| prob-regaining-resistance | probability of regaining resistance to colonization | [0, 1] |
| prob-becoming-colonized | probability of becoming colonized | [0, 1] |
| length-incubation-period | length of time between colonization and becoming diseased by antibiotic risk level | |
| low risk: | [20, 60] | |
| high risk: | [14, 40] | |
| very-high risk: | [8, 20] | |
| time-until-diseased | time until an immunocompromised, colonized patient will become diseased | [0, 60] |
| will-ID | determines whether a particular screening will correctly test positive for CDI | yes, no |
| will-treat-succ | determines whether a patient will be successfully treated for CDI | yes, no |
We here describe the model's global variables. A summary of these global variables and their values is given in Table 5. The occupancy level for the hospital is a global variable set to 0.85. The probability of a patient being resistant upon admission is 0.58 while the probability of being diseased upon admission is 0.01. The probability of being susceptible upon admission is chosen randomly from a uniform distribution ranging from 0.21 to 0.40. This value will fix the corresponding probability of being colonized upon admission which will range between 0.01 and 0.20. The probability that a colonized patient will be immunocompromised is a global variable. The baseline value for this variable is 0.10. There is a half-daily probability that a susceptible patient or a colonized patient that is not immunocompromised will regain resistance. The minimum such probability is a global variable, and its value is 0.2. For a full description see Section 7.4. There is a half-daily probability that a patient will begin an antibiotic treatment. The baseline value for this variable is 0.27. This value was chosen so that simulation outputs pertaining to overall number of antibiotic treatments per patient reflect the hospital dataset. Each time an antibiotic treatment is prescribed, there is a probability that it will be low, high, or very-high risk with respect to CDI. The baseline values for these probabilities were taken from the data and are 0.4, 0.26 and 0.34 respectively. The odds ratio values for high and very-high risk antibiotics are global variables and are given by ORh = 4 and ORvh = 8, respectively. For a full description see Section 7.8. The half-daily probability of a susceptible patient becoming colonized given that they are being treated with a low risk antibiotic in a highly contaminated environment, denoted by , is a global variable and its value is 0.15. Again, for a full description see Section 7.8. Each time a room is cleaned, there is a probability that it will be cleaned effectively. For a description of what this means see Section 7.6. A baseline value of 0.5 was assigned to this variable under the simple assumption that different cleaning measures could be more or less effective at reducing the level of contamination. In our model it is assumed that patients with CDI are also symptomatic. Once a patient becomes diseased and, thus, symptomatic, they are screened for CDI. The sensitivity (0.91) of this test is a global variable as well as the turnover time (2 half-days) for this test (Planche et al., 2008). When a patient is treated for CDI, there is a probability (0.8) that the treatment will be successful.
The spatial scale of the model is one hospital consisting of six medical wards, each containing thirty-five rooms. This is reflective of the hospital from which the previously described dataset came. In this model we assume that at most one patient can occupy a room. The time step is one half-day and the temporal extent of the simulation is one year.
6.4 Process Overview and Scheduling
The following process takes place each time step (half-day). Time-tracking characteristics for patients are updated. New patients are admitted, the contamination of the environment is updated, the patients progress with respect to their infection status, patients are discharged, and vacant rooms are cleaned.
6.5 Initialization
The model hospital is initially populated with patients who have various hospital and pre-hospital histories with respect to each of the patient variables listed in Table 4. The occupancy level is a global variable set to 0.85 and is kept constant. The environment is then initialized (see Section 7.3 for details). As the patients from this initial population are discharged, new patients are admitted. The hospital-history of these new patients more accurately reflect the processes of the model. In order for the initial hospital population not to have influence on model outputs, the simulation runs 200 time steps before recording outputs.
7 Appendix: ODD Protocol: Submodels
This section describes in detail the subroutines that make up the main process.
7.1 Update Time Characteristics
Patients' time since admission and, with one exception, time since current disease status are updated. For resistant patients, the time since current disease status is not tracked. This is because the value of this state variable is only relevant for the progression of patients who are susceptible, colonized or diseased. Unlike them, a patient who is resistant will remain resistant until and unless they receive an antibiotic at which time they become susceptible to colonization.
Susceptible patients and colonized patients who are not immunocompromised have their time since beginning antibiotic treatment updated. Colonized patients who are immunocompromised have their time until diseased updated. Three classes of diseased patients are considered here. Those who have been screened successfully but have not yet reached the turnaround time have their time since screening updated. The turnaround time for a screening is the time between administering the test and receiving the results. Those who have been screened unsuccessfully but have not yet reached the turnaround time also have their time since screening updated. In this way, they will not be screened again until at least the turnaround time has passed. Finally, those who have been screened successfully and have begun treatment have their time since beginning treatment updated.
7.2 Admission
Each time step, a number of patients are admitted. This is referred to as an admission class. The same number of patients is admitted as were just discharged. This is done to assure consistency, so that the number of patients to be admitted does not exceed the number of vacant rooms. Moreover, the number of patients being discharged varies significantly each time step since it is ultimately based on the patients' varying lengths of stay and times since admission.
For each admission class, the probability of a patient being resistant upon admission is 0.58 while the probability of being diseased upon admission is 0.01 (Lanzas et al., 2011). However, for each admission class, at each time step, the probability of being susceptible upon admission is chosen randomly from a uniform distribution ranging from 0.21 to 0.40. This value will fix the corresponding probability of being colonized upon admission which will range between 0.01 and 0.20.
Each patient is randomly admitted to a vacant room and their time since admission is initialized. They are then assigned a disease status according to the above probabilities as well as a length of stay based on the hospital dataset. The procedure for this assignment is described in detail in Section 7.10.
Susceptible patients are given an antibiotic history since patients become susceptible to colonization via the disruption of the gut microbiota caused by antibiotic treatment. First, a particular type of antibiotic is assigned according to the treatment length, time until flora recovery, and the risk level vis a vis CDI associated with this antibiotic. This procedure is described in Section 7.7. Second, a time since beginning antibiotic treatment is assigned. This is a random integer drawn from a uniform distribution ranging from 0 to an upper limit defined as the sum of the treatment length (14 half-days) and time until microbiota recovery (28 half-days for low and high-risk antibiotic, 70 half-days for very high-risk antibiotic). That is, we regard a patient as susceptible to colonization from the moment they begin an antibiotic treatment and they can remain susceptible as long as their gut microbiota is not normal. Finally, the patient is assigned a time since becoming susceptible. In this case, it is precisely the time since they began antibiotic treatment.
Colonized patients either will or will not mount an immune response and so are characterized as one or the other according the global variable for the probability that a colonized patient is immunocompromised. Patients who are not immunocompromised are given an antibiotic history. First, an antibiotic is assigned in the same way as described above for susceptible patients. Second, a time since beginning antibiotic treatment is assigned; again, in the same way as for susceptible patients. Lastly, they are assigned a time since becoming colonized. A patient may have become colonized at any time since they began antibiotic treatment and, thus, this variable is assigned a uniform random integer between 0 and the time since they began treatment.
If the colonized patient is immunocompromised, they will become diseased at a certain point in time that must be assigned. First, an antibiotic history is assigned. In this case, what matters most is the risk level associated with their antibiotic assignment. Next, the length of the incubation period is determined. The incubation period depends on the risk level associated with their antibiotic assignment. For each level of antibiotic risk, there is a pair of global values for the minimum and maximum length of the incubation period. Baseline values for these pairs are (20,60), (14,40), and (8,20) for low, high, and very high risk antibiotics respectively. A random integer from a uniform distribution of integers in the appropriate range is assigned as the length of the incubation period. The patient's time until becoming diseased is assigned as a random integer greater than or equal to 0 but less than the incubation period. The time since current disease status in this case is equal to the length of the incubation period minus the time until becoming diseased.
Finally, for patients who are diseased upon admission, it is decided if the initial screening will be successful in identifying them as diseased according to the global variable for the sensitivity of the test and it is also decided if treatment will be successful according the global variable for this probability. The baseline values for the sensitivity and probability of successful treatment are 0.91 (Planche et al., 2008) and 0.8 (McFarland, 2008) respectively. Patients who will be identified as diseased due to successful screening are assigned a time since the successful screen. In this way, they will be identified when that time reaches the turnaround time for the test. The baseline value for the turnaround is 2 half-days (Planche et al., 2008). At that point the patient will be quarantined and treatment will begin as described in Section 7.9. Diseased patients who are unsuccessfully screened will not be tested again until after the turnaround time for the test and so are assigned a time since the unsuccessful screening.
7.3 Update Contamination Status
After a class of patients is admitted, the environment is updated. Each room has a contamination status of clean, contaminated, or very contaminated represented by the values 0, 1, and 2 respectively. During an update, the contamination status of a room occupied by a colonized patient is set to 1 while the contamination status of a room occupied by a diseased patient is set to 2. This value is affected by the cleaning procedure (Section 7.6).
The ward-level contamination is the sum of the contamination status values of all the rooms in the same ward. Since each ward has 35 rooms, each with a maximum contamination value of 2, this will be an integer between 0 and 70. This sum excludes the contamination values of those rooms that contain a quarantined patient. Thus, our model assumes that quarantine is 100% effective. This does not effect, however, the uncertain level of cleaning the room will receive upon the discharge of the quarantined patient. This value will be used in determining the probability that a susceptible patient will become colonized (Section 7.8). While healthcare workers are not agents of this model, their effect as vectors for disease transmission is implicit in the fact that ward-level contamination levels contribute to patient colonization. That is, the probability that a susceptible patient in a particular ward room will become colonized depends in part on the contamination level of the entire ward. We regard a hospital ward a reasonable measure of the scope of a healthcare worker's interaction with patients. Therefore, the contamination level of the ward, rather than that of the individual patient room, contributes to the probability of becoming colonized.
7.4 Update Disease Status
Each half-day there is a probability that a patient will begin an antibiotic treatment- even if they are currently being treated with antibiotics. This model parameter was chosen so that simulation outputs pertaining to overall number of antibiotic treatments per patient reflect the hospital dataset. One of the model control strategies is to reduce the overall number of treatments by a certain proportion. This is implemented in the following way. Of all the patients that were assigned to receive a treatment each half day according to the probability just described, only a proportion of them will now actually receive a treatment.
The transitions described in this section are illustrated by the diagram in Figure 3. If a resistant patient goes on an antibiotic, they become susceptible and an antibiotic is assigned. The time since beginning antibiotic and time since current disease status are set to 0. A new length of stay is selected for this patient according the new disease status. If it is longer than the patient's current length of stay, then the patient's length of stay is changed to this value.
Fig. 3. Disease state transitions for CDI.
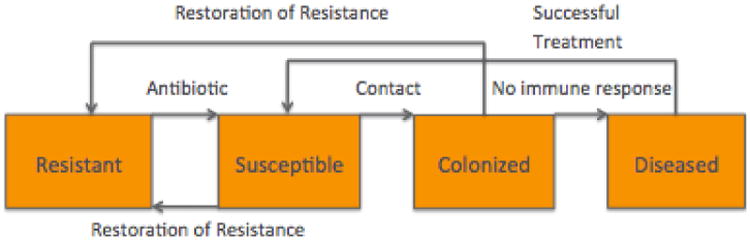
Each half-day, there is a probability that a susceptible patient will regain resistance. This probability is a logistic function of the time since they began their most recent antibiotic treatment. In particular, let t be the time since the patient began antibiotic treatment and let T be the sum of the treatment length and the associated time until a normal microbiota is restored. Then, the probability, p, of regaining resistance is given by
where pmin = 0.2 is the minimum probability of regaining resistance and the parameter value 12 determines the steepness of the logistic curve.
If they do not regain resistance, there is a probability they will receive an additional antibiotic as described above. Then, there is a probability they will become colonized (Section 7.8). If they do become colonized, they are designated as either immunocompromised or not according to the global variable for the probability of being immunocompromised. If the now colonized patient is immunocompromised, then an incubation period is assigned as before. This value determines when they will become diseased. Furthermore, the number of nosocomial colonizations is tracked.
Similar to susceptible patients, colonized patients who will mount an immune response can regain resistance. If they do not regain resistance, there is a chance they will receive an additional antibiotic; this is also the case for those patients who will not mount an immune response. For these patients, if their incubation period is over, they become diseased. If that happens, they will be screened at the next time step (because they are now symptomatic) and it is determined if the screening will be successful in identifying them as diseased according to the global variable for sensitivity. It is also decided if the subsequent treatment will be successful according the global variable for this probability. The number of nosocomial diseases is tracked.
A diseased patient is quarantined and treatment is begun (Section 7.9) if they have been identified; that is, if they were successfully screened and they have reached the turnaround time. A diseased patient who has not been identified as diseased is re-screened if the turnover time since the unsuccessful screening has been reached. Diseased patients that have completed a successful treatment become susceptible.
7.5 Discharge Patients
Patients are discharged if their length-of-stay variable is the same value as their time-since-admission variable. The current disease status, disease status at admission and the number of antibiotics received during their stay are tallied for each discharged patient.
7.6 Cleaning
After a patient is discharged, the vacant room is cleaned. If the room has contamination status 2 or 1, then there is a probability that cleaning will result in a new contamination status of 1 or 0, respectively. The probability of effective cleaning is a global variable. A baseline value of 0.5 was assigned to this variable under the simple assumption that different cleaning measures could be more or less effective at reducing the level of contamination. Rooms are subject to terminal cleaning once the patient is discharge, but additional efforts on daily or terminal cleaning may be recommended if there is an outbreak or hyperendemicity (incidence above observed on similar facilities). This additional level of cleaning can be incorporated in the model by modifying the contamination status according patient status if cleaning targets rooms with diseased patients or the probability of effective cleaning if additional cleaning is applied to the whole ward.
7.7 Antibiotic Assignment
When a patient goes on an antibiotic, there is a probability that it will be low, high, or very high-risk with respect to CDI. Antibiotics disrupt the normal gut microbiota. The degree of disruption and the subsequent risk of C. difficile colonization depends on the spectrum of the antibiotic. Antibiotics were categorized in these three categories (low, high and very high-risk) based on epidemiological studies reporting the association of type of antibiotic and C. difficile. There is a treatment length and time to normal flora associated with each class. The risk level is one factor in determining the probability of being colonized.
7.8 Assign Probability of Becoming Colonized
The half-daily probability of a susceptible patient becoming colonized depends on both the local, ward-level environment and the risk level associated with the antibiotic they are receiving.
The environment is classified as low, medium, or high contamination. These classifications are determined by the typical range and variance of ward-level contamination values for the simulations of this model.
The probabilities associated with different antibiotic risk levels (see Section 7.7) are determined using odds ratios. The odds ratio (OR) of interest in this case is a measure of the association between an exposure to antibiotic treatment and the outcome of becoming colonized by C. difficile. Studies have quantified the odds ratios for infection risk assigned to specific antibiotics (Bignardi, 1998; Feazel et al., 2014; Slimings and Riley, 2014). In our model, the OR represents the odds that a patient will become colonized if they have been given a high or very high risk antibiotic, compared to the odds of becoming colonized when given a low risk antibiotic. These are global variables in the model.
Let p be the half-daily probability of a susceptible patient becoming colonized given that they are being treated with a low risk antibiotic. In general, we can use p together with a known odds ratio value associated with a particular antibiotic to find the half daily probability of the patient becoming colonized given they are being treated with that particular antibiotic. Let ORA be the odds ratio associated with antibiotic A and let pA be the half daily probability of the patient becoming colonized given they are being treated with antibiotic A. Then the relationship
implies
Odds ratio values for the categories “high risk” and “very-High risk” are based on the odds ratio values for the individual antibiotics in these categories (Bignardi, 1998; Feazel et al., 2014; Slimings and Riley, 2014) as well as information from the hospital dataset regarding the relative proportion of the number of treatments for each specific antibiotic to the overall number of antibiotic treatments. For each category, a weighted average was calculated using the odds ratio values for each specific antibiotic in the category and the corresponding number of these treatments from the hospital dataset. In this way, we estimated the odds ratio values for high and very-high risk antibiotics to be ORh = 4 and ORvh = 8, respectively.
Since there is also an environmental component to colonization, we will have half-daily probabilities for each of the 9 combinations from the 3 environmental contamination levels and the 3 antibiotic risk categories; see Table 6. Let be the half-daily probability of a susceptible patient becoming colonized given that they are being treated with a low risk antibiotic in a highly contaminated environment. Here the subscript, ℓ, refers to the risk level associated with the antibiotic and stands for “low”. The superscript, h, refers to the level of ward contamination and stands for “high”. Table 6 indicates the values for each of the 9 combinations and how they are calculated.
Table 6.
Global variables for the half-daily probabilities of becoming colonized.
| Variable | Antibiotic risk | Level of contamination | Value | ||
|---|---|---|---|---|---|
|
|
Low | High |
|
||
|
|
High | High |
|
||
|
|
Very high | High |
|
||
|
| |||||
|
|
Low | Low |
|
||
|
|
High | Low |
|
||
|
|
Very high | Low |
|
||
|
| |||||
|
|
Low | Medium |
|
||
|
|
High | Medium |
|
||
|
|
Very high | Medium |
|
||
First a value is assigned to . The value 0.15 for was chosen by calibration to match the proportion of nosocomial infections from the data. From this value and the values for ORh and ORvh, we calculate the other two probabilities for a highly contaminated environment, and . Next, we calculate the probability, , of a susceptible patient becoming colonized given that they are being treated with a low risk antibiotic in a low contamination environment. We do this by scaling down by a certain factor, . This factor is a measure of the relative contribution of the environment to the colonization of a susceptible patient. For the simulations we assigned the value 0.5 to the factor q. The other two probabilities for a low contamination environment are then calculated similar to above. Finally, we take to be the average of and and from this calculate the other two probabilities for a medium contamination environment.
7.9 Quarantine and Treat
In this model, quarantined means that the contamination level of their room does not contribute to the overall ward-level contamination. This models the effect of isolation and contact precautions that decrease the environmental bio-burden associated with diarrhea (Gerding et al., 2008). When a patient is quarantined due to CDI, they begin treatment for CDI. This means they will be assigned an antibiotic (Section 7.7) and the time since beginning treatment is initialized.
7.10 Length of Stay
Patients are assigned a length of stay upon admission according to their disease status. This half-daily value is assigned by resampling summary data from the hospital dataset. In particular, given a patient's disease status, their length of stay is assigned by resampling from the dataset (from Barnes-Jewish Hospital) generated by the length of stay data for patients with that disease status. The range of the values for the length of stay in half-days for resistant, susceptible, and diseased patients are [0, 32], [0, 68] and [0, 160], respectively. The range for colonized patients is the same as that for susceptible patients.
Contributor Information
Jason Bintz, Department of Mathematics, Houghton College.
Suzanne Lenhart, Department of Mathematics, University of Tennessee.
Cristina Lanzas, Department of Population Health and Pathobiology, North Carolina State University.
References
- Bartlett JG. Antibiotic-associated diarrhea. New England Journal of Medicine. 2002;346(5):334–339. doi: 10.1056/NEJMcp011603. [DOI] [PubMed] [Google Scholar]
- Bignardi G. Risk factors for Clostridium difficile infection. Journal of Hospital Infection. 1998;40(1):1–15. doi: 10.1016/s0195-6701(98)90019-6. The 4th International Conference of the Hospital Infection Society Effective Infection Control: Ahead of Change. [DOI] [PubMed] [Google Scholar]
- Brauer F. Some simple nosocomial disease transmission models. Bulletin of Mathematical Biology. 2015;77(3):460–469. doi: 10.1007/s11538-015-0061-0. [DOI] [PubMed] [Google Scholar]
- Codella J, Safdar N, Heffernan R, Alagoz O. An agent-based simulation model for Clostridium difficile infection control. Medical Decision Making. 2015;35(2):211–229. doi: 10.1177/0272989X14545788. [DOI] [PMC free article] [PubMed] [Google Scholar]
- Cohen SH, Gerding DN, Johnson S, Kelly CP, Loo VG, McDonald LC, Pepin J, Wilcox MH. Clinical practice guidelines for Clostridium difficile infection in adults: 2010 Update by the Society for Healthcare Epidemiology of America (SHEA) and the Infectious Diseases Society of America (IDSA) Infection Control and Hospital Epidemiology. 2010;31(5):431–455. doi: 10.1086/651706. [DOI] [PubMed] [Google Scholar]
- Curry SR, Muto CA, Schlackman JL, Pasculle AW, Shutt KA, Marsh JW, Harrison LH. Use of multilocus variable number of tandem repeats analysis genotyping to determine the role of asymptomatic carriers in Clostridium difficile transmission. Clinical Infectious Diseases. 2013;57(8):1094–1102. doi: 10.1093/cid/cit475. [DOI] [PMC free article] [PubMed] [Google Scholar]
- D'Agata EM, Magal P, Olivier D, Ruan S, Webb GF. Modeling antibiotic resistance in hospitals: The impact of minimizing treatment duration. Journal of Theoretical Biology. 2007;249(3):487–499. doi: 10.1016/j.jtbi.2007.08.011. [DOI] [PMC free article] [PubMed] [Google Scholar]
- Dancer S, Kirkpatrick P, Corcoran D, Christison F, Farmer D, Robertson C. Approaching zero: temporal effects of a restrictive antibiotic policy on hospital-acquired Clostridium difficile, extended-spectrum β-lactamase-producing coliforms and meticillin-resistant Staphylococcus aureus. International Journal of Antimicrobial Agents. 2013;41(2):137–142. doi: 10.1016/j.ijantimicag.2012.10.013. [DOI] [PubMed] [Google Scholar]
- Donskey CJ. Preventing transmission of Clostridium difficile: Is the answer blowing in the wind? Clinical Infectious Diseases. 2010;50(11):1458–1461. doi: 10.1086/652649. [DOI] [PubMed] [Google Scholar]
- Dubberke ER, Olsen MA. Burden of Clostridium difficile on the healthcare system. Clinical Infectious Diseases. 2012;55(suppl 2):S88–S92. doi: 10.1093/cid/cis335. [DOI] [PMC free article] [PubMed] [Google Scholar]
- Dubberke ER, Gerding DN, Classen D, Arias KM, Kelly CP, Deverick MC, Anderson J, Burstin H, Calfee DP, Coffin SE, Fraser V, Griffin FA, Gross P, Kaye KS, Klompas M, Lo E, Marschall J, Mermel LA, Nicolle L, Pegues DA, Perl TM, Saint S, Salgado CD, Weinstein RA, Wise R, Yokoe DS. Strategies to prevent Clostridium difficile infections in acute care hospitals. Infection Control and Hospital Epidemiology. 2008;29(Sl):S81–S92. doi: 10.1086/591065. [DOI] [PubMed] [Google Scholar]
- Dubberke ER, Carling PM, Carrico R, Donskey CJ, Loo VG, McDonald LC, Maragakis LL, Sandora TJ, Weber DJ, Yokoe DS, Gerding DN. Strategies to prevent Clostridium difficile infections in acute care hospitals: 2014 update. Infection Control and Hospital Epidemiology. 2014;35(6):628–645. doi: 10.1086/676023. [DOI] [PubMed] [Google Scholar]
- Feazel LM, Malhotra A, Perencevich EN, Kaboli P, Diekema DJ, Schweizer ML. Effect of antibiotic stewardship programmes on Clostridium difficile incidence: a systematic review and meta-analysis. Journal of Antimicrobial Chemotherapy. 2014;69(7):1748–1754. doi: 10.1093/jac/dku046. [DOI] [PubMed] [Google Scholar]
- Gerding DN, Muto CA, Owens RC. Measures to control and prevent Clostridium difficile infection. Clinical Infectious Diseases. 2008;46(Supplement 1):S43–S49. doi: 10.1086/521861. [DOI] [PubMed] [Google Scholar]
- Grimm V, Berger U, DeAngelis DL, Polhill JG, Giske J, Railsback SF. The ODD protocol: A review and first update. Ecological Modelling. 2010;221(23):2760–2768. [Google Scholar]
- Hsieh YH, Liu J, Tzeng YH, Wu J. Impact of visitors and hospital staff on nosocomial transmission and spread to community. Journal of Theoretical Biology. 2014;356(0):20–29. doi: 10.1016/j.jtbi.2014.04.003. [DOI] [PubMed] [Google Scholar]
- Hsu J, Abad C, Dinh M, Safdar N. Prevention of endemic healthcare-associated Clostridium difficile infection: Reviewing the evidence. The American Journal of Gastroenterology. 2010;105(11):2327–2339. doi: 10.1038/ajg.2010.254. [DOI] [PubMed] [Google Scholar]
- Lanzas C, Dubberke ER, Lu Z, Reske KA, Grohn Y. Epidemiological model for Clostridium difficile transmission in healthcare settings. Infection Control and Hospital Epidemiology. 2011;32(06):553–561. doi: 10.1086/660013. [DOI] [PMC free article] [PubMed] [Google Scholar]
- Lanzas CP, Dubberke ER. Effectiveness of screening hospital admissions to detect asymptomatic carriers of Clostridium difficile: A modeling evaluation. Infection Control and Hospital Epidemiology. 2014;35(8):1043–1050. doi: 10.1086/677162. [DOI] [PMC free article] [PubMed] [Google Scholar]
- Leffler DA, Lamont JT. Clostridium difficile infection. New England Journal of Medicine. 2015;372(16):1539–1548. doi: 10.1056/NEJMra1403772. [DOI] [PubMed] [Google Scholar]
- Lessa FC, Mu Y, Bamberg WM, Beldavs ZG, Dumyati GK, Dunn JR, Farley MM, Holzbauer SM, Meek JI, Phipps EC, Wilson LE, Winston LG, Cohen JA, Limbago BM, Fridkin SK, Gerding DN, McDonald LC. Burden of Clostridium difficile infection in the United States. New England Journal of Medicine. 2015;372(9):825–834. doi: 10.1056/NEJMoa1408913. [DOI] [PMC free article] [PubMed] [Google Scholar]
- McFarland LV. Update on the changing epidemiology of Clostridium difficile-associated disease. Nature Clinical Practice Gastroenterology & Hepatology. 2008;5(l):40–48. doi: 10.1038/ncpgasthep1029. [DOI] [PubMed] [Google Scholar]
- McMaster-Baxter NL, Musher DM. Clostridium difficile: Recent epidemiologic findings and advances in therapy. Pharmacotherapy: The Journal of Human Pharmacology and Drug Therapy. 2007;27(7):1029–1039. doi: 10.1592/phco.27.7.1029. [DOI] [PubMed] [Google Scholar]
- Otten AM, Reid-Smith RJ, Fazil A, Weese JS. Disease transmission model for community-associated Clostridium difficile infection. Epidemiology & Infection. 2010;138:907–914. doi: 10.1017/S0950268809991646. [DOI] [PubMed] [Google Scholar]
- Owens RC, Donskey CJ, Gaynes RP, Loo VG, Muto CA. Antimicrobial-associated risk factors for Clostridium difficile infection. Clinical Infectious Diseases. 2008;46:S19–31. doi: 10.1086/521859. [DOI] [PubMed] [Google Scholar]
- Planche T, Aghaizu A, Holliman R, Riley P, Poloniecki J, Breathnach A, Krishna S. Diagnosis of Clostridium difficile infection by toxin detection kits: a systematic review. Lancet Infectious Diseases. 2008;8(12):777–784. doi: 10.1016/S1473-3099(08)70233-0. [DOI] [PubMed] [Google Scholar]
- Sullivan A, Edlund C, Nord CE. Effect of antimicrobial agents on the ecological balance of human microflora. Lancet Infectious Diseases. 2001;1(2):101–114. doi: 10.1016/S1473-3099(01)00066-4. [DOI] [PubMed] [Google Scholar]
- Rubin MA, Jones M, Leecaster M, Khader K, Ray W, Huttner A, Huttner B, Toth D, Sablay T, Borotkanics RJ, Gerding DN, Samore MH. A simulation-based assessment of strategies to control Clostridium difficile transmission and infection. PLoS ONE. 2013;8(ll):e80671. doi: 10.1371/journal.pone.0080671. [DOI] [PMC free article] [PubMed] [Google Scholar]
- Rupnik M, Wilcox MH, Gerding DN. Clostridium difficile infection: new developments in epidemiology and pathogenesis. Nature Reviews Microbiology. 2009;7(7):526–536. doi: 10.1038/nrmicro2164. [DOI] [PubMed] [Google Scholar]
- Slimings C, Riley TV. Antibiotics and hospital-acquired Clostridium difficile infection: update of systematic review and meta-analysis. Journal of Antimicrobial Chemotherapy. 2014;69(4):881–891. doi: 10.1093/jac/dkt477. [DOI] [PubMed] [Google Scholar]
- Steiner C, Barrett M, Terrel L. HCUP projections: Clostridium difficile hospitalizations 2011 to 2012. HCUP Projections Report # 2012-01 2012 [Google Scholar]
- Talpaert MJ, Gopal Rao G, Cooper BS, Wade P. Impact of guidelines and enhanced antibiotic stewardship on reducing broad-spectrum antibiotic usage and its effect on incidence of Clostridium difficile infection. Journal of Antimicrobial Chemotherapy. 2011;66(9):2168–2174. doi: 10.1093/jac/dkr253. [DOI] [PubMed] [Google Scholar]
- U.S. Department of Health and Human Services. National action plan to prevent health care-associated infections: Road map to elimination. Technical report 2013 [Google Scholar]
- Webb G, Blaser MJ, Zhu H, Ardal S, Wu J. Critical role of nosocomial transmission in the toronto sars outbreak. Mathematical Biosciences and Engineering. 2004;1(1):1–13. doi: 10.3934/mbe.2004.1.1. [DOI] [PubMed] [Google Scholar]
- Yahdi M, Abdelmageed S, Lowden J, Tannenbaum L. Vancomycin-resistent enterococci colonization-infection model: parameter impacts and outbreak risks. Journal of Biological Dynamics. 2012;6(2):645. doi: 10.1080/17513758.2012.670733. [DOI] [PubMed] [Google Scholar]