Significance
Nucleotide excision repair removes DNA damage caused by carcinogens, such as UV and anticancer drugs, such as cisplatin. We have developed two methods, high-sensitivity damage sequencing and excision repair sequencing that map the formation and repair of damage in the human genome at single-nucleotide resolution. The combination of dynamic damage and repair maps provides a holistic perspective of UV damage and repair of the human genome and has potential applications in cancer prevention and chemotherapy.
Keywords: DNA damage, UV, nucleotide excision repair, transcription factor, human genome
Abstract
Formation and repair of UV-induced DNA damage in human cells are affected by cellular context. To study factors influencing damage formation and repair genome-wide, we developed a highly sensitive single-nucleotide resolution damage mapping method [high-sensitivity damage sequencing (HS–Damage-seq)]. Damage maps of both cyclobutane pyrimidine dimers (CPDs) and pyrimidine-pyrimidone (6-4) photoproducts [(6-4)PPs] from UV-irradiated cellular and naked DNA revealed that the effect of transcription factor binding on bulky adducts formation varies, depending on the specific transcription factor, damage type, and strand. We also generated time-resolved UV damage maps of both CPDs and (6-4)PPs by HS–Damage-seq and compared them to the complementary repair maps of the human genome obtained by excision repair sequencing to gain insight into factors that affect UV-induced DNA damage and repair and ultimately UV carcinogenesis. The combination of the two methods revealed that, whereas UV-induced damage is virtually uniform throughout the genome, repair is affected by chromatin states, transcription, and transcription factor binding, in a manner that depends on the type of DNA damage.
UV-induced DNA lesions, cyclobutane pyrimidine dimers (CPDs) and pyrimidine-pyrimidone (6-4) photoproducts [(6-4)PPs], are major causes of skin cancer. In humans, both damage types are repaired exclusively by nucleotide excision repair (excision repair), which removes DNA lesions by dual incisions bracketing modified bases and fills and seals the resulting gap by DNA synthesis and ligation to complete repair (1–3). The biochemical mechanism of excision repair is reasonably well understood. However, factors that affect UV damage formation and its repair in cellular context remain to be defined (4).
Recently, we developed a method, excision repair sequencing (XR-seq) to isolate the oligonucleotides excised by nucleotide excision repair (26-27-mer), subject them to next generation sequencing, align them to the human genome, and thus generate repair maps (5, 6). Whereas the repair maps have provided some insights into the genome-wide DNA repair landscape, its utility is somewhat limited in the absence of the corresponding damage map. Although UV damage in human cells has been mapped at nucleotide resolution at specific genomic loci (7, 8) or genome-wide at low resolution (9, 10), a single-nucleotide resolution UV damage map of the whole human genome is not available. Recently, Excision-seq. (11) and CPD-seq. (12) methods were developed to map UV damage at single-nucleotide resolution in the yeast genome; however, these methods have low sensitivity and require high UV doses (10,000 J/m2 and 100 J/m2 of UVC, respectively), and thus are not applicable to human cells exposed to physiologically relevant UV doses. Previously, we described a method for mapping damages (Damage-seq) that, combined with XR-seq, provided a more informative view of repair of cisplatin damage in human cells (13). However, the original Damage-seq was not sensitive enough for monitoring the disappearance of UV damage in human cells. Here, we report a modified Damage-seq method with improved sensitivity (HS–Damage-seq) to generate UV damage maps for both CPDs and (6-4)PPs, conduct kinetic experiments measuring damage disappearance from the genome, and compare with the kinetic XR-seq data measuring the release of the excision product (26-27-mer) from the genome (14) to assess the effects of various factors that influence damage formation and repair within cellular context. We find that both CPD and (6-4)PP formation are mainly determined by the underlying sequence and are essentially uniform throughout the genome with moderate modulating effects of some transcription factors. In contrast, we find that repair rates for CPD and (6-4)PPs are affected in significant and different ways by chromatin states, transcription factor binding, and transcription.
Results
HS-Damage-Seq.
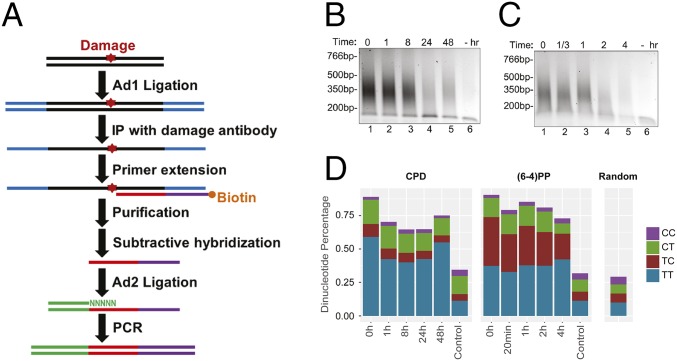
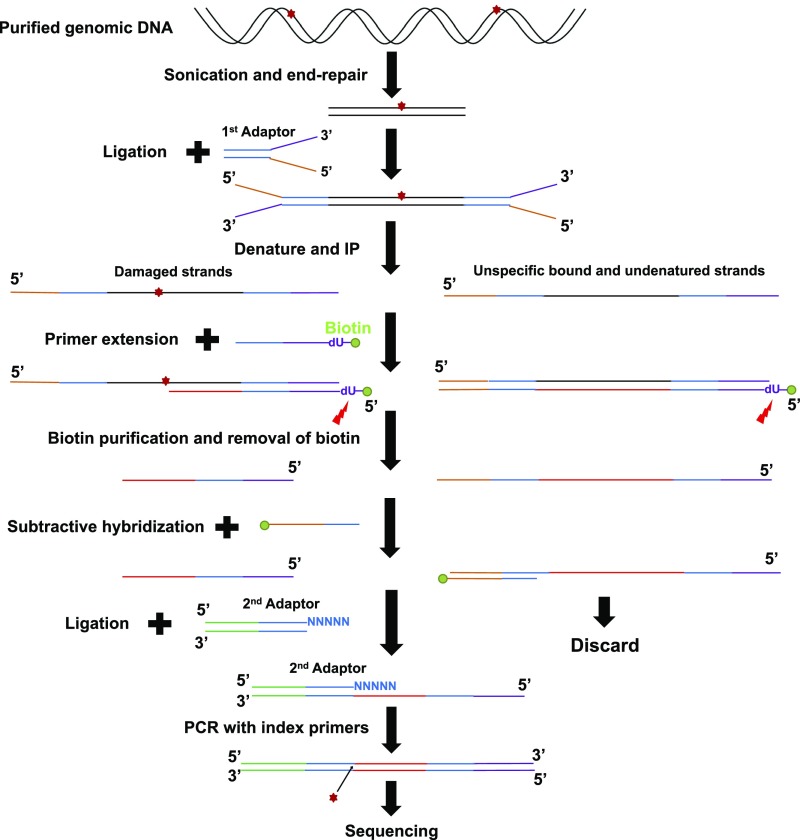
The conventional Damage-seq we described in a previous study detected the exact positions of damage by the blocked high-fidelity DNA polymerase and was used to map cisplatin-induced damage in human cells (13). However, this method in its original form was not sensitive enough to detect low levels of damage, such as damage induced by low dose of damaging agents or damage remaining after long periods of repair. To overcome this limitation, we modified Damage-seq to improve its sensitivity and named the new method HS-damage-seq (Fig. 1A and Fig. S1): First, we used NEBNext UltraII DNA Library Prep kit for end repair and first ligation steps because it gives higher yield than the NEBNext DNA Library Prep kit we previously used in preparing DNA for Damage-seq. This modification enables us to start with less genomic DNA (1 μg for HS–Damage-seq compared with 5 μg for the original Damage-seq). Moreover, in the original form of Damage-seq, undamaged strands were also amplified and sequenced, then discarded during the bioinformatic analysis based on the existence of 5′ sequence of the first adaptor. These discarded reads constituted 10–50% of the total for samples with relatively high damage level (13). The ratio increases when damage level is low as when the UV dose is low and it would also be substantially high at later time points after irradiation even with higher dose UV when most of the damage is removed, making the method of limited use for analysis of initial or early time points after damaging with low dose and terminal time points when most of the damage is removed. In HS–Damage-seq, we removed undamaged strands before amplification by subtractive hybridization with an oligomer identical to 5′ sequence of the first adaptor (Fig. 1A and Fig. S1). With this modification, the average ratio of discarded reads was 5% after the subtractive hybridization step, enabling us to apply this method on samples with relatively low damage levels.
Fig. 1.
HS–Damage-seq method. (A) Schematic of HS–Damage-seq. See Fig. S1 for details. (B and C) Gel verification of CPD (B) and (6-4)PP (C) libraries. DNA was extracted from UV-irradiated NHF1 cells at indicated time points after UV, and “−” means no UV. (D) Dipyrimidine frequencies at the predicted damage sites.
Fig. S1.
Schematic representation of HS–Damage-seq method. Genomic DNA from UV-treated cells was sonicated and subjected to end repair. Then the first adaptor was ligated to these end-repaired fragments. This step was followed by denaturation and IP with an antibody against specific DNA lesion. Next, a biotinylated primer (with a dU base) was annealed to the 3′ end of the first adaptor and extended by a DNA polymerase, which was blocked by DNA damage. The extension products were denatured and purified by streptavidin beads, then eluted by digesting the dU base. The unblocked extension products were then captured by biotinylated oligonucleotides identical to the 5′ end of the first adaptor and removed by streptavidin beads. Purified fragments were ligated to the second adaptor. Finally, the ligation products were amplified with index primers and sequenced.
HS–Damage-seq was used to monitor the distribution and repair kinetics of CPDs and (6-4)PPs in NHF1 human skin fibroblast cells, which were also used in our previous kinetic XR-seq experiment (14). As seen in Fig. 1 B and C, generally, with UV-treated samples the amounts of PCR products decreased with time as damage was being repaired, whereas PCR with undamaged samples yielded negligible products (Fig. 1 B and C) over the course of the experiment. The libraries were sequenced and aligned to the human genome and the photoproducts were taken to be the dinucleotides immediately 5′ upstream to the aligned reads (Fig. S1). As expected, dipyrimidines [mainly T–T for CPD, and T–T and T–C for (6-4)PP] were highly enriched at damage sites for all UV-treated samples, even at the final time points with very low damage level, whereas the undamaged samples had similar dipyrimidine level with random distribution (Fig. 1D), indicating the high sensitivity and specificity of HS–Damage-seq. Interestingly, the T–C to T–T ratio of (6-4)PPs decreased over the entire the repair time course, whereas the distribution of four dipyrimidines in CPDs did not change significantly. In contrast, in the complementary (6-4)PP XR-seq experiment, the T–C to T–T ratio in excised fragments remained unchanged for the first 2 h after UV, then modestly decreased at 4 h probably due to the change of this ratio at damage sites in the genome (Table S1) (14). Notably, these ratios in XR-seq, even at 4 h, were much higher than those in Damage-seq at any time point. Taken together, these results indicate that T–C (6-4)PPs are repaired faster than T–T (6-4)PP in human fibroblasts.
Table S1.
TC to TT ratio at the predicted damage sites retrieved from Damage-seq and XR-seq data sets of two replicates
| Method | 0 m (5 m*) | 20 m | 1 h | 2 h | 4 h |
| Damage-seq rep 1 | 0.88 | 0.82 | 0.61 | 0.69 | 0.46 |
| Damage-seq rep 2 | 0.98 | 0.86 | 0.78 | 0.67 | 0.49 |
| XR-seq rep 1 | 1.88 | 1.94 | 2.18 | 2.06 | 1.71 |
| XR-seq rep 2 | 2.05 | 1.79 | 1.92 | 2.00 | 1.61 |
*Initial time point for XR-seq was 5 min after irradiation, whereas it was 0 min for Damage-seq. Rep, replicate.
Effect of Transcription Factor Binding on Damage Formation.
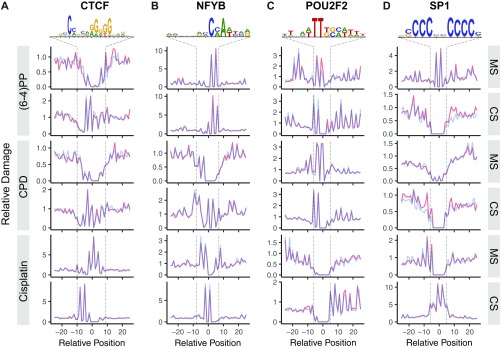
Analyses of our XR-seq data for UV photoproducts along with publicly available mutation data led to the discovery of a “volcano pattern” of repair and mutation pattern relative to transcription factor binding sequences. It was found that repair made a “crater” centered around the transcription factor binding site (TFBS), whereas mutations by UV and cigarette smoke exhibited an “eruption” in the center of the crater (15–18). It was thus concluded that TF binding inhibited excision repair causing the eruption of mutation centered at the TFBS. However, a study on UV-induced CPD formation in yeast suggested that TF binding may inhibit damage formation and thus might be responsible for the volcano effect (12). With the availability of high-resolution damage formation reported in this paper along with the repair maps for UV and cisplatin damage we have been able to address this issue directly. Our data show that TF binding may inhibit, stimulate, or have no effect on damage formation in a manner dependent on TF and the DNA damaging agent.
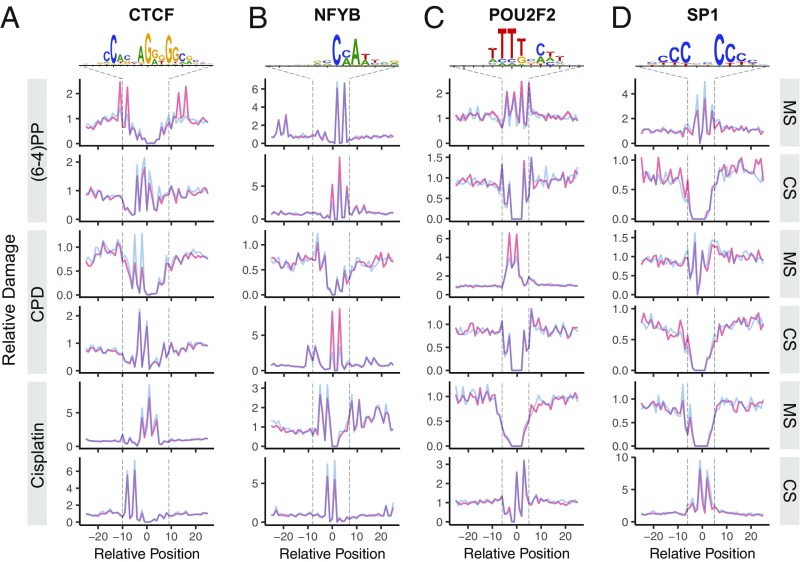
We examined UV- and cisplatin-damage formation at the TFBS for 19 TFs, which have at least 10,000 peaks. In Fig. 2, we report the effects of four commonly analyzed TFs on damage formation: CTCF (CCCTC-binding factor), NFYB (nuclear transcription factor Y subunit β), POU2F2 (POU class 2 homebox 2), and SP1 (specificity protein 1). The first remarkable observation was the effect of CTCF binding on (6-4)PP damage formation on the motif strand in which there is stimulation at one within-motif and three flanking positions (Fig. 2A). However, damage formation in the complementary strand as well as in both strands for CPD and cisplatin damage were inhibited upon CTCF binding. Another damage formation stimulatory effect was observed in the NFYB binding at the complementary strands for both UV-induced damage types, whereas the motif strand showed no clear differences (Fig. 2B). In contrast, cisplatin-damage formation was inhibited in both strands upon NFYB binding. POU2F2 binding resulted in mild and strong stimulatory effects on damage formation in the motif strands for (6-4)PP and CPD, respectively (Fig. 2C). Effects of POU2F2 on the complementary strand for UV-induced and motif strand for cisplatin damages were inconclusive due to lack of potential damage sites at these locations. Cisplatin-damage formation at the complementary strand showed no difference by POU2F2 binding. Finally, SP1 binding exhibits an inhibitory effect on formation at potential target sites for all three damage types (motif and complementary strands for UV and cisplatin damage, respectively) (Fig. 2D).
Fig. 2.
DNA bulky adduct formation at TFBSs for UV-induced (6-4)PP, CPD, and cisplatin-induced d(GpG) diadduct. Cell (in vivo damaged) and naked (in vitro damaged) DNA are shown in orange and blue, respectively. The x axis is scaled to show a 50-nucleotide window centering TFBS motif. The y axis shows the damage level as reads per base per thousand mapped (onto TFBS-centered 1-kb window) reads. Each read is assigned to a single nucleotide position. Motif strand (MS) is in 5′ → 3′ direction, whereas the complementary strand (CS) is in 3′ → 5′ direction. Transcription factors presented are (A) CTCF (number of TFBSs, n = 62,002), (B) NFYB (n = 12,452), (C) POU2F2 (n = 20,390) and (D) SP1 (n = 15,877). The sequence logos were computed by using the TF-binding sites that we predict. Unbound sites for these TFs are presented in Fig. S3.
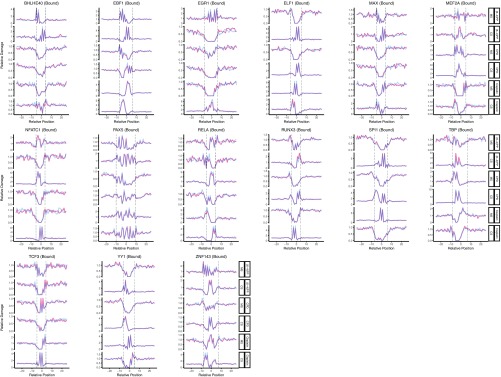
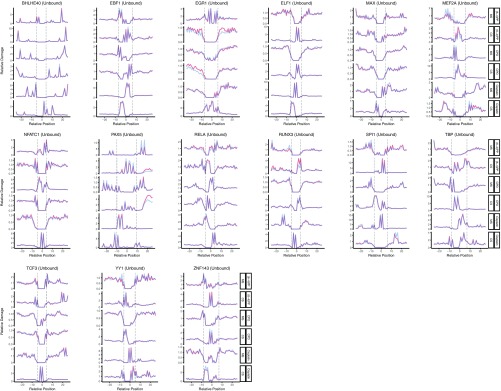
In summary, 11 of 19 TFs we analyzed showed inhibitory effect on cisplatin-damage formation when bound, whereas others caused no change except for one: ELF1 binding to DNA enhanced cisplatin-damage formation on the complementary strand only (Fig. S2). On the other hand, TF binding may have no effect, inhibit or stimulate photoproduct formation, depending on the type of the photoproduct and the DNA strand and the particular TF. The two strands can show opposite profiles of damage formation when TF is bound. Interestingly, the stimulatory effect was found to be more drastic in a few cases than the inhibitory one (Fig. 2 and Fig. S2). As a control, we analyzed the unbound motif sites throughout the genome for our TF set. We subtracted the TF bound sites (compiled from ChIP-seq data sets) from whole genome sequencing data and searched for the DNA motifs of each TF. As these sites were expected to be unbound DNA regions, we did not expect to see any difference between cell and naked DNA samples. Although the expectation was satisfied in general, there were some cases showing slight differential patterns between the two samples (Figs. S3 and S4). This difference may be due to the bound sites that were not identified by the ChIP-seq methods.
Fig. S2.
DNA damage formation at transcription factor binding sites, for UV-induced (6-4)PP, CPD, and cisplatin-induced damages. The examined transcription factors are BHLE40, EBF1, EGR1, ELF1, MAX, MEF2A, NFATC1, PAX5, RELA, RUNX3, SPI1, TBP, TCF3, YY1, and ZNF143. Cell (in vivo damaged) and naked (in vitro damaged) DNA are shown in orange and blue, respectively.
Fig. S3.
Damage formation at the unbound motif sites. Cell and naked DNA are shown in orange and blue, respectively. Motif sites are compiled from unbound (genomic regions with no called TF ChIP-seq peaks for the GM12878 cell line) for (A) CTCF, (B) NFYB, (C) POU2F2, and (D) SP1 binding site motifs. The sequence logos were computed by the ensemble of motif sites that we retrieved.
Fig. S4.
DNA damage formation at unbound transcription factor motif sites, for UV-induced (6-4)PP, CPD, and cisplatin-induced damages. Cell (in vivo damaged) and naked (in vitro damaged) DNA are shown in orange and blue, respectively.
DNA Repair and Damage Maps Complement Each Other.
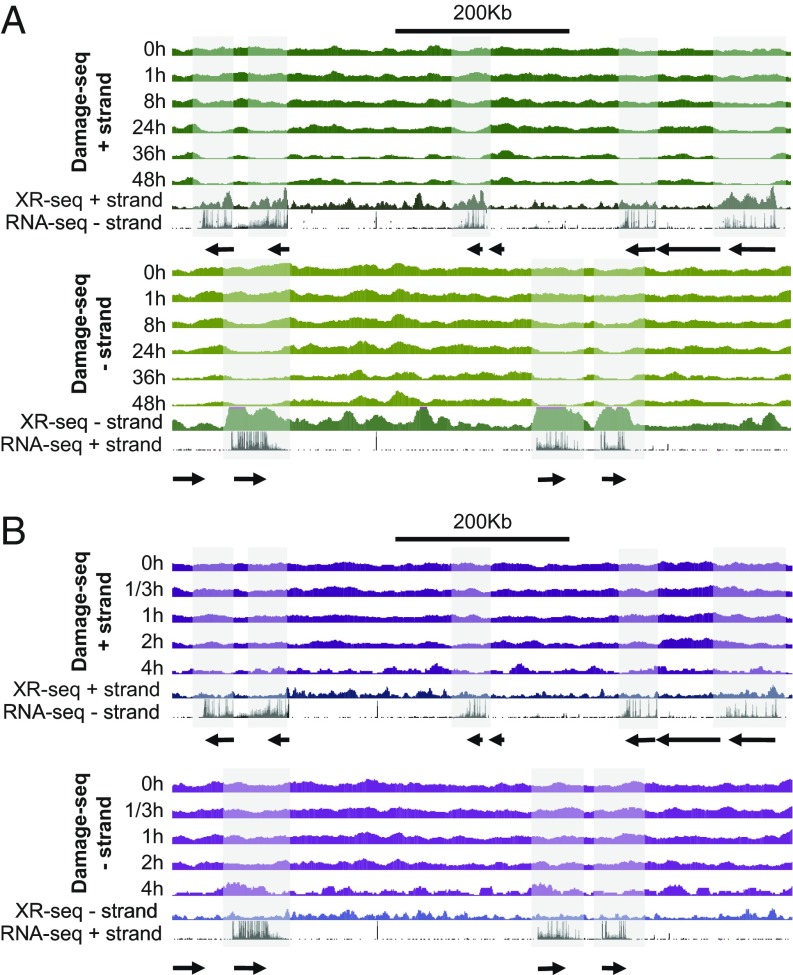
Dynamic repair maps for UV damage of the entire human genome reported previously exhibited considerable heterogeneity (14). The repair pattern differences throughout the genome were attributed to heterogeneous excision repair efficiencies. However, heterogeneity could have also been due to heterogenous damage distribution. This study rules out damage heterogeneity as an important contributor to repair heterogeneity by showing that the damage is uniformly distributed throughout the genome immediately after the damaging treatment. Thus, damage maps at the subsequent time points mainly reflect DNA repair. The complementarity of the measure of repair by the HS–Damage-seq and XR-seq methods is evident when analyzing transcribed regions (Fig. 3).
Fig. 3.
Patterns of damage distribution as a function of time. (A) CPD and (B) (6-4)PP damage distribution within a ∼0.9-Mb region of chromosome 9 (100,137,675–101,036,695). For each panel, Top shows the Damage-seq of different time points and initial XR-seq. [1 h for CPD and 5 min for (6-4)PP] reads mapped onto the plus strand and relevant RNA-seq reads mapped on the minus strand. Bottom represents the complementary strands. The shadows highlight transcribed genes on each strand.
We note that, in comparing the repair maps obtained by subtractive Damage-seq and XR-seq, the following points need to be considered. On the one hand, XR-seq measures repair directly by capturing the excision products that reflect the actual repair events. Because the excised oligomers have a half-life of ∼10 min before being degraded (19), XR-seq provides a snapshot of repair at the sampling time point. In contrast, damage-seq measures repair indirectly by subtracting damage distribution at a later time point from the initial time point, thus generating a cumulative repair map during the time course.
Taking these factors into account, it is apparent that CPDs are strongly affected by transcription-coupled repair (TCR), which is basically transcription-dependent enhancement of the repair efficiency of the transcribed strand relative to its complementary strand and nontranscribed regions of the genome (20). Due to this property, CPD damage maps after the initial time point show dips at the transcribed strand, which correlated well with the associated peaks in the repair map (Fig. 3A). In the nontranscribed strand, the damage distribution remains uniform compared with the flanking regions. On the other hand, the (6-4) photoproduct damage maps do not exhibit the strand-specific heterogeneity observed in CPD damage maps at the transcribed regions (Fig. 3B). This is because the (6-4) photoproducts are repaired by the core repair machinery efficiently and therefore are only modestly affected by TCR (2, 19). Nevertheless, there is still a correlation between repair maps and subtractive damage maps; more efficiently repaired regions (XR-seq) were found to have fewer damages at later time points.
Dynamics of CPD Damage and Repair.
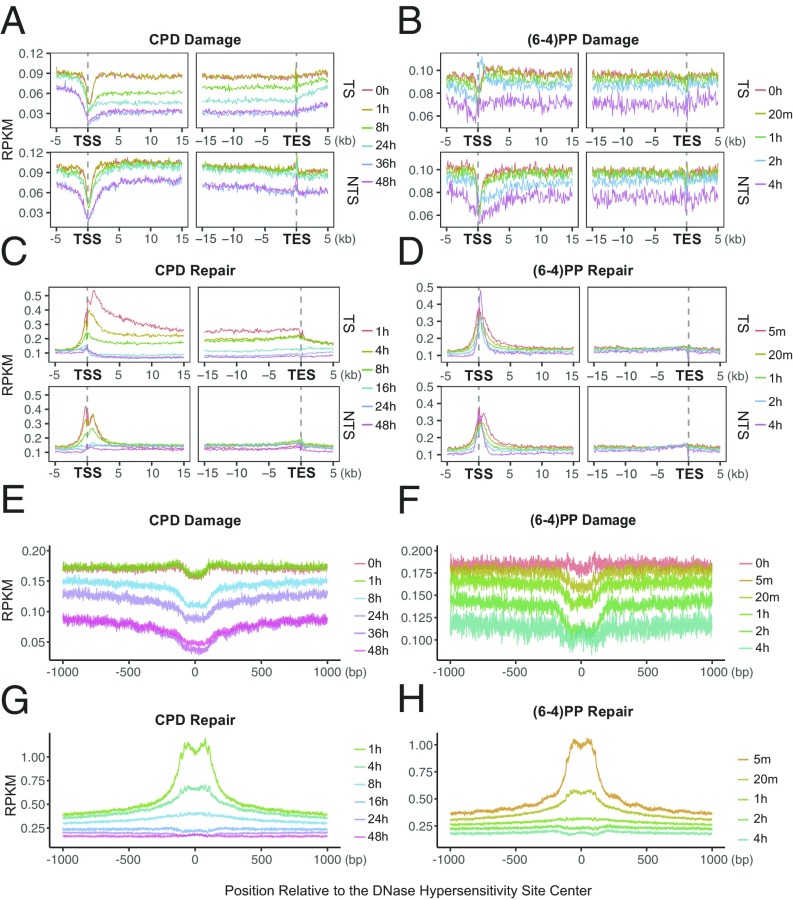
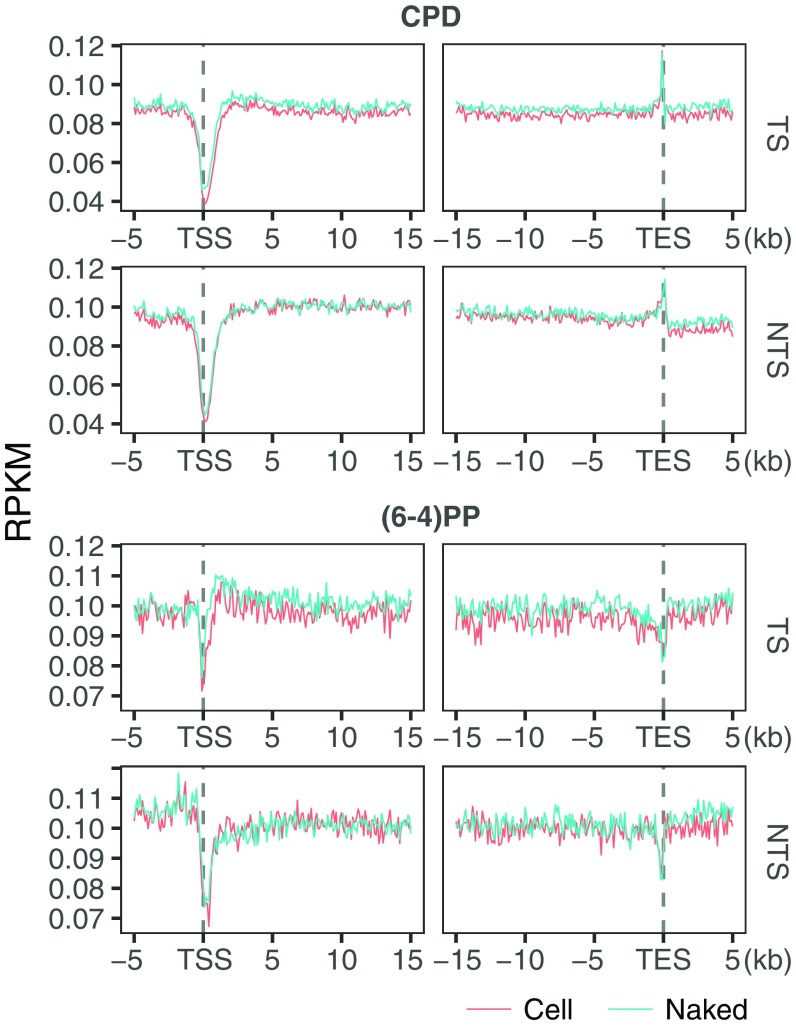
We examined damage and repair maps at each time point after UV irradiation at the transcription start sites and end sites (TSS and TES) of the highly transcribed regions (Fig. 4 A–D) (14). To eliminate potential confounding effects of convergent transcription, we removed overlapping transcripts. Because of TCR, we expected damage level in the transcribed strand to decrease with time more rapidly relative to pre-TSS and post-TES regions. At the initial time point, upstream and downstream of TSS there were comparable levels of CPDs in both strands (Fig. 4A). A slight difference between the two sides (upstream and downstream) and the nonuniform damage distribution around TSS at the initial time point are mainly due to sequence context: cell and naked DNA samples show highly similar profiles (Fig. S5). A sharp repair dip at the TSS early repair time points (Fig. 4C) is explained by the relative rare damages centered at TSS (Fig. 4A).
Fig. 4.
UV-induced damage and repair profiles at transcribed and at DNase hypersensitive regions. The y axis shows the number of reads per kilobase per million mapped reads (RPKM) and the x axis shows the relative distance to the related genomic element. (A) CPD, (B) (6-4)PP damage, (C) CPD, and (D) (6-4)PP repair distribution along with the transcription start and end sites for nonoverlapping transcripts that are longer than 15 kb (n = 5,025). Each data point is an RPKM value at a 200-bp binned window. (E) CPD, (F) (6-4)PP damage, (G) CPD, and (H) (6-4)PP repair distribution along with the DNase hypersensitivity sites (n = 162,164). The zero point on the x axis was taken as the center of the called region. Each data point is an RPKM value at a single nucleotide position. Data represented are from two merged biological replicates.
Fig. S5.
UV-induced cell and naked DNA damage profiles at transcription start and end sites.
In comparing repair measured by XR-seq and HS–Damage-seq we observed that TCR of CPD is maximum in 1 h (Fig. 4C), whereas there was no difference between 0- and 1-h time points of damage profiles (HS–Damage-seq) because the absolute repair levels are very low compared with total damage present over this period (21, 22). This observation demonstrates the advantage of using XR-seq and Damage-seq in combination to have a comprehensive view of cellular processing of DNA damage.
Starting with the next time point, 8 h, we see a clear reflection of TCR in the TS as measured by HS–Damage-seq. Although the overall damage at the transcribed and neighboring regions also decreased after 8 h, the decrease at the gene body for the TS is much more dramatic (Fig. 4A, Top). At the later time points, 36 and 48 h, the consequence of TCR on damage in the TS is still visible, although the difference is not as large as it is at the 24-h time point. The closing of the gap between damage levels of TS and its flanking region is due to the depletion of damage in the TS and the relative increase of repair at the flanking regions (Fig. 4C). Although the differential damage levels in and around TES are not as dramatic as around TSS, the difference patterns caused by TCR are similar. The fact that there was no sharp relative increase at the damage levels at the later time points can be attributed to the relatively ambiguous transcription stop points. In any event, the most remarkable TCR-caused damage level difference between gene body and flanking regions was observed at 24 h for both TSS and TES in the transcribed strand. The profiles at 36 and 48 h were similar to each other and resulted in reduced TCR-caused difference compared with 24 h.
There is a mild decrease in the TCR-caused difference between genic vs. nongenic sites at 48 h relative to the 36-h time point due to the abundant damages left at the flanking regions. In the nontranscribed strand, CPDs were at comparable levels for transcribed and flanking regions. However, unlike the transcribed strand, this pattern does not change with time. Overall, reduction of damage is due to the fast repair of open chromatin states where actively transcribed genes are located. An increase in the relative damage level in genic regions at 48 h compared with 36 h is due to the fact that damage in the heterochromatin start to get repaired at later time points.
Dynamics of (6-4)PP Damage and Repair.
In contrast to CPD, (6-4)PP damage distribution over the course of the experiment is not substantially affected by TCR (Fig. 4B). Even though, at 0 and 20 min damage levels measured by HS–Damage-seq overlap (due to limited sensitivity of the method), throughout the following time points there is an overall gradual decrease in both gene body and flanking regions as well as for both TS and NTS. Although the overall patterns of the different time points look similar, there are some differences at particular locations: A damage peak is observed at 2 h in the transcribed strand at the 5′ of TS-TSS (also at the 3′ of NTS-TSS to a lesser extent). The early repair profiles can explain this observation (Fig. 4D): There is a repair trough at the corresponding site. This repair inhibition was explained by the presence of a nucleosome after the TSS (14). Furthermore, the damage peak region seen at 2 h is repaired more efficiently at the late time points (4 h) as we observe repair peaks for both strands (Fig. 4D).
Damage and Repair at DNaseI Hypersensitivity Sites.
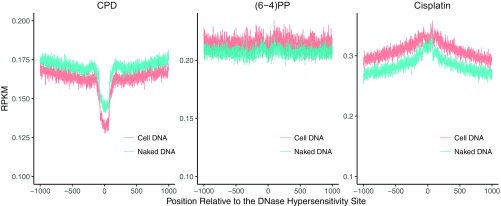
We have previously reported that both CPDs and (6-4)PPs are repaired more efficiently at open chromatin regions (14), particularly at the early time points. This is consistent with the conventional view that DNaseI hypersensitivity sites (DHSs) are more accessible to repair proteins. We examined the time-course damage profiles at DNaseI hypersensitivity sites in human skin fibroblasts (Fig. 4 E–H). Not surprisingly, with time, relative damage levels at these sites decrease (Fig. 4 E and F). Moreover, the patterns surrounding DHSs also exhibit some differences. Although the initial time point damage distributions were affected by the sequence context per se (Fig. S6) a slope pointing to the DHS center appears with time (Fig. 4 E and F). The final time point of the relative CPD damage level was found to be slightly higher than the previous time point (Fig. 4F) indicating that at the late time points, other regions, which contain more damages, are being repaired at relatively higher levels (Fig. 4G). Although the overall (6-4)PP damage level at the latest time point is lower than the previous one (Fig. 4F), the dip magnitude at the center is decreased, suggesting that flanking regions are repaired well at the late time points (Fig. 4H).
Fig. S6.
UV- and cisplatin-induced cell and naked DNA damage profiles at DNase hypersensitivity sites.
Effect of Chromatin States on Damage Formation and Repair.
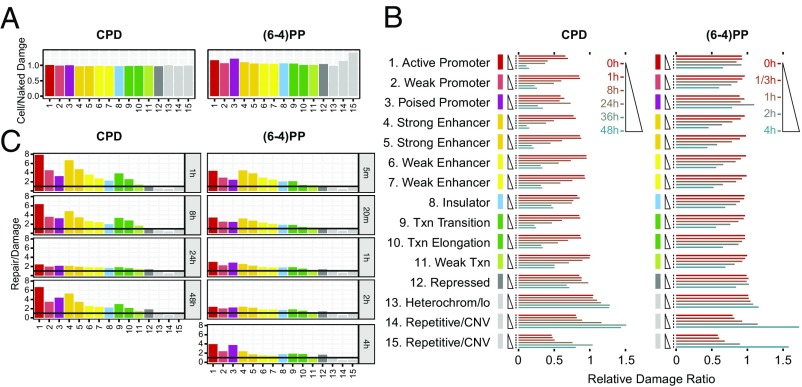
Active chromatin regions, which are accessible to excision repair machinery, are repaired faster than repressed/heterochromatic regions (14, 23–26). However, whether there is a preference in damage formation among chromatin states was not known. To address this issue, we compared UV photoproduct formation in cell and naked DNA. The ratio of CPD formation in cell-to-naked DNA reveals uniform damage formation for each chromatin state (Fig. 5A) (27). Cell-to-naked DNA ratio of (6-4)PP formation shows essentially a similar pattern with a few exceptions. Active and poised promoter states as well as the repetitive regions had higher damage levels in the cell DNA compared with naked DNA. In contrast, the heterochromatin region has mildly less (6-4)PP formation in cellular DNA.
Fig. 5.
Damage and repair as a function of chromatin states. (A) Cell/naked DNA damage ratio. The effect of genomic states on damage formation is computed by taking the ratio of DNA damage in cell to damage in naked DNA. (B) Relative ratio of total reads normalized by the total input DNA mapping onto each chromatin state. The y axis, which is grouped by chromatin states, shows the time points from 0 to 48 h for CPD and from 0 to 4 h for (6-4)PP. The x axis shows the relative damage ratio. (C) Repair normalized to corresponding damage level. Although some chromatin states have identical names, the 15 states are de novo defined by the combination of histone modifications and CTCF binding. As a result, states 4 and 6 are more enriched around TSS than states 5 and 7.
We also examined the relative damage levels for each chromatin state during 48-h and 4-h time courses for CPD and (6-4)PP, respectively (Fig. 5B). The first two time points for both damage types exhibited similar levels, which is in agreement with the damage levels at transcription and DNaseI hypersensitivity sites (Fig. 4). Starting at 8 h for CPD and at 1 h for (6-4)PP, the relative damage levels in the active chromatin states decrease. Interestingly, poised promoter and repressed states exhibited a different pattern: relative damage levels peaked at 24 h for CPD and at 2 h for (6-4) photoproducts and dropped precipitously at the following time point. In comparison, relative damage levels of heterochromatin and repetitive regions gradually increase compared with other states. At 48 h, there is a tendency of resetting the initial relative CPD levels: whereas relative damage in active states increases, it decreases in the inactive states.
To relate repair dynamics determined directly by XR-seq to that obtained by subtractive HS–Damage-seq, we investigated the repair profiles normalized by damage counts at each chromatin state (Fig. 5C). The repair profiles exhibited an essentially expected scenario: high and low repair levels at active and inactive states, respectively, at the initial time points. Although repair preference on chromatin states levels out at certain time points [24 h for CPD and 2 h for (6-4)PP], at the late time points, the repair preference on some active states is regained. Specifically, active and poised promoters for both photoproducts and strong enhancer and transcription-associated states for CPD are repaired preferentially, even though at the late time points the absolute damage counts on these chromatin states are very low compared with heterochromatin and repetitive regions (Fig. 5B).
Discussion
Recently, methods have been developed for studying repair dynamics genome-wide (6, 12, 28). One of these XR-seq and its later versions measure repair directly (6, 13, 14, 29). Briefly, the 26-27-mer oligos generated by the excision repair reaction are isolated and after appropriate processing are sequenced and aligned to the genome to generate quantitative repair maps. Because the excised 26-27-mers have a half-life of ∼10 min (before being degraded by nucleases) (19) XR-seq data reflect the repair events having taken place within the ∼10 last minutes before sampling and thus provide a snapshot of the repair reaction rather than a cumulative measure of repair. Whereas quite informative, XR-seq, in isolation, is not suitable for rigorous quantitative estimates of repair rates at specific regions because it measures only repair but not the level of damage where the repair signal is coming from. The second group of methods measure damage levels at certain times after the damaging treatment and the repair level is inferred from the amount of damage remaining at successive time frames (subtractive Damage-seq). These methods are useful for investigating repair dynamics only when a substantial level of repair has taken place. Thus, subtractive Damage-seq is incapable of measuring repair of ∼10% of the damage in a given chromatin state because this level of variability is within the experimental error of these methods. In contrast, XR-seq having virtually zero background is capable of measuring repair down to 0.1% of damage for a given region. Thus, the combination of XR-seq with the HS-damage-seq we describe here makes it possible to measure damage and repair independently and simultaneously at unprecedented sensitivity to better define genomic features of UV damage formation and repair and their consequences for UV carcinogenesis.
It has been reported that transcription factor binding to DNA impairs nucleotide excision repair (15–17). In these studies, which were based on analyses of our XR-seq data, excised fragments were found to be underrepresented at TFBSs, which was attributed to the reduced accessibility of DNA upon TF binding, leaving excision repair machinery out of the damage site. This interpretation was supported by the mutation enrichment at the TF-bound regions. However, in a study where CPDs were mapped on the Saccharomyces cerevisiae genome, the authors raised the possibility of reduced damage formation at TFBSs as exemplified by the inhibitory effect of some TF binding on CPD formation (12). In contrast, ligation-mediated PCR results have indicated that TF binding could enhance UV damage formation at specific loci in human cells (30). Hence, there was a need for a more comprehensive analysis of this question. Here, we found that TF binding can affect the damage formation in three studied damage types [CPD, (6-4)PP, and cisplatin-d(GpG)]. Our data show there is no uniform effect of TF binding on damage formation. The damage formation depends on the particular TF, the strand, damage type, as well as the position. Therefore, the issue of damage formation at TFBSs and the effect of TF binding on repair must be addressed on a case-by-case basis and with consideration of the particular DNA damage. This variation suggests the effect is likely to be caused by the structural changes that occurred in DNA upon protein binding. Because each TF has its own binding mode that causes base rotation and unwinding, damage formation profiles would also be different (30). Thus, the mutation enrichment at the TFBS could also be trivially contributed by the enhanced damage formation, and the bias in damage formation should be taken into account when interpreting the mutagenesis likelihood in TFBSs.
However, cisplatin-induced bulky adduct formation is generally inhibited with few exceptions, suggesting that cisplatin has limited access to the TF-occupied DNA. It is worth noting that, whereas UV damage is instant, cisplatin-induced damage formation is progressive. During the time cisplatin was allowed to damage DNA (1.5 h), a change in TF binding pattern and repair of initial damages might have started. Because some of the bound TF binding sites might get left unbound after cisplatin treatment (31), such a change would minimize the observed TFBS damage formation difference between cellular and naked DNA treatment. On the other hand, because total repair during the first 1.5 h is very low and repair is inhibited at the TFBS, we expect not only a minor but also an opposite effect of repair in the observed damage formation inhibition at the TFBS. For these reasons, with respect to cisplatin-induced damage, a TFBS showing a decrease when TF is bound is likely to be real, whereas a TFBS exhibiting no difference could be a false negative.
In conclusion, we believe that the methodology and data presented in this paper will aid in providing a more comprehensive platform for both DNA damage-induced mutagenesis/carcinogenesis as well as potentially for cisplatin-induced damage and repair in drug sensitive and resistant cancers.
Materials and Methods
Cell Culture and UV Treatment.
Normal human fibroblast 1 (NHF1) (obtained from W. K. Kaufmann, University of North Carolina at Chapel Hill, Chapel Hill, NC) and human lymphocyte GM12878 (purchased from Coriell) were cultured as previously described (6, 13). Cells were irradiated with 20J/m2 [for both damage in GM12878 and (6-4)PP in NHF1] or 10J/m2 (for CPD in NHF1) of UVC. Cells were collected immediately or after a desired time, followed by genomic DNA extraction. For naked damaged DNA, genomic DNA extracted from untreated cells was irradiated with 20J/m2 UVC.
High-Sensitivity Damage-Seq and Reference Genome Sequencing.
HS-damage-seq was modified from the original Damage-seq. (13) by using the NEBNext Ultra II DNA Library Prep kit and adding a subtractive hybridization step. Libraries for reference genome sequencing were constructed from 100 ng of sheared undamaged genomic DNA by the NEBNext Ultra II DNA Library Prep kit. All libraries were sequenced from both ends on the Hiseq 2500 platform by the University of North Carolina High-Throughput Sequencing Facility. Detailed description of the methods and data analysis can be found in SI Materials and Methods.
SI Materials and Methods
Cell Lines.
Normal human fibroblast 1 (NHF1) was obtained from W. K. Kaufmann, UNC, Chapel Hill, NC (32) and cultured in DMEM supplemented with 10% FBS and 2 mM glutamine. Human lymphocyte GM12878 was purchased from the National Institute of General Medical Sciences Human Genetic Cell Repository (Coriell Institute) and cultured in RPMI medium 1640 (no phenol red) supplemented with 15% FBS. Cells were maintained at 37 °C in a 5% CO2 humidified chamber.
Oligonucleotides and Adaptors.
Oligonucleotides for Ad1 are as follows: AD1T: 5′-phos-GATCGGAAGAGCACACGTCTGAACTCCAGTCA-SpC3; AD1B: 5′-NNNNNGACTGGTTCCAATTGAAAGTGCTCTTCCGATC*T. Oligonucleotides for Ad2 are as follows: AD2T: 5′-phos-AGATCGGAAGAGCGTCGTGTAGGGAAAGAGTGT-SpC3; AD2B: 5′-ACACTCTTTCCCTACACGACGCTCTTCCGATCTNNNNN-SpC3. Adaptors Ad1 and Ad2 were prepared by annealing the two oligonucleotides as described previously (13).
Oligonucleotides for primer extension and subtractive hybridization are as follows: Bio3U: 5′-bio-AGAGTG/dU/GACTGGAGTTCAGACGTGTGCTCTTCCGATCT; SH: 5′-bio-NNGACTGGTTCCAATTGAAAGTGCTCTTCCG-SpC3. The above oligonucleotides were synthesized by IDT. Universal and index primers for library preparation were purchased from New England Biolabs.
UV Treatment and Extraction of Genomic DNA.
UV irradiation of NHF1 cells was performed as described previously (21). Briefly, the culture medium was removed from ∼80% confluent cells in one R150 dish, then cells were irradiated under a GE germicidal lamp emitting primarily 254-nm UV light (1 J/m2/s) connected to a digital timer for 20 s [for (6-4)PP damage] or 10 s (for CPD damage). Following irradiation, the dishes were put on ice immediately or incubated in a chamber for the indicated time with culture medium. The cells were then washed once with ice-cold PBS and harvested with a cell scraper in PBS and collected by centrifugation. GM12878 cells were grown to ∼8 × 10⁵ cells per milliliter in colorless medium and 10 mL of cells was transferred to one R150 dish and irradiated with 20J/m2 UVC as described above. Then cells were immediately transferred to a prechilled 15-mL tube on ice, collected by centrifugation, and washed with ice-cold PBS. Cell pellets were frozen at −80 °C until genomic DNA were extracted by PureLink Genomic DNA kit (Thermo). For UV irradiation of naked DNA, purified genomic DNA in 100 µL of 1× TE buffer was irradiated with 20J/m2 UVC and stored at −20 °C for further use.
High-Sensitivity-Damage-Seq Library Preparation and Sequencing.
Genomic DNA was sheared by sonication with a Q800 Sonicator (Qsonica) to generate fragments averaging 600 bp in length and then purified by an equal volume of HighPrep PCR beads (MagBio). DNA fragments were eluted by 0.1× TE and the concentration was determined by Qubit (Thermo).
Purified DNA fragments (1 µg) were used for end repair by the NEBNext Ultra II DNA Library Prep kit (New England Biolabs) following the manufacturer’s instructions. Ad1 (100 pmol) was ligated to both ends at 16 °C overnight, then purified by HighPrep PCR beads (60 µL) and eluted in 55 µL of 0.1× TE.
Damaged DNA immunoprecipitation was performed as described previously with modification. DNA was denatured by adding 20 µL of 8 M urea, boiling for 1 min, and immediately putting it in ice water for 1 min. Then 20 µg of denatured sonicated salmon sperm DNA (Thermo) and 11 µL 8× IP buffer (1× IP buffer: 20 mM Tris-HCl pH 8.0, 2 mM EDTA, 150 mM NaCl, 1% Triton X-100, and 0.5% sodium deoxycholate) was added, followed by incubation with antibody-coated beads, which were prepared as described previously (6) at 4 °C overnight.
The beads were then washed sequentially with wash buffer U (20 mM Tris-HCl pH 8.0, 2 mM EDTA, 1% Triton X-100, and 2 M urea), wash buffer II (20 mM Tris-HCl pH 8.0, 2 mM EDTA, 500 mM NaCl, 1% Triton X-100, and 0.1% SDS), wash buffer III (10 mM Tris-HCl pH 8.0, 1 mM EDTA, 150 mM LiCl, 1% Nonidet P-40 substitute Igepal CA-630, and 1% sodium deoxycholate), wash buffer IV (100 mM Tris-HCl pH 8.0, 1 mM EDTA, 500 mM LiCl, 1% Nonidet P-40 substitute Igepal CA-630, and 1% sodium deoxycholate), and TE (10 mM Tris-HCl pH 8.0 and 1 mM EDTA) at room temperature. The fragments containing damage were eluted by incubation with 100 µL of elution buffer (50 mM NaHCO3, 1% SDS) at 65 °C for 10 min on a thermomixer at 1,100 rpm. The eluted DNA was then isolated by phenol/chloroform extraction followed by ethanol precipitation.
Primer Bio3U was attached to IP purified DNA and extended by NEBNext Q5 DNA polymerase, followed by ExoI (New England Biolabs) treatment and HighPrep PCR beads cleanup, then denatured and captured by Dynabeads MyOne Streptavidin C1 (Thermo) as described previously (13). After incubation at 4 °C for 1 h, the beads were washed by 1× B&W buffer (5 mM Tris-HCl pH 7.5, 0.5 mM EDTA, 1 M NaCl) and 1× TE, followed by incubation with 2 µL of USER enzyme (New England Biolabs) in 18 µL of 0.1× TE at 37 °C on a thermomixer at 900 rpm for 25 min. The supernatant was separated by the magnetic stand and transferred to a new tube. Then the beads were washed with 25 µL of 1× B&W buffer and the supernatant was collected and combined with supernatant from the last step. For subtractive hybridization, 20 pmol of oligo SH was added, followed by boiling for 1 min and naturally cooling down to room temperature. Oligo SH was then captured by incubating with 10 µL of Dynabeads MyOne Streptavidin C1 for 1 h at room temperature. After separating the liquid on a magnet and transferring supernatant to a new tube, the beads were washed with 35 µL of 1× B&W buffer and the supernatant was transferred to the same tube. DNA was purified by phenol/chloroform extraction and ethanol precipitation.
The following ligation of Ad2 and PCR amplification were performed as described previously (13). Libraries were sequenced from both ends on the Hiseq 2500 platform by the University of North Carolina High-Throughput Sequencing Facility.
Reference Genome Sequencing.
Genomic DNA from undamaged NHF1 or GM12878 cells were sonicated to generate fragments averaging 600 bp in length as described above. Each 100 ng of sheared DNA was used for library preparation by NEBNext Ultra II DNA Library Prep kit following the manufacturer’s instructions. Three percent of ligation products were amplified by PCR and sequenced from both ends on the Hiseq 2500 platform by the University of North Carolina High-Throughput Sequencing Facility.
Genome Alignment and Visualization.
Damage-seq.
We removed the reads containing the adaptor sequence, 5′ GACTGGTTCCAATTGAAAGTGCTCTTCCGATCT 3′, at the 5′ end using Cutadapt version 1.12 (33). Paired-end reads were aligned with Bowtie (34) with parameters ‐‐nomaqround, ‐‐phred33-quals, -m 4, -X 1000, ‐‐seed123. The reference genome hg19 was downloaded from the University of California Santa Cruz (UCSC) genome browser. For each sample, duplicated reads were reduced to a single read. Damage sites were determined as the two nucleotides upstream of the fragment. All genomic location manipulations were performed using bedtools (35) and custom scripts. Further analyses were performed with the subset of reads chosen by the certain predicted damages. The two most common dipyrimidines [T–T and C–T for CPD, T–T and T–C for (6-4)PP] for UV and diguanines for cisplatin-induced predicted damages were selected. For viewing DNA damage signal on the UCSC genome browser, bigwig files were generated of read counts per 25-nt windows normalized to the total number of reads in each chromosome.
XR-seq.
The previously published data were retrieved through the GEO database processed as described in the original study (6).
Genomic Elements.
We retrieved the TFBS clusters together with input cell sources from ENCODE (hgdownload.cse.ucsc.edu/goldenpath/hg19/encodeDCC/wgEncodeRegTfbsClustered/wgEncodeRegTfbsClusteredV3.bed.gz). We filtered the genomic locations for the GM12878 cell line. Furthermore, only the TFs with more than 10,000 peaks called were taken into account. The JASPAR database (36) was used to retrieve TF motifs. TFs with motifs shorter than seven nucleotides were filtered out. To find the exact TFBS in the peak region, we searched for the best motif matching by computing scores calculated based on the position frequency matrices retrieved from the JASPAR database with a custom script. If a region contained more than three same best scores, that region was removed; otherwise all best scoring sites were taken into account. For unbound TF motif sites, we subtracted all of the TFBS clusters from our input DNA. Among these regions, we searched for TF motifs by using FIMO (37). The motif logos were computed using the compiled sequences for bound and unbound TF motifs with WebLogo3.0 (38).
Transcriptome data mapped on the hg19 reference genome were retrieved from UCSC. The transcripts with a score of 300 or more were taken into account. Among these, overlapping transcripts, which have a transcribed region 1 in the 6-kb vicinity, were removed. Transcripts shorter than 15 kb were also filtered out. The total number of transcribed regions was 5,025.
Open chromatin DNase hypersensitivity regions were retrieved from ENCODE (ftp://hgdownload.cse.ucsc.edu/goldenPath/hg19/encodeDCC/wgEncodeAwgDnaseUniform) for GM128787 and BJ (instead of NHF1) cell lines.
Chromatin state coordinates were retrieved from ENCODE. Because chromatin state data were not available for the NHF1 cell line, we used map NHF1 damage and repair data onto NHLF chromatin states. Reference genome DNA was used to calculate the relative ratio of total damage and repair for each chromatin state.
Footnotes
The authors declare no conflict of interest.
Data deposition: The data reported in this paper have been deposited in the Gene Expression Omnibus (GEO) database, www.ncbi.nlm.nih.gov/geo (accession no. GSE98025).
This article contains supporting information online at www.pnas.org/lookup/suppl/doi:10.1073/pnas.1706522114/-/DCSupplemental.
References
- 1.Wood RD. Nucleotide excision repair in mammalian cells. J Biol Chem. 1997;272:23465–23468. doi: 10.1074/jbc.272.38.23465. [DOI] [PubMed] [Google Scholar]
- 2.Reardon JT, Sancar A. Nucleotide excision repair. Prog Nucleic Acid Res Mol Biol. 2005;79:183–235. doi: 10.1016/S0079-6603(04)79004-2. [DOI] [PubMed] [Google Scholar]
- 3.Sancar A. Mechanisms of DNA repair by photolyase and excision nuclease (Nobel Lecture) Angew Chem Int Ed Engl. 2016;55:8502–8527. doi: 10.1002/anie.201601524. [DOI] [PubMed] [Google Scholar]
- 4.Mao P, Wyrick JJ, Roberts SA, Smerdon MJ. UV-induced DNA damage and mutagenesis in chromatin. Photochem Photobiol. 2017;93:216–228. doi: 10.1111/php.12646. [DOI] [PMC free article] [PubMed] [Google Scholar]
- 5.Hu J, Adar S. The cartography of UV-induced DNA damage formation and DNA repair. Photochem Photobiol. 2017;93:199–206. doi: 10.1111/php.12668. [DOI] [PMC free article] [PubMed] [Google Scholar]
- 6.Hu J, Adar S, Selby CP, Lieb JD, Sancar A. Genome-wide analysis of human global and transcription-coupled excision repair of UV damage at single-nucleotide resolution. Genes Dev. 2015;29:948–960. doi: 10.1101/gad.261271.115. [DOI] [PMC free article] [PubMed] [Google Scholar]
- 7.Besaratinia A, Pfeifer GP. Measuring the formation and repair of UV damage at the DNA sequence level by ligation-mediated PCR. Methods Mol Biol. 2012;920:189–202. doi: 10.1007/978-1-61779-998-3_14. [DOI] [PMC free article] [PubMed] [Google Scholar]
- 8.Li S, Waters R, Smerdon MJ. Low- and high-resolution mapping of DNA damage at specific sites. Methods. 2000;22:170–179. doi: 10.1006/meth.2000.1058. [DOI] [PubMed] [Google Scholar]
- 9.Zavala AG, Morris RT, Wyrick JJ, Smerdon MJ. High-resolution characterization of CPD hotspot formation in human fibroblasts. Nucleic Acids Res. 2014;42:893–905. doi: 10.1093/nar/gkt912. [DOI] [PMC free article] [PubMed] [Google Scholar]
- 10.Powell JR, et al. 3D-DIP-Chip: A microarray-based method to measure genomic DNA damage. Sci Rep. 2015;5:7975. doi: 10.1038/srep07975. [DOI] [PMC free article] [PubMed] [Google Scholar]
- 11.Bryan DS, Ransom M, Adane B, York K, Hesselberth JR. High resolution mapping of modified DNA nucleobases using excision repair enzymes. Genome Res. 2014;24:1534–1542. doi: 10.1101/gr.174052.114. [DOI] [PMC free article] [PubMed] [Google Scholar]
- 12.Mao P, Smerdon MJ, Roberts SA, Wyrick JJ. Chromosomal landscape of UV damage formation and repair at single-nucleotide resolution. Proc Natl Acad Sci USA. 2016;113:9057–9062. doi: 10.1073/pnas.1606667113. [DOI] [PMC free article] [PubMed] [Google Scholar]
- 13.Hu J, Lieb JD, Sancar A, Adar S. Cisplatin DNA damage and repair maps of the human genome at single-nucleotide resolution. Proc Natl Acad Sci USA. 2016;113:11507–11512. doi: 10.1073/pnas.1614430113. [DOI] [PMC free article] [PubMed] [Google Scholar]
- 14.Adar S, Hu J, Lieb JD, Sancar A. Genome-wide kinetics of DNA excision repair in relation to chromatin state and mutagenesis. Proc Natl Acad Sci USA. 2016;113:E2124–E2133. doi: 10.1073/pnas.1603388113. [DOI] [PMC free article] [PubMed] [Google Scholar]
- 15.Sabarinathan R, Mularoni L, Deu-Pons J, Gonzalez-Perez A, López-Bigas N. Nucleotide excision repair is impaired by binding of transcription factors to DNA. Nature. 2016;532:264–267. doi: 10.1038/nature17661. [DOI] [PubMed] [Google Scholar]
- 16.Perera D, et al. Differential DNA repair underlies mutation hotspots at active promoters in cancer genomes. Nature. 2016;532:259–263. doi: 10.1038/nature17437. [DOI] [PubMed] [Google Scholar]
- 17.Poulos RC, et al. Functional mutations form at CTCF-cohesin binding sites in melanoma due to uneven nucleotide excision repair across the motif. Cell Reports. 2016;17:2865–2872. doi: 10.1016/j.celrep.2016.11.055. [DOI] [PubMed] [Google Scholar]
- 18.Khurana E. Cancer genomics: Hard-to-reach repairs. Nature. 2016;532:181–182. doi: 10.1038/532181a. [DOI] [PubMed] [Google Scholar]
- 19.Hu J, et al. Nucleotide excision repair in human cells: Fate of the excised oligonucleotide carrying DNA damage in vivo. J Biol Chem. 2013;288:20918–20926. doi: 10.1074/jbc.M113.482257. [DOI] [PMC free article] [PubMed] [Google Scholar]
- 20.Hanawalt PC, Spivak G. Transcription-coupled DNA repair: two decades of progress and surprises. Nat Rev Mol Cell Biol. 2008;9:958–970. doi: 10.1038/nrm2549. [DOI] [PubMed] [Google Scholar]
- 21.Gaddameedhi S, et al. Similar nucleotide excision repair capacity in melanocytes and melanoma cells. Cancer Res. 2010;70:4922–4930. doi: 10.1158/0008-5472.CAN-10-0095. [DOI] [PMC free article] [PubMed] [Google Scholar]
- 22.Mitchell DL, Haipek CA, Clarkson JM. (6-4)Photoproducts are removed from the DNA of UV-irradiated mammalian cells more efficiently than cyclobutane pyrimidine dimers. Mutat Res. 1985;143:109–112. doi: 10.1016/s0165-7992(85)80018-x. [DOI] [PubMed] [Google Scholar]
- 23.Lim B, Mun J, Kim YS, Kim S-Y. Variability in chromatin architecture and associated DNA repair at genomic positions containing somatic mutations. Cancer Res. 2017 doi: 10.1158/0008-5472.CAN-16-3033. [DOI] [PubMed] [Google Scholar]
- 24.Li S. Implication of posttranslational histone modifications in nucleotide excision repair. Int J Mol Sci. 2012;13:12461–12486. doi: 10.3390/ijms131012461. [DOI] [PMC free article] [PubMed] [Google Scholar]
- 25.Polak P, et al. Reduced local mutation density in regulatory DNA of cancer genomes is linked to DNA repair. Nat Biotechnol. 2014;32:71–75. doi: 10.1038/nbt.2778. [DOI] [PMC free article] [PubMed] [Google Scholar]
- 26.Zheng CL, et al. Transcription restores DNA repair to heterochromatin, determining regional mutation rates in cancer genomes. Cell Reports. 2014;9:1228–1234. doi: 10.1016/j.celrep.2014.10.031. [DOI] [PMC free article] [PubMed] [Google Scholar]
- 27.Ernst J, Kellis M. Discovery and characterization of chromatin states for systematic annotation of the human genome. Nat Biotechnol. 2010;28:817–825. doi: 10.1038/nbt.1662. [DOI] [PMC free article] [PubMed] [Google Scholar]
- 28.Yu S, et al. Global genome nucleotide excision repair is organized into domains that promote efficient DNA repair in chromatin. Genome Res. 2016;26:1376–1387. doi: 10.1101/gr.209106.116. [DOI] [PMC free article] [PubMed] [Google Scholar]
- 29.Adebali O, Chiou Y-Y, Hu J, Sancar A, Selby CP. Genome-wide transcription-coupled repair in Escherichia coli is mediated by the Mfd translocase. Proc Natl Acad Sci USA. 2017;114:E2116–E2125. doi: 10.1073/pnas.1700230114. [DOI] [PMC free article] [PubMed] [Google Scholar]
- 30.Pfeifer GP, Drouin R, Riggs AD, Holmquist GP. Binding of transcription factors creates hot spots for UV photoproducts in vivo. Mol Cell Biol. 1992;12:1798–1804. doi: 10.1128/mcb.12.4.1798. [DOI] [PMC free article] [PubMed] [Google Scholar]
- 31.Mymryk JS, Zaniewski E, Archer TK. Cisplatin inhibits chromatin remodeling, transcription factor binding, and transcription from the mouse mammary tumor virus promoter in vivo. Proc Natl Acad Sci USA. 1995;92:2076–2080. doi: 10.1073/pnas.92.6.2076. [DOI] [PMC free article] [PubMed] [Google Scholar]
- 32.Heffernan TP, et al. An ATR- and Chk1-dependent S checkpoint inhibits replicon initiation following UVC-induced DNA damage. Mol Cell Biol. 2002;22:8552–8561. doi: 10.1128/MCB.22.24.8552-8561.2002. [DOI] [PMC free article] [PubMed] [Google Scholar]
- 33.Martin M. Cutadapt removes adapter sequences from high-throughput sequencing reads. EMBnet. 2011;17:10–12. [Google Scholar]
- 34.Langmead B, Trapnell C, Pop M, Salzberg SL. Ultrafast and memory-efficient alignment of short DNA sequences to the human genome. Genome Biol. 2009;10:R25. doi: 10.1186/gb-2009-10-3-r25. [DOI] [PMC free article] [PubMed] [Google Scholar]
- 35.Quinlan AR. BEDTools: The Swiss-Army tool for genome feature analysis. Curr Protoc Bioinformatics. 2014;47:11.12.1–34. doi: 10.1002/0471250953.bi1112s47. [DOI] [PMC free article] [PubMed] [Google Scholar]
- 36.Mathelier A, et al. JASPAR 2016: A major expansion and update of the open-access database of transcription factor binding profiles. Nucleic Acids Res. 2016;44:D110–D115. doi: 10.1093/nar/gkv1176. [DOI] [PMC free article] [PubMed] [Google Scholar]
- 37.Bailey TL, Johnson J, Grant CE, Noble WS. The MEME Suite. Nucleic Acids Res. 2015;43:W39–W49. doi: 10.1093/nar/gkv416. [DOI] [PMC free article] [PubMed] [Google Scholar]
- 38.Crooks GE, Hon G, Chandonia J-M, Brenner SE. WebLogo: A sequence logo generator. Genome Res. 2004;14:1188–1190. doi: 10.1101/gr.849004. [DOI] [PMC free article] [PubMed] [Google Scholar]


