

Abstract
Airway inflammation is a hallmark of asthma, triggering airway smooth muscle (ASM) hyperreactivity and airway remodeling. TNFα increases both agonist-induced cytosolic Ca2+ concentration ([Ca2+]cyt) and force in ASM. The effects of TNFα on ASM force may also be due to an increase in Ca2+ sensitivity, cytoskeletal remodeling, and/or changes in contractile protein content. We hypothesized that 24 h of exposure to TNFα increases ASM force by changing actin and myosin heavy chain (MyHC) content and/or polymerization. Porcine ASM strips were permeabilized with 10% Triton X-100, and force was measured in response to increasing concentrations of Ca2+ (pCa 9.0 to 4.0) in control and TNFα-treated groups. Relative phosphorylation of the regulatory myosin light chain (p-MLC) and total actin, MLC, and MyHC concentrations were quantified at pCa 9.0, 6.1, and 4.0. Actin polymerization was quantified by the ratio of filamentous to globular actin at pCa 9.0 and 4.0. For determination of total cross-bridge formation, isometric ATP hydrolysis rate at pCa 4.0 was measured using an enzyme-coupled NADH-linked fluorometric technique. Exposure to TNFα significantly increased force across the range of Ca2+ activation but did not affect the intrinsic Ca2+ sensitivity of force generation. The TNFα-induced increase in ASM force was associated with an increase in total actin, MLC, and MyHC content, as well as an increase in actin polymerization and an increase in maximum isometric ATP hydrolysis rate. The results of this study support our hypothesis that TNFα increases force generation in ASM by increasing the number of contractile units (actin-myosin content) contributing to force generation.
Keywords: asthma, actin polymerization, myosin light chain, myosin heavy chain, ATP hydrolysis rate
asthma is a chronic lung disease associated with airway inflammation, airway hyperreactivity, and thickening of the airway wall, which contributes to excessive narrowing of airways. Although not clearly demonstrated, it is likely that airway hyperreactivity involves increased contractility of airway smooth muscle (ASM), reflected as an increase in force generation. Tumor necrosis factor-α (TNFα), as a proinflammatory cytokine, induces ASM hyperreactivity (3, 35, 37, 43). Previously, we and others reported that, in ASM, TNFα increases cytosolic Ca2+ concentration ([Ca2+]cyt) in response to agonist (e.g., bradykinin, acetylcholine, and histamine) stimulation (4, 13, 60). In addition, it has been reported that TNFα increases the Ca2+ sensitivity of force generation in ASM (10, 24, 39, 43).
In ASM, excitation-contraction coupling involves a signaling cascade initiated by an elevation of [Ca2+]cyt followed by Ca2+ binding to calmodulin (CaM), activation of myosin light chain (MLC) kinase, phosphorylation of the regulatory MLC (p-MLC), and attachment of myosin heavy chain (MyHC) heads to actin filaments (cross-bridge formation) (15–17, 49, 51, 53). Thus, in response to an elevation of [Ca2+]cyt, p-MLC increases, leading to cross-bridge recruitment and increased force generation. As in other smooth muscle, cross-bridge cycling drives ASM contraction, which requires ATP hydrolysis (14, 30, 52, 53). In permeabilized muscle preparations, ATP consumption depends on the MyHC concentration within myocytes and the level of Ca2+ activation (23, 53, 54).
In ASM, it has been suggested that an increase in force generation may involve an increase in the number of contractile elements within myocytes via polymerization/depolymerization of myosin and actin filaments. For example, it has been suggested that MyHC polymerization may occur during length adaptation of ASM, contributing to an increase in force generation (27, 36, 50). Actin is present in globular (G) and filamentous (F) forms, and polymerization of G- to F-actin occurs during ASM activation and contraction (31, 38). G- to F-actin polymerization is involved in increasing the number of contractile elements, as well as in remodeling of the cytoskeleton, which is required for tethering of contractile proteins to the plasma membrane, which, in turn, is necessary for force transmission to the extracellular matrix (20, 21, 63).
It has been reported that the proinflammatory cytokine IL-13 induces ASM hyperreactivity through an increase in actin polymerization and enhancement of its assembly into membrane adhesome complexes (9, 63, 64). Previously, we and others showed that when actin polymerization is disrupted (e.g., by phalloidin or cytochalasin D), ASM force is reduced (31, 38). Such an effect could be attributed to a decrease in the number of contractile elements or a disruption of tethering to the plasma membrane.
In the present study we determined the effects of 24 h of TNFα exposure of porcine ASM on Ca2+ sensitivity; actin, MLC, and MyHC concentrations; G- to F-actin polymerization; and isometric ATP hydrolysis rate. We hypothesized that TNFα increases force generation in ASM via an increase in Ca2+ sensitivity and an increase in the number of contractile elements.
METHODS
Preparation of porcine ASM strips.
Fresh porcine tracheas were obtained from a local abattoir and kept in ice-cold physiological saline solution (PSS; in mM: 118.99 NaCl, 1.17 MgSO4, 1.18 KH2PO4, 4.7 KCl, 2.5 CaCl2, 0.03 EDTA, 5.5 dextrose, and 25 HEPES) during transport. From these tracheas, ASM strips (1–2 mm wide × 7–10 mm long) were dissected under a binocular microscope as previously described (14, 30, 52, 53). ASM strips were then placed in PSS for 24 h with and without TNFα (100 ng/ml; Cell Sciences, Newburyport, MA) in a cold room (37). In control experiments (n = 5), we used the SUnSET technique, which is based on puromycin incorporation into synthesized proteins (19), to confirm that protein synthesis still occurs under these experimental conditions. Briefly, ASM strips were incubated with 20 µM puromycin for 30 min with or without additional incubation with 500 µM cycloheximide [a protein synthesis inhibitor (negative control)] for 15 min at the end of the 24 h of exposure to PSS. Puromycin incorporation into proteins was examined using a standard Western blot technique with a specific antibody for puromycin (MABE343, Millipore, Billerica, MA) (19).
Force-pCa relationships in permeabilized ASM strips.
The relaxing (pCa 9.0) and activating (pCa 7.0 to 4.0) solutions used throughout our experiments consisted of 10−9 (pCa 9.0) to 10−4 (pCa 4.0) M Ca2+, 85 mM K+, 2 mM MgATP, 7 mM EGTA, 1 mM Mg2+, 15 mM creatine phosphate, and 50 mM imidazole supplemented with creatine phosphokinase (1 mg/ml). Imidazole propionate was used to maintain pH at 7.00 ± 0.05. After 24 h, ASM strips were permeabilized by incubation in a relaxing pCa 9.0 solution containing 10% (vol/vol) Triton X-100 (Sigma-Aldrich, St. Louis, MO) for 30 min. Thereafter, the ASM strips were washed with fresh pCa 9.0 solution for 15 min to remove excess Triton X-100. Both ends of the ASM strips were wrapped with aluminum foil clips for mounting horizontally in a four-chamber microvessel system (DMT Myographs, AD Instruments, Colorado Springs, CO). One end of the ASM strip was connected to a micrometer for length control, and the other end was connected to a force transducer. The strips were incubated with pCa 9.0 relaxing solution for 30 min at 22°C while a passive load of ~3 mN was applied. Force generation in the strips was then measured in response to increasing concentrations of Ca2+ (from pCa 7.0 to 4.0) to determine the force-pCa relationship. At each pCa, force was measured after reaching a peak in 20 min. Force responses were recorded using LabChart Pro software (AD Instruments) and analyzed to determine maximum force (Fmax) and the pCa corresponding to 50% of Fmax (pCa50, an index of Ca2+ sensitivity). Isometric force was normalized to cross-sectional area of the strip (specific force).
Assay for MLC phosphorylation.
In a separate set of experiments, permeabilized control and TNFα-exposed ASM strips were separately incubated (at 22°C) in pCa 9.0, 6.1, and 4.0 solutions to induce relaxation, 50% of Fmax, and Fmax, respectively. After 20 min of incubation, ASM strips were snap-frozen in liquid nitrogen. Frozen ASM strips were thawed at room temperature, minced with a microscissors, and homogenized in ice-cold radioimmunoprecipitation assay lysis buffer (RIPA, Cell Signaling Technology, Danvers, MA) supplemented with 1 mM PMSF, 1× phosphatase inhibitor (PhosSTOP Easypack Roche, Mannheim, Germany), and 1× protease inhibitor (cOmplete Mini, Roche). Lysed samples were centrifuged at 12,000 rpm for 20 min in a cold room, and supernatants were collected. Protein concentration of each sample was estimated by standard Bradford assay (Bio-Rad protein assay system, Bio-Rad, Hercules, CA) (7). Each sample was separated on a 15% SDS gel (20 µg per well) and transferred to a polyvinylidene difluoride (PVDF) membrane (paired samples from control and TNFα-exposed groups were run on the same gel). Transferred proteins were detected with a specific antibody for p-MLC [1:1,000 dilution, rabbit polyclonal antibody to MLC (phosphorylated at S20); Ab2480, Abcam, Cambridge, MA] (42), then membranes were stripped and probed again for total MLC (1:1,000 dilution, monoclonal anti-MLC antibody, clone MY-21; Sigma-Aldrich) (22). Total MLC and p-MLC bands were visualized using an enhanced chemiluminescence technique and quantified using a Kodak Image Station (Kodak, Los Angeles, CA). Data are presented as the ratio of p-MLC to total MLC for each set.
Assessment of actin concentration.
The same protein extracts used to determine MLC phosphorylation, along with known concentrations of purified rabbit actin standards (Cytoskeleton, Denver, CO), were used to quantify actin content. Twenty micrograms of proteins from the samples and actin standards were loaded into wells on a 15% SDS gel (paired samples from control and TNFα-exposed groups were run on the same gel). After gel fractionation, gels were fixed with fixing solution (40% ethanol and 10% acetate) and stained with Coomassie stain (Bio-Safe Coomassie Stain, Bio-Rad). Stained gels were scanned with a high-resolution scanner (Kodak Image Station) for densitometric analysis. After background subtraction, the brightness-area product (BAP) of each sample was calculated from the area and average brightness of each band. A standard curve was constructed based on the linear relationship between BAP and actin standards. Actin concentration of samples was determined from this standard curve.
Assessment of G- to F-actin polymerization.
The extent of G- to F-actin polymerization in ASM was determined as previously described (31, 58) using a G-actin/F-actin in vivo assay kit (Cytoskeleton). Briefly, permeabilized ASM strips were incubated separately in pCa 9.0 or 4.0 solution for 20 min at 22°C, and the ASM strips were snap-frozen. Frozen strips were thawed at room temperature, and each sample was minced in ice-cold F-actin stabilization buffer [50 mM PIPES (pH 6.9), 50 mM KCl, 5 mM MgCl2, 5 mM EGTA, 5% (vol/vol) glycerol, 0.1% Nonidet P40, 0.1% Triton X-100, 0.1% Tween 20, and 0.1% β-mercaptoethanol (β-ME)] supplemented with 1 mM ATP and 1% protease inhibitor cocktail. After centrifugation at 350 g for 5 min, supernatants were collected and centrifuged at 100,000 g for 60 min to separate F- and G-actin at 37°C. Supernatants (G-actin) were pipetted into new microcentrifuge tubes. Pellets (F-actin) were resuspended in ice-cold F-actin depolymerizing buffer (8 M urea constituted with water) to depolymerize F-actin. Ten microliters from each sample for separated F- and G-actin were loaded onto a 15% SDS gel and fractionated (paired samples from control and TNFα-exposed groups were run on the same gel). Fractionated proteins were transferred to a PVDF membrane. Proteins were detected using specific antibody for actin (1:1,000 dilution, anti-actin rabbit polyclonal antibody; Cytoskeleton). Membranes were imaged using a Kodak Image Station. Data are expressed as the ratio of F- to G-actin for each sample using BAP.
Measurement of MyHC concentration.
The methods used to determine MyHC concentrations are described elsewhere (15–17, 53). Briefly, permeabilized control and TNFα-exposed ASM strips were weighed and minced in 4× (vol/wt) ice-cold myosin extraction buffer [300 mM NaCl, 100 mM NaH2PO4, 50 mM Na2HPO4, 1 mM MgCl2, 10 mM Na4P2O7, 1 mM EDTA, and 0.1% (vol/vol) β-ME (pH 6.5)]. Samples were centrifuged at 12,800 g in a cold room for 30 min. Supernatants were collected, and MyHC was precipitated overnight in low-salt buffer [1 mM EDTA and 0.1% (vol/vol) β-ME] in a cold room. After cold precipitation, samples were centrifuged for 30 min at 12,800 g at 4°C, and supernatants were discarded. Pellets were mixed with myosin sample buffer (0.5 mM NaCl and 11.5 mM NaH2PO4) and denatured by boiling for 2 min. These samples were diluted 50 times in SDS sample buffer [62.5 mM Tris·HCl, 2% (wt/vol) SDS, 10% (vol/vol) glycerol, 5% β-ME, and 0.001% (wt/vol) bromophenol blue (pH 6.8)].
A modification of the method developed by Sugiura and Murakami (55) was used to prepare the gels. In this method, stacking and resolving gels have different concentrations of acrylamide at different pH levels (3.5% at pH 6.8 and 5–8% at pH 8.8). Known concentrations of purified rabbit psoas muscle MyHC standards (catalog no. M-3889, Sigma-Aldrich; protein concentrations verified with the Bradford method) were loaded into the gels together with 10 μl of each sample, and gels were run at a constant current of 30 mA overnight (paired samples from control and TNFα-exposed groups were run on the same gel). After gel fractionation, gels were fixed and silver-stained (41). MyHC concentrations were calculated using a method similar to that used to calculate actin concentrations. The stained gels were scanned with a high-resolution scanner (Kodak Image Station) for densitometric analysis of the samples, and MyHC concentrations were calculated based on the standard curves constructed from the MyHC standards.
Measurements of ATP hydrolysis rate and tension cost.
ATP hydrolysis rate was measured in permeabilized ASM strips using an NADH-linked fluorescence technique, as previously described, and the Guth muscle research system (14, 30, 52, 53, 57). Briefly, ATP hydrolysis rate is coupled to the oxidation of NADH (fluorescent compound) to NAD+ (nonfluorescent compound). One mole of NADH is oxidized to NAD+ for each mole of ADP produced, and the decrease in NADH fluorescence during a 15-s period of stopped flow in the system reflects the ATP hydrolysis rate in the muscle sample. The permeabilized ASM strips were mounted in a flow-through cuvette chamber between a micrometer for length adjustment and a force transducer as described above. The chamber was constantly perfused with relaxing or activating solution, and force responses were measured. Basal ATP hydrolysis rate in the ASM strip was measured during relaxation at pCa 9.0. Subsequently, ASM force was induced using pCa 4.0 solution and allowed to reach a plateau before ATP hydrolysis rate was measured and normalized for tissue volume. Tension cost was calculated as the ratio of ATP hydrolysis rate to force during pCa 4.0 activation.
Statistical analysis.
Tracheas were obtained from six different animals, and this was the n for statistical analyses. For the force-pCa relationships, data were fit using a Hill equation algorithm (Sigma Plot 12.0) to determine pCa50. Student’s paired two-tailed t-test was used to compare measurements from control and TNFα-treated groups. Data for MLC phosphorylation were analyzed using a two-way repeated-measures ANOVA and corrected with Bonferroni’s post hoc test. Values are means ± SE unless otherwise specified. Significance was considered at P < 0.05.
RESULTS
Maximum specific force and force-pCa relationship.
In both TNFα-exposed and control groups, isometric force generated in permeabilized ASM strips increased in response to increasing levels of Ca2+ activation (pCa 9.0 to 4.0), displaying a sigmoidal force-pCa relationship (Fig. 1A). Exposure of permeabilized ASM strips to TNFα significantly increased specific force responses to all levels of Ca2+ activation compared with controls (Fig. 1A). In both TNFα-exposed and control ASM strips, Fmax was obtained at pCa 4.0. Exposure of ASM strips to TNFα for 24 h increased Fmax by 72% compared with control strips (P < 0.05, n = 6; Fig. 2A). When normalized for differences in Fmax, the relative force-pCa relationships were comparable between TNFα-exposed and control ASM strips, with no difference in pCa50 (P > 0.05, n = 6; Fig. 1B).
Fig. 1.
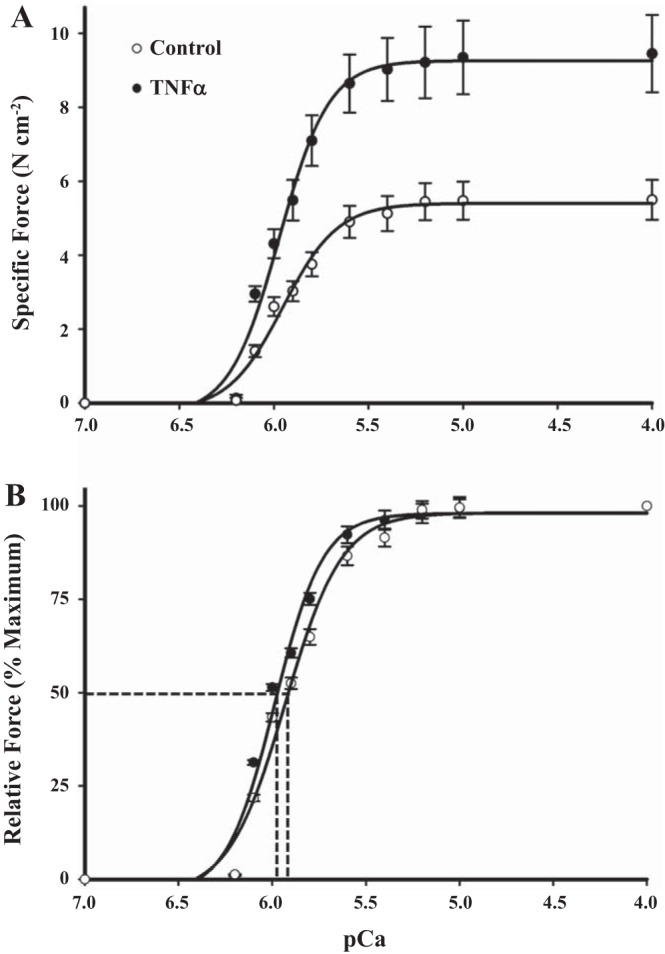
Effects of TNFα on force generation and Ca2+ sensitivity in permeabilized airway smooth muscle (ASM) strips. A: force-pCa curve from control and TNFα-exposed (24 h at 100 ng/ml) permeabilized ASM strips. Force was generated beginning at pCa 6.4 and increased with increasing Ca2+ concentrations until a maximum was achieved at pCa 4.0 (Fmax). TNFα exposure (24 h) significantly increased force across all levels of Ca2+ activation compared with controls. B: when normalized for differences in Fmax, relative force-pCa relationships were comparable between TNFα-exposed and control ASM strips. Ca2+ sensitivity of force generation was indexed by measurement of the pCa at which 50% of Fmax was achieved (pCa50). There was no significant difference in pCa50 between TNFα-exposed and control ASM strips. Values are means ± SE [n = 6 strips (1 strip per animal)].
Fig. 2.
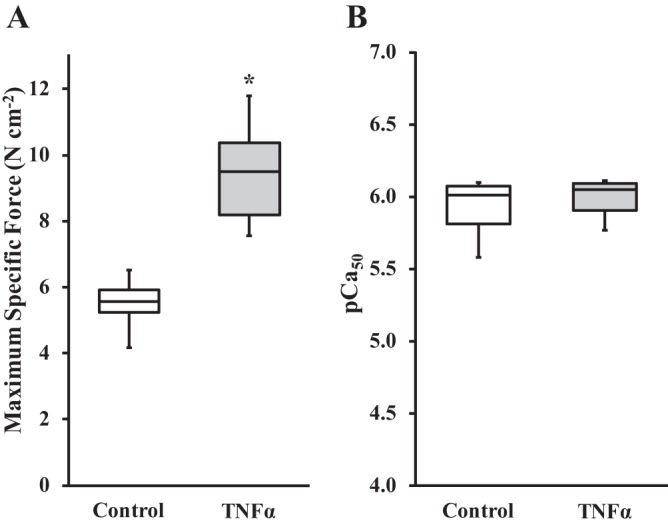
Effects of TNFα on maximum specific force and pCa50 in permeabilized ASM strips. A: 24 h of exposure to TNFα significantly increased maximum specific force compared with controls. B: no significant difference in pCa50 between TNFα-exposed and control ASM strips. *Significantly different (P < 0.05) from control [n = 6 strips (1 strip per animal)].
MLC phosphorylation.
In both control and TNFα-exposed ASM strips, the extent of MLC phosphorylation increased with increasing Ca2+ activation (P < 0.05, n = 6; Fig. 3). Exposure of ASM strips to TNFα for 24 h did not affect the relative extent of MLC phosphorylation induced by Ca2+ activation (P > 0.05, n = 6; Fig. 3).
Fig. 3.

Effects of TNFα on myosin light chain (MLC) phosphorylation in permeabilized ASM strips. TNFα exposure (24 h) significantly increased MLC concentration [normalized to ribosomal protein S16 (RPS16) as a loading control] compared with controls. Representative Western blots are shown. Ratio of phosphorylated MLC (p-MLC) to total MLC increased with Ca2+ activation in TNFα-exposed and control ASM strips. Relative extent of MLC phosphorylation at different levels of Ca2+ activation was comparable between TNFα-exposed and control ASM strips. *Significantly different (P < 0.05) from control [n = 6 strips (1 strip per animal)].
Total actin, MLC, and MyHC contents.
Total MLC concentration was significantly higher in TNFα-exposed than control ASM strips (P < 0.05, n = 6; Fig. 3). Similarly, total actin (Fig. 4A) and MyHC (Fig. 4B) concentrations were significantly higher in TNFα-exposed than control ASM strips (P < 0.05, n = 6 for total actin and MyHC concentrations; Fig. 4).
Fig. 4.
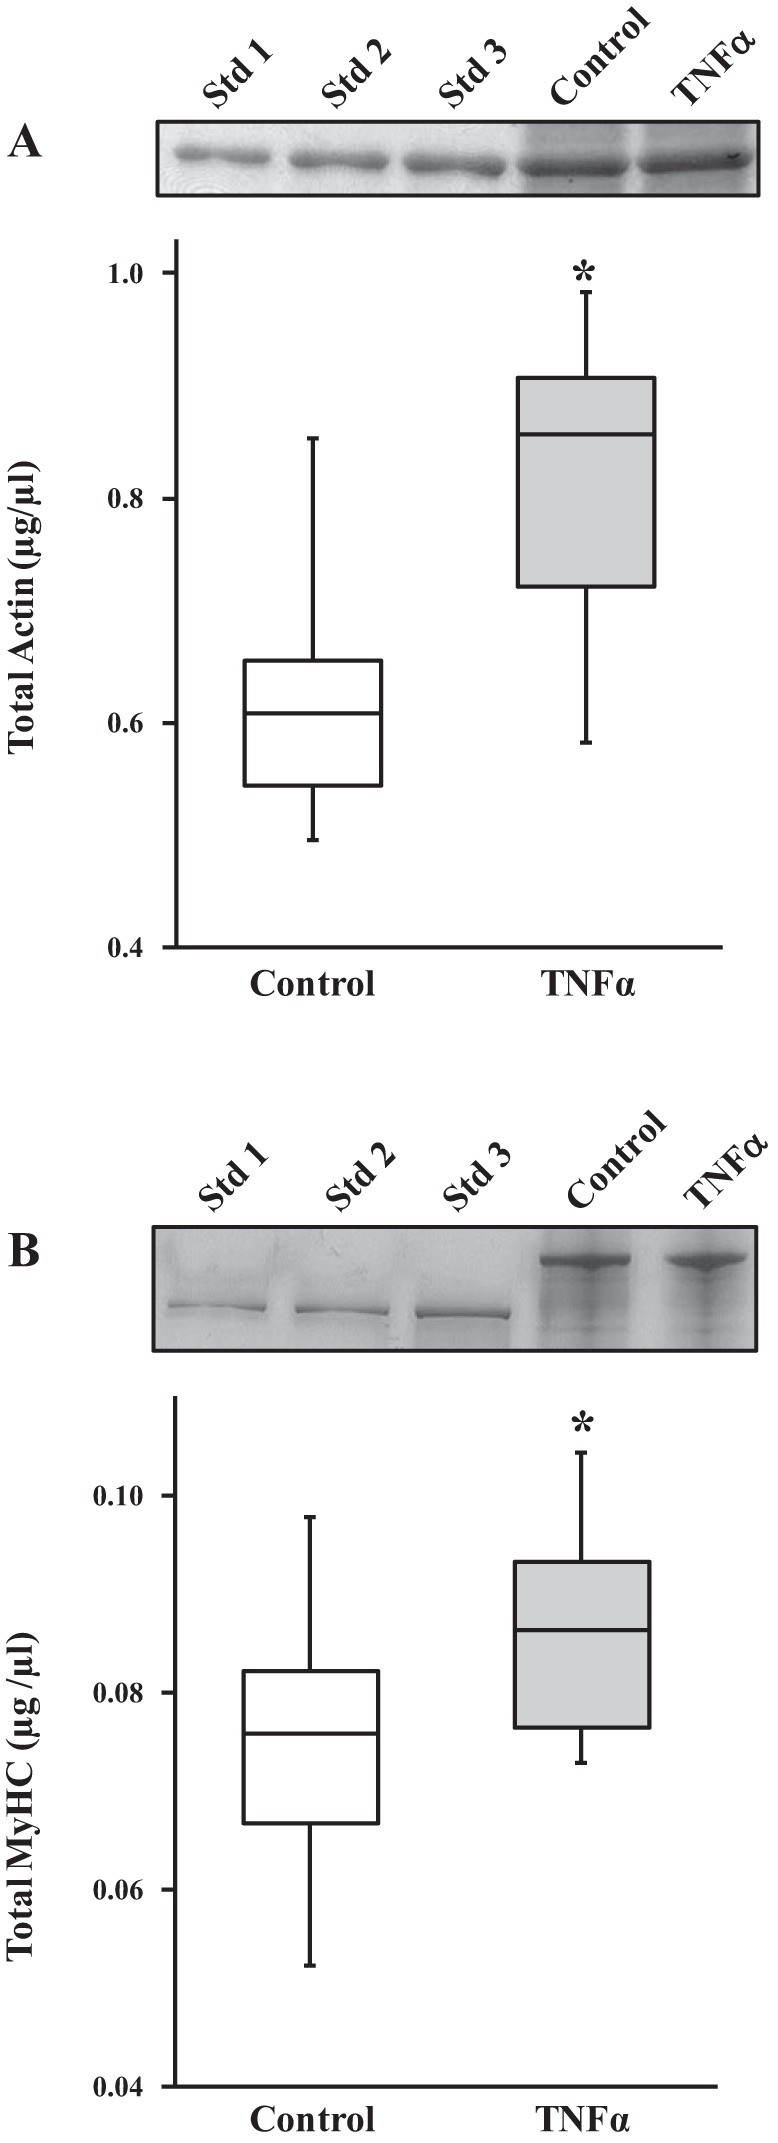
Effects of TNFα on actin and myosin heavy chain (MyHC) concentrations in permeabilized ASM strips. A: 24 h of exposure to TNFα significantly increased total actin concentration in permeabilized ASM strips compared with controls. Representative gels (Coomassie-stained) are shown. ASM samples were loaded with actin standards (Std 1, Std 2, and Std 3; known actin concentrations) to determine actin concentrations in TNFα-exposed and control ASM. B: 24 h of exposure to TNFα significantly increased MyHC concentration compared with controls. Representative gels (silver-stained) are shown. ASM samples were loaded with MyHC standards (Std 1, Std 2, and Std 3; known MyHC concentrations extracted from rabbit psoas muscle) to determine MyHC concentrations in TNFα-exposed and control ASM strips. *Significantly different (P < 0.05) from control [n = 6 strips (1 strip per animal)].
Ratio of F- to G-actin.
In control ASM strips, there was no significant difference in the ratio of F- to G-actin at pCa 9.0 and 4.0 (n = 6). In contrast, after 24 h of TNFα exposure, the ratio of F- to G-actin in ASM strips increased significantly at maximum Ca2+ activation (pCa 4.0; P < 0.05, n = 6; Fig. 5).
Fig. 5.
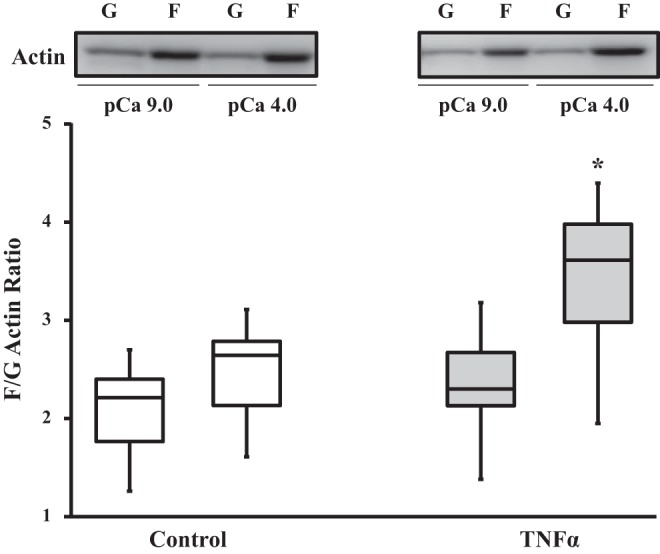
Effects of TNFα on globular (G)- to filamentous (F)-actin polymerization. In control ASM, Ca2+ activation (pCa 4.0, maximal activation) did not affect the ratio of F- to G-actin (compared with pCa 9.0, relaxing solution). Ratio of F- to G-actin was not affected by 24 h of TNFα exposure under relaxed (pCa 9.0) conditions but was increased during maximal Ca2+ activation (pCa 4.0). *Significantly different (P < 0.05) from control [n = 6 strips (1 strip per animal)].
Isometric force, ATP hydrolysis, and tension cost.
Basal ATP hydrolysis rate in the ASM strip was measured during relaxation at pCa 9.0, then ASM force was induced using pCa 4.0 solution (Fig. 6, A and B). In both control and TNFα-exposed ASM strips, isometric force reached a plateau in ~3–4 min (Fig. 6A). Compared with control, exposure of ASM strips to TNFα increased the isometric force response to pCa 4.0 (Fig. 6A). As we previously demonstrated, ATP hydrolysis rate was transiently higher following Ca2+ activation, reaching a maximal value at ∼2 min, but then declined to a steady-state ATP hydrolysis rate (Fig. 6B). Compared with control, exposure of ASM strips to TNFα significantly increased both the peak and steady-state ATP hydrolysis rates following Ca2+ activation (Fig. 6B). Since both loading and the number of cross bridges contribute to ATP hydrolysis rate, we assumed that steady-state measurements of ATP hydrolysis rate reflected stable loading conditions; thus, differences in ATP hydrolysis rate during steady state were due primarily to differences in MyHC concentration (53). Figure 6C summarizes the steady-state ATP hydrolysis rate obtained at 10 min after Ca2+ activation and shows that these steady-state values were significantly higher in TNFα-exposed than control ASM strips (P < 0.05, n = 6). Tension cost was calculated as the ratio of steady-state ATP hydrolysis rate to isometric force at 10 min. Tension cost was significantly higher in TNFα-exposed than control ASM strips (P < 0.05, n = 6; Fig. 6D).
Fig. 6.

Effects of TNFα on isometric force, ATP hydrolysis rate, and tension cost in permeabilized ASM strips during maximal Ca2+ activation. A: changes in isometric force across a 12-min time period in control and TNFα-exposed (24 h) ASM strips during maximal Ca2+ activation (pCa 4.0). B: changes in ATP hydrolysis rate in control and TNFα-exposed (24 h) ASM strips during maximal Ca2+ activation (pCa 4.0). Throughout the 12-min period, isometric force and ATP hydrolysis rate were higher in TNFα-exposed than control ASM strips. Values are means ± SE [n = 6 strips (1 strip per animal)]. C: steady-state ATP hydrolysis rate (measured at 10 min after Ca2+ activation) was significantly higher in TNFα-exposed than control ASM strips. D: steady-state tension cost during maximal Ca2+ activation (pCa 4.0) was significantly higher in TNFα-exposed than control ASM strips. *Significantly different (P < 0.05) from control [n = 6 strips (1 strip per animal)].
DISCUSSION
We have demonstrated that 24 h of exposure to the proinflammatory cytokine TNFα increases specific force (force per cross-sectional area) in permeabilized porcine ASM across varying levels of Ca2+ activation. There was no change in the intrinsic Ca2+ sensitivity (pCa50) of ASM force generation after TNFα exposure. Consistent with these results, we found that TNFα exposure did not affect the extent of MLC phosphorylation at different levels of Ca2+ activation. However, the increase in ASM specific force was associated with an increase in total actin, MLC, and MyHC concentrations, suggesting an increase in the number of contractile elements contributing to force generation. TNFα exposure also increased the Ca2+-dependent polymerization of G- to F-actin, which may have also contributed to actin availability for force generation. The increase in MyHC concentration was also associated with an increase in ATP hydrolysis rate, consistent with an increased number of contractile elements contributing to force generation.
Exposure to TNFα increases ASM force generation.
We found that 24 h of exposure of porcine ASM to TNFα induced an increase in specific force across varying levels of Ca2+ activation, which is consistent with previous reports in which isolated airway preparations (mostly tracheal rings) and isolated ASM cells from different species were used (1, 2, 6, 8, 29, 34, 35, 37, 56). The precise mechanism by which TNFα exposure increases ASM force generation is not fully understood. We and others previously hypothesized that TNFα exposure may increase force generation by enhancing [Ca2+]cyt responses to agonist stimulation (1, 3, 5, 12, 13, 24, 44–48, 59, 60) or through changes in Ca2+ sensitivity of ASM force generation (10, 24, 28, 39, 40, 43). In the present study we circumvented the effect of TNFα exposure on [Ca2+]cyt responses by using a permeabilized ASM strip in which the level of Ca2+ activation was controlled.
In ASM, excitation-contraction coupling involves a complex cascade of intracellular events, including mobilization of CaM, Ca2+ binding to CaM, CaM/Ca2+ complex activation of MLC kinase, MLC phosphorylation, cross-bridge recruitment, and cycling, leading to force generation and ATP hydrolysis (30, 31, 49, 51–53). Force generation is thus directly dependent on the extent of Ca2+-induced MLC phosphorylation. We found that the relative extent of MLC phosphorylation increased with increasing Ca2+ activation in proportion to ASM force generation. When ASM force was normalized for differences in Fmax between TNFα-exposed and control ASM strips, the relative forces generated at any given level of Ca2+ activation were comparable. Similarly, the relative extent of Ca2+-induced MLC phosphorylation was comparable between TNFα-exposed and control ASM strips. This lack of an effect of TNFα exposure on the intrinsic Ca2+ sensitivity of ASM force generation was reflected in the similar pCa50 values between groups.
In intact ASM, agonists can also activate second messenger cascades (e.g., the RhoA/Rho kinase pathway) that inhibit MLC phosphatase activity and, thus, increase the extent of MLC phosphorylation independent of Ca2+ activation (11, 28, 32, 33). This mechanism is thought to underlie agonist-induced increases in Ca2+ sensitivity of ASM force generation. Several studies have reported that TNFα exposure increases Ca2+ sensitivity of ASM force generation via activation of the RhoA/Rho kinase pathway (24, 40, 43). However, in the present study we found that permeabilization of the plasma membrane disrupted G protein-coupled receptors and activation of the RhoA/Rho kinase pathway. Thus the results of the present study cannot exclude an effect of TNFα exposure on Ca2+ sensitivity of ASM force generation via enhancement of activation of the RhoA/Rho kinase pathway.
TNFα exposure increases actin, MLC, and MyHC concentrations in ASM.
In the present study we found that 24 h of TNFα exposure induced an increase in actin, MLC, and MyHC concentrations, with an apparent greater effect on MLC than MyHC concentration. However, it is unclear whether this was a true differential effect of TNFα on MLC and MyHC protein concentrations. When polymerized into a thick filament, MLC and MyHC are closely associated; however, these proteins also exist in globular form, so it is possible that the leaching of proteins after permeabilization differentially affected loss of globular forms of MLC and MyHC. It is very likely that the use of different extraction and measurement techniques (Western blot for MLC and silver stain for MyHC) to measure these proteins contributed to differences in the absolute values of MLC and MyHC. However, it is very unlikely that TNFα exposure per se affected these variables, and thus it is very likely that, at least qualitatively, TNFα exposure increases MLC and MyHC concentrations in ASM strips. These results are in agreement with several previous studies that suggested that an increase in ASM force generation involves an increase in the number of contractile elements contributing to force via increased actin, MLC, and MyHC concentration and via polymerization/depolymerization of myosin and actin filaments (27, 31, 36, 38, 50). Surprisingly, few studies have examined the effect of cytokines on the concentration of contractile elements within ASM cells. However, in other cell types, studies have reported that TNFα exposure increases actin expression and concentration (18, 61, 62).
In smooth muscle, as in other muscle types, the essential unit underlying force generation and contraction is the actin-myosin cross bridge. Huxley and colleagues originally proposed that cross-bridge cycling reflected the repetitive transition between two possible mechanical states: 1) myosin strongly attached to actin, thereby generating force and/or contraction, and 2) myosin detached from actin (25, 26). In this two-state model, force generation (F) is described by the following equation: F = n·αfs·f, where n is MyHC concentration, αfs is fraction of strongly bound cross bridges, primarily influenced by Ca2+ activation and sensitivity, and f is average force per cross bridge. Thus, at a given level of Ca2+ activation and with no change in Ca2+ sensitivity (αfs) or force generated per cross-bridge (f), F is primarily affected by MyHC concentration (15–17, 23, 30, 51, 53).
The hydrolysis of ATP occurs during the transition between attached and detached cross-bridge states, and steady-state ATP hydrolysis rate can be estimated by the following equation: ATP hydrolysis rate = n·b·αfs·gapp, where b is the number of half sarcomeres within skeletal or cardiac muscle fibers or cell volume in smooth muscle and gapp is the apparent rate constant for cross-bridge detachment (15–17, 49, 51, 53). We previously showed that, in permeabilized ASM strips, ATP hydrolysis rate increases in proportion to force induced by varying levels of Ca2+ activation (30, 31). Therefore, in permeabilized ASM in which Ca2+ activation is controlled and Ca2+ sensitivity (αfs) is unaffected, the TNFα-induced increase in steady-state ATP hydrolysis rate most likely reflects the increase in MyHC concentration. However, we also found that the TNFα-induced increase in ATP hydrolysis rate exceeded the increase in force generation, leading to an increase in tension cost. This may reflect disrupted tethering of contractile elements to the plasma membrane, thereby affecting the transmission of force.
Polymerization of G- to F-actin occurs during ASM activation (31, 38) and is also involved in cytoskeletal remodeling required for tethering of contractile proteins to the plasma membrane, which is necessary for force transmission to the extracellular matrix (20, 21, 63). In previous studies we and others showed that when actin polymerization is disrupted, ASM force generation is markedly reduced (31, 38), which could be attributed to a decrease in the number of contractile elements or disrupted tethering to the plasma membrane. In addition to actin polymerization, it has been suggested that MyHC polymerization may occur during length adaptation of ASM, contributing to an increase in force generation (27, 36, 50). It has also been reported that IL-13 increases G- to F-actin polymerization, leading to an enhancement of its assembly into membrane adhesome complexes (9, 63, 64). In the present study we found that 24 h of TNFα exposure induced an increase in G- to F-actin polymerization following Ca2+ activation. However, the increase in tension cost following TNFα exposure is not consistent with an enhancement of force generation via an effect on assembly of membrane adhesome complexes and increased tethering of contractile elements to the plasma membrane.
In conclusion, 24 h of TNFα exposure increases specific force across varying levels of Ca2+ activation. This increase was associated with an increase in total actin, MLC, and MyHC concentrations. An increase in ASM force generation contributes to airway hyperreactivity associated with asthma. Accordingly, alterations of the contractile apparatus within ASM cells induced by proinflammatory cytokines may play an important role in airway hyperreactivity associated with asthma.
GRANTS
This work was supported by National Heart, Lung, and Blood Institute Grants HL-74309 and HL-126451 (G. C. Sieck). M. Dogan was supported by a grant from TÜBİTAK, Ankara, Turkey (fund no. 2219-1059B191500607).
DISCLOSURES
No conflicts of interest, financial or otherwise, are declared by the authors.
AUTHOR CONTRIBUTIONS
M.D. and Y.-S.H. performed experiments; M.D., Y.-S.H., and P.F.D. analyzed data; M.D., Y.-S.H., P.F.D., and G.C.S. interpreted results of experiments; M.D., Y.-S.H., P.F.D., and G.C.S. prepared figures; M.D., Y.-S.H., P.F.D., and G.C.S. drafted manuscript; M.D., Y.-S.H., P.F.D., and G.C.S. approved final version of manuscript; Y.-S.H., P.F.D., and G.C.S. edited and revised manuscript; P.F.D. and G.C.S. conceived and designed research.
REFERENCES
- 1.Amrani Y. Modulation of airway smooth muscle contractile function by TNFα and IL-13 and airway hyperresponsiveness in asthma. In: Calcium Signaling in Airway Smooth Muscle Cells, edited by Wang Y-X. Basel: Springer International, 2014, p. 423–439. doi: 10.1007/978-3-319-01312-1_24. [DOI] [Google Scholar]
- 2.Amrani Y. TNF-α and calcium signaling in airway smooth muscle cells: a never-ending story with promising therapeutic relevance. Am J Respir Cell Mol Biol 36: 387–388, 2007. doi: 10.1165/ajrcmb.36.3.387. [DOI] [PubMed] [Google Scholar]
- 3.Amrani Y, Chen H, Panettieri RA Jr. Activation of tumor necrosis factor receptor 1 in airway smooth muscle: a potential pathway that modulates bronchial hyper-responsiveness in asthma? Respir Res 1: 49–53, 2000. doi: 10.1186/rr12. [DOI] [PMC free article] [PubMed] [Google Scholar]
- 4.Amrani Y, Martinet N, Bronner C. Potentiation by tumour necrosis factor-α of calcium signals induced by bradykinin and carbachol in human tracheal smooth muscle cells. Br J Pharmacol 114: 4–5, 1995. doi: 10.1111/j.1476-5381.1995.tb14896.x. [DOI] [PMC free article] [PubMed] [Google Scholar]
- 5.Amrani Y, Panettieri RA Jr. Modulation of calcium homeostasis as a mechanism for altering smooth muscle responsiveness in asthma. Curr Opin Allergy Clin Immunol 2: 39–45, 2002. doi: 10.1097/00130832-200202000-00007. [DOI] [PubMed] [Google Scholar]
- 6.Anticevich SZ, Hughes JM, Black JL, Armour CL. Induction of human airway hyperresponsiveness by tumour necrosis factor-α. Eur J Pharmacol 284: 221–225, 1995. doi: 10.1016/0014-2999(95)00463-U. [DOI] [PubMed] [Google Scholar]
- 7.Bradford MM. A rapid and sensitive method for the quantitation of microgram quantities of protein utilizing the principle of protein-dye binding. Anal Biochem 72: 248–254, 1976. doi: 10.1016/0003-2697(76)90527-3. [DOI] [PubMed] [Google Scholar]
- 8.Chen H, Tliba O, Van Besien CR, Panettieri RA Jr, Amrani Y. TNF-α modulates murine tracheal rings responsiveness to G-protein-coupled receptor agonists and KCl. J Appl Physiol (1985) 95: 864–872, 2003. doi: 10.1152/japplphysiol.00140.2003. [DOI] [PubMed] [Google Scholar]
- 9.Chiba Y, Nakazawa S, Todoroki M, Shinozaki K, Sakai H, Misawa M. Interleukin-13 augments bronchial smooth muscle contractility with an up-regulation of RhoA protein. Am J Respir Cell Mol Biol 40: 159–167, 2009. doi: 10.1165/rcmb.2008-0162OC. [DOI] [PubMed] [Google Scholar]
- 10.Chiba Y, Ueno A, Shinozaki K, Takeyama H, Nakazawa S, Sakai H, Misawa M. Involvement of RhoA-mediated Ca2+ sensitization in antigen-induced bronchial smooth muscle hyperresponsiveness in mice. Respir Res 6: 4, 2005. doi: 10.1186/1465-9921-6-4. [DOI] [PMC free article] [PubMed] [Google Scholar]
- 11.Croxton TL, Lande B, Hirshman CA. Role of G proteins in agonist-induced Ca2+ sensitization of tracheal smooth muscle. Am J Physiol Lung Cell Mol Physiol 275: L748–L755, 1998. [DOI] [PubMed] [Google Scholar]
- 12.Delmotte P, Sieck GC. Interaction between endoplasmic/sarcoplasmic reticulum stress (ER/SR stress), mitochondrial signaling and Ca2+ regulation in airway smooth muscle (ASM). Can J Physiol Pharmacol 93: 97–110, 2015. doi: 10.1139/cjpp-2014-0361. [DOI] [PMC free article] [PubMed] [Google Scholar]
- 13.Delmotte P, Yang B, Thompson MA, Pabelick CM, Prakash YS, Sieck GC. Inflammation alters regional mitochondrial Ca2+ in human airway smooth muscle cells. Am J Physiol Cell Physiol 303: C244–C256, 2012. doi: 10.1152/ajpcell.00414.2011. [DOI] [PMC free article] [PubMed] [Google Scholar]
- 14.Fredberg JJ, Jones KA, Nathan M, Raboudi S, Prakash YS, Shore SA, Butler JP, Sieck GC. Friction in airway smooth muscle: mechanism, latch, and implications in asthma. J Appl Physiol (1985) 81: 2703–2712, 1996. [DOI] [PubMed] [Google Scholar]
- 15.Geiger PC, Cody MJ, Macken RL, Bayrd ME, Fang YH, Sieck GC. Mechanisms underlying increased force generation by rat diaphragm muscle fibers during development. J Appl Physiol (1985) 90: 380–388, 2001. [DOI] [PubMed] [Google Scholar]
- 16.Geiger PC, Cody MJ, Macken RL, Bayrd ME, Sieck GC. Effect of unilateral denervation on maximum specific force in rat diaphragm muscle fibers. J Appl Physiol (1985) 90: 1196–1204, 2001. [DOI] [PubMed] [Google Scholar]
- 17.Geiger PC, Cody MJ, Macken RL, Sieck GC. Maximum specific force depends on myosin heavy chain content in rat diaphragm muscle fibers. J Appl Physiol (1985) 89: 695–703, 2000. [DOI] [PubMed] [Google Scholar]
- 18.Goldblum SE, Ding X, Campbell-Washington J. TNF-α induces endothelial cell F-actin depolymerization, new actin synthesis, and barrier dysfunction. Am J Physiol Cell Physiol 264: C894–C905, 1993. [DOI] [PubMed] [Google Scholar]
- 19.Goodman CA, Hornberger TA. Measuring protein synthesis with SUnSET: a valid alternative to traditional techniques? Exerc Sport Sci Rev 41: 107–115, 2013. doi: 10.1097/JES.0b013e3182798a95. [DOI] [PMC free article] [PubMed] [Google Scholar]
- 20.Gunst SJ, Tang DD. The contractile apparatus and mechanical properties of airway smooth muscle. Eur Respir J 15: 600–616, 2000. doi: 10.1034/j.1399-3003.2000.15.29.x. [DOI] [PubMed] [Google Scholar]
- 21.Gunst SJ, Tang DD, Opazo Saez A. Cytoskeletal remodeling of the airway smooth muscle cell: a mechanism for adaptation to mechanical forces in the lung. Respir Physiol Neurobiol 137: 151–168, 2003. doi: 10.1016/S1569-9048(03)00144-7. [DOI] [PubMed] [Google Scholar]
- 22.Guvenc B, Ustunel C, Ozturk N, Brozovich FV. A dynamic approach reveals non-muscle myosin influences the overall smooth muscle cross-bridge cycling rate. FEBS Lett 584: 2862–2866, 2010. doi: 10.1016/j.febslet.2010.04.070. [DOI] [PubMed] [Google Scholar]
- 23.Han YS, Geiger PC, Cody MJ, Macken RL, Sieck GC. ATP consumption rate per cross bridge depends on myosin heavy chain isoform. J Appl Physiol (1985) 94: 2188–2196, 2003. doi: 10.1152/japplphysiol.00618.2002. [DOI] [PubMed] [Google Scholar]
- 24.Hunter I, Cobban HJ, Vandenabeele P, MacEwan DJ, Nixon GF. Tumor necrosis factor-α-induced activation of RhoA in airway smooth muscle cells: role in the Ca2+ sensitization of myosin light chain20 phosphorylation. Mol Pharmacol 63: 714–721, 2003. doi: 10.1124/mol.63.3.714. [DOI] [PubMed] [Google Scholar]
- 25.Huxley AF, Niedergerke R. Structural changes in muscle during contraction: interference microscopy of living muscle fibres. Nature 173: 971–973, 1954. doi: 10.1038/173971a0. [DOI] [PubMed] [Google Scholar]
- 26.Huxley H, Hanson J. Changes in the cross-striations of muscle during contraction and stretch and their structural interpretation. Nature 173: 973–976, 1954. doi: 10.1038/173973a0. [DOI] [PubMed] [Google Scholar]
- 27.Ijpma G, Al-Jumaily AM, Cairns SP, Sieck GC. Myosin filament polymerization and depolymerization in a model of partial length adaptation in airway smooth muscle. J Appl Physiol (1985) 111: 735–742, 2011. doi: 10.1152/japplphysiol.00114.2011. [DOI] [PMC free article] [PubMed] [Google Scholar]
- 28.Ito S. Role of RhoA/Rho-kinase and calcium sensitivity in airway smooth muscle functions. In: Calcium Signaling in Airway Smooth Muscle Cells, edited by Wang Y-X. Basel: Springer International, 2014, p. 285–307. doi: 10.1007/978-3-319-01312-1_15. [DOI] [Google Scholar]
- 29.Jain D, Keslacy S, Tliba O, Cao Y, Kierstein S, Amin K, Panettieri RA Jr, Haczku A, Amrani Y. Essential role of IFNβ and CD38 in TNFα-induced airway smooth muscle hyper-responsiveness. Immunobiology 213: 499–509, 2008. doi: 10.1016/j.imbio.2007.12.002. [DOI] [PMC free article] [PubMed] [Google Scholar]
- 30.Jones KA, Lorenz RR, Prakash YS, Sieck GC, Warner DO. ATP hydrolysis during contraction of permeabilized airway smooth muscle. Am J Physiol Lung Cell Mol Physiol 277: L334–L342, 1999. [DOI] [PubMed] [Google Scholar]
- 31.Jones KA, Perkins WJ, Lorenz RR, Prakash YS, Sieck GC, Warner DO. F-actin stabilization increases tension cost during contraction of permeabilized airway smooth muscle in dogs. J Physiol 519: 527–538, 1999. doi: 10.1111/j.1469-7793.1999.0527m.x. [DOI] [PMC free article] [PubMed] [Google Scholar]
- 32.Kimura K, Ito M, Amano M, Chihara K, Fukata Y, Nakafuku M, Yamamori B, Feng J, Nakano T, Okawa K, Iwamatsu A, Kaibuchi K. Regulation of myosin phosphatase by Rho and Rho-associated kinase (Rho-kinase). Science 273: 245–248, 1996. doi: 10.1126/science.273.5272.245. [DOI] [PubMed] [Google Scholar]
- 33.Kitazawa T, Masuo M, Somlyo AP. G protein-mediated inhibition of myosin light-chain phosphatase in vascular smooth muscle. Proc Natl Acad Sci USA 88: 9307–9310, 1991. doi: 10.1073/pnas.88.20.9307. [DOI] [PMC free article] [PubMed] [Google Scholar]
- 34.Kudo M, Khalifeh Soltani SM, Sakuma SA, McKleroy W, Lee TH, Woodruff PG, Lee JW, Huang K, Chen C, Arjomandi M, Huang X, Atabai K. Mfge8 suppresses airway hyperresponsiveness in asthma by regulating smooth muscle contraction. Proc Natl Acad Sci USA 110: 660–665, 2013. doi: 10.1073/pnas.1216673110. [DOI] [PMC free article] [PubMed] [Google Scholar]
- 35.Kudo M, Melton AC, Chen C, Engler MB, Huang KE, Ren X, Wang Y, Bernstein X, Li JT, Atabai K, Huang X, Sheppard D. IL-17A produced by αβ T cells drives airway hyper-responsiveness in mice and enhances mouse and human airway smooth muscle contraction. Nat Med 18: 547–554, 2012. doi: 10.1038/nm.2684. [DOI] [PMC free article] [PubMed] [Google Scholar]
- 36.Kuo KH, Herrera AM, Wang L, Paré PD, Ford LE, Stephens NL, Seow CY. Structure-function correlation in airway smooth muscle adapted to different lengths. Am J Physiol Cell Physiol 285: C384–C390, 2003. doi: 10.1152/ajpcell.00095.2003. [DOI] [PubMed] [Google Scholar]
- 37.Makwana R, Gozzard N, Spina D, Page C. TNF-α-induces airway hyperresponsiveness to cholinergic stimulation in guinea pig airways. Br J Pharmacol 165: 1978–1991, 2012. doi: 10.1111/j.1476-5381.2011.01675.x. [DOI] [PMC free article] [PubMed] [Google Scholar]
- 38.Mehta D, Gunst SJ. Actin polymerization stimulated by contractile activation regulates force development in canine tracheal smooth muscle. J Physiol 519: 829–840, 1999. doi: 10.1111/j.1469-7793.1999.0829n.x. [DOI] [PMC free article] [PubMed] [Google Scholar]
- 39.Morin C, Fortin S, Rousseau E. Docosahexaenoic acid monoacylglyceride decreases endothelin-1 induced Ca2+ sensitivity and proliferation in human pulmonary arteries. Am J Hypertens 25: 756–763, 2012. doi: 10.1038/ajh.2012.45. [DOI] [PubMed] [Google Scholar]
- 40.Morin C, Sirois M, Echave V, Gomes MM, Rousseau E. EET displays anti-inflammatory effects in TNF-α stimulated human bronchi: putative role of CPI-17. Am J Respir Cell Mol Biol 38: 192–201, 2008. doi: 10.1165/rcmb.2007-0232OC. [DOI] [PubMed] [Google Scholar]
- 41.Oakley BR, Kirsch DR, Morris NR. A simplified ultrasensitive silver stain for detecting proteins in polyacrylamide gels. Anal Biochem 105: 361–363, 1980. doi: 10.1016/0003-2697(80)90470-4. [DOI] [PubMed] [Google Scholar]
- 42.Padró T, Peña E, García-Arguinzonis M, Llorente-Cortes V, Badimon L. Low-density lipoproteins impair migration of human coronary vascular smooth muscle cells and induce changes in the proteomic profile of myosin light chain. Cardiovasc Res 77: 211–220, 2008. doi: 10.1093/cvr/cvm045. [DOI] [PubMed] [Google Scholar]
- 43.Parris JR, Cobban HJ, Littlejohn AF, MacEwan DJ, Nixon GF. Tumour necrosis factor-α activates a calcium sensitization pathway in guinea-pig bronchial smooth muscle. J Physiol 518: 561–569, 1999. doi: 10.1111/j.1469-7793.1999.0561p.x. [DOI] [PMC free article] [PubMed] [Google Scholar]
- 44.Sakai H, Otogoto S, Chiba Y, Abe K, Misawa M. TNF-α augments the expression of RhoA in the rat bronchus. J Smooth Muscle Res 40: 25–34, 2004. doi: 10.1540/jsmr.40.25. [DOI] [PubMed] [Google Scholar]
- 45.Sathish V, Delmotte PF, Thompson MA, Pabelick CM, Sieck GC, Prakash YS. Sodium-calcium exchange in intracellular calcium handling of human airway smooth muscle. PLoS One 6: e23662, 2011. doi: 10.1371/journal.pone.0023662. [DOI] [PMC free article] [PubMed] [Google Scholar]
- 46.Sathish V, Leblebici F, Kip SN, Thompson MA, Pabelick CM, Prakash YS, Sieck GC. Regulation of sarcoplasmic reticulum Ca2+ reuptake in porcine airway smooth muscle. Am J Physiol Lung Cell Mol Physiol 294: L787–L796, 2008. doi: 10.1152/ajplung.00461.2007. [DOI] [PubMed] [Google Scholar]
- 47.Sathish V, Thompson MA, Bailey JP, Pabelick CM, Prakash YS, Sieck GC. Effect of proinflammatory cytokines on regulation of sarcoplasmic reticulum Ca2+ reuptake in human airway smooth muscle. Am J Physiol Lung Cell Mol Physiol 297: L26–L34, 2009. doi: 10.1152/ajplung.00026.2009. [DOI] [PMC free article] [PubMed] [Google Scholar]
- 48.Sathish V, Yang B, Meuchel LW, VanOosten SK, Ryu AJ, Thompson MA, Prakash YS, Pabelick CM. Caveolin-1 and force regulation in porcine airway smooth muscle. Am J Physiol Lung Cell Mol Physiol 300: L920–L929, 2011. doi: 10.1152/ajplung.00322.2010. [DOI] [PMC free article] [PubMed] [Google Scholar]
- 49.Schaible N, Delmotte P, Sieck G. Mitochondrial excitation-energy coupling in airway smooth muscle. In: Mitochondrial Function in Lung Health and Disease, edited by Natarajan V, Parinandi NL. Totowa, NJ: Humana, 2014, p. 96–116. doi: 10.1007/978-1-4939-0829-5_5. [DOI] [Google Scholar]
- 50.Seow CY. Myosin filament assembly in an ever-changing myofilament lattice of smooth muscle. Am J Physiol Cell Physiol 289: C1363–C1368, 2005. doi: 10.1152/ajpcell.00329.2005. [DOI] [PubMed] [Google Scholar]
- 51.Sieck GC, Gransee HM. Respiratory muscles: structure, function & regulation. In: Colloquium Series on Integrated Systems Physiology: From Molecule to Function to Disease, edited by Granger DN, Granger J. San Rafael, CA: Morgan & Claypool Life; Sciences, 2012, vol. 34. [Google Scholar]
- 52.Sieck GC, Han YS, Pabelick CM, Prakash YS. Temporal aspects of excitation-contraction coupling in airway smooth muscle. J Appl Physiol (1985) 91: 2266–2274, 2001. [DOI] [PubMed] [Google Scholar]
- 53.Sieck GC, Han YS, Prakash YS, Jones KA. Cross-bridge cycling kinetics, actomyosin ATPase activity and myosin heavy chain isoforms in skeletal and smooth respiratory muscles. Comp Biochem Physiol B Biochem Mol Biol 119: 435–450, 1998. doi: 10.1016/S0305-0491(98)00005-4. [DOI] [PubMed] [Google Scholar]
- 54.Sieck GC, Zhan WZ, Han YS, Prakash YS. Effect of denervation on ATP consumption rate of diaphragm muscle fibers. J Appl Physiol (1985) 103: 858–866, 2007. doi: 10.1152/japplphysiol.00988.2006. [DOI] [PubMed] [Google Scholar]
- 55.Sugiura T, Murakami N. Separation of myosin heavy-chain isoforms in rat skeletal-muscles by gradient sodium dodecyl sulfate-polyacrylamide gel-electrophoresis. Biomed Res 11: 87–91, 1990. doi: 10.2220/biomedres.11.87. [DOI] [Google Scholar]
- 56.Sukkar MB, Hughes JM, Armour CL, Johnson PR. Tumour necrosis factor-α potentiates contraction of human bronchus in vitro. Respirology 6: 199–203, 2001. doi: 10.1046/j.1440-1843.2001.00334.x. [DOI] [PubMed] [Google Scholar]
- 57.Szymanski PT, Dickie R, Rogers R, Fredberg JJ. Extraction and reconstitution of calponin and consequent contractile ability in permeabilized smooth muscle fibers. Anal Biochem 321: 8–21, 2003. doi: 10.1016/S0003-2697(03)00395-6. [DOI] [PubMed] [Google Scholar]
- 58.Tang DD, Gunst SJ. The small GTPase Cdc42 regulates actin polymerization and tension development during contractile stimulation of smooth muscle. J Biol Chem 279: 51722–51728, 2004. doi: 10.1074/jbc.M408351200. [DOI] [PubMed] [Google Scholar]
- 59.Tirumurugaan KG, Jude JA, Kang BN, Panettieri RA, Walseth TF, Kannan MS. TNF-α induced CD38 expression in human airway smooth muscle cells: role of MAP kinases and transcription factors NF-κB and AP-1. Am J Physiol Lung Cell Mol Physiol 292: L1385–L1395, 2007. doi: 10.1152/ajplung.00472.2006. [DOI] [PubMed] [Google Scholar]
- 60.White TA, Xue A, Chini EN, Thompson M, Sieck GC, Wylam ME. Role of transient receptor potential C3 in TNF-α-enhanced calcium influx in human airway myocytes. Am J Respir Cell Mol Biol 35: 243–251, 2006. doi: 10.1165/rcmb.2006-0003OC. [DOI] [PMC free article] [PubMed] [Google Scholar]
- 61.Wójciak-Stothard B, Entwistle A, Garg R, Ridley AJ. Regulation of TNF-α-induced reorganization of the actin cytoskeleton and cell-cell junctions by Rho, Rac, and Cdc42 in human endothelial cells. J Cell Physiol 176: 150–165, 1998. doi:. [DOI] [PubMed] [Google Scholar]
- 62.Yokoyama T, Nakano M, Bednarczyk JL, McIntyre BW, Entman M, Mann DL. Tumor necrosis factor-α provokes a hypertrophic growth response in adult cardiac myocytes. Circulation 95: 1247–1252, 1997. doi: 10.1161/01.CIR.95.5.1247. [DOI] [PubMed] [Google Scholar]
- 63.Zhang W, Gunst SJ. Interactions of airway smooth muscle cells with their tissue matrix: implications for contraction. Proc Am Thorac Soc 5: 32–39, 2008. doi: 10.1513/pats.200704-048VS. [DOI] [PMC free article] [PubMed] [Google Scholar]
- 64.Zhang W, Huang Y, Gunst SJ. The small GTPase RhoA regulates the contraction of smooth muscle tissues by catalyzing the assembly of cytoskeletal signaling complexes at membrane adhesion sites. J Biol Chem 287: 33996–34008, 2012. doi: 10.1074/jbc.M112.369603. [DOI] [PMC free article] [PubMed] [Google Scholar]