Abstract
HDLs are a family of heterogeneous particles that vary in size, composition, and function. The structure of most HDLs is maintained by two scaffold proteins, apoA-I and apoA-II, but up to 95 other “accessory” proteins have been found associated with the particles. Recent evidence suggests that these accessory proteins are distributed across various subspecies and drive specific biological functions. Unfortunately, our understanding of the molecular composition of such subspecies is limited. To begin to address this issue, we separated human plasma and HDL isolated by ultracentrifugation (UC-HDL) into particles with apoA-I and no apoA-II (LpA-I) and those with both apoA-I and apoA-II (LpA-I/A-II). MS studies revealed distinct differences between the subfractions. LpA-I exhibited significantly more protein diversity than LpA-I/A-II when isolated directly from plasma. However, this difference was lost in UC-HDL. Most LpA-I/A-II accessory proteins were associated with lipid transport pathways, whereas those in LpA-I were associated with inflammatory response, hemostasis, immune response, metal ion binding, and protease inhibition. We found that the presence of apoA-II enhanced ABCA1-mediated efflux compared with LpA-I particles. This effect was independent of the accessory protein signature suggesting that apoA-II induces a structural change in apoA-I in HDLs.
Keywords: proteomics, high density lipoprotein/structure, ATP binding cassette transporter A1
HDLs are circulating complexes of protein and lipid best known for mobilizing cholesterol in the periphery and transporting it to the liver for excretion. The term HDL actually refers to a family of diverse subspecies that share similar hydrated densities. These can vary widely in size, protein/lipid composition, and charge [reviewed in (1)]. Recent MS studies across different laboratories have found up to 95 different proteins in HDL preparations (2). This compositional heterogeneity mirrors a well-known functional heterogeneity (3) in that HDLs can attenuate the oxidation of LDLs (4), reduce vascular cell-mediated inflammation (5), regulate proteolytic and thrombotic pathways [reviewed in (6)], reduce cellular apoptosis (7), and affect insulin secretion from pancreatic cells (8).
Despite advances in cataloging the lipoproteome, progress in molecularly characterizing lipoprotein subspecies in human plasma has been more limited. In the case of HDLs, a significant obstacle is the isolation of individual subspecies, most of which have similar physicochemical properties. For example, HDLs can be subdivided by density into HDL2 and HDL3 using sequential ultracentrifugation (UC) (9); however, each subclass retains significant compositional heterogeneity (10). Gel filtration chromatography similarly suffers from a lack of resolution with the added drawback of contaminating nonlipoprotein entities of similar size (11). Two-dimensional gel electrophoresis techniques have identified numerous size and charge subpopulations of HDLs (12), but there are obstacles with recovering them for functional characterization.
Thus, only a handful of HDL subspecies have been defined at the molecular level, with even fewer defined functionally. The prototypical example is trypanosome lytic factor (13), a HDL subparticle containing apoA-I, apoL-I, and haptoglobin-related protein. This protein triad can mediate the lysis of the parasite, Trypanosoma brucei, through a series of cooperative actions (14). Another widely recognized HDL subspecies is the preβ HDL particle identified by Castro and Fielding (15), now called preβ1. This lipid-poor species likely plays a key role in cholesterol efflux via ABCA1 (16–18). Cheung et al. (19) used immunoaffinity chromatography (IAC) to isolate plasma complexes containing phospholipid transfer protein. They found associations with clusterin, apoA-I, and complement and coagulation factors. Unfortunately, a functional role has not yet been determined for these particles. Although not as well characterized molecularly, Jensen et al. (20) demonstrated that HDL particles lacking apoC-III correlated more strongly with reduced coronary heart disease risk than those containing apoC-III. These examples support the concept of molecularly and functionally distinct HDL subspecies in biology and disease. Given the multitude of HDL proteins, there are probably many more functional subspecies to be discovered.
IAC can achieve protein-specific isolation of lipoprotein particles, while yielding sufficient native material for functional studies. Cheung and Albers (21) segregated UC-isolated HDLs into species with apoA-I, but no apoA-II (LpA-I), and those with both apoA-I and apoA-II (LpA-I/A-II). The relative abundance of these particles was altered in patients with LCAT deficiency (22), cholesteryl ester transfer protein (CETP) deficiency (23), type 2 diabetes (24), hyperlipidemia (25), and coronary heart disease (26). They also differed with regard to catabolism (27, 28), cholesterol efflux capacity (29, 30), LCAT and CETP activity (31, 32), and selective uptake of cholesteryl ester in the liver (33). Unfortunately, the proteomic characterizations were limited to a handful of proteins revealed using immunoassays available at the time. With the benefits of current shotgun proteomics technology, we revisited these subspecies with the goal of distinguishing the proteomic differences between the two particle types, isolated from both plasma and HDL isolated by UC (UC-HDL). We found that the presence of apoA-II can have profound effects on the proteomic content of the isolated particles and on their function in terms of cholesterol efflux.
METHODS
LpA-I and LpA-I/A-II subfractionation
Human plasma was obtained from the Hoxworth Blood Bank from four healthy male donors. LpA-I and LpA-I/A-II were isolated by IAC. For each donor, particles were isolated both directly from plasma (i.e., applied straight to the IAC columns) and from total UC-HDL (d = 1.063–1.210 g/ml) (34). Briefly, UC-HDL was obtained by sequential UC from fresh plasma by adjusting the density to 1.006 g/ml with potassium bromide and centrifuging in a 70Ti rotor at 360,000 g for 24 h to float the VLDL and chylomicrons. The bottom fraction was collected, adjusted to 1.063 g/ml, and centrifuged for 24 h to float IDL/LDL. The bottom fraction was collected, the density adjusted to 1.21 g/ml, and centrifuged for 48 h. The top fraction, containing the purified HDLs, was collected and dialyzed into PBS [10 mM PBS, 140 mM NaCl, 0.01% EDTA, 0.01% azide (pH 7.4)].
The subfractions were separated using IAC columns containing affinity-purified anti-apoA-I or anti-apoA-II antibodies (Academy Biomedical) covalently bound to Sepharose 4B resin. Samples were applied to the columns on a fast protein LC system (GE Healthcare) in PBS at 0.5 ml/min and 2 ml fractions were collected. Bound material was released with elution buffer [3 M NaSCN, 10 mM PBS, 140 mM NaCl, 0.01% EDTA, 0.01% azide (pH 7.4)] with immediate desalting on polyacrylamide 6000 columns (Thermo Fisher Scientific) according to manufacturer’s protocols. The isolation scheme is shown schematically in supplemental Fig. S1A, B. Plasma- and UC-HDL-derived particles were isolated with the column order reversed. Optimization experiments revealed the most efficient recovery resulted from using the apoA-II column first. However, due to issues involving aggregation of plasma proteins if the apoA-II column was used first, particles isolated from plasma required the reverse order. Nevertheless, as shown in the Results, the protein distributions, functions, and structural modifications were similar despite column order used. Purified fractions were combined and concentrated to ∼1 ml using Amicon Ultra-4 centrifugal filters at 2,000 g at 4°C. Samples were stored under N2 in glass tubes to minimize oxidation. All proteomic and functional assays were performed within 7 days of isolation. Nonspecific binding to the IAC columns was monitored by applying plasma to a column containing CNBr activated Sepharose 4B resin (catalog number 17-0430-01; GE Healthcare) at the same bed volume of the antibody charged columns and treated exactly the same.
Western blot analysis
LpA-I and LpA-I/A-II particles (3 μg total protein) were applied to an Any-KDTM mini gel (Bio-Rad) in sample buffer containing 2% SDS and 14.4 mM BME. Protein was transferred to a PVDF membrane using a Bio-Rad Trans-Blot Turbo transfer system. apoA-I was detected using a polyclonal rabbit anti-human antibody for plasma apoA-I (catalog number 178422; EMD Millipore) at a dilution of 1:2,500 and a secondary donkey anti-rabbit HRP-conjugated antibody (catalog number NA934V; GE Healthcare) at a dilution of 1:25,000. The blot was stripped using Restore stripping buffer (Thermo Fisher) and then reprobed with a goat anti-human antibody for plasma apoA-II (catalog number K34001G; Meridian Life Science) at a dilution of 1:1,000 and a secondary donkey anti-goat HRP-conjugated antibody (catalog number SC-2020; Santa Cruz Biotechnology) at a dilution of 1:20,000. Blots were developed using ECL solution (Thermo Fisher Scientific) and exposure time was adjusted for optimal signal.
Particle size and composition
HDL particle size was determined by subjecting subfractions (4 μg protein) to native PAGE on an 8–25% native PhastgelTM (GE Healthcare). Protein concentration was determined by a modified Markwell Lowry protein assay (35). Phosphatidylcholine (PC) was measured using an enzymatic kit from Wako (Richmond, VA) per the manufacturer’s instructions. Total cholesterol (TC) and free cholesterol (FC) were measured using an Amplex Red cholesterol assay (Molecular Probes) with and without esterase per the manufacturer’s instructions. Cholesterol ester (CE) mass was calculated by subtracting the FC from the TC and multiplying by 1.67 to account for the mass of the acyl chain. Particle size distribution was evaluated using size exclusion chromatography using three Superdex 200 gel filtration columns (10/300 GL; GE Healthcare) in series in PBS at 0.3 ml/min. Protein elutions were monitored by ultraviolet light absorption. Fluorescent lipids (18:1 Liss Rhod PE; Avanti Polar Lipids, Birmingham, AL) were included at 0.1% PL mass prior to the gel filtration columns. The PL elution pattern was generated by collecting 1.5 ml fractions and measuring fluorescence intensity at 583 nm (excitation 560 nm) on a QuantaMaster 40 spectrofluorometer (Photon Technology International).
MS samples
Samples undergoing MS analysis were dialyzed into 50 mM NH4HCO3 (pH 8.1) and 50 μg of each were lyophilized to dryness. For delipidation, samples were mixed in 1.0 ml of ice-cold chloroform:methanol (2:1 v/v), vortexed, and incubated on ice for 30 min. Ice-cold methanol was added to a final chloroform:methanol ratio of 1:1 (v/v) and protein was pelleted by centrifugation at 4,000 g for 30 min. Organic solvent was decanted and the pellet resuspended in 2 ml of ice-cold methanol and mixed by vortexing and sonication. Protein was pelleted by centrifugation and the pellet was resuspended in 90 μl of 20% methanol/80% 50 mM NH4HCO3 (pH 8.1). Samples were reduced with DTT at 10 mM for 30 min at 42°C. Reduced protein was carbamidomethylated with iodoacetamide at 40 mM in the dark at room temperature for 30 min. Twenty micrograms of each sample were digested with 1 μg of sequencing-grade trypsin (Promega) for 16 h at 37°C. An additional 1 μg of trypsin was added for 2 h at 37° C the following day. Samples were lyophilized to dryness by SpeedVac and stored at −20°C until MS analysis.
MS measurements
Nano-LC-MS/MS analyses were performed on a TripleTOF® 5600+ (AB Sciex, Toronto, Canada) coupled to an Eksigent (Dublin, CA) NanoLC-Ultra® nanoflow system. Dried samples were reconstituted in formic acid/water 0.1/99.9 (v/v), and 5 μl (∼1 μg of digest) were loaded onto a C18 IntegraFritTM trap column (New Objective, Inc.) at 2 μl/min in FA/water 0.1/99.9 (v/v) for 15 min to desalt and concentrate the samples. For the chromatographic separation, the trap-column was switched to align with the analytical column, Acclaim® PepMap100 (Dionex-Thermo Fisher Scientific). Peptides were eluted at 300 nl/min using a varying mobile phase gradient from 95% phase A (FA/water 0.1/99.9, v/v) to 40% phase B (FA/ACN 0.1/99.9 v/v) for 35 min (1% per min), then from 40% B to 85% B in 5 min with re-equilibration. Effluent was introduced to the mass spectrometer using a NANOSpray® III source (AB Sciex). The instrument was operated in positive ion mode for 65 min, where each cycle consisted of one TOF-MS scan (0.25 s accumulation time, in a m/z 350–1,600 window) followed by 30 information-dependent acquisition mode MS/MS scans on the most intense candidate ions selected from the initially performed TOF-MS scan during each cycle. Each product ion scan had an accumulation time of 0.075 s and CE of 43 with an 8 unit scan range. The .wiff files were converted to Mascot generic files using PeakView® v1.2.0.3 software (AB Sciex). Column cleaning was performed automatically with 1 cycle of a 15 min 30–95% acetonitrile gradient between each run.
Proteomic data analysis
Peptide spectral data was searched against the UniProtKB/Swiss-Prot Protein knowledgebase (release February 2016, 550,552 sequences) for Homo sapiens (20,273 sequences) using Mascot (2.2.07). Data was constrained to tryptic digestion with a maximum of three missed cleavages. Carbamidomethylation was set as a fixed modification and Met oxidation as a variable modification. Peptide and MS/MS mass tolerance was ±0.15 Da. Scaffold (v 4.3.4) was used for MS/MS-based peptide validation using X! Tandem (2010.12.01.1). Proteins and peptides were constrained to >99.9% and 95% identification probability, respectively. Additionally, proteins were only accepted if they contained a minimum of three unique peptides. Raw spectral counts were normalized to the maximum spectral count found within respective sample sets to adjust for small differences in protein mass injected onto the mass spectrometer. Spectral counts had to appear in at least two of the four donors to be reported.
Discoidal HDL particles and cross-linking
Human apoA-I and apoA-II were isolated from normal human plasma, as described (36) and recombinant particles were generated using the cholate dialysis method, as reported (37). LpA-I particles were made using an initial molar ratio of 1:78 apoA-I:POPC (Avanti Polar Lipids). LpA-I/A-II particles were made from a subset of three independent apoA-I rHDL particle stocks by introducing apoA-II at a molar ratio of 200:95 apoA-I:apoA-II and incubating for 48 h at 4°C. All particle preparations were purified on a Superose 6 sizing column (10/300; GE Healthcare) in PBS at 0.4 ml/min. Relevant fractions were pooled and concentrated by ultrafiltration to ∼1 mg/ml. Particles were cross-linked using bis-(sulfosuccinimidyl)suberate (BS3) (Thermo Scientific), as previously described (38). Cross-linking experiments were carried out at a molar ratio of 50:1 BS3:apoA-I for 12 h at 4°C.
Cholesterol efflux
Cholesterol efflux was measured using LpA-I and LpA-I/A-II particles, as described (39). RAW 264.7 macrophages were grown to confluency and incubated with media containing 1.0 μCi/ml [1,2-3H(N)]cholesterol ± 0.3 mM 8-bromo-cAMP. Media containing samples (20 μg/ml PC for particles or 10 μg/ml protein for plasma protein experiments) ± 0.3 mM 8-bromo-cAMP were incubated with the macrophages for 6 h. In all experiments, media alone and media containing 10 μg/ml of plasma apoA-I were included as controls. Cholesterol efflux was measured by harvesting the media, filtering with a 0.45 μm filter, and quantifying radiolabeled cholesterol by scintillation counting. Each subfraction from each donor was run in triplicate and the percent efflux was calculated by dividing the number of counts in the media by the total internalized counts per well (determined from the media-only treated cells). Where stated, the percent efflux was normalized by total protein mass of the samples incubated with the macrophages. Independent cholesterol efflux assays were performed on reconstituted particles using cholesterol mass transfer as the readout. TC in the media and cells was measured using an Amplex Red cholesterol assay kit (Molecular Probes). Cells were extracted by incubation with isopropanol overnight, dried down, and protein was determined by the Lowry protein assay.
Limited proteolysis
Samples were diluted to 0.4 mg/ml and sequencing-grade trypsin was added for various times at 37°C. Incubation time and protein:trypsin ratio were optimized based on the sample. At the indicated time intervals, the sample was removed and the reaction was quenched by addition of sample buffer containing SDS and boiling at 100°C for 10 min. Samples were stored at −20°C until ready for analysis by gel electrophoresis. Densitometry measurements were carried out using ImageJ (v 1.6.0, National Institutes of Health) and apoA-I band intensity was normalized to molecular mass markers corresponding to 20 and 25 kDa.
RESULTS
Purification of LpA-I and LpA-I/A-II
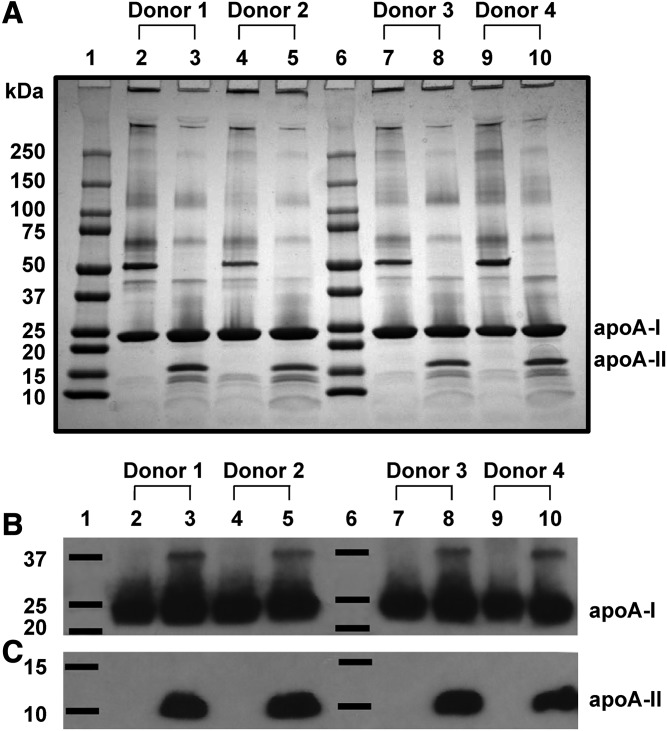
LpA-I and LpA-I/A-II particles were isolated by applying plasma directly to the anti-apoA-I column followed by the anti-apoA-II column (supplemental Fig. S1A). The separated species were analyzed by SDS-PAGE stained with Coomassie blue (Fig. 1A). We found differing banding patterns between LpA-I and LpA-I/A-II, but little variability within subfractions across the donors. apoA-I was present in all subfractions, while dimeric apoA-II (nonreducing gels) was present only in LpA-I/A-II. This was confirmed by Western blotting for both apoA-I and apoA-II (Fig. 1B, C). Interestingly, we observed a secondary band at ∼37 kDa when probing for both apoA-I and apoA-II in the LpA-I/A-II fractions (supplemental Fig. S2). This may represent a covalent linkage of a single apoA-I and single apoA-II molecule (∼36.8 kDa). The origin of this species is not clear, but it may arise from oxidative cross-linking either in vivo or during sample handling.
Fig. 1.
LpA-I and LpA-I/A-II separated from plasma. A: The 4–15% SDS-PAGE analysis of LpA-I and LpA-I/A-II particles separated from the plasma of four male donors. LpA-I particles are shown in lanes 2, 4, 7, and 9 and LpA-I/A-II particles are shown in lanes 3, 5, 8, and 10 with molecular mass markers in lanes 1 and 6. Each lane contains 10 μg of total protein stained with Coomassie blue. No reducing agent was present, thus the human apoA-II dimer band appears at ∼18 kDa. B, C: Western blots probed with antibodies for apoA-I and apoA-II, respectively. Three micrograms of total protein per lane were loaded onto an Any-KDTM mini gel in sample buffer containing β mercaptoethanol to reduce apoA-II to monomeric form. The loading order was identical to (A).
LpA-I and LpA-I/A-II subfractions were also isolated from UC-HDL. The column order was reversed versus the plasma experiments to maximize the efficiency of particle isolation (supplemental Fig. S1B). We found that the extent of separation was comparable to that of the plasma isolations. However, there were fewer bands by Coomassie-stained SDS-PAGE versus the same particles isolated from plasma (supplemental Fig. S3).
Subspecies characterization
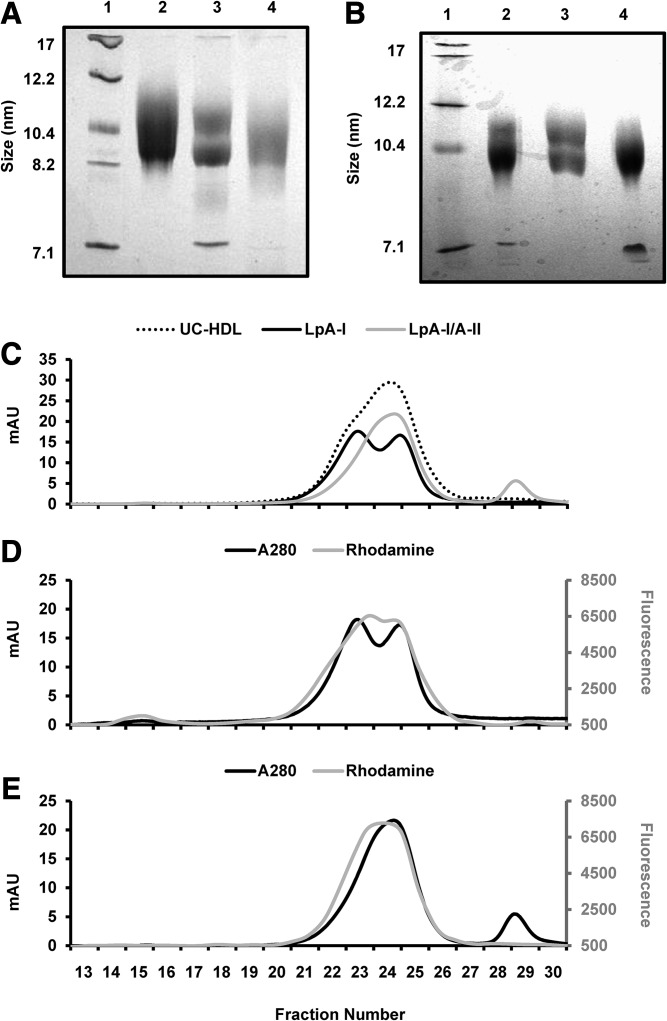
Supplemental Fig. S4 shows that both LpA-I and LpA-I/A-II isolated from plasma displayed classic α mobility by agarose gel electrophoresis, as expected for HDLs. We next analyzed the particle size of LpA-I and LpA-I/A-II isolated from plasma or UC-HDL by native PAGE (Fig. 2A, B, respectively). Unseparated UC-HDL ran as a diffuse band indicating a mixture of particles ranging from 8 to 12 nm in diameter. LpA-I particles (from plasma and UC-HDL) showed two distinct size populations of ∼9 and ∼11 nm in diameter. Lastly, the LpA-I/A-II particles (from plasma and UC-HDL) exhibited a diffuse band that was on the smaller end of the UC-HDL (8–10 nm in diameter). We also analyzed the particle sizes by gel filtration chromatography (Fig. 2C–E). Consistent with native PAGE, LpA-I exhibited a bimodal peak, while LpA-I/A-II were shifted to a smaller size and eluted as a single broad peak.
Fig. 2.
LpA-I and LpA-I/A-II particle size analysis. A: A native PAGE gel with protein standards (lane 1), UC-HDL (lane 2), plasma LpA-I particles (lane 3), and plasma LpA-I/A-II particles (lane 4). B: A native gel containing LpA-I and LpA-I/A-II particles isolated from UC-HDL run in the same format. Both gels were stained with Coomassie blue. UC-HDL and LpA-I and LpA-I/A-II particles subfractionated from UC-HDL were analyzed by size exclusion chromatography. C: The UV trace of protein for UC-HDL, LpA-I and LpA-I/A-II particles. LpA-I and LpA-I/A-II particles were labeled with fluorescent rhodamine to track the phospholipid elution pattern. D: The UV and phospholipid trace for LpA-I particles. E: The UV and PL trace for LpA-I/A-II particles.
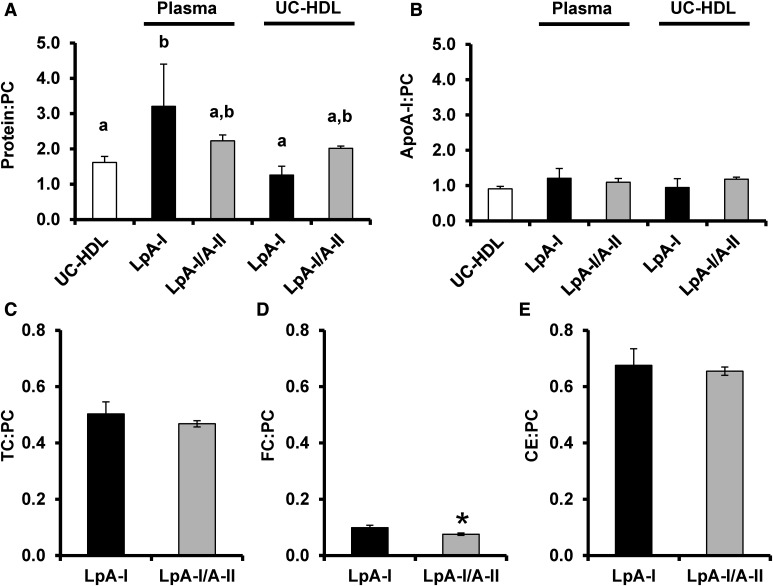
We next evaluated the particle composition. Unseparated UC-HDL exhibited a ratio of ∼1.6 mg protein to 1 mg PC, consistent with previous reports (40) (Fig. 3A). LpA-I from UC-HDL exhibited a slightly lower ratio, whereas LpA-I/A-II were slightly higher. In contrast, both the LpA-I and LpA-I/A-II from plasma exhibited a significantly higher protein to PC ratio than UC-isolated HDLs. Interestingly, LpA-I or LpA-I/A-II (regardless of source) did not differ from UC-HDL in terms of apoA-I to PC ratio (Fig. 3B). This suggests that IAC isolation may preserve more non-apoA-I proteins on the particles versus those subjected to UC. We also measured the cholesterol content of subspecies isolated from plasma and compared the ratio of TC, FC, and CE to PC (Fig. 3C–E). There were no differences between the populations, although we observed a minor decrease in the FC content of LpA-I/A-II compared with the LpA-I only particles (as a ratio to PC).
Fig. 3.
Particle protein and phospholipid composition. A: The total protein to PC mass ratio of UC-HDL and LpA-I and LpA-I/A-II subfractions isolated from plasma and UC-HDL. B: The apoA-I:PC mass ratio of UC-HDL and LpA-I and LpA-I/A-II subfractions isolated from plasma and UC-HDL. ApoA-I content was calculated by expressing apoA-I peptide spectral counts as a percentage of total protein spectral counts for each subfraction in each donor. Values were derived from the product of the percentage of apoA-I spectral counts with total protein as measured by Lowry protein assay. The bars represent the mean (±SD) for the four male donors and the letters indicate significant differences (P < 0.05) determined by a one-way ANOVA with a post hoc analysis using Tukey’s honestly significant difference test. C–E: The TC (C), FC (D), and CE (E) to PC mass ratios for LpA-I and LpA-I/A-II subfractions isolated from plasma. The bars represent the mean (±SD) for three male donors and asterisks indicate significant differences (P < 0.05) determined by a two-tailed paired Student’s t-test.
Proteomic comparison of UC-HDL and immuno-isolated lipoproteins
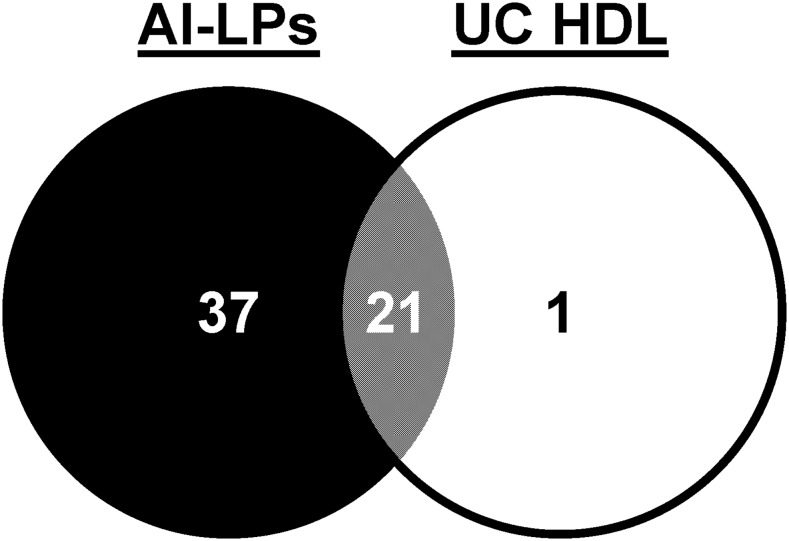
To get a sense of how isolation method affects the HDL proteome, we compared the proteomes of HDLs isolated by UC (the classic density-centric definition) and by immuno-isolation by passing plasma down an apoA-I affinity column (an apoA-I-centric definition). Strictly speaking, the preparations from the latter technique should not be defined as HDLs because these particles can be of any density so long as apoA-I is present. A better term is apoA-I-containing lipoproteins (AI-LPs). Note: it is important to distinguish AI-LPs from the LpA-I particles shown above. AI-LPs include both LpA-I and LpA-I/A-II particles as defined here. A Venn diagram of proteins identified on particles isolated by both techniques (compared at equal protein concentrations) is shown in Fig. 4. Fifty-nine proteins were detected across the two techniques; 58 in apoA-I-containing particles from plasma, but only 22 from UC-HDL. Twenty-one proteins were shared between the two preparations, while 37 were unique to AI-LPs. A single unique protein, serum amyloid A-4, was found in UC-HDL. Importantly, proteins nonspecifically adhering to the columns were subtracted from the analysis (supplemental Table S1). All protein identifications and peptide spectral counts for UC-HDL and AI-LPs are listed in supplemental Table S2.
Fig. 4.
Proteins associated with apoA-I-containing particles (particles isolated by IAC) and UC-HDL. AI-LPs were obtained from a single plasma pass over the anti-apoA-I column (N = 2 donors) and compared directly to HDL isolated by sequential UC (N = 4 donors) using LC/MS.
Proteomic comparison of LpA-I and LpA-I/A-II
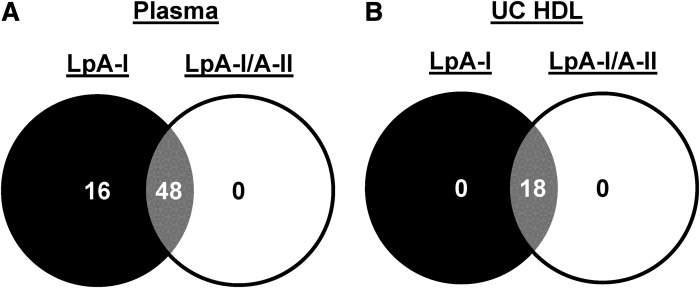
LpA-I and LpA-I/A-II isolated from either plasma or UC-HDL were subjected to proteomic analysis on the basis of equal total protein. For those isolated from plasma, the protein identifications and peptide spectral counts are shown in supplemental Tables S3 and S4. As illustrated in Fig. 5A, we identified 64 proteins across both subspecies isolated from plasma. Of these, 48 were in common between LpA-I and LpA-I/A-II. Sixteen were unique to LpA-I, while none were unique to LpA-I/A-II. Conversely, when the subspecies were separated from UC-HDL in Fig. 5B, we found only 18 proteins. Four proteins originally identified in the starting UC-HDL material (FIBA, CO3, CO4A, and TTHY) were excluded as they were not identified in the subfractions of at least two of the four donors. Interestingly, we did not see a differentiation in protein diversity between the subspecies isolated from UC-HDL like we did for those isolated from plasma.
Fig. 5.
Proteins associated with LpA-I and LpA-I/A-II particles isolated from plasma and UC-HDL. A: The unique proteins found in LpA-I and LpA-I/A-II particles isolated from plasma. B: The unique proteins found in LpA-I and LpA-I/A-II particles segregated from HDL isolated by UC. Proteomic data was obtained from plasma and UC-HDL acquired from four male donors.
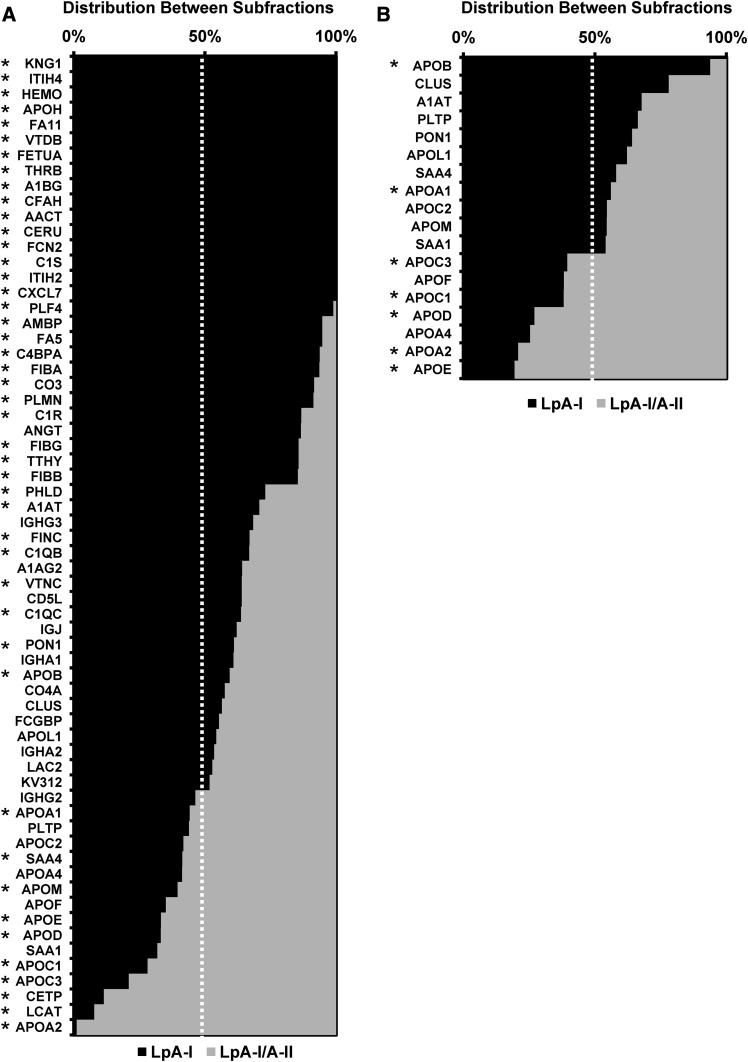
We used spectral counts to estimate the relative protein enrichment in each species (Fig. 6A, B). The complete data set is shown in supplemental Table S5. Proteins listed at the top were present only in the LpA-I fraction. Those at the bottom were most enriched in LpA-I/A-II. In both cases, LpA-I exhibited most of the proteomic diversity. For the plasma isolated species, 64 proteins were identified across the two subfractions. The additional proteins found across the subfractions compared with AI-LPs is likely due to protein enrichment and enhanced peptide spectral intensity for identification by MS after subfractionation. Of the 64 proteins identified, 45 showed statistically significant differences between the two particle preparations. Only nine proteins preferentially associated with the LpA-I/A-II particles (including apoA-II). For the subspecies isolated from UC-HDL, no unique proteins were found in either population. For proteins found in both experiments, we saw good concordance in terms of distribution between the preparations indicating the reverse column order used for particle isolation between plasma and UC-HDL samples had no effect on protein distribution. For example, apoD showed a distribution of about 25% (plasma) and 30% (UC-HDL) in LpA-I, which agreed well with immunoassay results by Cheung and Albers (21) showing a 31 ± 8% distribution in LpA-I.
Fig. 6.
Protein spectral count distribution across LpA-I and LpA-I/A-II particles. The protein distribution between LpA-I and LpA-I/A-II particles is shown for subfractions isolated from plasma (A) and UC-HDL (B). The proteins listed were identified in at least two out of the four donors. The bars show means and the asterisks denote statistically significant differences (P < 0.05) found between the subfractions determined by a two-tailed paired Student’s t-test.
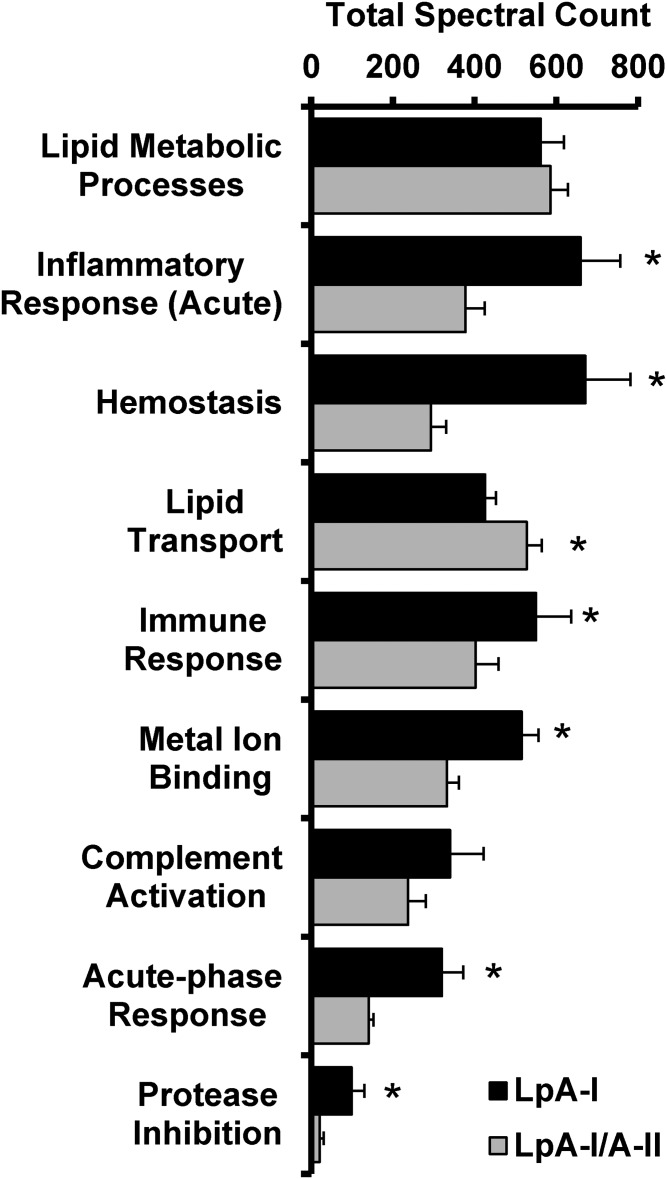
We next performed a gene ontology (GO) enrichment analysis to reveal potential functional differences of the subspecies based on their proteomic fingerprint (supplemental Table S6, Fig. 7). The analysis suggests both species play roles in lipid metabolic processes and complement activation. However, the LpA-I particles were enriched in proteins that mediate acute inflammatory response, hemostasis, immune response, metal ion binding, acute phase response, and protease inhibition. LpA-I/A-II, by contrast, were slightly enriched in proteins involved in lipid transport.
Fig. 7.
GO analysis of LpA-I and LpA-I/A-II particle proteomes. A GO analysis was derived from the proteomic fingerprint of LpA-I and LpA-I/A-II particles isolated from plasma. Proteins were grouped by their GO function (listed in supplemental Table S4) and spectral counts were averaged within each population and each donor. Bars represent the average of the four male donors (±SD) and asterisks denote statistically significant differences (P < 0.05) found between the subfractions determined by a two-tailed paired Student’s t-test.
Promotion of cholesterol efflux
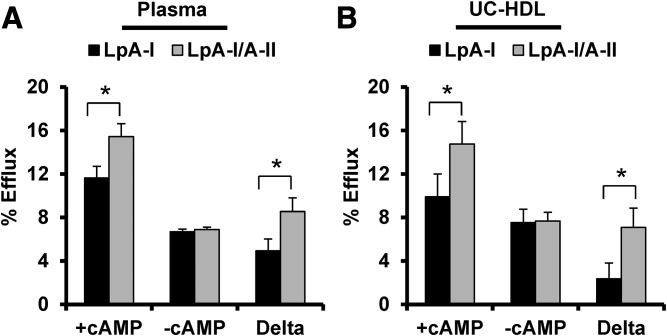
We next measured cholesterol efflux capacity of LpA-I and LpA-I/A-II isolated from plasma and UC-HDL. Experiments were done in the presence and absence of cAMP in cultured mouse macrophages as it upregulates ABCA1 expression (41). Plasma-derived LpA-I and LpA-I/A-II (Fig. 8A) performed similarly when compared at equal PL concentration in the absence of ABCA1. In the presence of ABCA1, the LpA-I/A-II particles showed a clear increase in efflux capacity versus LpA-I. This result was recapitulated when using samples prepared from UC-HDL (Fig. 8B). The differences persisted when the data was normalized with respect to protein (not shown).
Fig. 8.
Cholesterol efflux capacity of LpA-I and LpA-I/A-II particles separated from plasma and UC-HDL. Cholesterol efflux was measured in RAW 264 mouse macrophages and particles were compared at equal phospholipid mass (20 μg/ml). Cholesterol efflux was quantified in the presence and absence of cAMP with the difference assumed to represent ABCA1-mediated cholesterol efflux. A: LpA-I and LpA-I/A-II isolated from plasma. B: Same subspecies separated from UC-HDL. Bars represent the average of four donors (±SD) and asterisks denote statistically significant differences (P < 0.05) found between the subfractions determined by a two-tailed paired Student’s t-test.
Because LpA-I and LpA-I/A-II have distinct proteomes, the observed increases in cholesterol efflux capacity of LpA-I/A-II versus LpA-I could be due to the presence of apoA-II or the presence/absence of other proteins in Fig. 6. Additionally, the LpA-I/A-II particles appeared to contain slightly less FC. Thus, another possibility could be that differences in surface lipid composition could change cholesterol efflux efficiency. To distinguish among these possibilities, we generated highly defined reconstituted LpA-I and LpA-I/A-II particles in vitro. These were designed to be of similar size, contain no FC, and contain the same lipid composition (POPC), differing only in the presence or absence of apoA-II on the particle (see Methods). Supplemental Fig. S5A shows that the recombinant (r)LpA-I and rLpA-I/A-II particles were similar in diameter (∼9.5–10 nm). Despite our best efforts at purification, we observed a very faint smear in the rLpA-I/A-II particles. This could represent minor amounts of lipid-free apoA-I or a gel artifact as careful measures were taken to exclude unreacted protein and lipid during isolation by SEC. The particles were cross-linked with BS3 to evaluate the number of molecules of apoA-I and apoA-II on each particle. Supplemental Fig. S5B shows that apoA-I was present in both and apoA-II was present only in LpA-I/A-II. After cross-linking, the rLpA-I sample exhibited a band consistent with two cross-linked apoA-I molecules. rLpA-I/A-II showed an additional band consistent with two molecules of apoA-I and two molecules of apoA-II (∼74 kDa). Lastly, no significant differences were found in the PC:apoA-I molar ratio between the rLpA-I and rLpA-I/A-II particles (79 and 81, respectively). Thus, the only difference between the two was the presence of dimeric apoA-II.
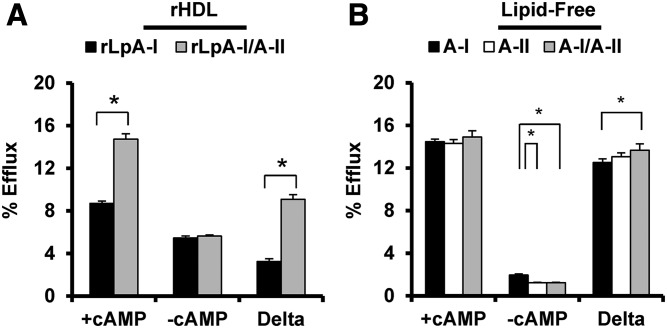
Figure 9A shows that both recombinant particles performed similarly in the absence of ABCA1, but the rLpA-I/A-II species outperformed the rLpA-I particles in the presence of ABCA1. We also measured cholesterol efflux capacity of lipid-free plasma apoA-I, apoA-II mixed at a molar ratio of 200:95 apoA-I:apoA-II; the same ratio used for the discoidal HDL particle preparations (Fig. 9B) at equivalent protein mass (10 μg/ml). In the absence of ABCA1, little cholesterol efflux was measured to the lipid-free proteins. In the presence of ABCA1, no differences were observed between apoA-I and apoA-II also consistent with previous reports (42, 43).
Fig. 9.
Cholesterol efflux capacity of rLpA-I and rLpA-I/A-II POPC particles and lipid-free plasma apoA-I and apoA-II. A: rLpA-I and rLpA-I/A-II POPC particles were present at equal PC mass (20 μg/ml) and cholesterol efflux capacity was quantified in the presence and absence of cAMP. B: Lipid-free plasma apoA-I, apoA-II, and a mixture of both at a molar ratio of 200:95 apoA-I:apoA-II were loaded at equal protein mass (10 μg/ml) and cholesterol efflux capacity was measured in the presence and absence of cAMP. The bars represent the average of three independent preparations (±SD) and the asterisks denote statistically significant differences (P < 0.05) found between the subfractions determined by a two-tailed paired Student’s t-test (A) and a one-way ANOVA with a post hoc analysis using Tukey’s honestly significant difference (B).
We worried that small amounts of lipid-free or lipid-poor apoA-I in the rLpA-I/A-II preparations might explain their enhanced ABCA1-mediated efflux. Densitometry was performed on native gels in supplemental Fig. S5A to quantify the traces of lipid-free protein in the rLpA-I/A-II sample (if not a gel artifact). Cholesterol efflux experiments were performed with equivalent protein masses of lipid-free plasma apoA-I spiked into the rLpA-I samples. rLpA-I/A-II particles still significantly outperformed the rLpA-I particle preparation containing the spiked lipid-free apoA-I (supplemental Fig. S6) arguing against a major role for contaminating lipid-free apoA-I. Lastly, to confirm the results from the radiolabel experiments, we repeated the experiment measuring TC mass transferred to the medium. Again, the LpA-I/A-II particles outperformed the LpA-I particles (supplemental Fig. S6C). Importantly, because the assay was performed on reconstituted particles lacking cholesterol, this argues against complication of the data from significant back flux of cholesterol from particles to the cells.
Effects of apoA-II on apoA-I structure
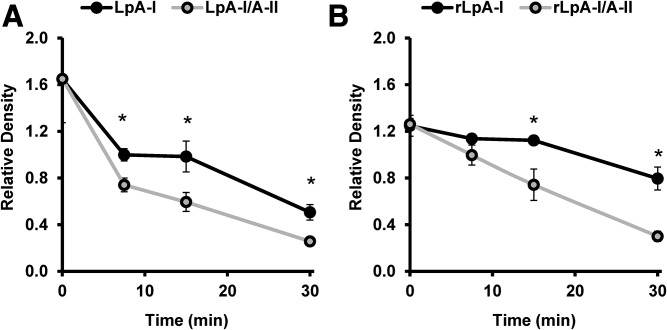
apoA-II can partially or completely displace apoA-I from lipoprotein particles (36, 44–46). Given the surprising observation that lipidated LpA-I/A-II promoted cholesterol efflux via ABCA1, we hypothesized that apoA-II can displace regions of apoA-I that interact with ABCA1. If so, then apoA-I should show increased susceptibility to trypsin in the presence of apoA-II. Proteolytic time courses were performed on plasma-derived LpA-I and LpA-I/A-II. SDS-PAGE gels for subfractions isolated from plasma, UC-HDL, and the discoidal HDL particles are shown in supplemental Fig. S7. The apoA-I degradation pattern from densitometry is shown for the subfractions isolated from plasma and the recombinant particles in Fig. 10A, B, respectively. Degradation of the subfractions isolated from UC-HDL was not quantified, as they were run for different time points only on two of the individuals; however, those results are presented in supplemental Fig. S7 and are consistent with Fig. 10. Proteolytic degradation of apoA-I occurred at a faster rate in all particles containing apoA-II. This difference was apparent as early as 7.5 min, suggesting that apoA-II alters apoA-I conformation such that it is more exposed on the particle surface.
Fig. 10.
Limited proteolysis of LpA-I and LpA-I/A-II. LpA-I and LpA-I/A-II subfractions isolated from plasma and reconstituted discoidal particles were incubated with sequencing-grade trypsin for 0, 7.5, 15, and 30 min at 37°C. The reactions were quenched by addition of SDS sample buffer and boiling samples for 10 min at 100°C. The samples were frozen at −20°C until ready for analysis by SDS-PAGE. The values represent the relative density of the band corresponding to apoA-I expressed as a ratio to the density of the molecular mass markers at 20 and 25 kDa. A: Proteolytic digestion of apoA-I from LpA-I and LpA-I/A-II fractions isolated from plasma. A total of 8 μg of total protein was incubated with trypsin at a mass ratio of 20:1 protein:Trypsin. The points represent the average of three donors (±SD). B: The proteolytic digestion of apoA-I from reconstituted rLpA-I and rLpA-I/A-II particles. A total of 4 μg of total protein was incubated with trypsin at a mass ratio of 40:1 protein:Trypsin. Points represent the average of three independent preparations (±SD). Asterisks denote statistically significant differences (P < 0.05) found between the subfractions at a single time point as determined by a two-tailed paired Student’s t-test.
DISCUSSION
Impact of UC on HDLs
Isolation of HDLs by sequential UC has been widely used for composition, structure, and function studies. A striking result here was the effect that UC had on the detectable proteins in HDLs. Nearly 40 additional proteins were identified in particles isolated by anti-apoA-I IAC versus those by UC, even after accounting for nonspecific associations with the IAC column. Also, LpA-I and LpA-I/A-II proteome differences found in plasma derived particles were ablated upon isolation of HDLs by UC. One trivial explanation is that IAC captures non-HDL species in plasma. Indeed, anything with apoA-I should be captured by the antibodies, including LDL, VLDL (47), or even micro particles (48). However, our gel filtration experiments (Fig. 2) revealed little LDL and VLDL in our preparations. Even if present, the LDL proteome is less complex and significantly overlaps with HDL (2, 49) and would not be expected to add 40 new proteins to the analysis. Micro particles have not been reported to contain significant amounts of apoA-I (50) consistent with a lack of protein detected in the void volume of the gel filtration column after IAC. Thus, we conclude that UC strips off certain HDL proteins. Indeed, high ionic strength and centrifugal forces have been implicated (51–55) as factors that can alter recovered lipoproteins. Given the recent shift away from HDL cholesterol content and toward particle functionality as a disease metric, it would seem that proteome alterations due to isolation method need to be carefully examined in future functional studies.
Compositional and functional features of HDL subspecies
In their classic reports, Cheung and colleagues used IAC to characterize human LpA-I and LpA-I/A-II (21, 31, 56, 57). With the benefit of current MS technology, our data shows clear differences in the proteomes of these species. In general, the classic “apos,” apoCs, apoD, apoE, etc., tended to be enriched in LpA-I/A-II, in agreement, in most cases, with previous reports (21, 55, 58). We also observed that ∼90% of LCAT and CETP resided in LpA-I/A-II. This differed from some previous reports (31), though there have been conflicting results (21, 25) perhaps because some studies reported enzyme activity and others protein mass.
As a result, our GO analysis indicated that the LpA-I/A-II particles were best associated with traditional lipid transport functions. One can speculate at least three ways that apoA-II might favor the association of lipid transport proteins. First, being highly surface active, apoA-II may alter particle surface packing characteristics to limit accessory protein access. Second, some proteins may associate with apoA-II through direct interaction. Third, apoA-II could influence apoA-I conformation to affect its interactions with docking proteins. Indeed, apoA-II has been shown to affect apoA-I conformation (36, 59) and may regulate its interaction with endothelial lipase (60).
By contrast, LpA-I particles showed the most proteomic diversity, sequestering many of the more “exotic” proteins in the HDL proteome, such as hemopexin, vitamin D binding protein, several complement factors, and some of the serpin protease inhibitors. This is remarkable given that the LpA-I species represents only about 1/3 of total HDLs (21). LpA-I particles were best associated with acute-phase/inflammatory response, hemostasis, immune response, metal ion binding, complement activation, and protease inhibition functions. Our data also suggest that most of these proteins may be weakly associated with LpA-I because they tend to be lost upon UC.
One surprising result reported here was the increase in ABCA1-mediated efflux from macrophages to LpA-I/A-II particles. When ABCA1 was not active, both LpA-I and LpA-I/A-II particles promoted cholesterol efflux similarly, likely via SR-BI and aqueous diffusion mechanisms. However, in the presence of ABCA1, the LpA-I/A-II particles were clearly superior. This occurred regardless of whether the subspecies were isolated directly from plasma, had an intervening UC step, or were reconstituted in vitro. Since the discovery of its role in apolipoprotein-mediated cholesterol efflux, the dogma has been that ABCA1 is only active with lipid-poor apolipoprotein acceptors. However, a recent study (61) has shown that small lipidated HDL particles can also interact with ABCA1 to promote cholesterol efflux. This effect drops off considerably with increasing particle size. Because LpA-I and LpA-I/A-II were of similar size, particularly in the reconstituted particles, size effects cannot explain our results. Another possibility is that the LpA-I/A-II preparations contained small amounts of lipid-free apoA-I that engaged ABCA1. While it is difficult to completely rule out the possibility that some apoA-I might be liberated from the particles during the cholesterol efflux assay, we performed careful experiments where lipid-free apoA-I was added back to our reconstituted particles in proportions that could be present in our preparations. In all cases, the additional cholesterol efflux provided by lipid-free apoA-I could not account for the differences observed with the particles alone. Given our limited proteolysis experiments, we believe that the best explanation for our data is that apoA-II can cause a change in apoA-I conformation that allows it to interact with ABCA1 while still in contact with a lipidated HDL particle. Ji and Jonas (62) showed that lipid-bound apoA-I is preferentially cleaved by trypsin at position 193, toward the C terminus of the molecule. Thus, apoA-II could displace the C-terminal portion of apoA-I, which has been shown by numerous laboratories to be the operational domain in the ABCA1 interaction (16, 63, 64). Of course, it may affect other regions also. This did not occur when apoA-I or apoA-II were mixed in the lipid-free state, suggesting that a lipid surface is required for this interaction.
In summary, our results are consistent with the concept that apoA-I forms a scaffold that promotes the interaction of numerous HDL accessory proteins with highly diverse functions. The presence of apoA-II can alter the affinity of many of these proteins, attracting some but repelling many others, with a tendency to bias the proteome toward lipid transport functions. With the HDL field focusing more on particle functionality, and because particle function is largely dictated by the resident proteins, we suggest that it is critical to further explore the factors that mediate protein distribution among HDL particles.
Supplementary Material
Footnotes
Abbreviations:
- AI-LP
- apoA-I-containing lipoprotein
- BS3
- bis-(sulfosuccinimidyl)suberate
- CE
- cholesterol ester
- CETP
- cholesteryl ester transfer protein
- FC
- free cholesterol
- GO
- gene ontology
- IAC
- immunoaffinity chromatography
- LpA-I
- lipoproteins with apoA-I and no apoA-II
- LpA-I/A-II
- lipoproteins with apoA-I and apoA-II
- PC
- phosphatidylcholine
- rLpA-I
- recombinant lipoproteins with apoA-I and no apoA-II
- rLpA-I/A-II
- recombinant lipoproteins with apoA-I and apoA-II
- TC
- total cholesterol
- UC
- ultracentrifugation
- UC-HDL
- HDL isolated by ultracentrifugation
This work was supported by American Heart Association Postdoctoral Fellowship Grant 16POST27710016 (to J.T.M); National Institutes of Health, National Heart, Lung, and Blood Institute Grants HL67093 (to W.S.D.), P01HL128203 (to W.S.D.), and HL111829 (to L.J.L.); and National Institute of General Medical Sciences Grant GM098458 (to W.S.D.). The MS data was acquired in the University of Cincinnati Proteomics Laboratory under the direction of Ken Greis on a mass spectrometer funded, in part, through a National Institutes of Health S10 shared instrumentation Grant (RR027015 Greis-PI). The content is solely the responsibility of the authors and does not necessarily represent the official views of the National Institutes of Health. The authors state they have no conflict of interest with this article.
The online version of this article (available at http://www.jlr.org) contains a supplement.
REFERENCES
- 1.Shah A. S., Tan L., Long J. L., and Davidson W. S.. 2013. Proteomic diversity of high density lipoproteins: our emerging understanding of its importance in lipid transport and beyond. J. Lipid Res. 54: 2575–2585. [DOI] [PMC free article] [PubMed] [Google Scholar]
- 2.Davidson W. S. 2017. Davidson Lab Webpage: Lipoprotein Proteome Watch. Accessed March 15, 2017, at www.DavidsonLab.com.
- 3.Gordon S. M., Hofmann S., Askew D. S., and Davidson W. S.. 2011. High density lipoprotein: it’s not just about lipid transport anymore. Trends Endocrinol. Metab. 22: 9–15. [DOI] [PMC free article] [PubMed] [Google Scholar]
- 4.Navab M., Hama S. Y., Anantharamaiah G. M., Hassan K., Hough G. P., Watson A. D., Reddy S. T., Sevanian A., Fonarow G. C., and Fogelman A. M.. 2000. Normal high density lipoprotein inhibits three steps in the formation of mildly oxidized low density lipoprotein: steps 2 and 3. J. Lipid Res. 41: 1495–1508. [PubMed] [Google Scholar]
- 5.Barter P. J., and Rye K. A.. 1996. High density lipoproteins and coronary heart disease. Atherosclerosis. 121: 1–12. [DOI] [PubMed] [Google Scholar]
- 6.Nofer J. R., Brodde M. F., and Kehrel B. E.. 2010. High-density lipoproteins, platelets and the pathogenesis of atherosclerosis. Clin. Exp. Pharmacol. Physiol. 37: 726–735. [DOI] [PubMed] [Google Scholar]
- 7.Muller C., Salvayre R., Negre-Salvayre A., and Vindis C.. 2011. HDLs inhibit endoplasmic reticulum stress and autophagic response induced by oxidized LDLs. Cell Death Differ. 18: 817–828. [DOI] [PMC free article] [PubMed] [Google Scholar]
- 8.Fryirs M. A., Barter P. J., Appavoo M., Tuch B. E., Tabet F., Heather A. K., and Rye K. A.. 2010. Effects of high-density lipoproteins on pancreatic beta-cell insulin secretion. Arterioscler. Thromb. Vasc. Biol. 30: 1642–1648. [DOI] [PubMed] [Google Scholar]
- 9.De Lalla O. F., and Gofman J. W.. 1954. Ultracentrifugal analysis of serum lipoproteins. Methods Biochem. Anal. 1: 459–478. [DOI] [PubMed] [Google Scholar]
- 10.Blanche P. J., Gong E. L., Forte T. M., and Nichols A. V.. 1981. Characterization of human high-density lipoproteins by gradient gel electrophoresis. Biochim. Biophys. Acta. 665: 408–419. [DOI] [PubMed] [Google Scholar]
- 11.Gordon S. M., Deng J., Lu L. J., and Davidson W. S.. 2010. Proteomic characterization of human plasma high density lipoprotein fractionated by gel filtration chromatography. J. Proteome Res. 9: 5239–5249. [DOI] [PMC free article] [PubMed] [Google Scholar]
- 12.Asztalos B. F., Sloop C. H., Wong L., and Roheim P. S.. 1993. Two-dimensional electrophoresis of plasma lipoproteins: recognition of new apo A-I-containing subpopulations. Biochim. Biophys. Acta. 1169: 291–300. [DOI] [PubMed] [Google Scholar]
- 13.Raper J., Fung R., Ghiso J., Nussenzweig V., and Tomlinson S.. 1999. Characterization of a novel trypanosome lytic factor from human serum. Infect. Immun. 67: 1910–1916. [DOI] [PMC free article] [PubMed] [Google Scholar]
- 14.Shiflett A. M., Bishop J. R., Pahwa A., and Hajduk S. L.. 2005. Human high density lipoproteins are platforms for the assembly of multi-component innate immune complexes. J. Biol. Chem. 280: 32578–32585. [DOI] [PubMed] [Google Scholar]
- 15.Castro G. R., and Fielding C. J.. 1988. Early incorporation of cell-derived cholesterol into pre-beta-migrating high-density lipoprotein. Biochemistry. 27: 25–29. [DOI] [PubMed] [Google Scholar]
- 16.Duong P. T., Weibel G. L., Lund-Katz S., Rothblat G. H., and Phillips M. C.. 2008. Characterization and properties of pre beta-HDL particles formed by ABCA1-mediated cellular lipid efflux to apoA-I. J. Lipid Res. 49: 1006–1014. [DOI] [PMC free article] [PubMed] [Google Scholar]
- 17.Chau P., Nakamura Y., Fielding C. J., and Fielding P. E.. 2006. Mechanism of prebeta-HDL formation and activation. Biochemistry. 45: 3981–3987. [DOI] [PubMed] [Google Scholar]
- 18.Mulya A., Lee J. Y., Gebre A. K., Thomas M. J., Colvin P. L., and Parks J. S.. 2007. Minimal lipidation of pre-beta HDL by ABCA1 results in reduced ability to interact with ABCA1. Arterioscler. Thromb. Vasc. Biol. 27: 1828–1836. [DOI] [PubMed] [Google Scholar]
- 19.Cheung M. C., Vaisar T., Han X., Heinecke J. W., and Albers J. J.. 2010. Phospholipid transfer protein in human plasma associates with proteins linked to immunity and inflammation. Biochemistry. 49: 7314–7322. [DOI] [PMC free article] [PubMed] [Google Scholar]
- 20.Jensen M. K., Rimm E. B., Furtado J. D., and Sacks F. M.. 2012. Apolipoprotein C-III as a potential modulator of the association between HDL-cholesterol and incident coronary heart disease. J. Am. Heart Assoc. 1: e000232. [DOI] [PMC free article] [PubMed] [Google Scholar]
- 21.Cheung M. C., and Albers J. J.. 1984. Characterization of lipoprotein particles isolated by immunoaffinity chromatography. Particles containing A-I and A-II and particles containing A-I but no A-II. J. Biol. Chem. 259: 12201–12209. [PubMed] [Google Scholar]
- 22.Rader D. J., Ikewaki K., Duverger N., Schmidt H., Pritchard H., Frohlich J., Clerc M., Dumon M. F., Fairwell T., Zech L., et al. 1994. Markedly accelerated catabolism of apolipoprotein A-II (ApoA-II) and high density lipoproteins containing ApoA-II in classic lecithin:cholesterol acyltransferase deficiency and fish-eye disease. J. Clin. Invest. 93: 321–330. [DOI] [PMC free article] [PubMed] [Google Scholar]
- 23.Ohta T., Nakamura R., Takata K., Saito Y., Yamashita S., Horiuchi S., and Matsuda I.. 1995. Structural and functional differences of subspecies of apoA-I-containing lipoprotein in patients with plasma cholesteryl ester transfer protein deficiency. J. Lipid Res. 36: 696–704. [PubMed] [Google Scholar]
- 24.Cavallero E., Brites F., Delfly B., Nicolaiew N., Decossin C., De Geitere C., Fruchart J. C., Wikinski R., Jacotot B., and Castro G.. 1995. Abnormal reverse cholesterol transport in controlled type II diabetic patients. Studies on fasting and postprandial LpA-I particles. Arterioscler. Thromb. Vasc. Biol. 15: 2130–2135. [DOI] [PubMed] [Google Scholar]
- 25.Moulin P., Cheung M. C., Bruce C., Zhong S., Cocke T., Richardson H., and Tall A. R.. 1994. Gender effects on the distribution of the cholesteryl ester transfer protein in apolipoprotein A-I-defined lipoprotein subpopulations. J. Lipid Res. 35: 793–802. [PubMed] [Google Scholar]
- 26.Asztalos B. F., Roheim P. S., Milani R. L., Lefevre M., McNamara J. R., Horvath K. V., and Schaefer E. J.. 2000. Distribution of ApoA-I-containing HDL subpopulations in patients with coronary heart disease. Arterioscler. Thromb. Vasc. Biol. 20: 2670–2676. [DOI] [PubMed] [Google Scholar]
- 27.Rader D. J., Castro G., Zech L. A., Fruchart J. C., and Brewer H. B. Jr. 1991. In vivo metabolism of apolipoprotein A-I on high density lipoprotein particles LpA-I and LpA-I,A-II. J. Lipid Res. 32: 1849–1859. [PubMed] [Google Scholar]
- 28.de Beer M. C., van der Westhuyzen D. R., Whitaker N. L., Webb N. R., and de Beer F. C.. 2005. SR-BI-mediated selective lipid uptake segregates apoA-I and apoA-II catabolism. J. Lipid Res. 46: 2143–2150. [DOI] [PubMed] [Google Scholar]
- 29.Barbaras R., Puchois P., Fruchart J. C., and Ailhaud G.. 1987. Cholesterol efflux from cultured adipose cells is mediated by LpAI particles but not by LpAI:AII particles. Biochem. Biophys. Res. Commun. 142: 63–69. [DOI] [PubMed] [Google Scholar]
- 30.Oikawa S., Mendez A. J., Oram J. F., Bierman E. L., and Cheung M. C.. 1993. Effects of high-density-lipoprotein particles containing Apo-a-I, with or without Apo-a-Ii, on intracellular cholesterol efflux. Biochim. Biophys. Acta. 1165: 327–334. [DOI] [PubMed] [Google Scholar]
- 31.Cheung M. C., Wolf A. C., Lum K. D., Tollefson J. H., and Albers J. J.. 1986. Distribution and localization of lecithin:cholesterol acyltransferase and cholesteryl ester transfer activity in A-I-containing lipoproteins. J. Lipid Res. 27: 1135–1144. [PubMed] [Google Scholar]
- 32.Ohta T., Nakamura R., Ikeda Y., Shinohara M., Miyazaki A., Horiuchi S., and Matsuda I.. 1992. Differential effect of subspecies of lipoprotein containing apolipoprotein A-I on cholesterol efflux from cholesterol-loaded macrophages: functional correlation with lecithin: cholesterol acyltransferase. Biochim. Biophys. Acta. 1165: 119–128. [DOI] [PubMed] [Google Scholar]
- 33.de Beer M. C., Durbin D. M., Cai L., Mirocha N., Jonas A., Webb N. R., de Beer F. C., and van Der Westhuyzen D. R.. 2001. Apolipoprotein A-II modulates the binding and selective lipid uptake of reconstituted high density lipoprotein by scavenger receptor BI. J. Biol. Chem. 276: 15832–15839. [DOI] [PubMed] [Google Scholar]
- 34.Lund-Katz S., and Phillips M. C.. 1986. Packing of cholesterol molecules in human low-density lipoprotein. Biochemistry. 25: 1562–1568. [DOI] [PubMed] [Google Scholar]
- 35.Markwell M. A., Haas S. M., Bieber L. L., and Tolbert N. E.. 1978. A modification of the Lowry procedure to simplify protein determination in membrane and lipoprotein samples. Anal. Biochem. 87: 206–210. [DOI] [PubMed] [Google Scholar]
- 36.Durbin D. M., and Jonas A.. 1997. The effect of apolipoprotein A-II on the structure and function of apolipoprotein A-I in a homogeneous reconstituted high density lipoprotein particle. J. Biol. Chem. 272: 31333–31339. [DOI] [PubMed] [Google Scholar]
- 37.Matz C. E., and Jonas A.. 1982. Micellar complexes of human apolipoprotein A-I with phosphatidylcholines and cholesterol prepared from cholate-lipid dispersions. J. Biol. Chem. 257: 4535–4540. [PubMed] [Google Scholar]
- 38.Melchior J. T., Walker R. G., Morris J., Jones M. K., Segrest J. P., Lima D. B., Carvalho P. C., Gozzo F. C., Castleberry M., Thompson T. B., et al. 2016. An evaluation of the crystal structure of C-terminal truncated apolipoprotein A-I in solution reveals structural dynamics related to lipid binding. J. Biol. Chem. 291: 5439–5451. [DOI] [PMC free article] [PubMed] [Google Scholar]
- 39.Smith L. E., and Davidson W. S.. 2010. The role of hydrophobic and negatively charged surface patches of lipid-free apolipoprotein A-I in lipid binding and ABCA1-mediated cholesterol efflux. Biochim. Biophys. Acta. 1801: 64–69. [DOI] [PMC free article] [PubMed] [Google Scholar]
- 40.Shen B. W., Scanu A. M., and Kezdy F. J.. 1977. Structure of human serum lipoproteins inferred from compositional analysis. Proc. Natl. Acad. Sci. USA. 74: 837–841. [DOI] [PMC free article] [PubMed] [Google Scholar]
- 41.Oram J. F., Lawn R. M., Garvin M. R., and Wade D. P.. 2000. ABCA1 is the cAMP-inducible apolipoprotein receptor that mediates cholesterol secretion from macrophages. J. Biol. Chem. 275: 34508–34511. [DOI] [PubMed] [Google Scholar]
- 42.Remaley A. T., Stonik J. A., Demosky S. J., Neufeld E. B., Bocharov A. V., Vishnyakova T. G., Eggerman T. L., Patterson A. P., Duverger N. J., Santamarina-Fojo S., et al. 2001. Apolipoprotein specificity for lipid efflux by the human ABCAI transporter. Biochem. Biophys. Res. Commun. 280: 818–823. [DOI] [PubMed] [Google Scholar]
- 43.Alexander E. T., and Phillips M. C.. 2013. Influence of apolipoprotein A-I and apolipoprotein A-II availability on nascent HDL heterogeneity. J. Lipid Res. 54: 3464–3470. [DOI] [PMC free article] [PubMed] [Google Scholar]
- 44.Lagocki P. A., and Scanu A. M.. 1980. In vitro modulation of the apolipoprotein composition of high density lipoprotein. Displacement of apolipoprotein A-I from high density lipoprotein by apolipoprotein A-II. J. Biol. Chem. 255: 3701–3706. [PubMed] [Google Scholar]
- 45.Edelstein C., Halari M., and Scanu A. M.. 1982. On the mechanism of the displacement of apolipoprotein A-I by apolipoprotein A-II from the high density lipoprotein surface. Effect of concentration and molecular forms of apolipoprotein A-II. J. Biol. Chem. 257: 7189–7195. [PubMed] [Google Scholar]
- 46.Safi W., Maiorano J. N., and Davidson W. S.. 2001. A proteolytic method for distinguishing between lipid-free and lipid-bound apolipoprotein A-I. J. Lipid Res. 42: 864–872. [PubMed] [Google Scholar]
- 47.Karlsson H., Leanderson P., Tagesson C., and Lindahl M.. 2005. Lipoproteomics I: mapping of proteins in low-density lipoprotein using two-dimensional gel electrophoresis and mass spectrometry. Proteomics. 5: 551–565. [DOI] [PubMed] [Google Scholar]
- 48.Wolf P. 1967. The nature and significance of platelet products in human plasma. Br. J. Haematol. 13: 269–288. [DOI] [PubMed] [Google Scholar]
- 49.Singh S. A., Andraski A. B., Pieper B., Goh W., Mendivil C. O., Sacks F. M., and Aikawa M.. 2016. Multiple apolipoprotein kinetics measured in human HDL by high-resolution/accurate mass parallel reaction monitoring. J. Lipid Res. 57: 714–728. [DOI] [PMC free article] [PubMed] [Google Scholar]
- 50.Duong P. T., Collins H. L., Nickel M., Lund-Katz S., Rothblat G. H., and Phillips M. C.. 2006. Characterization of nascent HDL particles and microparticles formed by ABCA1-mediated efflux of cellular lipids to apoA-I. J. Lipid Res. 47: 832–843. [DOI] [PubMed] [Google Scholar]
- 51.van’t Hooft F., and Havel R. J.. 1982. Metabolism of apolipoprotein E in plasma high density lipoproteins from normal and cholesterol-fed rats. J. Biol. Chem. 257: 10996–11001. [PubMed] [Google Scholar]
- 52.Castro G. R., and Fielding C. J.. 1984. Evidence for the distribution of apolipoprotein E between lipoprotein classes in human normocholesterolemic plasma and for the origin of unassociated apolipoprotein E (Lp-E). J. Lipid Res. 25: 58–67. [PubMed] [Google Scholar]
- 53.Gibson J. C., Rubinstein A., Ngai N., Ginsberg H. N., Le N. A., Gordon R. E., Goldberg I. J., and Brown W. V.. 1985. Immunoaffinity isolation of apolipoprotein E-containing lipoproteins. Biochim. Biophys. Acta. 835: 113–123. [DOI] [PubMed] [Google Scholar]
- 54.Cheung M. C., and Wolf A. C.. 1988. Differential effect of ultracentrifugation on apolipoprotein A-I-containing lipoprotein subpopulations. J. Lipid Res. 29: 15–25. [PubMed] [Google Scholar]
- 55.James R. W., Hochstrasser D., Tissot J. D., Funk M., Appel R., Barja F., Pellegrini C., Muller A. F., and Pometta D.. 1988. Protein heterogeneity of lipoprotein particles containing apolipoprotein-A-I without apolipoprotein-A-II and apolipoprotein-A-I with apolipoprotein-A-II isolated from human-plasma. J. Lipid Res. 29: 1557–1571. [PubMed] [Google Scholar]
- 56.Cheung M. C., Segrest J. P., Albers J. J., Cone J. T., Brouillette C. G., Chung B. H., Kashyap M., Glasscock M. A., and Anantharamaiah G. M.. 1987. Characterization of high density lipoprotein subspecies: structural studies by single vertical spin ultracentrifugation and immunoaffinity chromatography. J. Lipid Res. 28: 913–929. [PubMed] [Google Scholar]
- 57.Cheung M. C., Brown B. G., Wolf A. C., and Albers J. J.. 1991. Altered particle size distribution of apolipoprotein A-I-containing lipoproteins in subjects with coronary artery disease. J. Lipid Res. 32: 383–394. [PubMed] [Google Scholar]
- 58.Nestruck A. C., Niedmann P. D., Wieland H., and Seidel D.. 1983. Chromatofocusing of human high density lipoproteins and isolation of lipoproteins A and A-I. Biochim. Biophys. Acta. 753: 65–73. [DOI] [PubMed] [Google Scholar]
- 59.Gauthamadasa K., Vaitinadin N. S., Dressman J. L., Macha S., Homan R., Greis K. D., and Silva R. A.. 2012. Apolipoprotein A-II-mediated conformational changes of apolipoprotein A-I in discoidal high density lipoproteins. J. Biol. Chem. 287: 7615–7625. [DOI] [PMC free article] [PubMed] [Google Scholar]
- 60.Jahangiri A., Rader D. J., Marchadier D., Curtiss L. K., Bonnet D. J., and Rye K. A.. 2005. Evidence that endothelial lipase remodels high density lipoproteins without mediating the dissociation of apolipoprotein A-I. J. Lipid Res. 46: 896–903. [DOI] [PubMed] [Google Scholar]
- 61.Du X. M., Kim M. J., Hou L., Le G. W., Chapman M. J., Van E. M., Curtiss L. K., Burnett J. R., Cartland S. P., Quinn C. M., et al. 2015. HDL particle size is a critical determinant of ABCA1-mediated macrophage cellular cholesterol export. Circ. Res. 116: 1133–1142. [DOI] [PubMed] [Google Scholar]
- 62.Ji Y., and Jonas A.. 1995. Properties of an N-terminal proteolytic fragment of apolipoprotein AI in solution and in reconstituted high density lipoproteins. J. Biol. Chem. 270: 11290–11297. [DOI] [PubMed] [Google Scholar]
- 63.Panagotopulos S. E., Witting S. R., Horace E. M., Hui D. Y., Maiorano J. N., and Davidson W. S.. 2002. The role of apolipoprotein A-I helix 10 in apolipoprotein-mediated cholesterol efflux via the ATP-binding cassette transporter ABCA1. J. Biol. Chem. 277: 39477–39484. [DOI] [PubMed] [Google Scholar]
- 64.Favari E., Bernini F., Tarugi P., Franceschini G., and Calabresi L.. 2002. The C-terminal domain of apolipoprotein A-I is involved in ABCA1-driven phospholipid and cholesterol efflux. Biochem. Biophys. Res. Commun. 299: 801–805. [DOI] [PubMed] [Google Scholar]
Associated Data
This section collects any data citations, data availability statements, or supplementary materials included in this article.


