Abstract
Social status is one of the strongest predictors of human disease risk and mortality, and it also influences Darwinian fitness in social mammals more generally. To understand the biological basis of these effects, we combined genomics with a social status manipulation in female rhesus macaques to investigate how status alters immune function. We demonstrate causal but largely plastic social status effects on immune cell proportions, cell type–specific gene expression levels, and the gene expression response to immune challenge. Further, we identify specific transcription factor signaling pathways that explain these differences, including low-status–associated polarization of the Toll-like receptor 4 signaling pathway toward a proinflammatory response. Our findings provide insight into the direct biological effects of social inequality on immune function, thus improving our understanding of social gradients in health.
Many human societies exhibit social gradients in health (1). Socioeconomic status has been called the “fundamental cause” of health inequalities (2), and, in the United States, differences between the highest versus lowest socioeconomic stratum may affect adult life span by more than a decade (3). These patterns arise, in part, from differences in resource access and health risk behaviors. However, studies in hierarchically organized animal species suggest that they may also be more deeply embedded in our evolutionary history (4). In rhesus macaques and long-tailed macaques, social subordination has been linked to changes in cardiovascular health, hypothalamic-pituitary-adrenal axis function, inflammation, and gene expression in peripheral blood mononuclear cells (PBMCs) (5–7). Such findings suggest strong parallels between responses to social adversity in humans and other social primates, especially in their consequences for the regulation of the immune system (8, 9).
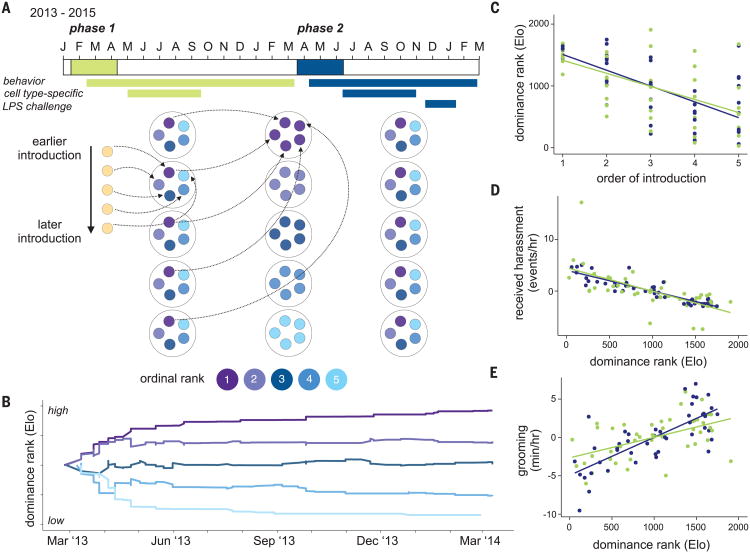
We aimed to test how social status influences immune system function at multiple scales, using an experimental design that allowed us to infer its direct causal effects. We experimentally manipulated the dominance ranks of 45 adult female rhesus macaques, a species that naturally forms stable, linear social hierarchies. In captivity, female rank can be manipulated by sequential introduction of adult females into newly constructed social groups, such that earlier introduction predicts higher status (10) (measured here with continuous Elo ratings: a higher status corresponds to a higher value) (11). We constructed nine groups of five female macaques each (table S1). We maintained these groups for 1 year (phase one) (Fig. 1, A and B) and then rearranged group composition by performing sequential introduction of phase-one females from the same or adjacent ranks into new groups, which we again followed for 1 year (phase two).
Fig. 1. Experimental paradigm.
(A) Timeline for group formation in phase one (green: January 2013 to March 2014) and phase two (blue: March 2014 to March 2015), with timelines for behavioral data collection and sample collection shown below.The schematic below the timeline illustrates how groups were formed in phase one, rearranged at the study midpoint, and allowed to organize into new hierarchies during phase two. (B) Example of group formation: Each line represents a different female, introduced sequentially into a new social group. All females entered the group with the same Elo rating but rapidly established a stable hierarchy that persisted until the end of phase one. (C) Order of introduction into a newly formed social group predicted dominance rank (Elo rating) in phase one (green: Pearson's r = −0.57, P = 4.1 × 10⁻⁵) and phase two (blue: r = −0.68, P = 3.3 × 10⁻⁷). (D) Dominance rank predicted rates of received harassment in phase one (green: r = −0.64, P = 2.0 × 10⁻⁶) and phase two (blue: r = −0.90, P = 1.8 × 10⁻¹⁷). (E) Rates of grooming interactions in phase one (green: r = 0.53, P = 2.1 × 10⁻⁴) and phase two (blue: r = 0.75, P = 4.0 × 10⁻⁹). In (C) to (E), lines show the best-fit slope and intercept from a linear model. Rates of harassment and grooming in (D) and (E) are mean-centered to 0 for each social group.
Our study maximized within-individual changes in dominance rank (Pearson's correlation coefficient r = 0.06, P = 0.68 between phases) (fig. S1), thus avoiding the possibility of confounding rank effects on immune function with other study-subject characteristics. In both phases, the order of introduction predicted social status (phase one Pearson's r = −0.57, P = 4.1 × 10⁻⁵; phase two r = −0.68, P = 3.3 × 10⁻⁷) (Fig. 1C), and social status in turn influenced rates of received harassment (higher for low-status females) (Fig. 1D) and affiliative grooming behavior (higher for high-status females) (Fig. 1E).
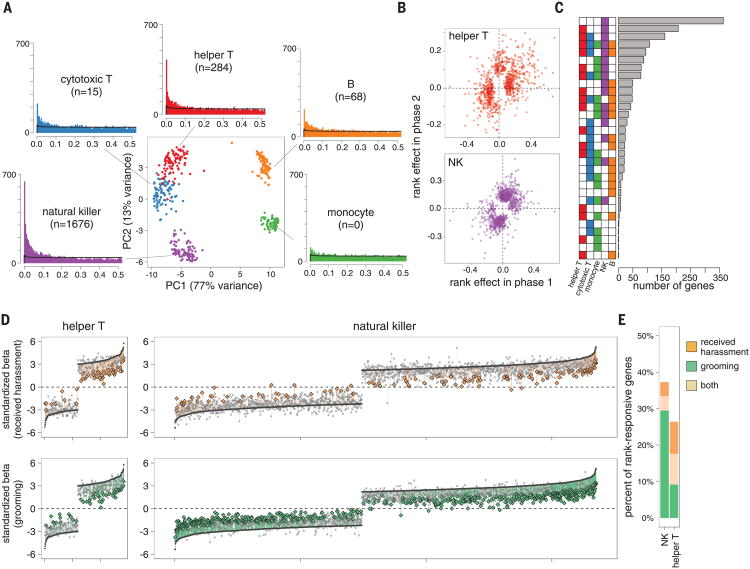
These manipulations revealed both compositional and cell type–specific effects on the immune system. Across phases, high-ranking females had increased proportional representation of CD3+ CD8+ cytotoxic T cells [linear mixed model P = 9.9 × 10⁻³, consistent with (5)] and double-positive CD3+CD8+CD4+ T cells (P= 6.9 × 10⁻³) and trended toward decreased polymorphonuclear and increased natural killer (NK) cell representation (P = 0.11 for both) (fig. S2). To investigate intra-cellular changes in gene expression independently of variation in leukocyte composition, we used fluorescence-activated cell sorting to isolate the five major PBMC cell types: CD3+CD4+ helper T cells, CD3+CD8+ cytotoxic T cells, CD3–CD20+ B cells, CD14+ monocytes, and CD3–CD16+NK cells (fig. S3 and table S2). RNA-seq (RNA sequencing) profiling on the resulting samples (n = 440 female-phase-cell population combinations following quality control) (table S3) enabled us to separate the distinct cell types according to the relationships expected from hematopoietic cell differentiation (Fig. 2A).
Fig. 2. Cell type–specific effects of dominance rank on gene expression.
(A) PCA separates the five FACS-purified immune cell types we investigated (sampled from 45 distinct females in two phases of the study; see table S3). The number of rank-responsive genes in each cell type is shown in parentheses (FDR < 10%; black line shows permutation-based null expectations). (B) Rank effects on gene expression in phase one are positively correlated with rank effects on gene expression in phase two, indicating plasticity in these effects (see also fig. S5). (C) Meta-analysis across cell types identifies NK-specific effects as the most common pattern, followed by effects that are shared across NK and helper Tcells. (D) Mediation analysis for received harassment (top) and grooming rates (bottom) for helper Tcells (left) and NK cells (right). Genes are ordered by the effect size of rank on gene expression levels (dark gray crossmarks; gaps in effect sizes occur because only rank-responsive genes are shown), and “lollipops” connect the effect of dominance rank without including the mediator to the effect of dominance rank when the mediator is taken into account. Colored lines show significant mediating effects, based on 1000 bootstrap iterations. (E) Proportion of rank-responsive genes with significant mediation effects for received harassment (orange), grooming (green), or both (beige).
Within cell types, we identified variable signatures of dominance rank on gene expression levels. NK cells were by far the most sensitive to social status [n = 1676 rank-responsive genes, false discovery rate (FDR) < 10%], followed by a secondary signal in helper T cells (n = 284 genes). In contrast, we identified weak effects of dominance rank in B cells and cytotoxic T cells (n = 68 and 15 genes, respectively) and no detectable effect of dominance rank in purified monocytes (Fig. 2A and table S4). Within the set of NK cell rank-responsive genes, Gene Ontology (GO) enrichment analysis revealed increased expression of lymphocyte proliferation [Fisher's exact test (FET) P = 7.8 × 10⁻³], innate immune response (P = 9.9 × 10⁻⁴), and cytokine response genes in low-ranking females (P = 5.0 × 10⁻⁴), consistent with a proinflammatory phenotype (fig. S4 and table S5). However, this relationship was generally plastic: Although female ranks were scrambled between study phases, the effects of rank were positively correlated and highly directionally concordant between phase one and phase two for rank-responsive genes (helper T cells: Pearson's r = 0.41, P = 1.95 × 10⁻³⁴, 69.3% concordant; NK cells: r = 0.49, P = 6.62 × 10−71, 79.7% concordant) (Fig. 2B and fig. S5). Improvements in social status are thus rapidly reflected in gene expression patterns, even in relatively long-lived cell types such as T cells (12).
Our results suggest that most effects of social status are cell type–specific, in contrast to the high degree of sharing observed for genetic effects on gene expression levels [i.e., expression quantitative trait loci (13, 14)]. However, analyzing each cell type in isolation tends to be anticonservative with respect to cell type specificity, because shared effects could bemissedif agene falls below the significance threshold in one cell type but slightly above it in another. We therefore performed a meta-analysis on genes that were detectably expressed in all five cell types and rank-responsive in at least one cell type (n = 1622 genes). Of the 32 possible combinations of rank effects (present or absent in each of the five cell types), we identified an NK-specific configuration as the most common (n = 363 genes), followed by shared effects across the two most-sensitive cell types, NK and helper T cells (n = 207 genes) (Fig. 2C). Thus, substantial cell type heterogeneity in rank-responsive genes is supported even when using a conservative, meta-analytic approach.
We next investigated the behavioral mechanisms that give rise to social status effects on gene expression, focusing on NK and helper T cells where the observed effects were strongest. Mediation analysis revealed that rates of received harassment—a measure of the agonistic, competitive element of social status inequality— contributed to these effects for 17.3% (helper T) and 7.8% (NK) of rank-responsive genes, respectively. However, in rhesus macaques, dominance rank also influences affiliative social interactions (15). Grooming rates mediated rank effects on gene expression levels for 17.6% of genes in helper T cells, comparable to the results for agonistic interactions. In contrast, grooming behavior was more important than harassment for rank-responsive NK genes (n = 560 genes, 33.4% of all rank-responsive genes; χ2 test P = 1.33 × 10−74) (Fig. 2, D and E). A lack of positive social interactions may therefore be equally or more important than social subordination per se in shaping social status effects on gene expression, consistent with the known effects of social integration on health and mortality in both humans and other primates (16–18).
The patterns we observed are most likely to contribute to social gradients in health if they affect the ability to respond to external threats, such as pathogen exposure. Thus, we next tested for social status–dependent effects on the response to lipopolysaccharide (LPS), a component of Gram-negative bacteria that invokes a strong inflammatory response [an aspect of immune function thought to be influenced by social environmental conditions (4, 5, 9)]. We collected two blood samples from each female in phase two: (i) a control sample incubated for 4 hours in media and (ii) an experimental sample incubated in parallel in media plus 1 μg/ml LPS. We then used RNA-seq to profile gene expression levels for the white blood cell fraction from each sample (n = 40 LPS and 43 control samples retained after quality control) (table S3).
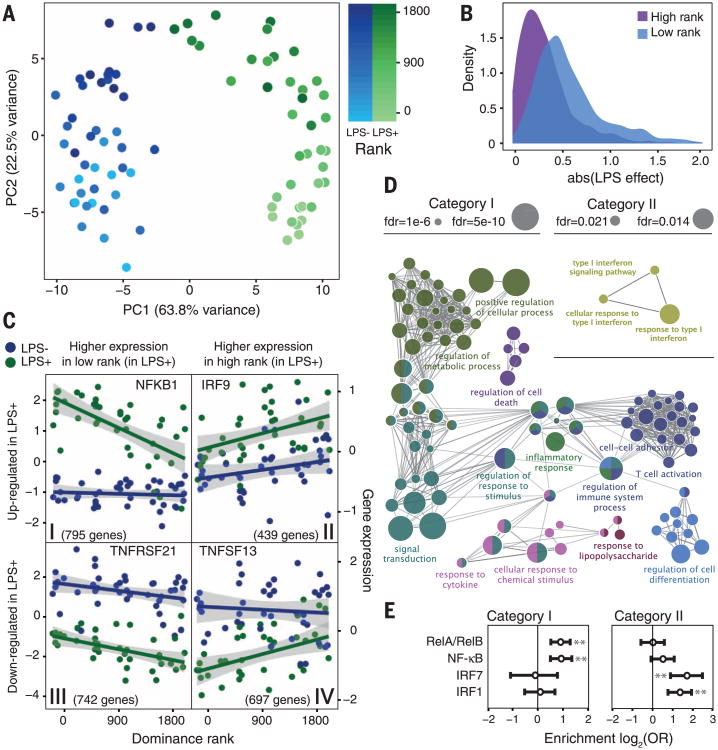
Principal components analysis (PCA) of the gene expression data reveals robust signals of both condition (control versus LPS) and social status (Fig. 3A). In both conditions, control and LPS-stimulated samples separate on PC1 (Student's t = 24.72, P = 4.4 × 10⁻³⁴), and females separate according to dominance rank on PC2 (Pearson's r = 0.83, P = 3.5 × 10⁻²²). Immune stimulation also exacerbates the effects of rank. Although social status effects were globally correlated across conditions (Pearson's r = 0.50, P < 10−300), we identified twice as many rank-responsive genes in the LPS condition than in the control condition (3494 versus 1799 genes, FDR < 1%) (fig. S6 and table S6). This observation may be partially explained by status-related variation in gluco-corticoid (GC) physiology (19). Sensitivity to dexa-methasone challenge significantly mediated social status effects on gene expression for 42 rank-responsive genes in the control condition and 155 genes in the LPS condition, including key regulators of the inflammatory response such as TRAF3 and MAP2K1. Further, these GC mediation effects were significantly larger in the LPS condition thaninthe control condition, consistent with the known immunomodulatory effects of GC signaling (Mann-Whitney test P = 1.5 × 10⁻⁴) (fig. S7). These results suggest that social status directly affects the immune response in addition to gene expression at the baseline. We identified 1834 genes (FDR < 1%) for which the intensity of the response to LPS varied depending on dominance rank (table S6), with a stronger overall response in low-ranking females (Mann-Whitney test P = 2.0 × 10−145) (Fig. 3B).
Fig. 3. Social status influences the immune response to LPS stimulation.
(A) PCA decomposition of the control (LPS−) and LPS–stimulated (LPS+) gene expression data. PC1 separates samples by condition; PC2 separates by rank. (B) Across all LPS-responsive genes, the effect of LPS stimulation is larger in low-ranking females than in high-ranking females (data for lowest- versus highest-ranking females are shown). abs(LPS effect): absolute value of the LPS effect on gene expression levels. (C) The four categories of genes affected by LPS in a rank-dependent manner. (D) Selected GO term enrichment for category I and II genes (see table S7 for the complete set). (E) Open chromatin regions near category I genes are enriched for predicted NF-κB binding sites, whereas open chromatin regions near category II genes are enriched for interferon regulatory factor binding sites. Error bars denote the 95% confidence interval of the odds ratio (OR); asterisks indicate statistical significance at P < 0.0001.
We next stratified the data set on the basis of the direction of the response to LPS and the direction of the dominance rank effect after LPS stimulation (Fig. 3C). Among the four resulting gene sets, only two exhibited biologically coherent enrichment for specific pathways. Among LPS-up-regulated genes more highly expressed in low-status females after stimulation (category I genes, n = 795 genes), we found enrichment for GO terms associated with the response to bacterial infection (Fig. 3D and table S7), including the inflammatory response (FET P = 8.4 × 10⁻¹⁰) and cytokine production (FET P = 4.2 × 10⁻⁶). Notably, category I contains several master regulators of the innate immune response, including components of the nuclear factor κB (NF-κB) transcription factor complex (NFKBID, NFKBIZ, and NFKB1) (Fig. 3C) and the transcription factors STAT3 and STAT5A, which are involved in the response to proinflammatory cytokines and growth factor signaling (20, 21). In contrast, LPS-up-regulated genes more highly expressed in high-status females after stimulation (category II genes, n = 439 genes) were enriched specifically for GO terms associated with type I interferon signaling (Fig. 3D).
To further investigate signaling pathways associated with categories I and II, we generated ATAC-seq (Assay for Transposase-Accessible Chromatin with high-throughput sequencing) data for PBMCs sampled from three female macaques to identify open chromatin regions. Overlapping open chromatin regions with category II gene locations revealed enrichment for predicted interferon regulatory factor binding sites within 5 kb of the transcription start site (IRF1, FET P = 7.43 × 10⁻⁶; IRF7, P = 3.67 × 10⁻⁵) (Fig. 3E and table S8). In contrast, the same analysis for category I genes revealed enrichment for NF-κB binding sites (RELA/RELB, P = 5.30 × 10⁻⁶; NF-κB, P = 1.88 × 10⁻⁵) (Fig. 3E) but no enrichment for IRF signaling. Notably, binding sites for inflammation-related transcription factors, including NF-κB, were also enriched among social status–responsive genes in NK cells (fig. S8 and table S8).
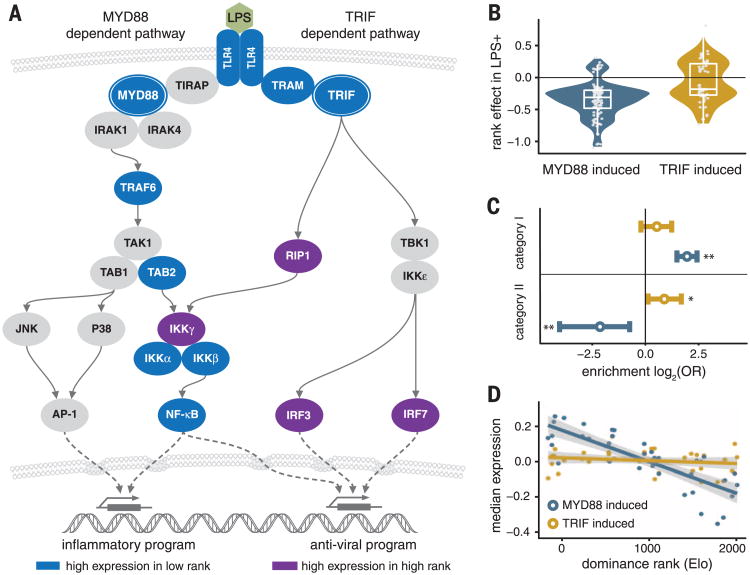
The immune response to LPS is primarily mediated by monocytes and polymorphonuclear cells (fig. S9) and, specifically, signaling from Toll-like receptor 4 (TLR4), the receptor for LPS. LPS binding to TLR4 triggers two alternative signaling pathways: a MyD88-dependent proinflammatory pathway, mediated at the transcriptional level by NF-κB, and a TRIF-dependent antiviral pathway, mediated at the transcriptional level by IRF3 and IRF7 (22). The GO and transcription factor binding site enrichment analyses for category I and category II genes suggest that low- and high-status females use different pathways in response to immune challenges. Specifically, low-status females show enhanced activation of the MyD88-dependent pathway, whereas high-status individuals are shifted toward the TRIF-dependent antiviral response (Fig. 4A). Rank-responsive genes induced by LPS via the MyD88-dependent pathway [on the basis of comparisons between wild-type and knockout mice (23)] are almost exclusively category I genes, whereas TRIF-dependent genes are slightly enriched and MyD88-dependent genes are significantly underrepresented in category II (Fig. 4, B and C). As a result, median gene expression levels across all rank-responsive MyD88-dependent genes are predicted by dominance rank (Pearson's r = −0.80, P = 4.6 × 10⁻¹⁰) (Fig. 4D), supporting status-related differences in the TLR4-mediated immune response.
Fig. 4. Dominance rank polarizes TLR4 responses to LPS stimulation.
(A) Key players in the MyD88-dependent and TRIF-dependent response to LPS-induced TLR4 signaling. Rank-responsive genes in these pathways are shown in blue (category I genes) and purple (category II genes). (B) Rank-responsive genes that are up-regulated upon stimulation via the MyD88 pathway (“MyD88-induced”) are almost universally (89.3%) more highly expressed in low-status females in the LPS+ condition, whereas TRIF-induced, rank-responsive genes are split (Mann-Whitney test for the difference between MyD88-induced and TRIF-induced genes: P = 8.31 × 10⁻⁷). (C) MyD88-induced genes are overrepresented among category I genes [FET log2(OR) = 1.95, P = 1.6 × 10⁻¹⁵] but significantly underrepresented in category II [log2(OR) = −2.14, P = 4.1 × 10⁻⁴]. TRIF-induced genes are significantly overrepresented in category II [log2(OR) = 0.89, P = 0.04]. (D) Median gene expression levels across all MyD88- and TRIF-induced genes for each female, by female dominance rank.
Together, our findings show that social subordination alone is sufficient to alter immune function even in the absence of variation in resource access, health care, or health risk behaviors. As macaques are close evolutionary relatives of humans, these results likely point to mechanisms that also underlie social status effects in humans, where experimental studies are not possible (24). Our results also demonstrate that social status influences the immune system at multiple scales, ranging from coarse leukocyte compositional patterns, to changes in cell type-specific gene expression patterns, to altered usage of specific signaling pathways in response to an immune challenge that models bacterial infection. In particular, we provide genome-wide experimental evidence for the idea that social hierarchies polarize the immune response toward a proinflammatory, antibacterial phenotype in low-status individuals and an antiviral phenotype in high-status individuals (8). This distinction raises questions about the disease conditions and potential selection pressures associated with variation in social status, including whether status predicts investment in more- or less-costly forms of immune defense (25). Our findings also lay the groundwork for further investigation of social status effects on other aspects of immune function, such as viral defense and adaptive immunity.
Supplementary Material
Acknowledgments
We thank J. Whitley, A. Tripp, N. Brutto, and J. Johnson for maintaining the study subjects and collecting behavioral data; I. Cummings for assistance with flow cytometry; M. Gutierrez for help with figures; and S. Cole, A. J. Lea, A. Graham, and members of the Tung and Barreiro labs for helpful comments and discussion. This work was supported by NIH grants R01-GM102562, P51-OD011132, and T32-AG000139; NSF grant SMA-1306134; the Canada Research Chairs Program 950-228993; and NSERC RGPIN/435917-2013. J. S. was supported by the Fonds de recherche du Québec-Nature et technologies and the Fonds de recherche du Québec-Santé. We thank Calcul Québec and Compute Canada for providing access to the supercomputer Briaree from the University of Montreal. RNA-seq and ATAC-seq data have been deposited in Gene Expression Omnibus (accession number GSE83307). Code and data are available at github.com/nsmackler/status_genome_2016.
References and Notes
- 1.Marmot M. Lancet. 2005;365:1099–1104. doi: 10.1016/S0140-6736(05)71146-6. [DOI] [PubMed] [Google Scholar]
- 2.Link BG, Phelan J. J Health Soc Behav. 1995;35:80–94. [PubMed] [Google Scholar]
- 3.Chetty R, et al. JAMA. 2016;315:1750–1766. doi: 10.1001/jama.2016.4226. [DOI] [PMC free article] [PubMed] [Google Scholar]
- 4.Sapolsky RM. Science. 2005;308:648–652. doi: 10.1126/science.1106477. [DOI] [PubMed] [Google Scholar]
- 5.Tung J, et al. Proc Natl Acad Sci U S A. 2012;109:6490–6495. doi: 10.1073/pnas.1202734109. [DOI] [PMC free article] [PubMed] [Google Scholar]
- 6.Michopoulos V, Reding KM, Wilson ME, Toufexis D. Horm Behav. 2012;62:389–399. doi: 10.1016/j.yhbeh.2012.07.014. [DOI] [PMC free article] [PubMed] [Google Scholar]
- 7.Shively CA, Clarkson TB, Kaplan JR. Atherosclerosis. 1989;77:69–76. doi: 10.1016/0021-9150(89)90011-7. [DOI] [PubMed] [Google Scholar]
- 8.Cole SW. PLOS Genet. 2014;10:e1004601. doi: 10.1371/journal.pgen.1004601. [DOI] [PMC free article] [PubMed] [Google Scholar]
- 9.Irwin MR, Cole SW. Nat Rev Immunol. 2011;11:625–632. doi: 10.1038/nri3042. [DOI] [PMC free article] [PubMed] [Google Scholar]
- 10.Jarrell H, et al. Physiol Behav. 2008;93:807–819. doi: 10.1016/j.physbeh.2007.11.042. [DOI] [PMC free article] [PubMed] [Google Scholar]
- 11.Neumann C, et al. Anim Behav. 2011;82:911–921. [Google Scholar]
- 12.Sprent J. Curr Opin Immunol. 1993;5:433–438. doi: 10.1016/0952-7915(93)90065-z. [DOI] [PubMed] [Google Scholar]
- 13.Flutre T, Wen X, Pritchard J, Stephens M. PLOS Genet. 2013;9:e1003486. doi: 10.1371/journal.pgen.1003486. [DOI] [PMC free article] [PubMed] [Google Scholar]
- 14.Ardlie KG, et al. Science. 2015;348:648–660. doi: 10.1126/science.1262110. [DOI] [PMC free article] [PubMed] [Google Scholar]
- 15.Snyder-Mackler N, et al. Anim Behav. 2016;111:307–317. doi: 10.1016/j.anbehav.2015.10.033. [DOI] [PMC free article] [PubMed] [Google Scholar]
- 16.Archie EA, Tung J, Clark M, Altmann J, Alberts SC. Proc Biol Sci. 2014;281:20141261. doi: 10.1098/rspb.2014.1261. [DOI] [PMC free article] [PubMed] [Google Scholar]
- 17.Silk JB, et al. Curr Biol. 2010;20:1359–1361. doi: 10.1016/j.cub.2010.05.067. [DOI] [PubMed] [Google Scholar]
- 18.Holt-Lunstad J, Smith TB, Layton JB. PLOS Med. 2010;7:e1000316. doi: 10.1371/journal.pmed.1000316. [DOI] [PMC free article] [PubMed] [Google Scholar]
- 19.Kohn JN, et al. Psychoneuroendocrinology. 2016;74:179–188. doi: 10.1016/j.psyneuen.2016.09.005. [DOI] [PMC free article] [PubMed] [Google Scholar]
- 20.Lawrence T. Cold Spring Harb Perspect Biol. 2009;1:a001651. doi: 10.1101/cshperspect.a001651. [DOI] [PMC free article] [PubMed] [Google Scholar]
- 21.O'Shea JJ, Murray PJ. Immunity. 2008;28:477–487. doi: 10.1016/j.immuni.2008.03.002. [DOI] [PMC free article] [PubMed] [Google Scholar]
- 22.Akira S, Takeda K. Nat Rev Immunol. 2004;4:499–511. doi: 10.1038/nri1391. [DOI] [PubMed] [Google Scholar]
- 23.Ramsey SA, et al. PLOS Comput Biol. 2008;4:e1000021. doi: 10.1371/journal.pcbi.1000021. [DOI] [PMC free article] [PubMed] [Google Scholar]
- 24.Marmot MG, Sapolsky R. In: Sociality, Hierarchy, Health: Comparative Biodemography. Weinstein M, Lane MA, editors. National Academies Press; 2014. pp. 365–388. [PubMed] [Google Scholar]
- 25.Hamilton R, Siva-Jothy M, Boots M. Proc Biol Sci. 2008;275:937–945. doi: 10.1098/rspb.2007.1574. [DOI] [PMC free article] [PubMed] [Google Scholar]
Associated Data
This section collects any data citations, data availability statements, or supplementary materials included in this article.


