

Abstract
TNFα is a potent inducer of inflammation due to its ability to promote gene expression, in part via the NFκB pathway. Moreover, in some contexts, TNFα promotes Caspase-dependent apoptosis or RIPK1/RIPK3/MLKL-dependent necrosis. Engagement of the TNF Receptor Signaling Complex (TNF-RSC), which contains multiple kinase activities, promotes phosphorylation of several downstream components, including TAK1, IKKα/IKKβ, IκBα, and NFκB. However, immediate downstream phosphorylation events occurring in response to TNFα signaling are poorly understood at a proteome-wide level. Here we use Tandem Mass Tagging-based proteomics to quantitatively characterize acute TNFα-mediated alterations in the proteome and phosphoproteome with or without inhibition of the cIAP-dependent survival arm of the pathway with a SMAC mimetic. We identify and quantify over 8,000 phosphorylated peptides, among which are numerous known sites in the TNF-RSC, NFκB, and MAP kinase signaling systems, as well as numerous previously unrecognized phosphorylation events. Functional analysis of S320 phosphorylation in RIPK1 demonstrates a role for this event in suppressing its kinase activity, association with CASPASE-8 and FADD proteins, and subsequent necrotic cell death during inflammatory TNFα stimulation. This study provides a resource for further elucidation of TNFα-dependent signaling pathways.
The NFκB signaling pathway is a crucial component of the immune system and its dysregulation has been implicated in inflammatory and auto-immune diseases, as well as cancer (1). At the cornerstone of the pathway are five dimeric transcription factors, NFκB1, NFκB2, RelA, RelB, and c-Rel, collectively known as the NFκB family, which are localized in the cytoplasm and rendered inactive under basal cellular conditions through multiple mechanisms (2, 3). A variety of cytokines and growth factors activate NFκB signaling via canonical or non-canonical pathways, leading to the nuclear translocation of NFκB and subsequent transcriptional upregulation of a plethora of inflammatory and pro-survival related genes (3).
The pro-inflammatory cytokine TNFα is a potent inducer of NFκB signaling and stimulates both the canonical and non-canonical pathways of the NFκB signaling cascade depending on the availability and activity of its downstream components (4). TNFα-mediated activation of canonical NFκB signaling is initiated by the trimerization of its cognate receptor TNFR1, and the subsequent recruitment of a cohort of kinases, ubiquitin ligases, and de-ubiquitylases, which form the TNF Receptor signaling complex (TNF-RSC)1 (3). Here, the cIAP ubiquitin ligases promote the formation of K11- and K63-linked ubiquitin chains on the Receptor Interacting Protein Kinase 1 RIPK1 (5), which function as a platform for the TAB/TAK kinases. The IKK complex is then recruited to the TNF-RSC via linear ubiquitin chains, assembled by the HOIL-1/HOIP/SHARPIN enzyme complex (also known as the linear ubiquitin chain assembly complex, LUBAC), that associates with RIPK1 following TNFα stimulation (6–8). Linear-K63 ubiquitin hybrid chains facilitate the colocalization of the TAB/TAK kinases and the IKK complex, permitting the phosphorylation and activation of IKKα and IKKβ kinases by TAK1 (9). The activated IKK complex phosphorylates the IκBα protein, leading to its poly-ubiquitylation and proteasomal degradation, with subsequent translocation of NFκB1 and NFκB2 complexes to the nucleus (10). Non-canonical NFκB signaling requires phosphorylation of NFκB2 by the NFκB-Inducing Kinase, NIK, which under basal conditions, is poly-ubiquitylated and targeted for proteasomal degradation in a cIAP-dependent manner (11). Genetic deletion or pharmacological inhibition of the cIAP proteins leads to the stabilization of NIK and activation of the noncanonical pathway (12). Although the canonical and non-canonical NFκB pathways differ in their early steps, they have similar downstream effects, in that they ultimately promote transcriptional upregulation of pro-inflammatory genes.
Given its role in RIPK1 ubiquitylation, cIAPs play a central role in the TNFα signaling pathway, and it is not surprising that agents that affect cIAP function would dramatically alter signaling through the pathway. It is now clear that SMAC-mimetics act, at least in part, by redirecting the ubiquitin ligase activity of cIAP from RIPK1 to cIAP itself, leading to rapid cIAP degradation by the proteasome (13–15). In this setting, the absence of ubiquitin chains on RIPK1 prevents its association with the TNF-RSC, leading to the formation of a cytosolic complex with the FADD and CASPASE-8 proteins, known as the Complex II (16). This initiates the cell death response of TNFα/NFκB signaling, and may lead to caspase-dependent apoptosis or RIPK1/RIPK3/MLKL-dependent programmed necrosis (17). The favored pathway following Complex II formation is apoptosis; however under conditions where caspases are inhibited or RIPK3 and MLKL are abundant, necrosis is preferred (18, 19).
Because TNFα exposure potentially activates two fundamentally alternate responses, cell death or cell survival, it is imperative that one be suppressed if the other is to dominate, and therefore these pathways are tightly regulated. The prosurvival TNFα response uses transcriptional and nontranscriptional mechanisms to attenuate caspase-dependent cell death and this pathway has been well characterized (20). In particular, TNFα stimulation induces transcription of CASPASE-8 and FADD-like apoptosis regulator (CFLAR, also called c-FLIPs), whose protein product competitively inhibits CASPASE-8 activity to suppress the apoptotic arm of the TNFα/NFκB response (21, 22). The mechanisms that regulate programmed necrosis however, are less well defined. One model is that necrosis is initiated when RIPK3 is phosphorylated and activated by kinase-active RIPK1, which is also auto-phosphorylated when active (23). Active RIPK3 phosphorylates the pseudo-kinase, MLKL, to promote MLKL oligomerization and association with phosphatidylinositol lipids, thereby leading to necrotic cell death (24–27). However, the precise mechanisms that regulate programmed necrosis, especially in the context of suppressing necrosis during NFκB activation, remain poorly understood.
Recent work has used metabolic labeling combined with mass spectrometry to survey changes in the phosphoproteome in response to TNFα signaling, albeit with low overlap of regulated sites between the two studies (28, 29). To gain further insight into TNFα signaling minutes after receptor activation under conditions promoting either the pro-survival (TNFα only) or prodeath (TNFα plus SMAC-mimetic) pathways, we performed quantitative total proteomics and phospho-proteomics using Tandem Mass Tag (TMT)-based mass-spectrometry (30). We monitored the abundance of thousands of proteins and phosphorylation sites, and identified a cohort of phosphorylation events that are rapidly induced or lost in response to TNF-RSC activation. Numerous previously reported and novel phosphorylation sites were identified involving not only TNF-RSC proximal signaling networks but other functions as well, including transcriptional, lipid binding, and cytoskeletal proteins. Changes in phosphorylation were demonstrated to occur independently of changes in protein abundance, consistent with rapid signaling. Finally, we demonstrated that TNFα stimulation promotes rapid phosphorylation of a conserved residue (Ser320) on the RIPK1 kinase, which is important for suppressing its kinase activity and attenuating programmed necrosis. This work provides a resource for further elucidation of immediate phosphorylation responses downstream of TNF-RSC and for understanding the mechanisms by which SMAC-mimetics dampen TNF-RSC signaling.
EXPERIMENTAL PROCEDURES
Plasmids, Cell Culture, and Generation of Stable Cell Lines
The RIPK1 ORF in the pENTR223 vector (Gateway) was obtained from the human ORFEome collection. RIPK1 point mutants were generated using site-directed mutagenesis with KOD Polymerase (Millipore, Billerica, MA). ENTR clones were sequenced validated and sub-cloned into the CMV-driven pHAGE-C-terminal-HA-Flag destination vector (Gateway) using λ recombinase. H1299 cells were purchased from ATCC and grown in DMEM supplemented with 10% FBS. SVT35 Jurkat cells and Jurkat RIPK1−/− cells (a kind gift from Dr. Brian Seed, MGH) were grown in RPMI 1640 media supplemented with 10% FBS. Virus was produced by co-transfecting each RIPK1 construct and lentiviral packaging vectors (VSVG, Tat1b, Mgpm2, CMV-Rev) into 293T cells using Lipofectamine 2000 (Thermo-Fisher Scientific, Waltham, MA) which was then used to infect Jurkat RIPK1−/− cells. Cell lines stably expressing RIPK1 proteins were selected with 0.5 μg/ml Puromycin.
Antibodies and Reagents
The following antibodies were purchased from Cell Signaling (Danvers, MA): IKKβ (#8943), pIKKα/β-Ser176/Ser180 (#2697), NFκB p65 (#8242), pNFκB p65-Ser536 (#3033), cIAP1 (#7065), cIAP2 (#3130), IκBα (#9242), pIκBα-Ser32 (#2859), JUN (#9165), pJUN-Ser63 (#2361), HSP27 (#2402), pHSP27-Ser15 (#2404), RPS6, pRPS6-Ser235/Ser236 (#4858), ATF2 (#9226), pATF2-Thr69/Thr71 (#9225), pRIP1-Ser166 (#65746). Anti-PCNA (sc-56) was purchased from Santa-Cruz (Dallas, TX), Anti-RIP1 from BD Biosciences (San Jose, CA, 610459).
All chemicals and reagents were purchased from Sigma Aldrich (St. Louis, MO) unless otherwise stated. TNFα was purchased from Sigma Aldrich (11371843001), Birinipant from SelleckChem (Houston, TX, S7015), zVAD-fmk from R&D Systems (Minneapolis, MN, FMK001), and TMT 10-plex isobaric reagents from Thermo-Fisher Scientific (90110).
Sample Preparation for TMT-based Mass Spectrometry
The experimental outline is indicated in Fig. 1B. H1299 cells were DMSO control-treated, treated with TNFα (10 ng/ml) for 10 min, or treated with Birinipant (500 nm) for 15 min prior to TNFα treatment. Cells were harvested by scraping, washed twice with ice-cold PBS, pelleted by centrifugation at 2000 × g for 15 min at 4 °C, and lysed by sonication in 2% SDS, 150 mm NaCl, 50 mm Tris (pH 8.5), 5 mm DTT, 2 mm sodium orthovanadate, protease inhibitors (EDTA-free, Sigma Aldrich) and PhosStop phosphatase inhibitors (Sigma Aldrich). Lysates were cleared by centrifugation at 20,000 × g for 15 min at 4 °C. Approximately 6 mg of total protein for each condition (measured using a Micro-BCA assay, Thermo-Fisher Scientific) were subjected to disulfide bond reduction with dithiothreitol and alkylation with iodoacetamide and precipitated using methanol-chloroform. Samples were resuspended in 8 m Urea, 50 mm Tris, pH 8.5 and subsequently diluted to 4 m Urea in 10 mm CaCl2, 10 mm Tris (pH 8.5) and digested with LysC protease, which cleaves C-terminal to Lysines irrespective if they are N-terminal to a Proline residue (at a 1:100 protease/protein ratio) at 37 °C for 16 h, followed by dilution to 1 m urea and Trypsin digestion, which cleaves C-terminal to basic residues, except when they are N-terminal to a Proline residue (at a 1:100 protease/protein ratio) for 6 h at 37 °C. Digests were acidified with an equal volume of 5% formic acid to a pH ∼ 2, dried down, resuspended in 5% formic acid/5% acetonitrile, and subjected to C18 StageTip desalting (31).
Fig. 1.

A platform for multiplexed TMT-based quantification of the TNFα-stimulated proteome and phosphoproteome. A, Immuno-blots to examine phosphorylation of NFκB signaling components in H1299 lung carcinoma cells. The cells were treated as indicated and analyzed by immuno-blotting with the indicated antibodies. B, Chemical structure of a generic TMT reagent with the functional regions of the structure indicated. C, Cartoon representation of the 10-plex TMT reagents used in this study. The mass in Da is indicated below each reagent. D, Schematic of proteomics workflow. E, Left panel: MS2 spectrum for the identification of an IκBα peptide. The identified b-ions (green) and y-ions (purple) are indicated above the peaks. Right panel: MS3 spectrum for quantification of the IκBα peptide identified on the left. The treatment conditions and the mass of each TMT reagent are indicated above the peaks. The m/z for the peptide is indicated on the x axis and the relative abundance is indicated on the y axis.
Phosphorylated peptides were enriched using TiO2 as previously described (32–34). Briefly, 2 mg peptides (measured using a Micro-BCA assay, Thermo-Fisher Scientific) were re-suspended in 2 m lactic acid/50% acetonitrile. TiO2 5 μm beads (GL Biosciences, Tokyo, Japan), equilibrated in 2 m lactic acid/50% acetonitrile, were added to the re-suspended peptides and incubated with gentle rotation for 1 h at room temperature. Beads were washed twice with 2 m lactic acid/50% acetonitrile, twice with 50% acetonitrile/0.1% TFA, and finally twice with 25% acetonitrile/0.1% TFA. Enriched phosphorylated peptides were eluted with 50 mm K2HPO4 pH 10, vacuum centrifuged to dryness, and re-suspended in 200 mm HEPES (pH 8) in preparation for the TMT labeling.
TMT labeling, Off-line Basic Reverse-phase Fractionation and Mass Spectrometry
TMT labeling was performed as previously described (32). From each condition, ∼ 50 μg of peptides (for the proteome analysis) and ∼ 25 μg of phospho-enriched peptides (for the phosphoproteome analysis) were labeled with the TMT reagents at 2:1 ratio of TMT versus peptides. DMSO control samples were labeled with 126, 127N, 127C, and 128N; TNFα-treated samples were labeled with 128C, 129N, and 129C; and (SM+TNFα)-treated samples were labeled with 130N, 130C, and 131. Following incubation at room temperature for 1 h, the reaction was quenched with hydroxylamine to a final concentration of 0.3% (v/v). The labeling efficiency for the peptides and the phospho-peptides was >97%, as determined by differential TMT modification. The TMT-labeled samples were pooled at a 1:1 ratio across all samples and subsequently vacuum- centrifuged to near dryness and subjected to C18 StageTip desalting.
An Agilent 1100 pump equipped with a degasser and a photodiode array detector (Thermo-Fisher Scientific) was used for the reverse-phase fractionation. Approximately 500 μg peptides (proteome) and ∼ 250 μg phospho-enriched peptides (phosphoproteome) were subjected to a 50 min linear gradient of 5–35% acetonitrile in 10 mm ammonium bicarbonate pH 8, over an Agilent Article 300 Extend-C18 column (5 μm particles, 4.6 mm i.d. and 22 cm long). The peptide mixture was fractionated into a total of 96 fractions, which were subsequently consolidated to 12 fractions, which were vacuum centrifuged to near dryness. Each fraction was then desalted by C18 StageTip, dried by vacuum centrifugation, and reconstituted in 5% acetonitrile/5% formic acid for LC-MS/MS analysis.
Three micrograms of peptides of each fraction were analyzed on an Orbitrap Fusion (Thermo-Fisher Scientific) running a 3 h gradient from 6% to 36% acetonitrile using a multinotch MS3-based method (30). MS1 scans were collected over an m/z range of 400–1400 Thomson (Th), AGC 2 × 10⁵, 120,000 resolution, and a maximum injection time of 100 ms. The 10 most abundant MS1 ions were selected for the MS2 analysis, consisting of collision-induced dissociation (35% collision energy, AGC 4000, and a maximum injection time of 150 ms). MS3 spectra were collected on an Orbitrap using an SPS of 10 isolation notches, an m/z range of 100–1000, 60,000 resolution, AGC 5 × 10⁴, HCD activation 55%, and a maximum injection time of 250 ms.
Proteomic and Phosphoproteomic Data Analysis
Spectra files (.RAW) were converted to a mzXML format using a modified ReAdW.exe version 10 (35) and peptides identified by an in-house SEQUEST-based tool (36) with a human UniProt Database (February 4th 2014; 88,591 entries). The TMT label on lysine residues and peptide N termini (+229.163 Da) and carbamidomethylation of cysteine residues (+57.021 Da) were set as fixed modifications and methionine oxidation (+15.99491 Da) was set as a variable modification. Up to two missed cleavages were permitted. For the phosphoproteome analysis a variable modification of +79.9663 Da was set on serine, threonine, and tyrosine residues. A precursor ion tolerance of 50 ppm and a product ion tolerance of 1 Da were used for the searches. Peptides were filtered to a false discovery rate of 1% using a linear discriminant analysis based on XCorr, ΔCn, missed cleavages, charge state, and precursor mass accuracy as described previously (37). For the TMT-based quantitation, TMT signal-to-noise ratios >100 were extracted for all TMT channels and each channel was summed across all quantified proteins and normalized assuming an equal level of loading across all 10 samples. Localization of phosphorylation sites was determined using AScore (38), and sites with an AScore>13 were selected for further analysis. Annotated MS/MS spectra can be visualized by the ProteinProspector MS-Viewer (39) (http://msviewer.ucsf.edu/prospector/cgi-bin/msform.cgi?form=msviewer) with the following search keys: chj3hswrrw (proteome dataset) and u2zrk6kybj (phosphoproteome dataset). The reproducibility of the datasets was assessed by the Coefficient of Variation (CV) among replicates. For the proteome data sets, the CV values were- DMSO- 8.8%, TNFα- 11.6%, and SM+TNFα- 7.7%; and for the phosphoproteome datasets the values were DMSO- 13.6%, TNFα- 20.4%, and SM+TNFα- 20.4%.
For the analysis of quantified proteins and phosphorylated peptides, values were exported into Microsoft Excel. A two-tailed Student's t test p value≤0.05 was considered statistically significant. An additional filter based on a DMSO log2 fold-change of ≥±1 for the TNFα-stimulated and the SM+TNFα-stimulated proteome and phosphoproteome (Fig. 2 and supplemental Fig. S3), and a TNFα log1.5 fold-change of ≥±1 for the effect of SM on the TNFα-stimulated proteome and phosphoproteome (Fig. 3) was used to select for proteins and phosphorylated peptides with the largest changes in abundance.
Fig. 2.

Analysis of the TNFα regulated proteome and phosphoproteome as quantified by TMT-based mass spectrometry. A, Volcano plot highlighting statistically significant (p ≤ 0. 05) changes in protein abundances of ≥2-fold in TNFα-treated cells compared with the DMSO control (Brown filled circle). Insets: Relative TMT signal to noise intensities across the control treated and TNFα-treated samples for IκBα (top) and GAPDH (bottom) protein abundances. B, As in (A), but highlighting statistically significant (p ≤ 0.05) changes in phosphorylated peptide abundances of ≥2-fold in TNFα-treated cells compared with the DMSO control. C, Gene functional classification of proteins containing phosphorylated peptides displaying statistically significant (p ≤ 0.05) changes in abundances of ≥2-fold in TNFα-treated cells compared with the DMSO control. The enrichment score, which ranks the importance of each cluster to the gene list, is indicated. D, Data from the literature was utilized to construct a TNFα/NFκB signaling network of proteins containing phosphorylation sites displaying statistically significant p ≤ 0.05 changes in abundance of ≥2-fold. Proteins were annotated with their phosphorylation sites, color-coded according to the log2 fold change in TNFα-treated cells compared with the DMSO control. E, Color code for (A–D). Error bars represent quadruplicate measurements for DMSO and triplicate measurements for TNFα + s.e.m. Data were analyzed by Student's t test, ***p ≤ 0.001.
Fig. 3.

Analysis of the effect of a SMAC-mimetic (SM) on the TNFα regulated proteome and phosphoproteome as quantified by TMT-based mass spectrometry. A, Volcano plot highlighting statistically significant (p ≤ 0. 05) changes in protein abundances of ≥1.5-fold in TNFα-treated cells compared with cells pre-treated with SM prior to TNFα exposure (SM+TNFα) (Brown filled circles). Insets: Relative TMT signal to noise intensities across the TNFα-treated and (SM+TNFα)-treated cells for cIAP2 (top) and IκBα (bottom) protein abundances. B, As in (A), but highlighting statistically significant (p ≤ 0.05) changes in phosphorylated peptide abundances of ≥1.5-fold in TNFα-treated cells compared with the (SM+TNFα)-treated cells. C, Gene functional classification of proteins containing phosphorylated peptides displaying statistically significant (p ≤ 0.05) changes in abundances of ≥1.5-fold. The enrichment score, which ranks the importance of each cluster to the gene list, is indicated. D, Data from the literature was utilized to construct a TNFα/NFκB signaling network of proteins containing phosphorylation sites displaying statistically significant (p ≤ 0.05) changes in abundance of ≥1.5-fold. Proteins were annotated with their phosphorylation sites color-coded according to the log1.5 fold change in TNFα-treated cells compared with (SM+TNFα)-treated cells. Color code as described in Fig. 2E. Error bars represent triplicate measurements + s.e.m. Data were analyzed by Student's t test, ***p ≤ 0.001, **p ≤ 0.01.
Sets of genes coding for proteins with significantly altered phosphorylation sites and the indicated fold-changes were uploaded and searched with the DAVID online tool (http://david.abcc.ncifcrf.gov/home.jsp) for enriched biological processes (GOTERM_BP_FAT). Clusters were annotated according to their general function with overlapping biological process.
AQUA-based Proteomics
For AQUA/PRM, cHF-RIPK1 was immuno-precipitated from Jurkat RIPK1−/− cells expressing cHF-RIPK1. 100 ml of cells at a density of 2 × 10⁶ cells/ml were left untreated, treated for 10 min with 10 ng/ml TNFα, or pre-treated with 5 μm TPCA-1 for 15 min prior to TNFα stimulation. Cells were harvested by centrifugation at 2000 × g, washed twice with ice-cold PBS, and lysed by sonication in 150 mm NaCl, 50 mm Tris (pH 8.5), 5 mm DTT, 2 mm sodium orthovanadate, protease inhibitors (EDTA-free, ROCHE) and PhosStop phosphatase inhibitors (Roche). Lysates were cleared by centrifugation at 20,000 × g for 15 min at 4 °C and the supernatant filtered through 0.45 μm spin filters (Millipore). The cleared supernatant was incubated with 60 μl anti-Flag M2 magnetic beads (Sigma) for 2 h at 4 °C and the beads washed 4 times with ice-cold lysis buffer and 3 times with ice-cold PBS. Two elutions with 75 μl 3X-Flag peptide (250 μg/ml in 50 mm Tris pH 8.0, 150 mm NaCl) were performed. Samples were reduced (5 mm DTT) and alkylated (20 mm iodoacetamide) prior to TCA precipitation. Samples were digested first with Lys-C (in 100 mm tetraethylammonium bromide (pH 8.5), 0.1% Rapigest (Waters Corporation), 10% (v/v) acetonitrile (ACN)) for 2 h at 37 °C, followed by the addition of trypsin and further digested overnight. Digests were acidified with an equal volume of 5% (v/v) formic acid (FA) to a pH of ∼2 for 30 min, dried down, resuspended in 1% (v/v) FA, and subjected to C18 StageTip (packed with Empore C18; 3 m Corporation) desalting. Samples were then resuspended in 1% (v/v) FA and analyzed by AQUA/PRM as described previously but with several modifications (40, 41). A collection of 3 Heavy labeled RIPK1 reference peptides (318MQSLQLDCVAVPSSR332 phosphorylated and nonphosphorylated at Ser320 and 31VSLCFHR37, with Cysteine alkylated and Methionine oxidized) were produced at Cell Signaling Technology and quantified by amino acid analysis. AQUA peptides from working stocks (in 1% (v/v) FA) were diluted into the digested sample (in 1% (v/v) FA) to be analyzed to an optimal final concentration predetermined for individual peptide. Samples and AQUA peptides were oxidized with 0.05% hydrogen peroxide for 20 min, subjected to C18 StageTip and resuspended in 1% (v/v) FA/5% ACN. Experiments were performed in triplicate and MS data collected sequentially by LC/MS on a Q Exactive mass spectrometer (Thermo-Fisher Scientific) coupled with a Famos Autosampler (LC Packings, San Fransisco, CA) and an Accela600 LC pump (Thermo-Fisher Scientific). Peptides were separated on a 100-μm i.d. microcapillary column packed with ∼0.5 cm of Magic C4 resin (5 μm, 100 Å; Michrom Bioresources, Auburn, CA) followed by ∼20 cm of Accucore C18 resin (2.6 μm, 150 Å; Thermo-Fisher Scientific). Peptides were separated using a 35-min gradient of 5–27% acetonitrile in 0.125% FA with a flow rate of ∼300 nL/min. The scan sequence began with an Orbitrap full MS1 spectrum with the following parameters: resolution of 70,000, scan range of 200–1000 Thomson (Th), AGC target of 1 × 10⁶, maximum injection time of 250 ms, and profile spectrum data type. This scan was followed by targeted MS2 scans selected from a scheduled inclusion list. Each targeted MS2 scan consisted of high-energy collision dissociation (HCD) with the following parameters: resolution of 17,500, AGC of 5 × 10⁴, maximum injection time of 200 ms, isolation window of 1 Th, normalized collision energy (NCE) of 20, and profile spectrum data type. Raw files were searched, and precursor and fragment ions were quantified using Skyline version 3.5 (42). Data generated from Skyline were exported into an Excel spreadsheet and Prism for further analysis. Total RIPK1 was determined as the average of the total RIPK1 calculated for each individual locus (S32 and (S320 + pS320)).
Cell Lysis and Immuno-blotting
For immuno-blots, cells were treated as indicated, harvested by scraping (adherent cells) or pelleted (suspension cells), washed twice with ice-cold PBS and lysed in Mammalian Cell Lysis Buffer (MCLB, 150 mm NaCl, 50 mm Tris (pH 7.5), 50 mm NaF, 10 mm sodium pyrophosphate, 1 mm sodium 2-glycerol 1-phosphate, 1 mm sodium orthovanadate, 1% (v/v) Nonidet P-40, protease inhibitors (EDTA-free, Roche), and PhosStop phosphatase inhibitors (Roche)). Lysates were cleared by centrifugation at 20,000 × g for 15 min at 4 °C, proteins separated by SDS-polyacrylamide gel electrophoresis, and transferred to PVDF membranes, immuno-blotted with the respective antibodies, and visualized with enhanced chemi-luminescence (Perkin Elmer, Billerica, MA).
Immuno-precipitation
For complex II isolation, Jurkat RIPK1−/− cells expressing cHF-RIPK1 were control-treated or treated with 20 ng/ml TNFα, 20 μm zVAD-fmk, and 100 nm Birinipant for 4 h and harvested by pelleting. Cells were washed twice with ice-cold PBS before lysis in MCLB. Lysates were cleared by centrifugation at 20,000 × g for 15 min at 4 °C, and the supernatant incubated with 25 μl anti-Flag M2 magnetic beads (Sigma) for 2 h at 4 °C and the beads washed 4 times with ice-cold MCLB. The immune complexes were eluted in 2× Laemmli buffer and analyzed by immuno-blotting as described above.
Cell Viability Assays
Cell viability was determined using flow cytometry-based Annexin V and Propidium Iodide staining (Trevigen, Gaithersburg, MD) or the CytoTox-Glo Cytotoxicity assay (Promega, Madison, WI). For flow cytometry-based analysis, cells were seeded at 2 × 10⁶ cells/ml in 12-well dishes, control-treated or treated with 20 ng/ml TNFα, 20 μm zVAD-fmk, and 100 nm Birinipant for 24 h, and the analysis performed according to manufacturer's instructions. Cells were analyzed on a FACSCalibur flow cytometer (BD Biosciences) and the data analyzed with BD FACSDiva software.
For the CytoTox-Glo assay, cells were seeded 2 × 10⁶ cells/ml in 96-well clear bottom white plates (Corning) and DMSO control-treated or treated with 20 ng/ml TNFα and 100 nm Birinipant in the presence or absence of 20 μm zVAD-fmk for the indicated times and the CytoTox-Glo assay performed according the manufacturer's instructions. Luminescence was measured using an EnVision plate reader (Perkin-Elmer).
Experimental Design and Statistical Rationale
The TMT-based mass spectrometry experiments comprised of four biological replicates for the DMSO control-treated samples and three biological replicates for the TNFα-treated and (SM+TNFα)-treated samples, which is adequate to detect statistically significant changes in protein and phosphorylated peptide abundance. All other experiments comprised of three biological replicates for all conditions. Statistically significant changes were determined by two-tailed unpaired Student's t-tests calculated using Microsoft Excel or Graphpad Prism.
RESULTS
Multiplexed TMT-based Quantification of the TNFα-Stimulated Proteome and Phosphoproteome
We sought to develop a system that would allow for rapid capture and quantification of events occurring in response to activation of TNF-RSC. Within minutes of TNFα stimulation in H1299 cells, we observed increased in phosphorylation of S32 in IκBα, S536 in p65, and S176/S180 in IKKβ, peaking at 5 min (Fig. 1A). IKKβ and p65 phosphorylation was maintained for the duration of the time course (30 min) but IκBα was rapidly degraded, as expected (43–45). The protein abundance of p65, IKKβ, and cIAP was unchanged during the time course (Fig. 1A). Pretreatment of cells with the SMAC-mimetic, Birinipant (SM), prior to TNFα exposure (SM+TNFα), led to degradation of cIAP1 independently of TNFα, and decreased TNFα/NFκB pathway activation as demonstrated by modestly slower IKKβ and NFκB phosphorylation and a slower rate of IκBα degradation (Fig. 1A), as observed previously (46).
Using this system, we set out to perform multiplexed TMT-based quantification of both the total proteome and phosphoproteome. Initially, trypsin digested peptides from control (DMSO-treated, n = 4), TNFα-treated (n = 3), and (SM+TNFα)-treated (n = 3) H1299 cells were labeled in a 10-plex mode with isobaric tags prior to LC-MS3 (Fig. 1B–1D). In this approach, synchronous precursor selection (SPS) of b and y ions from an MS2 fragmentation is coupled with fragmentation to release the isobaric reporter ion in MS3, allowing the relative abundance of each reporter ion to be measured for each peptide in an orbitrap (Fig. 1E). This approach also serves to alleviate the variations in protein abundance quantified from multiple peptides due to interference (47, 48). For identification of the phosphoproteome, tryptic peptides are subjected to TiO2-based enrichment prior to tagging (Fig. 1D). Quantified signals for all peptides for individual proteins were used to determine protein abundance (see Experimental Procedures).
Total proteome analysis resulted in the identification of 94,264 peptides, of which 55,115 were unique, corresponding to 7694 proteins (supplemental Tables S1 and S2), of which 7191 were quantified across the 10 samples (supplemental Table S3). The coefficient of variation (CV) among the replicates for all three conditions was 7.7–11.6% (see methods), demonstrating excellent reproducibility of the TMT-based quantification. Remarkably, the -log10 (p < 0.05) versus log2 (ratio of average TNFα-treated to average DMSO-treated, log2(TNFα/DMSO)) volcano plot revealed that among over 7000 quantified proteins, only IκBα demonstrated a statistically significant (p < 0.05) alteration in protein abundance of 2-fold or above in response to TNFα, 10 min post TNF-RSC activation (Fig. 2A, inset). This is consistent with biochemical data in Fig. 1A indicating a rapid reduction in IκBα abundance because of its turnover via the proteasome. These data reveal that the detectable proteome is largely unchanged in abundance and that TMT can accurately monitor loss of IκBα abundance in this setting.
In contrast to the total proteome, numerous changes in the phosphoproteome were identified (Fig. 2B). From 8573 phosphopeptides identified (0.44% FDR) and quantified across all 10 conditions, most were singly phosphorylated on Ser or Thr (supplemental Table S4). The coefficient of variation among replicates (10.3–20.4%, see Experimental Procedures) was like what has been observed in previous TMT-based phospho-proteomic analyses (33, 34). TNFα treatment resulted in increased phosphorylation of 130 sites, whereas phosphorylation of 10 sites was reduced (p ≤ 0.05, log2(TNFα/DMSO) ≥±1.0) (Fig. 2B). These sites were found in several known TNFα signaling pathway components, including TAK1 and IKKβ kinases, the deubiquitinase CYLD, and downstream TNFα/MAP kinase targets (JUN, JUND, and TRIM28, the heat-shock protein HSBP1, and the tumor suppressor TSC2) (Fig. 2B). Increases in phosphorylation observed for sites in TAK1, IKKβ, TSC2, JUND, and numerous other proteins occurred independently of changes in protein abundance (supplemental Fig. S1). Analysis of sequences for kinase consensus motifs revealed that most of the identified sites (87%) are Ser/Thr followed by proline, consistent with substrates downstream of MAP kinases. Over 80% of the quantified phospho-sites were associated with proteins that were quantified in the total proteome data set (supplemental Fig. S2A and supplemental Table S5). Among the quantified phosphorylation sites, 1735 were also seen in two recent SILAC-based proteomics reports on TNFα-mediated phosphorylation each containing 11,039 (MCF7 cells with 10 min stimulation) (28) or 8831 (A549 cells with 5 min stimulation) (29) quantified sites (supplemental Fig. S2B and supplemental Table S5). From the sites displaying changes of 2-fold or more, only ∼ 10% were reported to be regulated in these previous studies, suggesting that we have identified a unique cohort of novel TNFα-dependent phosphorylation events in H1299 cells. Of the 379 phospho-peptides with a greater than 2-fold change, 14 and 17 were also found to be regulated in the data of Krishnan et al., (28) and Wagner et al., (29) respectively, like the extent of overlap between the previous SILAC-based experiments (24 phospho-peptides from 357 and 533 total regulated sites, respectively). It is often the case that multiple sites in target proteins are phosphorylated and we considered the possibility that we identified distinct sites within the same target proteins seen in the previous SILAC-based studies. From the 276 proteins with at least one site regulated ≥2-fold, 50 and 51 were in common with the data of Krishnan et al., (28) and Wagner et al., (29) of which 17 were found in all 3 studies (supplemental Fig. S2C and supplemental Table S6). These results indicate that phosphoproteomes regulated by TNFα is unlikely to be saturated by the currently available data. We refer to the known and previously unrecognized dynamically induced sites of phosphorylation upon TNFα stimulation as the “TNFα-phosphoproteome.”
Landscape of the TNFα-phosphoproteome
To explore the biological implications of TNFα-phosphoproteome, we first classified induced phosphoproteins based on Gene Ontology (DAVID Bioinformatics Resource (49, 50)) coupled with literature curation (Fig. 2C), and also integrated changes in abundance of phosphosites across the network (Fig. 2D). We identified 8 major clusters (Fig. 2C). Consistent with a major role in transcriptional activation (4, 51), the largest cluster (Cluster 1) involved proteins linked with transcriptional regulation and mRNA processing, including the Activating Transcription Factor7 (ATF7), the Ets2 Repressor Factor (ERF), and the ribosomal protein RPS6, all of which are phosphorylated in response to mitogenic stimuli (52–54) (Fig. 2C). Other clusters involved apoptosis (Cluster 8), signaling and cell growth (Clusters 3,4,5), and ubiquitin-like protein conjugation/proteasome related proteins (Cluster 6)– cellular functions that have been previously linked with TNF-RSC signaling (4, 51, 55) (Fig. 2C). Some functions such as Intracellular Protein Transport (Cluster 7) have not been linked with TNFα signaling (Fig. 2C).
We observed statistically significant (p ≤ 0.05) changes in phosphorylation states of 2-fold or greater among several biologically relevant sites known to be affected by TNFα stimulation. For instance, one of the largest phosphorylation increases in our data set (9-fold) was displayed by Ser695 on IKKβ (Fig. 2D), which lies within a C-terminal cluster of 10 serine residues that are autophosphorylated upon TNFα-mediated activation (56). Phosphorylation of this serine cluster negatively regulates its function via conformational changes, and replacement of these residues with nonphosphorylatable alanine residues prolongs the TNFα-stimulated kinase activity of IKKβ (56, 57). We also quantified a 2-fold increase in phosphorylation at Ser18 on the EIF2AK2 activator PRKRA. Phosphorylation of this residue in response to stress promotes association of PRKRA with EIF2AK2, which leads to activation of EIF2AK2 kinase activity and ultimately promotes programmed cell death (58). Other biologically relevant phosphorylation sites quantified in our data set included Ser63 on the JUN transcription factor, Ser15 on the HSPB1 heat-shock protein, Thr69/71 on the ATF2 transcription factor, and Ser235/236/240 on the RPS6 ribosomal protein (see below). We also observed numerous phosphorylation events not previously known to be regulated by TNFα stimulation. Among these was a novel site on CYLD, a de-ubiquitinase that suppresses TRAF2 ubiquitination, which inactivates TNFα/NFκB signaling in resting cells (59, 60). In response to several mitogenic stimuli including TNFα, CYLD is phosphorylated, attenuating its de-ubiquitinase activity, which is required for TRAF2 ubiquitination and subsequent TNFα/NFκB activation. The primary phosphorylation site that regulates CYLD function is Ser418 (61), but we quantified a 2.5-fold increase in phosphorylation on Ser387 upon TNFα exposure. We also quantified increases in Thr333 and Ser320 phosphorylation on the TAK1 and RIPK1 kinases, Ser161 and Thr541 on the ERF and TRIM28 transcriptional repressors, and Ser1346 on the TSC2 tumor suppressor. This study therefore is a useful resource to further understand the role and effects of phosphorylation of this important signaling pathway.
Effects of SMAC-mimetic on the TNFα-stimulated Proteome and Phosphoproteome
SMAC-mimetics suppress the formation of cIAP-dependent K63-linked chains on the TNF-RSC, which attenuates the survival branch of the TNFα/NFκB response and promotes the cell death branch of the pathway (62). These compounds were discovered over 10 years ago and their mechanisms of action have been extensively investigated (14, 63, 64), but the global effects of these compounds on the TNFα/NFκB response have yet to be demonstrated. We utilized the multiplexing capacity of TMT to monitor the total proteome and phosphoproteome in cells treated with TNFα together with a SMAC-mimetic (SM+TNFα) in parallel with our TNFα analysis (Fig. 1D). Like the TNFα treatment alone, we observed a statistically significant (p ≤ 0.05) decrease of ∼5-fold in IκBα protein level in (SM+TNFα)-treated cells compared with control-treated cells, with no other proteins displaying significant changes in abundance of ≥2-fold (supplemental Fig. S3A). Similarly, at the phosphorylation level, (SM+TNFα) treatment led to significantly increased abundances of ≥2-fold in over 80 phosphorylation events (supplemental Fig. S3B, and supplemental Table S4). In total, 65 TNFα-dependent phosphorylation events were in common with or without SM (supplemental Fig. S3C), which included central TNFα/NFκB components, such as TAK1, IKKβ, and CYLD.
To more precisely compare the effect of SM on the TNFα response, we compared the dynamics of the proteome and phosphoproteome in cells treated with TNFα or (SM+TNFα). Among the 7191 proteins quantified across all replicates, only 4 proteins were significantly (p ≤ 0.05) altered by >1.5-fold by inclusion of SM (Fig. 3A). One of these- cIAP2, was reduced in abundance by 1.8-fold, which is comparable to previous reports of SM-mediated depletion of cIAP2 observed by immunoblotting (63, 65). Moreover, SM reduced the loss of IκBα protein abundance, as we observed a 1.5-fold increase in IκBα levels compared with TNFα treatment along (Fig. 3A). This is consistent with our observation that SMAC-mimetics suppress IKKβ activation and subsequent phosphorylation-dependent turnover of IκBα (Fig. 1A). Apart from two other proteins, CPNE8 and DPYD, which are currently not known to be affected by TNFα signaling or SMAC-mimetic treatment, no significant (p ≤ 0.05) alterations greater than 1.5-fold were observed at the protein level.
At the phosphorylation level, among the 8573 phosphorylated peptides quantified across all replicates, we determined 11 phosphorylation sites to have a higher abundance and 20 sites to have a lower abundance in cells pretreated with SMAC-mimetic prior to TNFα stimulation compared with cells treated with TNFα alone (Fig. 3B). Several of these sites are associated with proteins known to modulate apoptosis or transcriptional regulation (Fig. 3C, 3D). Proteins containing phosphorylation sites displaying increased abundances upon SM-treatment included the unconventional myosin, MYO9B, the FOXK1 transcription factor and the autophagy adaptor protein CALCOCO2 (also called NDP52), whereas the CASPASE-8 associated protein CASP8AP2, the p53 binding protein TP53BP1, and the transcription factors DPF2 and MKL2 contained phosphorylation sites that displayed decreased abundances in the SM-treated cells (Fig. 3B–3E). Among the sites displaying reduced phosphorylation site occupancy, we quantified phosphorylation events known to be affected by mitogenic stimuli including Ser251/T255 on the JUNB transcription factor (66) and Ser146 on the mitochondrial protein MFF (67). Overall, these data indicate that although the proteome is largely unaffected by SM in the context of immediate TNFα stimulation, there are modest changes in the phosphoproteome, downstream of immediate TNFα/NFκB pathway activation. As the global effects of SM have largely been unexplored, this data provides a valuable resource to understand the effect of these therapeutically important compounds on TNFα signaling.
Western Blotting Confirmation of TNFα-regulated Proteins and Phosphorylation Sites
To independently validate the proteomic and phospho-proteomic quantification, we performed immuno-blot analysis using available antibodies. Consistent with our proteomic results, we observed decreases in IκBα protein abundance in TNFα and (SM+TNFα) treated cells compared with the DMSO control, and a decrease in cIAP2 protein abundance only in the SM-pretreated cells (Fig. 4A). At the phosphorylation level, we selected phosphorylation sites on JUN, HSPB1, ATF7, and RPS6 for the validation. Several agonists including TNFα are known to induce JNK-mediated c-JUN phosphorylation on Ser63, which substantially increases its transcriptional activity (68–70). We quantified a ∼ 2.5-fold in phosphorylation at this site in TNFα and (SM+TNFα)-treated cells compared with the DMSO-control, which was paralleled by the increased signal for a pS63-specific JUN antibody (Fig. 4B). Ser15 on HSBP1, which displayed a ∼ 3.5-fold increase in phosphorylation in both TNFα stimulations compared with the DMSO-control (Fig. 4C), is known to be phosphorylated by MAPKAPK2 following MAP kinase activation and to subsequently affect actin organization (71–73), and was also found to be phosphorylated using a specific antibody to this site. Similarly, increased phosphorylation by proteomics for T69/T71 in ATF2 and S235/S236/S240 in RPS6 was paralleled by increased reactivity with phosphospecific antibodies against these sites (Fig. 4D, 4E). These sites are known to be phosphorylated in response to mitogens or growth factors (52, 54, 74–76). Total proteome data allowed us to conclude that changes in phosphorylation were not because of changes in total protein abundance (Fig. 4B–4E).
Fig. 4.

Validation of the TNFα and (SM+TNFα) regulated proteome and phosphoproteome as quantified by TMT-based mass spectrometry. A, Top panel: TMT signal to noise intensities across the DMSO control-treated, TNFα-treated and (SM+TNFα)-treated H1299 cells for IκBα (dark brown bars), cIAP2 (light brown bars), and PCNA (gray bars) proteins. Bottom panels: H1299 cells were DMSO control-treated (D), treated with TNFα (T) or (SM+TNFα)- (ST) and protein levels analyzed by immuno-blotting with the indicated antibodies. Blots were probed for PCNA as a loading control. B, Top panel: Relative TMT signal to noise intensities across the DMSO control-treated, TNFα-treated and (SM+TNFα)-treated H1299 cells for the indicated cJUN phosphorylated peptide (red bars) and the JUN protein (black bars). Bottom panel: H1299 cells were DMSO control-treated, treated with TNFα or (SM+TNFα) and the level of phosphorylated JUN analyzed by immuno-blotting with the indicated antibody. The blot was probed for JUN protein level as a loading control. C, As in (B), but for HSPB1. D, As in (B), but for RPS6. (E) As in (B), but for ATF2. Error bars represent quadruplicate measurements for DMSO and triplicate measurements for TNFα and SM+ TNFα + s.e.m. Data were analyzed by Student's t test, ***p ≤ 0.001, *p ≤ 0.05.
Ser320 on the RIP1 kinase is phosphorylated upon TNFα stimulation
A central component of the TNFα/NFκB network that displayed increased phosphorylation upon TNFα-stimulation was the Receptor Interacting Protein Kinase, RIPK1 (Fig. 2D). This kinase is important for the canonical, apoptotic, and necrotic pathways of TNFα/NFκB signaling (77) and is phosphorylated on multiple residues upon TNFα stimulation (78, 79), although the roles of the individual phosphorylation events remain ill-defined. Because formation of the cytosolic CASPASE-8/FADD/RIPK1 complex (Complex II) is attenuated in RIPK1-null cells reconstituted with kinase-dead mutants of RIPK1 and by small-molecule inhibitors of RIPK1 kinase activity (79), it was thought that RIPK1 auto-phosphorylation is required for TNFα-dependent cell death (79). However, a recent report suggested that IKKα/IKKβ-mediated RIPK1 phosphorylation following TNFα stimulation prevents formation of Complex II and promotes the canonical NFκB response, thus alleviating cell death (80).
We quantified a significant (p ≤ 0.05) ∼2-fold increase in phosphorylation of Ser320 on RIPK1 upon TNFα stimulation, with no change in total protein abundance (Fig. 5A). Ser320 in RIPK1 is conserved from H. sapiens through Xenopus, and is four residues N-terminal to the CASPASE-8 cleavage site on RIPK1 (Fig. 5B). A recent SILAC-based phospho-proteomic study reported TNFα-dependent phosphorylation of RIPK1-Ser320 in MCF-7 cells (28), but the functional significance of this modification was not examined (81). Given the importance of RIPK1 in the TNFα/NFκB pathway, the high degree of conservation of its Ser320 residue, and the fact that TNFα-dependent phosphorylation of this residue has been quantified by different approaches in two different cell lines, we hypothesized that this was a biologically relevant modification and set out to determine its relevance.
Fig. 5.

RIPK1 is phosphorylated at Ser320 following TNFα exposure. A, Relative TMT intensities of DMSO control-treated and TNFα-treated H1299 cells for the indicated RIPK1 phosphorylated peptide (red bars) and the RIPK1 protein (black bars). B, Upper panel: Domain structure of RIPK1, indicating the residues referred to in the text. Lower panel: Sequence alignment of RIPK1 residues surrounding Ser320. (C, Immunoblot to compare RIPK1 protein levels in Jurkat cells and Jurkat RIPK1−/− cells reconstituted with wild-type RIPK1. The blot was probed for PCNA as a loading control. D, Jurkat cells, Jurkat RIPK1−/− cells, or Jurkat RIPK1−/− cells reconstituted with wild-type cHF-RIPK1 were exposed to TNFα for the indicated times, the cells lysed, and immunoblotted with the indicated antibodies. E, Rescue of necrotic cell death in Jurkat RIPK1−/− cells by cHF-RIPK1. The indicated cell lines were treated for 30 min with zVAD and SM or NSA, zVAD, and SM prior to 12 h TNFα exposure. The dead cell luminescence was measured using the CytoTox-Glo kit (Promega). F, Schematic for AQUA-based quantification RIPK1-pSer320 (see Methods). G, AQUA proteomics to quantify the ratio of RIPK1-pSer320 to total RIPK1 in control-treated (UT), TNFα-treated, and TPCA-1+TNFα-treated cells. H, Immuno-blot to examine TNFα-mediated IκBα phosphorylation in the absence and presence of the IKK inhibitor, TPCA-1. Error bars represent triplicate measurements + s.e.m. Data were analyzed by Student's t test, **p ≤ 0.01, *p ≤ 0.05.
For further analysis of this phosphorylation event we turned to Jurkat T cells, which require RIPK1 for canonical NFκB pathway activation and necrotic cell death. We utilized a modified form of this cell line that is deficient in RIPK1, and thus has a severely impaired TNFα/NFκB response (82). We stably expressed C-terminally HA-Flag-tagged RIPK1 (cHF-RIPK1) in these cells at levels equivalent to parental Jurkat cells (Fig. 5C). Upon TNFα exposure, we observed that phosphorylation of NFκB and IκBα occurred at similar levels between the parental and the reconstituted Jurkat cells (Fig. 5D), demonstrating that cHF-RIPK1 expressed at endogenous levels restored canonical NFκB signaling in Jurkat RIPK1−/− cells. cHF-RIPK1 was also functional in rescuing the sensitivity of Jurkat RIPK1−/− cells to TNFα in the presence of SM and the Caspase inhibitor, zVAD-fmk (Fig. 5E). This rescue was suppressed in the presence of the MLKL inhibitor, necrosulphanamide (27), confirming that the sensitivity of the rescued cells was specific to necrotic cell death. These results indicate that expression of C-terminally tagged RIPK1 at endogenous levels functioned like its endogenous counterpart in both the survival and necrotic cell death pathways of NFκB signaling.
To further validate TNFα-dependent phosphorylation of Ser320 on RIPK1 in the reconstituted Jurkat system, we used an Absolute Quantification (AQUA)-based quantitative proteomic approach (40, 41) (Fig. 5F). Like what we observed using TMT-based quantification in H1299 cells, phosphorylation at this residue increased ∼2-fold in cells stimulated with TNFα compared with unstimulated cells (Fig. 5G, supplemental Fig. S4, and supplemental Table S5). Pre-treatment of cells with an inhibitor of IKK activity, TPCA-1, reduced Ser320 phosphorylation to a level approximating that seen in unstimulated cells (Fig. 5G, 5H), suggesting that IKK activity may be important for this modification and consistent with a large scale proteomic analysis in MCF7 cells (28).
Ser320 on RIPK1 is Important for its Biological Function
The biological function of Ser320 phosphorylation is unknown. To investigate if this modification was important for the catalytic activity of RIPK1 we examined RIPK1 phosphorylation at Ser166. This residue is autophosphorylated upon RIPK1 activation (83), and can therefore be used as a marker for RIPK1 kinase activity. Upon necrosis induction (TNFα+SM+zVAD-fmk), we observed a significant (p ≤ 0.05) increase in the phosphorylation level of Ser166 in Jurkat RIPK1−/− cells reconstituted with cHF-RIPK1-S320A compared with cHF-RIPK1-WT (Fig. 6A). Jurkat RIPK1−/− cells reconstituted with a kinase-inactive mutant of RIPK1, cHF-RIPK1-K45M, showed no detectable Ser166 phosphorylation, confirming that Ser166 phosphorylation relies on RIPK1 activity (Fig. 6A). Given the possible dependence of Ser320 phosphorylation on IKK, (Fig. 5G, 5H), we hypothesized that TNFα+SM+zVAD-fmk treatment in the presence of the IKK inhibitor TPCA-1 would increase the phosphorylation level of Ser166 in cells expressing cHF-RIPK1-WT to a level comparable to that of cHF-RIPK1-S320A, which was indeed what we observed (Fig. 6B). Collectively, these results suggest that Ser320 phosphorylation on RIPK1 negatively regulates phosphorylation at Ser166 in response to TNFα stimulation, and possibly impairs the kinase activity of RIPK1.
Fig. 6.

Ser320 on RIPK1 is important for its biological function. A, Upper panel: Representative immuno-blot comparing RIPK1 phosphorylation at Ser166 in Jurkat RIPK1−/− cells reconstituted with wild-type RIPK1, RIPK1-S320A, or RIPK1-K45M. The indicated cell lines were control-treated or treated for 30 min with zVAD and SM prior to 2 h TNFα exposure, the cells lysed, and immuno-blotted with the indicated antibodies. Lower panel: Quantification of the pRIPK1-S166/RIPK1 ratio for the immuno-blot. Data from three independent experiments were used for the quantification. B, As in (A), but the indicated cell lines were control-treated or treated for 30 min with zVAD, SM, and TPCA-1 prior to 2 h TNFα exposure. Lower panel: Quantification of the pRIPK1-S166/RIPK1 ratio for the immuno-blot. Data from three independent experiments were used for the quantification. C, Left panel: Representative immuno-blots comparing Complex II assembly in Jurkat RIPK1−/− cells reconstituted with wild-type RIPK1 or RIPK1-S320A. The indicated cell lines were treated for 30 min with zVAD and SM prior to 4 h. TNFα exposure, the cells lysed, Complex II isolated by immuno-precipitation with a Flag antibody, and the immuno-precipitates immuno-blotted with the indicated antibodies. The cell lysates were immunoblotted with the indicated antibodies to monitor total protein levels. Right Panel: Quantification of the CASPASE-8/RIPK1 and FADD/RIPK1 ratios in Complex II. Data from three independent experiments were used for the quantification. D, Representative dot plots of flow cytometry analysis to compare necrotic cell death in Jurkat RIPK1−/− cells reconstituted with wild-type RIPK1 or RIPK1-S320A. The indicated cell lines were control-treated (left) or treated for 30 min with zVAD and SM prior to 24 h TNFα exposure (right), and cell viability monitored by Annexin V and Propidium Iodide (PI) staining followed by flow cytometry. E, Quantification of the double positive stained cells in (D). Data from three independent experiments were used for the quantification. Error bars represent triplicate measurements + s.e.m. Data were analyzed by Student's t test, **p ≤ 0.01, *p ≤ 0.05.
We next investigated the importance of Ser320 for events downstream of RIPK1 activation, which are dependent on its kinase activity (77). Compared with cells reconstituted with its wild-type counterpart, cHF-RIPK1-S320A reconstituted cells were significantly (p ≤ 0.05) more adept at Complex II assembly, as monitored by CASPASE-8 and FADD binding to RIPK1 (Fig. 6C) and subsequent necrotic cell death (Fig. 6D). These events correlated with enhanced auto-phosphorylation at Ser166 (Fig. 6A). Interestingly, cells expressing cHF-RIPK1-S166A were significantly (p ≤ 0.01) less sensitive to necrosis compared with wild-type expressing cells (supplemental Fig. S5A), consistent with a role for Ser166 phosphorylation in RIPK1 kinase activation. However Ser166 and Ser320 did not appear to be important for cell death in the absence of the Caspase inhibitor zVAD-fmk (supplemental Fig. S5B), in line with previous observations that RIPK1 kinase activity is dispensable for apoptotic cell death (17, 84, 85) Together with the observation that TNFα stimulation promotes phosphorylation at Ser320 (Fig. 5G), our data suggest that phosphorylation at this residue (possibly mediated by IKK) functions to impair TNFα-mediated necrosis, likely by alleviating the kinase activity of RIPK1.
To determine if the importance of Ser166 and Ser320 was specific to the role of RIPK1 in necrosis, we also examined activation of canonical NFκB signaling. Jurkat RIPK1−/− cells expressing wild-type, S166A, or S320A RIPK1 had comparable levels and kinetics of IκBα and NFκB phosphorylation upon stimulation with TNFα (Fig. 7A), suggesting that Ser166 and Ser320 were not important for this aspect of the NFκB signaling pathway. Taken together with previous studies (28, 80), our data are consistent with the model depicted in Fig. 7B wherein TNFα exposure leads to cIAP-dependent poly-ubiquitylation of RIPK1 and assembly of the TNF-RSC, promoting activation of multiple kinases including the IKK complex. This subsequently promotes the phosphorylation of RIPK1 at Ser320, which suppresses autophosphorylation presumably at several residues including Ser166, preventing RIPK1-dependent activation of RIPK3 and subsequent phosphorylation of MLKL, thus alleviating unwarranted necrotic cell death and allowing for activation of canonical NFκB signaling, prolonging the cell survival and inflammatory response to TNFα stimulation.
Fig. 7.
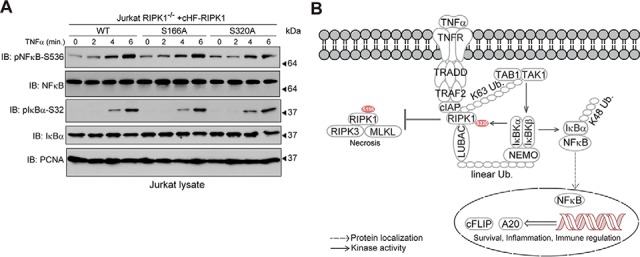
Ser320 on RIPK1 is dispensable for canonical NFκB signaling. A, Representative immuno-blots comparing canonical NFκB signaling in Jurkat RIPK1−/− cells reconstituted with wild-type RIPK1, RIPK1-S166A, or RIPK1-S320A. The cell lines were exposed to TNFα for the indicated times, the cells lysed, and immuno-blotted with the indicated antibodies. B, Proposed model for the significance of RIPK1 phosphorylation at Ser320 in response to TNFα. See text for details.
DISCUSSION
Phosphorylation is among the key post-translational modifications by which the TNFα/NFκB pathway is activated and regulated, but we have an incomplete understanding of the phosphorylation events occurring upon TNFα stimulation at a quantitative level. Using multiplex TMT-based mass spectrometry, we quantitatively compared changes in global proteomic and phospho-proteomic abundances between unstimulated and TNFα-stimulated H1299 lung carcinoma cells. The multiplexing capacity of the TMT approach enabled us to calculate the relative protein and phosphorylation levels across triplicate or quadruplicate measurements at each condition in a just two mass spectrometry runs and apply stringent cut-offs to determine statistically significant changes that take place during pathway activation.
TMT-based proteomics now provides a means by which to quantify thousands of proteins in a single experiment, in our case more than 7000 proteins. Remarkably, only IκBα was found to change appreciably in abundance (∼5-fold reduction), indicating the power of the technique to reveal rapid changes in protein abundance within highly complex proteomes. Similarly, cIAP was the only protein significantly reduced 1.5-fold or greater in the context of TNFα stimulation with SMAC-mimetic pretreatment. To our knowledge, this is the first demonstration of this specific effect of TNFα stimulation on the global proteome, although we note that this analysis was performed rapidly after TNFα treatment and additional alterations in protein abundance likely occur at later times after stimulation.
In our phosphoproteome analysis we quantified over 8000 phosphorylation sites, of which more than 100 displayed significant (p ≤ 0.05) alterations of 2-fold or greater between unstimulated and TNFα-stimulated cells. The validity of this dataset was confirmed by the quantification of several known phosphorylation events modulated by TNFα stimulation and/or subsequent MAP kinase activation. These included sites on central components of the TNFα signaling pathway, including IKKβ, TAK1, and CYLD, as well as downstream targets such as JUN, ATF7, and HSPB1. Gene functional analysis of proteins displaying significant phosphorylation changes of 2-fold or greater revealed the enrichment of numerous biological processes known to be affected by TNFα/NFκB signaling. The correlation between changes observed in our mass spectrometry-based quantification and independent immuno-blot analysis further validated our findings at both the protein and phosphorylation level. However, although most of the phosphorylation sites currently known to be affected by TNFα stimulation or MAP kinase activation were identified and quantified in our study (supplemental Fig. S7), not all displayed such changes, possibly reflecting the kinetics of modifications or cell-type specific differences in phosphorylation.
In addition to known phosphorylation sites, we observed several phosphorylation events not known to be linked with TNFα/NFκB signaling. Among these were Ser129 and Ser146 on the Mitochondrial Fusion Factor, MFF, a site recently shown to be phosphorylated by AMP-activated protein kinase (AMPK) in response to energy stress (67). Phosphorylation of these sites was shown to be important for mitochondrial fission, possibly to induce mitophagy of substantially damaged mitochondrial fragments. Whether the TNFα-dependent phosphorylation of these sites occurs via AMPK remains to be determined and may reveal yet another downstream effect of TNFα/NFκB activation. Other novel phosphorylation events were observed on proteins involved in a wide range of biological processes including nucleotide exchange factor activity, protein transport, and regulation of cell growth demonstrating the broad effect of TNFα on the phosphoproteome (Fig. 2D). Further investigation of these events could provide insights into the regulation and downstream effects of this pathway.
We also examined the effect of a SMAC-mimetic on the TNFα response, which to our knowledge is the first such investigation to be performed at a global scale. Similar to TNFα exposure, the effect of the SMAC-mimetic on the TNFα-regulated proteome was highly specific- a mere 4 proteins among the over 7,000 quantified displayed significant alterations of 1.5-fold or greater in abundance, due to pre-treatment with SMAC-mimetic; the most striking ones being cIAP2 and IκBα, which served as internal controls for the experiment.
To further validate this resource, we examine Ser320 in RIPK1, which was found to be phosphorylated in response to TNFα both in our global phosphoproteome analysis as well as when tested directly using AQUA proteomics. TNFα-stimulated auto-phosphorylation of the activating phosphosite Ser166 in RIPK1 was significantly (p ≤ 0.05) enhanced in the Ser320Ala mutant relative to its wild-type counterpart, suggesting that phosphorylation of Ser320 dampens phosphorylation of RIPK1 on its activation loop during TNFα signaling. Unfortunately, because of the lack of available antibodies, we were unable to verify whether Ser320 was important for the phosphorylation of other auto-phosphorylated residues on RIPK1 (79). Moreover, compared with cells expressing wild-type RIPK1, cells expressing Ser320 mutant RIPK1 had a greater propensity to assemble Complex II upon TNFα exposure under necrosis-inducing conditions, and therefore, were more prone to necrotic cell death. However, given that RIPK1 phosphorylation is dispensable for the apoptotic and survival branches of TNFα/NFκB signaling (17, 20), we anticipated that Ser320 would not be important for these pathways, which was indeed what we observed.
These results provide further insight into the seemingly opposing roles of RIPK1 phosphorylation upon TNFα stimulation. Although the phosphorylation of RIPK1 has long been thought to be important for necrosis, a recent report provided strong evidence that IKKα/IKKβ promotes RIPK1 phosphorylation at the TNF-RSC to prevent unwarranted cell death during TNFα/NFκB activation (80). In line with this, we showed that an IKKα/IKKβ inhibitor attenuated TNFα-stimulated phosphorylation of Ser320, while enhancing auto-phosphorylation at Ser166. We therefore speculate that IKKα/IKKβ-dependent Ser320 phosphorylation functions to repress RIPK1-mediated necrosis during activation of the TNFα/NFκB pathway. This is most likely because of the impaired kinase activity of RIPK1 phosphorylated at Ser320, which suppresses its auto-phosphorylation and integration into Complex II. The phosphorylation of RIPK1 has been extensively investigated and multiple phosphorylated residues have been identified. However, the individual roles of these phosphorylation events have not been clearly defined. By identifying and characterizing a TNFα-mediated phosphorylation event on RIPK1 our data complements the recent study by Dondelinger et al., which revealed an unexpected role of RIPK1 phosphorylation in suppressing necrotic cell death (80). Given the conservation of S320 (Fig. 5B) and the fact that its phosphorylation has now been observed in three different cell lines- MCF7 (28), H1299 and Jurkat cells (this study), an attractive possibility for future studies would be to investigate if the importance of this modification in suppressing RIPK1 kinase activity and subsequent necrosis is common to other cell types and species.
Additional functional characterization of the phospho-regulation networks described here may shed light on the mechanisms underlying TNFα-dependent signaling pathways and could help in unraveling the cell type specificity displayed by SMAC-mimetics.
DATA AVAILABILITY
The mass spectrometry proteomics data have been deposited to the ProteomeXchange Consortium via the PRIDE (86) partner repository with the dataset identifier PXD006055. Project Name: Quantitative Phospho-proteomic Analysis of TNFα/NFκB Signaling Reveals a Role for RIPK1 Phosphorylation in Suppressing Necrotic Cell Death. Annotated MS/MS spectra can be visualized by the ProteinProspector MS-Viewer (39) (http://msviewer.ucsf.edu/prospector/cgi-bin/msform.cgi?formmsviewer) with the following search keys: chj3hswrrw (proteome dataset) and u2zrk6kybj (phosphoproteome dataset).
Supplementary Material
Acknowledgments
We thank Laura Pontano-Vaites for advice on the generation of stable Jurkat cell lines and Chad Araneo for assistance with the flow cytometry experiments. Jurkat RIPK1−/− cells were a kind gift from Dr. Brian Seed (Massachusetts General Hospital, Boston, MA).
Footnotes
Author contributions: F.M., J.P., S.P.G., and J.W.H. designed research; F.M., J.P., and A.O. performed research; F.M., J.P., and S.P.G. contributed new reagents or analytic tools; F.M., J.P., A.O., and J.W.H. analyzed data; F.M. and J.W.H. wrote the paper; S.P.G. provided scientific input.
* This work was supported by NIH grants 5F32CA159612 to F.M. and AG011085 to J.W.H., a NIH/NIDDK grant K01 DK098285 to J.A.P., and an Edward R. and Anne G. Lefler Center postdoctoral fellowship to A.O. The content is solely the responsibility of the authors and does not necessarily represent the official views of the National Institutes of Health.
 This article contains supplemental material.
1 The abbreviations used are:
- TNF-RSC
- TNF receptor signaling complex
- SM
- SMAC mimetic
- TMT
- tandem mass tag
- ORF
- open reading frame
- FBS
- fetal bovine serum
- AGC
- automated gain control
- AQUA
- absolute quantification
- PRM
- parallel reaction monitoring
- CID
- collision-induced dissociation
- HCD
- high collision dissociation
- NCE
- normalized collision energy
- MCLB
- mammalian cell lysis buffer
- NSA
- necrosulphanamide.
REFERENCES
- 1. Chen G., and Goeddel D. V (2002) TNF-R1 signaling: a beautiful pathway. Science 296, 1634–1635 [DOI] [PubMed] [Google Scholar]
- 2. Karin M. (1999) How NF-kappaB is activated: the role of the IkappaB kinase (IKK) complex. Oncogene 18, 6867–6874 [DOI] [PubMed] [Google Scholar]
- 3. Hayden M. S., and Ghosh S. (2008) Shared principles in NF-kappaB signaling. Cell 132, 344–362 [DOI] [PubMed] [Google Scholar]
- 4. Walczak H. (2011) TNF and ubiquitin at the crossroads of gene activation, cell death, inflammation, and cancer. Immunol. Rev. 244, 9–28 [DOI] [PubMed] [Google Scholar]
- 5. Bertrand M. J., Milutinovic S., Dickson K. M., Ho W. C., Boudreault A., Durkin J., Gillard J. W., Jaquith J. B., Morris S. J., and Barker P. A. (2008) cIAP1 and cIAP2 facilitate cancer cell survival by functioning as E3 ligases that promote RIP1 ubiquitination. Mol. Cell 30, 689–700 [DOI] [PubMed] [Google Scholar]
- 6. Tokunaga F., Nakagawa T., Nakahara M., Saeki Y., Taniguchi M., Sakata S., Tanaka K., Nakano H., and Iwai K. (2011) SHARPIN is a component of the NF-κB-activating linear ubiquitin chain assembly complex. Nature 471, 633–636 [DOI] [PubMed] [Google Scholar]
- 7. Ikeda F., Deribe Y. L., Skånland S. S., Stieglitz B., Grabbe C., Franz-Wachtel M., van Wijk S. J., Goswami P., Nagy V., Terzic J., Tokunaga F., Androulidaki A., Nakagawa T., Pasparakis M., Iwai K., Sundberg J. P., Schaefer L., Rittinger K., Macek B., and Dikic I. (2011) SHARPIN forms a linear ubiquitin ligase complex regulating NF-κB activity and apoptosis. Nature 471, 637–641 [DOI] [PMC free article] [PubMed] [Google Scholar]
- 8. Gerlach B., Cordier S. M., Schmukle A. C., Emmerich C. H., Rieser E., Haas T. L., Webb A. I., Rickard J. A., Anderton H., Wong W. W., Nachbur U., Gangoda L., Warnken U., Purcell A. W., Silke J., and Walczak H. (2011) Linear ubiquitination prevents inflammation and regulates immune signalling. Nature 471, 591–596 [DOI] [PubMed] [Google Scholar]
- 9. Emmerich C. H., Ordureau A., Strickson S., Arthur J. S., Pedrioli P. G., Komander D., and Cohen P. (2013) Activation of the canonical IKK complex by K63/M1-linked hybrid ubiquitin chains. Proc. Natl. Acad. Sci. U.S.A. 110, 15247–15252 [DOI] [PMC free article] [PubMed] [Google Scholar]
- 10. Bianchi K., and Meier P. (2009) A tangled web of ubiquitin chains: breaking news in TNF-R1 signaling. Mol. Cell 36, 736–742 [DOI] [PubMed] [Google Scholar]
- 11. Zarnegar B. J., Wang Y., Mahoney D. J., Dempsey P. W., Cheung H. H., He J., Shiba T., Yang X., Yeh W. C., Mak T. W., Korneluk R. G., and Cheng G. (2008) Noncanonical NF-kappaB activation requires coordinated assembly of a regulatory complex of the adaptors cIAP1, cIAP2, TRAF2 and TRAF3 and the kinase NIK. Nat. Immunol. 9, 1371–1378 [DOI] [PMC free article] [PubMed] [Google Scholar]
- 12. Vanden Berghe T., Linkermann A., Jouan-Lanhouet S., Walczak H., and Vandenabeele P. (2014) Regulated necrosis: the expanding network of non-apoptotic cell death pathways. Nat. Rev. Mol. Cell Biol. 15, 135–147 [DOI] [PubMed] [Google Scholar]
- 13. Dueber E. C., Schoeffler A. J., Lingel A., Elliott J. M., Fedorova A. V., Giannetti A. M., Zobel K., Maurer B., Varfolomeev E., Wu P., Wallweber H. J., Hymowitz S. G., Deshayes K., Vucic D., and Fairbrother W. J. (2011) Antagonists induce a conformational change in cIAP1 that promotes autoubiquitination. Science 334, 376–380 [DOI] [PubMed] [Google Scholar]
- 14. Varfolomeev E., Blankenship J. W., Wayson S. M., Fedorova A. V., Kayagaki N., Garg P., Zobel K., Dynek J. N., Elliott L. O., Wallweber H. J., Flygare J. A., Fairbrother W. J., Deshayes K., Dixit V. M., and Vucic D. (2007) IAP antagonists induce autoubiquitination of c-IAPs, NF-kappaB activation, and TNFalpha-dependent apoptosis. Cell 131, 669–681 [DOI] [PubMed] [Google Scholar]
- 15. Vince J. E., Wong W. W., Khan N., Feltham R., Chau D., Ahmed A. U., Benetatos C. A., Chunduru S. K., Condon S. M., McKinlay M., Brink R., Leverkus M., Tergaonkar V., Schneider P., Callus B. A., Koentgen F., Vaux D. L., and Silke J. (2007) IAP antagonists target cIAP1 to induce TNFalpha-dependent apoptosis. Cell 131, 682–693 [DOI] [PubMed] [Google Scholar]
- 16. Micheau O., and Tschopp J. (2003) Induction of TNF receptor I-mediated apoptosis via two sequential signaling complexes. Cell 114, 181–190 [DOI] [PubMed] [Google Scholar]
- 17. Weinlich R., and Green D. R. (2014) The Two Faces of Receptor Interacting Protein Kinase-1. Mol. Cell 56, 469–480 [DOI] [PMC free article] [PubMed] [Google Scholar]
- 18. Vandenabeele P., Galluzzi L., Vanden Berghe T., and Kroemer G. (2010) Molecular mechanisms of necroptosis: an ordered cellular explosion. Nat. Rev. Mol. Cell Biol. 11, 700–714 [DOI] [PubMed] [Google Scholar]
- 19. Zhang D. W., Shao J., Lin J., Zhang N., Lu B. J., Lin S. C., Dong M. Q., and Han J. (2009) RIP3, an energy metabolism regulator that switches TNF-induced cell death from apoptosis to necrosis. Science 325, 332–336 [DOI] [PubMed] [Google Scholar]
- 20. O'Donnell M. A., and Ting A. T. (2010) Chronicles of a death foretold: Dual sequential cell death checkpoints in TNF signaling. Cell Cycle 9, 1065–1071 [DOI] [PMC free article] [PubMed] [Google Scholar]
- 21. Micheau O., Lens S., Gaide O., Alevizopoulos K., and Tschopp J. (2001) NF-kappaB signals induce the expression of c-FLIP. Mol. Cell. Biol. 21, 5299–5305 [DOI] [PMC free article] [PubMed] [Google Scholar]
- 22. Yeh W. C., Itie A., Elia A. J., Ng M., Shu H. B., Wakeham A., Mirtsos C., Suzuki N., Bonnard M., Goeddel D. V., and Mak T. W. (2000) Requirement for Casper (c-FLIP) in regulation of death receptor-induced apoptosis and embryonic development. Immunity 12, 633–642 [DOI] [PubMed] [Google Scholar]
- 23. Declercq W., Vanden Berghe T., and Vandenabeele P. (2009) RIP Kinases at the crossroads of cell death and survival. Cell 138, 229–232 [DOI] [PubMed] [Google Scholar]
- 24. Sun L., Wang H., Wang Z., He S., Chen S., Liao D., Wang L., Yan J., Liu W., Lei X., and Wang X. (2012) Mixed lineage kinase domain-like protein mediates necrosis signaling downstream of RIP3 kinase. Cell 148, 213–227 [DOI] [PubMed] [Google Scholar]
- 25. Murphy J. M., Czabotar P. E., Hildebrand J. M., Lucet I. S., Zhang J. G., Alvarez-Diaz S., Lewis R., Lalaoui N., Metcalf D., Webb A. I., Young S. N., Varghese L. N., Tannahill G. M., Hatchell E. C., Majewski I. J., Okamoto T., Dobson R. C., Hilton D. J., Babon J. J., Nicola N. A., Strasser A., Silke J., and Alexander W. S. (2013) The pseudokinase MLKL mediates necroptosis via a molecular switch mechanism. Immunity 39, 443–453 [DOI] [PubMed] [Google Scholar]
- 26. Cai Z., Jitkaew S., Zhao J., Chiang H. C., Choksi S., Liu J., Ward Y., Wu L. G., and Liu Z. G. (2014) Plasma membrane translocation of trimerized MLKL protein is required for TNF-induced necroptosis. Nat. Cell Biol. 16, 55–65 [DOI] [PMC free article] [PubMed] [Google Scholar]
- 27. Wang H., Sun L., Su L., Rizo J., Liu L., Wang L.-F., Wang F.-S., and Wang X. (2014) Mixed lineage kinase domain-like protein MLKL causes necrotic membrane disruption upon phosphorylation by RIP3. Mol. Cell 54, 1–14 [DOI] [PubMed] [Google Scholar]
- 28. Krishnan R. K., Nolte H., Sun T., Kaur H., Sreenivasan K., Looso M., Offermanns S., Krüger M., and Swiercz J. M. (2015) Quantitative analysis of the TNF-α-induced phosphoproteome reveals AEG-1/MTDH/LYRIC as an IKKβ substrate. Nat. Commun. 6, 6658. [DOI] [PMC free article] [PubMed] [Google Scholar]
- 29. Wagner S. A., Satpathy S., Beli P., and Choudhary C. (2016) SPATA2 links CYLD to the TNF-α receptor signaling complex and modulates the receptor signaling outcomes. EMBO J. 35, 1–17 [DOI] [PMC free article] [PubMed] [Google Scholar]
- 30. McAlister G. C., Huttlin E. L., Haas W., Ting L., Jedrychowski M. P., Rogers J. C., Kuhn K., Pike I., Grothe R. A., Blethrow J. D., and Gygi S. P. (2012) Increasing the multiplexing capacity of TMTs using reporter ion isotopologues with isobaric masses. Anal. Chem. 84, 7469–7478 [DOI] [PMC free article] [PubMed] [Google Scholar]
- 31. Rappsilber J., Mann M., and Ishihama Y. (2007) Protocol for micro-purification, enrichment, pre-fractionation and storage of peptides for proteomics using StageTips. Nat. Protoc. 2, 1896–1906 [DOI] [PubMed] [Google Scholar]
- 32. Paulo J. A., Gaun A., and Gygi S. P. (2015) Global analysis of protein expression and phosphorylation levels in nicotine-treated pancreatic stellate cells. J. Proteome Res. 14, 4246–4256 [DOI] [PMC free article] [PubMed] [Google Scholar]
- 33. Paulo J. A., and Gygi S. P. (2015) A comprehensive proteomic and phosphoproteomic analysis of yeast deletion mutants of 14–3-3 orthologs and associated effects of rapamycin. Proteomics 15, 474–486 [DOI] [PMC free article] [PubMed] [Google Scholar]
- 34. Paulo J. A., McAllister F. E., Everley R. A., Beausoleil S. A., Banks A. S., and Gygi S. P. (2015) Effects of MEK inhibitors GSK1120212 and PD0325901 in vivo using 10-plex quantitative proteomics and phosphoproteomics. Proteomics 15, 462–473 [DOI] [PMC free article] [PubMed] [Google Scholar]
- 35. Pedrioli P. G., Eng J. K., Hubley R., Vogelzang M., Deutsch E. W., Raught B., Pratt B., Nilsson E., Angeletti R. H., Apweiler R., Cheung K., Costello C. E., Hermjakob H., Huang S., Julian R. K., Kapp E., McComb M. E., Oliver S. G., Omenn G., Paton N. W., Simpson R., Smith R., Taylor C. F., Zhu W., and Aebersold R. (2004) A common open representation of mass spectrometry data and its application to proteomics research. Nat. Biotechnol. 22, 1459–1466 [DOI] [PubMed] [Google Scholar]
- 36. Huttlin E. L., Jedrychowski M. P., Elias J. E., Goswami T., Rad R., Beausoleil S. A., Villén J., Haas W., Sowa M. E., and Gygi S. P. (2010) A tissue-specific atlas of mouse protein phosphorylation and expression. Cell 143, 1174–1189 [DOI] [PMC free article] [PubMed] [Google Scholar]
- 37. Elias J. E., and Gygi S. P. (2007) Target-decoy search strategy for increased confidence in large-scale protein identifications by mass spectrometry. Nat. Methods 4, 207–214 [DOI] [PubMed] [Google Scholar]
- 38. Beausoleil S. A., Villén J., Gerber S. A., Rush J., and Gygi S. P. (2006) A probability-based approach for high-throughput protein phosphorylation analysis and site localization. Nat. Biotechnol. 24, 1285–1292 [DOI] [PubMed] [Google Scholar]
- 39. Baker P. R., and Chalkley R. J. (2014) MS-Viewer: A web-based spectral viewer for proteomics results. Mol. Cell. Proteomics 13, 1392–1396 [DOI] [PMC free article] [PubMed] [Google Scholar]
- 40. Ordureau A., Sarraf S. A., Duda D. M., Heo J. M., Jedrychowski M. P., Sviderskiy V. O., Olszewski J. L., Koerber J. T., Xie T., Beausoleil S. A., Wells J. A., Gygi S. P., Schulman B. A., and Harper J. W. (2014) Quantitative proteomics reveal a feedforward mechanism for mitochondrial PARKIN translocation and ubiquitin chain synthesis. Mol. Cell 56, 360–375 [DOI] [PMC free article] [PubMed] [Google Scholar]
- 41. Ordureau A., Heo J.-M., Duda D. M., Paulo J. a., Olszewski J. L., Yanishevski D., Rinehart J., Schulman B. a., and Harper J. W. (2015) Defining roles of PARKIN and ubiquitin phosphorylation by PINK1 in mitochondrial quality control using a ubiquitin replacement strategy. Proc. Natl. Acad. Sci. U.S.A. 112, 201506593. [DOI] [PMC free article] [PubMed] [Google Scholar]
- 42. MacLean B., Tomazela D. M., Shulman N., Chambers M., Finney G. L., Frewen B., Kern R., Tabb D. L., Liebler D. C., and MacCoss M. J. (2010) Skyline: An open source document editor for creating and analyzing targeted proteomics experiments. Bioinformatics 26, 966–968 [DOI] [PMC free article] [PubMed] [Google Scholar]
- 43. Beg A. A.. Finco T. S., Nantermet P. V., and Baldwin A. S. (1993) Tumor necrosis factor and interleukin-1 lead to phosphorylation and loss of I kappa B alpha: a mechanism for NF-kappa B activation. Mol. Cell. Biol. 13, 3301–3310 [DOI] [PMC free article] [PubMed] [Google Scholar]
- 44. Henkel T., Machleidt T., Alkalay I., Krönke M., Ben-Neriah Y., and Baeuerle P. A. (1993) Rapid proteolysis of I kappa B-alpha is necessary for activation of transcription factor NF-kappa B. Nature 365, 182–185 [DOI] [PubMed] [Google Scholar]
- 45. Chen Z., Hagler J., Palombella V. J., Melandri F., Scherer D., Ballard D., and Maniatis T. (1995) Signal-induced site-specific phosphorylation targets I kappa B alpha to the ubiquitin-proteasome pathway. Genes Dev. 9, 1586–1597 [DOI] [PubMed] [Google Scholar]
- 46. Benetatos C. A., Mitsuuchi Y., Burns J. M., Neiman E. M., Condon S. M., Yu G., Seipel M. E., Kapoor G. S., Laporte M. G., Rippin S. R., Deng Y., Hendi M. S., Tirunahari P. K., Lee Y. H., Haimowitz T., Alexander M. D., Graham M. A., Weng D., Shi Y., McKinlay M. A., and Chunduru S. K. (2014) Birinapant (TL32711), a bivalent SMAC mimetic, targets TRAF2-associated cIAPs, abrogates TNF-induced NF-κB activation, and is active in patient-derived xenograft models. Mol. Cancer Ther. 13, 867–879 [DOI] [PubMed] [Google Scholar]
- 47. Ting L., Rad R., Gygi S. P., and Haas W. (2011) MS3 eliminates ratio distortion in isobaric multiplexed quantitative proteomics. Nat. Methods 8, 937–940 [DOI] [PMC free article] [PubMed] [Google Scholar]
- 48. Paulo J. A., O'Connell J. D., and Gygi S. P. (2016) A triple knockout (TKO) proteomics standard for diagnosing ion interference in isobaric labeling experiments. J. Am. Soc. Mass Spectrom. 27, 1620–1625 [DOI] [PMC free article] [PubMed] [Google Scholar]
- 49. Huang, da W., Sherman B. T., and Lempicki R. A. (2009) Bioinformatics enrichment tools: Paths toward the comprehensive functional analysis of large gene lists. Nucleic Acids Res. 37, 1–13 [DOI] [PMC free article] [PubMed] [Google Scholar]
- 50. Huang, da W., Sherman B. T., and Lempicki R. A. (2009) Systematic and integrative analysis of large gene lists using DAVID bioinformatics resources. Nat. Protoc. 4, 44–57 [DOI] [PubMed] [Google Scholar]
- 51. Festjens N., Vanden Berghe T., Cornelis S., and Vandenabeele P. (2007) RIP1, a kinase on the crossroads of a cell's decision to live or die. Cell Death Differ. 14, 400–410 [DOI] [PubMed] [Google Scholar]
- 52. Camuzeaux B., Diring J., Hamard P. J., Oulad-Abdelghani M., Donzeau M., Vigneron M., Kedinger C., and Chatton B. (2008) p38β2-Mediated phosphorylation and sumoylation of ATF7 are mutually exclusive. J. Mol. Biol. 384, 980–991 [DOI] [PubMed] [Google Scholar]
- 53. Le Gallic L., Sgouras D., Beal G. Jr, and Mavrothalassitis G. (1999) Transcriptional repressor ERF is a Ras/mitogen-activated protein kinase target that regulates cellular proliferation. Mol. Cell. Biol. 19, 4121–4133 [DOI] [PMC free article] [PubMed] [Google Scholar]
- 54. Ferrari S., Bandi H. R., Hofsteenge J., Bussian B. M., and Thomas G. (1991) Mitogen-activated 70K S6 kinase: Identification of in vitro 40 S ribosomal S6 phosphorylation sites. J. Biol. Chem. 266, 22770–22775 [PubMed] [Google Scholar]
- 55. Iwai K., Fujita H., and Sasaki Y. (2014) Linear ubiquitin chains: NF-κB signalling, cell death and beyond. Nat. Rev. Mol. Cell Biol. 15, 503–508 [DOI] [PubMed] [Google Scholar]
- 56. Delhase M., Hayakawa M., Chen Y., and Karin M. (1999) Positive and negative regulation of IkappaB kinase activity through IKKbeta subunit phosphorylation. Science 284, 309–313 [DOI] [PubMed] [Google Scholar]
- 57. Häcker H., and Karin M. (2006) Regulation and function of IKK and IKK-related kinases. Sci. STKE 2006, re13. [DOI] [PubMed] [Google Scholar]
- 58. Bennett R. L., Blalock W. L., and May W. S. (2004) Serine 18 phosphorylation of RAX, the PKR activator, is required for PKR activation and consequent translation inhibition. J. Biol. Chem. 279, 42687–42693 [DOI] [PubMed] [Google Scholar]
- 59. Kovalenko A., Chable-Bessia C., Cantarella G., Israël A., Wallach D., and Courtois G. (2003) The tumour suppressor CYLD negatively regulates NF-kappaB signalling by deubiquitination. Nature 424, 801–805 [DOI] [PubMed] [Google Scholar]
- 60. Reiley W., Zhang M., Wu X., Granger E., and Sun S. (2005) Regulation of the deubiquitinating enzyme CYLD by IkappaB kinase gamma-dependent phosphorylation. Mol. Cell. Biol. 25, 3886–3895 [DOI] [PMC free article] [PubMed] [Google Scholar]
- 61. Hutti J. E., Shen R. R., Abbott D. W., Zhou A. Y., Sprott K. M., Asara J. M., Hahn W. C., and Cantley L. C. (2009) Phosphorylation of the tumor suppressor CYLD by the breast cancer oncogene IKKε promotes cell transformation. Mol. Cell 34, 461–472 [DOI] [PMC free article] [PubMed] [Google Scholar]
- 62. Wu H., Tschopp J., and Lin S. C. (2007) Smac mimetics and TNFalpha: a dangerous liaison? Cell 131, 655–658 [DOI] [PMC free article] [PubMed] [Google Scholar]
- 63. Lee E. W., Seong D., Seo J., Jeong M., Lee H. K., and Song J. (2015) USP11-dependent selective cIAP2 deubiquitylation and stabilization determine sensitivity to Smac mimetics. Cell Death Differ. 22, 1463–1476 [DOI] [PMC free article] [PubMed] [Google Scholar]
- 64. Darding M., Feltham R., Tenev T., Bianchi K., Benetatos C., Silke J., and Meier P. (2011) Molecular determinants of Smac mimetic induced degradation of cIAP1 and cIAP2. Cell Death Differ. 18, 1376–1386 [DOI] [PMC free article] [PubMed] [Google Scholar]
- 65. Petersen S. L., Peyton M., Minna J. D., and Wang X. (2010) Overcoming cancer cell resistance to Smac mimetic induced apoptosis by modulating cIAP-2 expression. Proc. Natl. Acad. Sci. U.S.A. 107, 11936–11941 [DOI] [PMC free article] [PubMed] [Google Scholar]
- 66. Pérez-Benavente B., García J. L., Rodríguez M. S., Pineda-Lucena a, Piechaczyk M., Font de Mora J., and Farràs R. (2012) GSK3-SCFFBXW7 targets JunB for degradation in G2 to preserve chromatid cohesion before anaphase. Oncogene 32, 2189–2199 [DOI] [PubMed] [Google Scholar]
- 67. Toyama E. Q., Herzig S., Courchet J., Lewis T. L. Jr, Losón O. C., Hellberg K., Young N. P., Chen H., Polleux F., Chan D. C., and Shaw R. J. (2016) Metabolism. AMP-activated protein kinase mediates mitochondrial fission in response to energy stress. Science 351, 275–281 [DOI] [PMC free article] [PubMed] [Google Scholar]
- 68. Morton S., Davis R. J., McLaren A., and Cohen P. (2003) A reinvestigation of the multisite phosphorylation of the transcription factor c-Jun. EMBO J. 22, 3876–3886 [DOI] [PMC free article] [PubMed] [Google Scholar]
- 69. Smeal T., Binetruy B., Mercola D. A., Birrer M., and Karin M. (1991) Oncogenic and transcriptional cooperation with Ha-Ras requires phosphorylation of c-Jun on serines 63 and 73. Nature 354, 494–496 [DOI] [PubMed] [Google Scholar]
- 70. Pulverer B. J., Kyriakis J. M., Avruch J., Nikolakaki E., and Woodgett J. R. (1991) Phosphorylation of c-jun mediated by MAP kinases. Nature 353, 670–674 [DOI] [PubMed] [Google Scholar]
- 71. Rogalla T., Ehrnsperger M., Preville X., Kotlyarov A., Lutsch G., Ducasse C., Paul C., Wieske M., Arrigo A. P., Buchner J., and Gaestel M. (1999) Regulation of Hsp27 oligomerization, chaperone function, and protective activity against oxidative stress/tumor necrosis factor alpha by phosphorylation. J. Biol. Chem. 274, 18947–18956 [DOI] [PubMed] [Google Scholar]
- 72. Rousseau S., Houle F., Landry J., and Huot J. (1997) p38 MAP kinase activation by vascular endothelial growth factor mediates actin reorganization and cell migration in human endothelial cells. Oncogene 15, 2169–2177 [DOI] [PubMed] [Google Scholar]
- 73. Lavoie J. N., Hickey E., Weber L. A.., and Landry J. (1993) Modulation of actin microfilament dynamics and fluid phase pinocytosis by phosphorylation of heat shock protein 27. J. Biol. Chem. 268, 24210–24214 [PubMed] [Google Scholar]
- 74. Gupta S., Campbell D., Dérijard B., and Davis R. J. (1995) Transcription factor ATF2 regulation by the JNK signal transduction pathway. Science 267, 389–393 [DOI] [PubMed] [Google Scholar]
- 75. Gozdecka M., and Breitwieser W. (2012) The roles of ATF2 (activating transcription factor 2) in tumorigenesis. Biochem. Soc. Trans. 40, 230–234 [DOI] [PubMed] [Google Scholar]
- 76. Flotow H., and Thomas G. (1992) Substrate recognition determinants of the mitogen-activated 70K S6 kinase from rat liver. J. Biol. Chem. 267, 3074–3078 [PubMed] [Google Scholar]
- 77. Newton K. (2015) RIPK1 and RIPK3: critical regulators of inflammation and cell death. Trends Cell Biol. 25, 1–7 [DOI] [PubMed] [Google Scholar]
- 78. Cho Y. S., Challa S., Moquin D., Genga R., Ray T. D., Guildford M., and Chan F. K.-M. (2009) Phosphorylation-driven assembly of the RIP1-RIP3 complex regulates programmed necrosis and virus-induced inflammation. Cell 137, 1112–1123 [DOI] [PMC free article] [PubMed] [Google Scholar]
- 79. Degterev A., Hitomi J., Germscheid M., Ch'en I. L., Korkina O., Teng X., Abbott D., Cuny G. D., Yuan C., Wagner G., Hedrick S. M., Gerber S. a, Lugovskoy A., and Yuan J. (2008) Identification of RIP1 kinase as a specific cellular target of necrostatins. Nat. Chem. Biol. 4, 313–321 [DOI] [PMC free article] [PubMed] [Google Scholar]
- 80. Dondelinger Y., Jouan-Lanhouet S., Divert T., Theatre E., Bertin J., Gough P. J., Giansanti P., Heck A. J. R., Dejardin E., Vandenabeele P., and Bertrand M. J. M. (2015) NF-κB-independent role of IKKα/IKKβ in preventing RIPK1 kinase-dependent apoptotic and necroptotic cell death during TNF signaling. Mol. Cell 60, 1–14 [DOI] [PubMed] [Google Scholar]
- 81. Ciuffa R., Caron E., Leitner A., Uliana F., Gstaiger M., and Aebersold R. (2017) Contribution of mass spectrometry-based proteomics to the understanding of TNF-α signaling. J. Proteome Res. 16, 14–33 [DOI] [PubMed] [Google Scholar]
- 82. Ting A. T., Pimentel-Muiños F. X., and Seed B. (1996) RIP mediates tumor necrosis factor receptor 1 activation of NF-kappaB but not Fas/APO-1-initiated apoptosis. EMBO J. 15, 6189–6196 [PMC free article] [PubMed] [Google Scholar]
- 83. Ofengeim D., Ito Y., Trapp B., Yuan J., Ofengeim D., Ito Y., Najafov A., Zhang Y., Shan B., Dewitt J. P., and Ye J. (2015) Activation of necroptosis in multiple sclerosis. CellReports 10, 1–14 [DOI] [PMC free article] [PubMed] [Google Scholar]
- 84. Berger S. B., Kasparcova V., Hoffman S., Swift B., Dare L., Schaeffer M., Capriotti C., Cook M., Finger J., Hughes-Earle A., Harris P. A., Kaiser W. J., Mocarski E. S., Bertin J., and Gough P. J. (2014) Cutting Edge: RIP1 kinase activity is dispensable for normal development but is a key regulator of inflammation in SHARPIN-deficient mice. J. Immunol. 192, 5476–5480 [DOI] [PMC free article] [PubMed] [Google Scholar]
- 85. McQuade T., Cho Y., and Chan F. K. (2013) Positive and negative phosphorylation regulates RIP1- and RIP3-induced programmed necrosis. Biochem. J. 456, 409–415 [DOI] [PMC free article] [PubMed] [Google Scholar]
- 86. Vizcaíno J. A., Csordas A., Del-Toro N., Dianes J. A., Griss J., Lavidas I., Mayer G., Perez-Riverol Y., Reisinger F., Ternent T., Xu Q. W., Wang R., and Hermjakob H. (2016) 2016 update of the PRIDE database and its related tools. Nucleic Acids Res. 44, D447–D56 [DOI] [PMC free article] [PubMed] [Google Scholar]
Associated Data
This section collects any data citations, data availability statements, or supplementary materials included in this article.
Supplementary Materials
Data Availability Statement
The mass spectrometry proteomics data have been deposited to the ProteomeXchange Consortium via the PRIDE (86) partner repository with the dataset identifier PXD006055. Project Name: Quantitative Phospho-proteomic Analysis of TNFα/NFκB Signaling Reveals a Role for RIPK1 Phosphorylation in Suppressing Necrotic Cell Death. Annotated MS/MS spectra can be visualized by the ProteinProspector MS-Viewer (39) (http://msviewer.ucsf.edu/prospector/cgi-bin/msform.cgi?formmsviewer) with the following search keys: chj3hswrrw (proteome dataset) and u2zrk6kybj (phosphoproteome dataset).