

Abstract
The Ca2+-activated K+ channel, Slo1, has an unusually large conductance and contains a voltage sensor and multiple chemical sensors. Dual activation by voltage and Ca2+ renders Slo1 central to numerous cellular processes that couple electrical signaling to Ca2+-mediated events such as muscle contraction and neuronal excitability. Here we present the cryo-electron microscopy structure of a full-length Slo1 channel from Aplysia californica in the presence of Ca2+ and Mg2+ at a resolution of 3.5 Å. The channel adopts an open conformation. Its voltage sensor domain adopts a non-domain-swapped attachment to the pore and contacts the cytoplasmic Ca2+-binding domain from a neighboring subunit. Unique structural features of the Slo1 voltage sensor suggest that Slo1 likely employs a voltage sensing mechanism quite distinct from known voltage-dependent ion channels. The structure reveals the molecular details of three distinct divalent cation-binding sites identified through electrophysiological studies of mutant Slo1 channels.
Introduction
The high conductance Ca2+-activated K+ channel, also known as Slo1, BK, MaxiK, or KCa1.1, belongs to the high conductance Slo family of K+ channels1–3. Cell membrane voltage and intracellular Ca2+ activate Slo1 synergistically, making it a central regulator of various physiological processes that couple electrical signaling to Ca2+-mediated events such as muscle contraction, hormone secretion, and neuronal excitability4,5.
Each subunit of the Slo1 tetramer contains three structural components: a voltage-sensor domain (VSD) comprising S1–S4 helices, a pore-forming unit (S5–S6), and a cytosolic tail domain (CTD) comprising two tandem regulator of K+ conductance (RCK) domains termed RCK1 and RCK26–11. Including an additional S0 helix before the VSD, the Slo1 tetramer contains 28 helices within its transmembrane domain (TMD).
Electrophysiological studies have identified two Ca2+ binding sites in each subunit of the gating ring: one located in the RCK2 domain involving a sequence of conserved Asp residues known as the “Ca2+ bowl”, the other in the RCK1 domain (“Ca2+ RCK1” site)12–16. Under physiological conditions Mg2+ ions can also activate the channel with an affinity in the mM range17,18 and extensive mutagenesis studies mapped the Mg2+ binding site to the interface between the VSD and the RCK1 domain13,19,20. Recent crystal structures of Ca2+-bound gating rings revealed molecular details of the “Ca2+ bowl” site10,11. No definitive ion density was observed in the predicted RCK1 site, although key residues identified through mutagenesis were near each other11,13,14.
In the absence of a structural model of Slo1 the following questions remain central: Why is the conductance so unusually high, nearly ten times that of most other K+ channels?1–3,21 What are the chemical properties of the Ca2+ and Mg2+ binding sites and how do they regulate the pore? What do Slo1 VSDs look like and how are they thermodynamically linked to the pore and Ca2+ binding sites to yield synergistic voltage and Ca2+ control? A structure of Slo1 from Aplysia californica in the presence of Ca2+ and Mg2+ begins to address these questions.
Dual activation by voltage and Ca2+ in planar lipid bilayers
Despite relatively low sequence identity (59%) to human Slo1, aplysia Slo1 contains all of the amino acid sequence hallmarks of a Ca2+-activated K+ channel (Extended Data Fig. 1). As shown, it also exhibits the key electrophysiological features of a Ca2+-activated K+ channel (Fig. 1). In planar bilayers the single channel conductance in 150 mM KCl and 5 μM CaCl2 is 104 pS, similar to previously reported measurements (117 pS) in excised-patches22 (Fig. 1a). The single channel open probability increases as membrane voltage is depolarized with an effective gating charge (i.e. valence of combined voltage sensors) of ~3.0 e0 (< 1 e0 per voltage sensor) as estimated from the slope of the open probability curve23 (Fig. 1b–d). This value is similar to reported values 2.4–4.4 e0 for mammalian Slo1 channels23–26.
Figure 1. Dual activation of aplysia Slo1 by voltage and intracellular Ca2+ in planar lipid bilayers.

a, Single channel current-voltage (I–V) relationship. Data are shown as mean ± SEM (n = 5) and fit to a linear function. b, Representative single channel recordings at indicated membrane voltages in the same buffer as panel a. Current levels for closed and 1, 2 and 3 simultaneously opened channels are labeled as C, O1, O2 and O3. c, Single channel open probability-voltage (Po-V) relationship fit to an exponential function. d, Po-V relationship graphed on a logarithmic scale. Data between 20–40 mV (i.e., when the Po is very small) are fit to a linear equation to estimate effective gating charge z. e, Macroscopic current traces of intracellular Ca2+-dependent activation with corresponding voltage protocol shown above the traces. f, Variance obtained from panel e is plotted as a function of average current and fit to a parabolic function. Fit parameters yield estimates of single channel current i and number of channels N. g, Po-intracellular Ca2+ concentration relationship at three different depolarizing voltages. Po is obtained by dividing the average current by i x N from panel f. Data are fit to a Hill equation, yielding estimates of apparent Ca2+ affinity k and Hill coefficient n (see methods).
Aplysia Slo1 is also Ca2+-activated (Fig. 1e). At a membrane voltage of 60 mV the mean amplitude of ionic current in a membrane with many channels increases from nearly zero (~4 pA) to ~618 pA as the Ca2+ concentration is increased from ~0 to 500 μM. To further quantify the relationship between Ca2+ concentration and channel open probability, the mean and variance of K+ currents from traces at different Ca2+ concentrations were calculated. A plot of current variance as a function of current mean was fit to a parabolic function corresponding to the independent channel opening events of a Bernoulli trial of activation, from which the open probability was calculated for each Ca2+ concentration27 (Fig. 1f). Channel open probability increases as a function of Ca2+ concentration and, as has been described for mammalian Slo1 channels, the Ca2+-activation curve is a function of membrane voltage4 (Fig. 1g). Membrane voltage and Ca2+ ‘interact’ such that lower Ca2+ concentrations are required to open the channel when the membrane is more depolarized. These properties of high single channel conductance together with a voltage- and Ca2+-activated gate are characteristics of Slo1 channels.
Overall structure of open Slo1
Details of the structure determination are described in methods. The Slo1 tetramer measures approximately 110 Å by 130 Å by 130 Å with the gating ring accounting for more than half the length (Fig. 2a). Viewed along the four-fold axis the TMD and gating ring have a square edge of approximately 117 Å and 130 Å, respectively (Fig. 2a). Viewed from the side with the extracellular side up, the tetrameric channel forms three distinct layers: the TMD layer on top, the RCK1 layer in the middle and the RCK2 layer at the bottom.
Figure 2. Structure of open Slo1.

a, Side and top views of the aplysia Slo1 tetramer. One subunit is shown in ribbon with individual domains colored uniquely (orange, VSD; green, pore domain; blue, RCK1; red, RCK2) and the other three in grey surface representations. Three divalent cations are shown as spheres (marine blue, Ca2+ bowl site; orange, Ca2+ RCK1 site; magenta, Mg2+ site). b, c, Top view of the transmembrane region of Slo1 (b) and Kvchim (c) (PDB 2R9R) tetramer in ribbon representation. One subunit is colored red, the other three grey and S0 of Slo1 cyan. d, e, Ribbon representation of the transmembrane region of one subunit in Kvchim (d) and Slo1 (e) with the VSD colored orange, pore domain green and S4–S5 linker cyan. The contiguous pore domain (grey) from a neighboring subunit in Kvchim is shown as well. f, Density (contoured at 5.5σ) for the S4–S5 region of Slo1 in stereo.
The VSD of Slo1 is not domain-swapped. This means the VSD in Slo1 interacts with the pore domain from the same polypeptide chain (Fig. 2b). In Kv1.2–2.1 paddle chimera (Kvchim), a Shaker-like voltage-dependent K+ (Kv) channel, the VSD is domain-swapped, or latched around the pore domain of a neighboring subunit8 (Fig. 2c). Domain-swapping is made possible by a long α-helical S4–S5 linker in Shaker-like Kv channels, which forms a cuff around the pore and is hypothesized to transmit force from the VSD to the pore to control gating7,8,28 (Fig. 2d). In Slo1, contrastingly, the S4–S5 linker is much shorter and consists of an ordered loop rather than an α-helix (Fig. 2e, f). In addition, the S4 helix in Slo1 runs antiparallel to S5, tightly packed against it, whereas in the Shaker-like Kv channel the S4 is mostly separated from S5, appearing much more free to undergo conformational change. The differences in the S4–S5 linkers and the degrees of association of S4 with S5 probably reflect known differences in voltage-dependence: Shaker-like Kv channels apparently undergo much larger voltage-dependent conformational changes than the Slo1 channel29,30,31.
While the VSD is contiguous with the pore domain of the same subunit in Slo1, the S6-RCK1 linker creates a domain-swapped arrangement in which the TMD of one subunit resides on top of the CTD of a neighboring subunit (Fig. 2a). This arrangement is again in contrast to the Shaker-like Kv channels, where the cytoplasmic T1 domain is positioned underneath the VSD of the same subunit7,8. Notably, the T1 domain does not play a direct role in gating28. Therefore, the different functional roles of the intracellular domains of Slo1 and the Shaker-like channels may underlie their different arrangements.
The extra transmembrane helix S0, not present in other Kv channels, is positioned at the periphery of the VSD (Fig. 2b). Consistent with previous biochemical and electrophysiological studies, the extracellular end of S0 leans against the outside of S3 and S432 and forms a lipid-mediated interaction with S5 and the turret connecting S5 to the pore helix, while its cytoplasmic end maintains only minimal protein-protein interactions with the VSD. S0 has an extensive surface facing towards the lipid membrane, a feature that is consistent with previous suggestions that S0 is involved in mediating interactions with β subunits of Slo132.
The Ion conduction pore
The K+ selectivity filter in Slo1 is essentially the same as in other K+ channels in the conductive conformation with a root mean square deviation of 0.9 Å (residues 276 to 280) between Slo1 and Kvchim8 (Fig. 3a). A continuous tube of density was modeled as 4 K+ ions, which are known to exhibit partial occupancy in higher resolution K+ channel structures33. A single density was modeled as an additional K+ ion at the extracellular entryway.
Figure 3. The ion conduction pathway in aplysia Slo1.

a, Cryo-EM density (contoured at 6 σ) of the selectivity filter and pore helix in stereo. For clarity, the selectivity filter of only two subunits and pore helix of one subunit are shown (sticks colored according to atom type). The K+ ions are shown as green spheres. b, Electrostatic surface potential of the aplysia Slo1 ion conduction pathway indicated by the color scale.
Beneath the selectivity filter the pore gradually expands to more than 20 Å at the interface with the gating ring and is continuous through the entire gating ring, similar to inward rectifier K+ channels (Kir) and the closely related Slo2.2 channel34,35 (Fig. 3b). The mainly electronegative surface and the presence of lateral openings between the gating ring and TMD would favor high conductance by attracting K+ ions and reducing access resistance to the ion pathway. The pore’s geometry and electrostatic charge are consistent with mutations affecting ion conduction and the rapid rate of tetrabutylammonium ion block of Slo1 compared to other Kv channels36–39. Thus, the structure is compatible with an open conformation of the pore, as expected given the high concentrations of Ca2+ and Mg2+ present.
The voltage sensor domain
In Shaker-like Kv channels a steep dependence on membrane voltage exists due to a large quantity of electric charge, known as gating charges, which are transferred through the membrane electric field when the sensor switches from off to on40–42. The gating charges originate mainly from positive-charge carrying amino acids (mostly arginine and less commonly lysine) residing on S441,42. In comparison to Shaker-like Kv channels, which generally contain 6 positive charged amino acids on S4, Slo1 possesses only three: Arg196, Arg199 and Arg202. In the atomic structure of Slo1 these amino acids correspond in space most closely to S4 residues labeled R2, R3 and R4 in Kvchim (Fig. 4a, b).
Figure 4. Unique features of the Slo1 VSD.

a, Stereo view of the Kvchim VSD with voltage sensor paddle (S3b–S4) colored orange and the rest grey. Side-chains of the positive charged residues on S4 (labeled R1–R4 and K5) and their ionizing hydrogen bond pairs, as well as the gating charge transfer center residues (F233, D259 and E236) are shown as sticks. b, Stereo view of the Slo1 VSD with S3–S4 colored orange and the rest grey. Side-chains of S4 residues at position R2–R4 and K5, their ionizing hydrogen bond pairs, as well as corresponding residues of the gating charge transfer center (F149, D175 and Y152), are shown as sticks and colored as in panel a. c, Sequence alignment of aplysia Slo1, human Slo1, Shaker, Kvchim, human Nav1.1, human Cav1.1, human Hv1, and ciona VSP. Only segments of S2 and S3a are included, with the gating charge transfer center highlighted: F/Y, green and E/D, red. Numbers above and below the sequences refer to the aplysia Slo1 and Kvchim, respectively.
In Kvchim S4 adopts an α-helical conformation above the R3 position and transits to a 310-helix below, allowing the ‘voltage sensor paddle’ formed by S3b–S4 to reside closer to the extracellular side8 (Fig. 4a). In Slo1, a helix-turn-helix paddle structure does not exist as the top (extracellular side) of S4 adopts an extended loop structure above the position labeled R2, whereas the initial helical portion of S4 beginning below the membrane surface adopts a 310-helical conformation and transits into an α-helical structure at the bottom (intracellular side) of S4 (Fig. 4b). Consequently, the S4 helix in Slo1 is located closer to the intracellular side.
The gating charge residues in Kvchim are stabilized by two clusters of negative charged amino acids separated by a conserved phenylalanine (F233) residue located near the middle of the membrane8. This Phe on S2 forms the rigid cyclic “cap” of the gating charge transfer center, with two negative charged residues (E236 on S2 and D259 on S3) forming the bottom of the transfer center29 (Fig. 4a). These charge transfer center amino acids are conserved in other VSD containing proteins, including K+, Na+, H+, and Ca2+ channels and voltage sensing phosphatases (Fig. 4c). As its name implies, the gating charge transfer center is thought to catalyze the transfer of gating charges across the otherwise low dielectric environment of the membrane29. In Kvchim, gating charges R2 to R4 reside above this transfer center and are stabilized by negative charged amino acids as well as water molecules in an aqueous cleft facing towards the extracellular solution, while the amino group of lysine at the K5 position resides inside the transfer center (Fig. 4a).
Slo1 is unique because it lacks the complete conservation of gating charge transfer center residues (Fig. 4c). Most notably in Slo1 the otherwise conserved glutamic acid on S2 (E236 in Kvchim), three amino acids away from the Phe cap (F233 in Kvchim and F149 in Slo1), is replaced by tyrosine (Y152). Without this central negative charge there is no positive S4 gating charge residue in the transfer center: the amino acid corresponding to position K5 in Kvchim is serine (S205) in Slo1 (Fig. 4b). This modification of the gating charge transfer center leads us to wonder how charge transfer might occur. Analysis of the structure in greater detail raises an intriguing possibility. In Slo1, arginine residues R2 and R3 form strong (both around 2.7 Å) ionized hydrogen bonds with D120 and D142, respectively, near the extracellular side of the voltage sensor. R4 on the other hand appears to interact weakly with both the π face of F149 (3.2 Å) and with D175 on S3 (3.2 Å). D175 simultaneously interacts strongly (2.7 Å) with R156 on S2. With side-chain shifts and a few Å movement of the S4 helix main-chain, it seems entirely plausible that the side-chain of R4 could shift down to form a strong hydrogen bond with D175, while R156 could give up its interaction with D175 to pair instead with E169 on S3, which is already solvent exposed on the intracellular side of the membrane. Membrane voltage could bias these exchange reactions and VSD conformations. We do not know what functional conformation the voltage sensor in Slo1 represents, but in the companion paper we address the severe structural restrictions on S4 that likely limit the magnitude of voltage sensor movements to be quite small (ref companion paper).
Three divalent cation-binding sites
The gating ring is in an open or activated conformation, very similar to the Ca2+-bound gating ring only structure determined by x-ray crystallography11, with a main-chain root mean square deviation of 2.1 Å. Cryo-EM density peaks attributable to divalent cations at two Ca2+ binding sites and a Mg2+ binding site are observed (Fig. 5 and Extended Data Fig. 2). Figure 5a shows the relative locations of these sites – the Ca2+ bowl site, the Ca2+ RCK1 site and the Mg2+ site – in the context of the tetrameric channel.
Figure 5. Three divalent cation-binding sites in aplysia Slo1.

a, Stereo ribbon representation of the Slo1 tetramer with three divalent cations (colored spheres) shown for one subunit only (colored as in Fig. 2a). The rest of the channel is colored grey. b, Ca2+ bowl site. Channel is shown as ribbon with RCK2 domain colored red and neighboring RCK1 domain grey. c, Density at the Ca2+ bowl site: grey wire mesh at 6.5 σ, red wire mesh at 17 σ. Channel is shown as sticks and colored according to atom type (yellow, carbon in RCK2 domain; green, carbon in neighboring RCK1 domain). d, Ca2+ RCK1 site. Channel is shown as blue ribbon. e, Density at the Ca2+ RCK1 site with the same contour levels as in panel c. f, Mg2+ site. Channel is shown as stereo ribbon with RCK1 domain colored blue and neighboring VSD domain grey. All side-chains are shown as sticks (colored according to atom type), water molecule as a cyan sphere and divalent cations as colored spheres with coordination bonds indicated by dashed lines.
The strong density peaks at the Ca2+ bowl and Ca2+ RCK1 sites are most likely attributable to Ca2+ rather than Mg2+ for the following reasons. First, 110 μM intracellular Ca2+ shifts the half-activation voltage (V1/2) of Slo1 to essentially the same extent in the presence of zero and 10 mM Mg2+, indicating that Mg2+, at a concentration of up to 10 mM, probably does not bind to the Ca2+ activation sites43. Second, Ca2+ and Mg2+ are known to have distinct coordination preferences. Ca2+ ions observed in crystal structures are preferentially coordinated by 6–8 oxygen atoms and there is only a minimal energetic change between Ca2+ with 7 or 8 bound water molecules44. In contrast, Mg2+ ions are coordinated by 6 oxygen atoms and have a large energy cost associated with any deviation from this coordination number45. In the Slo1 structure, the divalent cations at both the Ca2+ bowl and Ca2+ RCK1 sites are coordinated by 7 oxygen atoms, which is most consistent with the coordination of Ca2+ ions (Fig. 5b–e).
The Ca2+ bowl site, located at the so called “assembly interface” between neighboring subunits of the gating ring, is nearly identical to that in the Ca2+-bound Slo1 gating ring only structure, with the same atoms coordinating the ion10,11. In particular, the Ca2+ ion in the full channel aplysia Slo1 is coordinated by the side-chain caboxylates of D905 and D907, main-chain carbonyl oxygen atoms of Q899 and D902 on the RCK2 domain of one subunit, as well as the side-chain carboxylate of N438 on the RCK1 domain of the neighboring subunit (Fig. 5b, c). All the residues involved in direct coordination in the structure, except for N438, were previously identified in mutagenesis studies as critical for Ca2+ binding at this site12,15,16.
The Ca2+ RCK1 site in the Ca2+-bound gating ring only crystal structure was modeled without Ca2+ ions due to the absence of convincing electron density11. Here in the full channel aplysia Slo1 structure, cryo-EM density at this site is very strong and, for the reasons described above, most consistent with a Ca2+ ion (Fig 5d, e). This ion is coordinated by side-chain carboxylates of D356 and E525 and main-chain carbonyl oxygen atoms of R503, G523 and E591 (Fig. 5d). All the coordinating residues except for G523 and E591 were previously identified through mutagenesis studies as critical for Ca2+ activation13,14. While only the main-chain carbonyl oxygen atom of R503 directly coordinates Ca2+ in the RCK1 site, it is highly conserved across Slo1 channels from different species (Extended Data Fig. 1). In the structure, R503 forms an ionized hydrogen bond with E912 and is also positioned to form a cation-π interaction with Y914 (Extended Data Fig. 2a). E912 and Y914 are also highly conserved and are located on the loop that forms the Ca2+ bowl site. These interactions between R503, E912 and Y914 thus provide one possible explanation for non-independence (e.g. cooperative interaction) of the two Ca2+ activation sites in Slo1 channels46,47.
It has been known for many years that Mg2+ regulates gating in Slo1 channels17,18. Extensive mutational analysis implicated residues on the interface between the VSD (D99 and N172 in human Slo1) and the CTD (E374 and E399 in human Slo1) as likely to be important13,19,20. In the structure we observe a density peak near the proposed Mg2+ binding site at the interface between the VSD and gating ring (Fig. 5a, f and Extended Data Fig. 2b). The protein environment surrounding the density is characteristic of the coordination of a divalent cation, with oxygen atoms provided by side-chain carboxylates of E363 (equivalent to E374 in human Slo1), E388 (equivalent to E399 in human Slo1), the main-chain carbonyl oxygen atom of T385, the side-chain carboxylate of N161 (equivalent to N172 in human Slo1) as well as a water molecule (Fig. 5f and Extended Data Fig. 2b). D86 (equivalent to D99 in human Slo1) does not appear to be directly involved in coordination of the divalent cation, however, it participates in a network of charge-charge interactions near this site and is probably critical for maintaining its stability.
Discussion
The overwhelming motivation for the present analysis has been to reach a structural description with which we can begin to interpret again the large set of electrophysiological data available on Slo1 channels, and to push our understanding further with new experiments. Given the high level of functional analysis applied to this channel over decades we find it not surprising that so many predictions – for example the existence of 2 unique Ca2+ activation sites and a Mg2+ regulatory site – were quite accurate, even to the level of specific amino acids involved12–16,19,20 (Fig. 5). And yet, as often happens when we observe a macromolecular structure for the first time, Slo1 does not fail to surprise us. Its voltage sensor is not domain-swapped as in Shaker-like Kv channels or voltage-dependent Na+ or Ca2+ channels7,8,48–50 (Fig. 2). The detailed chemistry of the voltage sensor implies uniqueness in its function (Fig. 4). The observed domain swapping across the TMD-CTD interface is unique (Fig. 2).
The unusually high K+ conductance is easy to reconcile with the structure of Slo1, which is shown beside two other K+ channels with smaller unitary conductance (Fig. 6). In Slo1, just beneath the selectivity filter the pore opens into a wide funnel connected to the cytoplasmic solution, which also contains lateral openings to reduce access resistance. Slo1 has effectively shortened the transmembrane trajectory of a K+ ion to a minimum: the length of the selectivity filter. Furthermore, the surface of the funnel and lateral openings is electronegative, thus favorable for attracting cations of which K+ is the predominant intracellular type.
Figure 6. Comparison of the ion conduction pore in three different K+ channels.
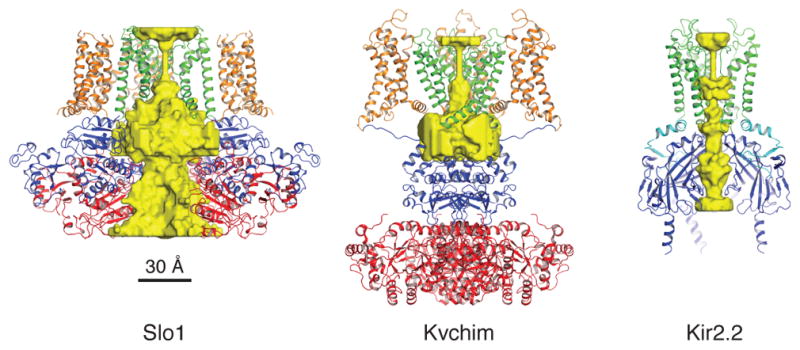
Surface representations of the ion conduction pore are shown for Slo1, Kvchim and Kir2.2 (PDB 3SPI) channels. Channels are shown as ribbon diagrams with the front subunit excluded for clarity. The K+-accessible surfaces were determined using HOLLOW51.
The structure also reconciles the relatively weak voltage dependence of Slo1, which is not merely a function of reduced positive charges on S4. The Shaker channel contains 6 and Slo1 contains 3, but functional gating charge in Slo1 is about 20 percent of that in Shaker24–26,41,42. Other structural reasons offer an explanation: the short S4–S5 linker limits the extent to which S4 can move and the tight anti-parallel packing of S4 against S5 would appear to restrict its motion (Fig. 2e, f). In Kvchim, by contrast, S4 makes minimal contacts with S5 and appears free to move unimpeded (Fig. 2d). Further supporting the idea that the voltage sensor in Slo1 is likely different in its action compared to other voltage-dependent ion channels, we observe in the gating charge transfer center a lack of the conservation shared by other voltage-dependent ion channels29 (Fig. 4).
Three ion binding sites are in excellent agreement with predictions of electrophysiological studies12–16,19,20. These sites are poised to regulate the shape of the gating ring and thus the gating state of the pore. In the companion paper we address how ion binding free energy is utilized to gate the channel and how the voltage sensor communicates with the ion binding sites.
Methods
Cloning, expression and purification
A synthetic gene fragment (Bio Basic, Inc.) encoding residues 1 to 1070 of Aplysia californica Slo1 channel was ligated into the XhoI/EcoRI cloning sites of a modified pFastBac vector (Invitrogen). The resulting protein has green fluorescent protein (GFP) and a 1D4 antibody recognition sequence (TETSQVAPA) on the C-terminus52, separated by a PreScission protease cleavage site (SNSLEVLFQ/GP).
For large-scale expression, High Five cells at a density of 1X10⁶/ml were infected with 3% (v:v) baculovirus and cultured at 27°C in sf-900 II SFM medium (Invitrogen) for 48 hours before harvesting. Cells were gently disrupted by stirring in a hypotonic solution containing 10 mM Tris-HCl pH 8.0, 3 mM dithiothreitol (DTT), 1 mM EDTA supplemented with protease inhibitors including 0.1 μg/ml pepstatin A, 1 μg/ml leupeptin, 1 μg/ml aprotinin, 0.1 mg/ml soy trypsin inhibitor, 1 mM benzamidine, 0.1 mg/ml 4-(2-Aminoethyl) benzenesulfonyl fluoride hydrochloride (AEBSF) and 1 mM phenylmethysulfonyl fluoride (PMSF). Cell lysate was then centrifuged for 30 min at 30,000 g and pellet was homogenized in a buffer containing 20 mM Tris-HCl pH 8.0, 320 mM KCl, 10 mM CaCl2, 10 mM MgCl2 supplemented with protease inhibitors including 0.1 μg/ml pepstatin A, 1 μg/ml leupeptin, 1 μg/ml aprotinin, 0.1 mg/ml soy trypsin inhibitor, 1 mM benzamidine, 0.1 mg/ml AEBSF and 0.2 mM PMSF. The lysate was extracted with 1% (w:v) n-Dodecyl-β-D-Maltopyranoside (DDM) and 0.2% (w:v) Cholesterol Hemisuccinate (CHS) for an hour with stirring and then centrifuged for 40 min at 30,000 g. Supernatant was added to GFP nanobody-conjugated affinity resin (CNBr-activated Sepharose 4B resin from GE Healthcare) pre-equilibrated with wash buffer (20 mM Tris-HCl pH 8.0, 320 mM KCl, 10 mM CaCl2, 10 mM MgCl2, 0.2% DDM, 0.04% CHS, 0.1 μg/ml pepstatin A, 1 μg/ml aprotinin and 0.1 mg/ml soy trypsin inhibitor)53,54. The suspension was mixed by inversion for ~2 hours. Beads were first washed with 10 column volumes of wash buffer in batch mode and then collected on a column by gravity, washed with another 10 column volumes of wash buffer. The protein was then digested on resin with PreScission protease (~20:1 w:w ratio) overnight with gentle rocking. Flow-through was then collected, concentrated and further purified on a Superose-6 size exclusion column in 20 mM Tris-HCl pH 8.0, 320 mM KCl, 10 mM CaCl2, 10 mM MgCl2, 20 mM DTT, 2 mM tris (2-carboxyethyl) phosphine (TCEP), 0.1 μg/ml pepstatin A, 1 μg/ml aprotinin, 0.025% DDM and 0.005% CHS. All purification procedures were carried out either on ice or at 4 °C. The peak fractions corresponding to the tetrameric Slo1 channel was concentrated to about 7 mg/ml and used for preparation of cryo-EM sample grids.
Channel reconstitution and electrophysiological recordings from planar lipid bilayers
To generate proteoliposomes for lipid bilayer experiments, the aplysia Slo1 channel was purified as described above except that no Ca2+ or Mg2+ was included in any of the buffers, and instead 1 mM EDTA was present throughout the entire purification process. Purified channels were then reconstituted into 40 mM n-Decyl-β-D-Maltopyranoside (DM)-solubilized lipid mixture of 3:1 (w:w) 1-palmitoyl-2-oleoyl-sn-glycero-3-phosphoethanolamine (POPE) : 1-palmitoyl-2-oleoyl-sn-glycero-3-phospho-(1′-rac-glycerol) (POPG) using procedures previously described with some modifications8,55. In brief, the above lipid mixture was dried under argon and dispersed in water at 20 mg/ml by sonication. The lipid mixture was then solubilized with 40 mM DM and mixed with equal volume of the purified channels at desired concentrations for a few hours at 4 °C. Detergent was removed first by dialysis for 2 days against reconstitution buffer containing 10 mM Hepes-KOH pH 7.5, 450 mM KCl and 2 mM DTT at 4 °C, with daily buffer exchanges. Residual detergent was further removed by incubating the reconstituted channels with Bio-Beads (Bio-Rad) for a few hours at 4 °C. The resulting proteoliposomes were aliquoted and flash frozen with liquid nitrogen before storage at −80 °C.
Vesicles with lower protein:lipid (w:w) ratio (e.g. 1:30 or 1:10) were used for single channel recordings, whereas vesicles with higher protein:lipid (w:w) ratio (e.g. 3:10) were used for recordings of macroscopic currents.
Recordings in planar lipid bilayers were obtained as previously described55. Briefly, a 2:1:1 (w:w:w) lipid mixture of 1,2-dioleoyl-sn-glycero-3-phosphoethanolamine (DOPE) : 1-palmitoyl-2-oleoyl-sn-glycero-3-phosphocholine (POPC) : 1-palmitoyl-2-oleoyl-sn-glycero-3-phospho-L-serine (POPS) was dissolved in decane at 20 mg/ml and painted over a ~100 μm hole on a piece of horizontally-laid polyethylene terephthalate transparency film that separates two chambers in a polyoxymethylene block. Recording solutions in both chambers contain 10 mM Hepes-NaOH pH 7.4, 150 mM KCl as well as various concentrations of CaCl2. 5 μM CaCl2 was included for studies of single channel current-voltage relationship (Fig. 1a) and voltage-dependent channel activation (Fig. 1b–d). For studies of Ca2+-dependent channel activation, the chamber below the planar bilayer, which represents the extracellular side of the channels being studied, has no CaCl2 added deliberately, whereas 0–500 μM CaCl2 was gradually added to the chamber above the bilayer that represents the intracellular side of the channels (Fig. 1e–g). All recordings were performed in voltage-clamp configuration at room temperature. Analogue signals were filtered at 1 kHz using a low-pass Bessel filter on an Axopatch 200B amplifier (Molecular Devices) in whole-cell mode and digitized at 10 kHz using a Digidata 1322A analogue-to-digital converter (Molecular Devices). The pClamp software suite (Molecular Devices) was used to control membrane voltage and record current.
To determine the channel’s unitary conductance, bilayers with very few channels (usually 1 to 3) were studied between 10 and 120 mV with 10 mV increment steps (Fig. 1a). Single channel current at each membrane potential was obtained from the amplitude histogram analysis with the pClamp software suite and plotted as a function of the membrane potential. A linear function is used to fit the single channel current-voltage plot (using data within the voltage range of 10 to 100 mV):
| (1) |
where y is the single channel current, x the membrane potential and the slope b represents the unitary conductance of the channel.
In figure 1c data points were fit to a saturating exponential ‘Boltzmann’ function:
| (2) |
| (3) |
The two-state assumption of equation 2 is generally inaccurate for estimating gating charge z. For this purpose we used the slope of the open probability curve from a single bilayer at different membrane potentials in the presence of 5 μM CaCl223,56–61. Single channel open probability was obtained using the single channel search function from the event detection tab in the pClamp software suite (Molecular Devices), assuming there are a total of 3 channels in the bilayer, which is reasonable as there was never a fourth channel opening detected even at much more depolarized voltages (e.g. 120 mV). Assuming each channel only has two states: open and closed, the single channel open probability-voltage relationship was graphed. The slope analysis yielded a value for the gating charge of 3.1 e0. This value turned out to be the same as an estimate from equations 2 and 3 above presumably because the data were limited to a range of low open probability.
To study the effect of Ca2+, CaCl2 was gradually added to the intracellular side of the channel up to a concentration of 500 μM. At each Ca2+ concentration, ionic currents at various membrane voltages were recorded. Analyzing the nonstationary noise (i.e. variance σ2) in membrane conductance caused by opening and closing of ion channels can reveal the number of channels (N) present in a membrane and the unitary current (i) carried by a single channel at a particular membrane voltage27,62,63. Data for the time interval between 200 and 380 ms of the voltage protocol was used for calculating the average ionic current (<I>) and the variance (σ2) (Fig. 1e–f). A parabola function was used to fit the σ2-<I> plot:
| (4) |
The fitting from variance analysis above yields a single channel conductance of ~63 pS, which is smaller than the 104 pS obtained from single channel current-voltage relationship (Fig. 1a). The variance analysis is well known for underestimating i for filtered data64. Sub-conductance states may also contribute to the underestimation in the case of the Slo1 channel.
The open probability at different [Ca2+] can be calculated as the ratio between the average current <I> and the product of i and N:
At each membrane voltage, Po was plotted as a function of the intracellular Ca2+ concentration and fit with the following Hill equation:
| (5) |
where k will give an estimate of the apparent affinity of Ca2+ at that membrane voltage and n the Hill coefficient (n=1.6 ± 0.1, 1.8 ± 0.3, and 1.3 ± 0.3 at 60 mV, 40 mV, and 20 mV respectively).
All data fits were carried out with the OriginPro software (OriginLab).
Electron microscopy sample preparation and imaging
3.5 μl of purified channel at a concentration of ~7 mg/ml was pipetted onto glow-discharged copper Quantifoil R 1.2/1.3 holey carbon grids (Quantifoil). Grids were blotted for 4 s with a blotting force of 1 and humidity of ~85% and flash frozen in liquid-nitrogen-cooled liquid ethane using an FEI Vitrobot Mark IV (FEI). Grids were then transferred to an FEI Titan Krios electron microscope operating at an acceleration voltage of 300 keV. Images were recorded in an automated fashion on a Gatan K2 Summit (Gatan) detector set to super-resolution mode with a super-resolution pixel size of 0.65 Å using SerialEM65. Images were recorded for 15 s with a subframe exposure time of 300 ms at defocus range of −1.0 to −2.5 μm and a dose of approximately 10 electrons per pixel per second for a total accumulated dose of approximately 89 electrons per square ångström on the specimen over 50 subframes (approximately 1.8 electrons per square ångström per subframe).
Image processing and map calculation
Dose-fractionated super-resolution images were 2 × 2 down sampled by Fourier cropping (resulting in a pixel size of 1.30 Å) for whole-frame motion correction with Unblur66. The parameters of the contrast transfer function were estimated by ctffind467. Following motion correction, ~5k particles from a subset of the images were interactively selected using RELION to generate templates representing different views for automated particle selection68. The autopicked particles were manually inspected to remove false positives, resulting in ~233k particle images. Per-particle alignment of the frames was performed using LM-BFGS69. The ~233k particle images were subjected to 2D classification in RELION to remove particles belonging to low-abundance classes and to generate projection averages for initial model generation with EMAN2 imposing C4 symmetry70. 181k of the particle images classified into high-abundance classes were then subjected to RELION’s 3D classification algorithm using the initial model, resulting in one major class. Orientation and translational parameters for the 133k particle images in this class were refined using the auto-refine algorithm of RELION, resulting in a map that achieved a resolution of 3.5 Å. The rotation and translational parameters determined by RELION were used as the input for 10 additional cycles of refinement by FREALIGN, during which the resolution of the reference map used for alignment was limited to 6 Å to minimize over-refinement, resulting in a final map that achieved a resolution of 3.5 Å as assessed by Fourier shell correlation using the 0.143 cut-off criterion71,72 (Extended Data Fig. 3). The map was initially sharpened using an isotropic b-factor of -100 Å2 prior to model building and coordinate refinement. The final map was sharpened to best fit the molecular transform of the refined atomic model by diffmap (grigoriefflab.janelia.org/diffmap).
Model building and refinement
The x-ray structure of the open zebrafish Slo1 gating ring (PDB code: 3U6N) was docked into the cryo-EM density map using UCSF Chimera73 and then manually rebuilt in Coot to fit the density74. The TMD was built by first placing secondary structure elements into the density and then connecting them with manually built loops. Once the backbone was traced, the sequence was registered by the assignment of large side-chains. Density for the channel is well resolved with the exception of the amino-terminal 13 residues, a 34-amino acid segment between S0 and an amphipathic helix (S0′) before S1, the extracellular S1–S2 loop, four connecting loops in the CTD, and 5 residues at the very C-terminus. Densities for transmembrane helices S1–S6, RCK1 and RCK2 domains of the CTD, as well as the linkers between the VSD, pore domain and the CTD are of high quality throughout with most side-chains visible, which allowed us to register the channel with confidence (Extended Data Fig. 4). Helix S0 exhibited weaker density compared to the rest of the channel, but several large side-chains near its extracellular and cytoplasmic ends allowed us to register the sequence (Extended Data Figs. 1 and 4).
The cryo-EM density map of one of the half-maps corresponding to a new smaller unit cell that extended 5 Å from the model in all directions was extracted. Cycles of real space refinement using phenix.real_space_refine75 and reciprocal space refinement using REFMAC76 were alternated with manual rebuilding in Coot. Geometric and secondary structure restraints were tightly maintained throughout refinement to minimize over-fitting. To monitor the effects of over-fitting, the Fourier shell correlation of the refined model was determined for the half-map used during refinement (FSC work) and the half-map that was not used at any point during refinement (FSC free). The final model has good geometry and contains residues 14–44, 79–124, 134–561, 567–621, 706–856, 882–1031, and 1037–1065 (Extended Data Fig. 5).
15 partial lipid molecules surrounding the channel were also modelled into the density map. These lipid molecules are mostly present in the concave semi-circles between VSDs of neighboring subunits and form a lipid-bilayer like arrangement near the channel surface, similar to what was observed in the x-ray crystal structure of the Kvchim channel8 (Extended Data Fig. 6a, b). Density for the head group of several of the lipid molecules is visible, among which one resides at the position of the extracellular membrane interface interacting with an Arg residue on S6 (Extended Data Figs. 4 and 6c). The acyl chains of the partial lipid molecules are well coordinated through hydrophobic interactions with the channel, similar to lipids seen in Kvchim8. The lipid molecules were co-purified with the protein from the expression host as we did not include additional phospholipids in the purification steps, suggesting they are an integral part of the channel-membrane structure and probably serve to stabilize the protein.
Local resolution estimates were calculated using ResMap77. All structure calculations were performed using software compiled by SBGrid78. Structure figures were prepared with UCSF Chimera73 and Pymol (Pymol version 1.7.2 Schrodinger LLC).
Data availability
The 3D cryo-EM density map of Ca2+-bound Slo1 with low-pass filter and amplitude modification and atomic coordinates for Ca2+-bound Slo1 have been deposited in the Worldwide Protein Data Bank (wwPDB) under accession number EMD-8410 and 5TJ6.
Extended Data
Extended Data Figure 1. Sequence alignment of aplysia Slo1, human Slo1 and zebrafish Slo1.

Secondary structure elements are indicated above the sequences and disordered regions in the structure are indicated with dashed lines. Residues discussed in the text are highlighted in marine blue (Ca2+ bowl site), orange (Ca2+ RCK1 site), magenta (“Mg2+” site) and cyan (selectivity filter). The three positive charged residues (R2, R3, and R4) and corresponding residues of the gating charge transfer center are colored as well. Numbers above and below the sequences refer to the aplysia and human Slo1, respectively.
Abbreviations for the amino acids are as follows: A, Ala; C, Cys; D, Asp; E, Glu; F, Phe; G, Gly; H, His; I, Ile; K, Lys; L, Leu; M, Met; N, Asn; P, Pro; Q, Gln; R, Arg; S, Ser; T, Thr; V, Val; W, Trp; and Y, Tyr.
Extended Data Figure 2. Cryo-EM density maps at the three divalent cation-binding sites.

a, Stereo view of density (grey wire mesh contoured at 6σ) near the Ca2+ bowl site and the Ca2+ RCK1 site demonstrating the structural connectivity between the two Ca2+ binding sites. The channel is shown as lines with the RCK1 domain colored blue and RCK2 domain colored red. The Ca2+ ions at the two sites are shown as marine blue and orange spheres, respectively. Side-chains of R503, E912 and Y914 are shown as sticks and colored according to atom type. b, Stereo view of density at the Mg2+ site (grey wire mesh contoured at 3 σ). The channel is shown as sticks and colored according to atom type: yellow, carbon in the RCK1 domain; green, carbon in the neighboring VSD; blue, nitrogen; red, oxygen. The divalent cation is shown as a magenta sphere.
Extended Data Figure 3. Cryo-EM reconstruction of aplysia Slo1.

a, Representative image and 2D class averages of vitrified aplysia Slo1. Scale bar is 500 Å. b, Angular distribution plot for aplysia Slo1 reconstruction. c, Fourier shell correlation curve for aplysia Slo1. Overall resolution is estimated to be 3.47 Å on the basis of the FSC = 0.143 (dashed line) cut-off criterion. d, Cryo-EM density map colored by local resolution using ResMap (in ångstroms)77.
Extended Data Figure 4. Representative segments of cryo-EM density.

Cryo-EM density maps are of high quality throughout the channel: density for regions of S0, S0′, S1, S2, S3, S4, S5, S6, S6-RCK1 linker, a bound partial lipid molecule, as well as representative regions of RCK1 and RCK2 domains are shown as grey wire mesh. The channel is shown as sticks and colored according to atom type: yellow, carbon; red, oxygen; blue, nitrogen; orange, sulphur; and magenta, phosphorous.
Extended Data Figure 5. Validation of the refined model.

a, Refinement statistics for Slo1 model. b, Fourier shell correlation curves of refined model versus unmasked map for cross-validation. The black curve is the refined model compared to the full data set, the red curve is the refined model compared to half-map 1 (used during refinement) and the blue curve is the refined model compared to half-map 2 (not used during refinement).
Extended Data Figure 6. Co-purified lipids in the structure.

a, b, Side and top views of the Slo1 transmembrane region showing the ordered lipid molecules (CPK representation, colored according to atom type: yellow, carbon; red, oxygen; magenta, phosphorous). The channel is shown as blue α-carbon traces and K+ ions are shown as green spheres. c, Stereo view of detailed interactions of a lipid molecule with visible head group as well as two other partial lipids in the vicinity. Lipid molecules are shown as sticks and colored as in panel a. The channel is shown as blue α-carbon traces and side-chains involved in lipid interactions are shown as green sticks.
Acknowledgments
We thank M. Ebrahim at the Evelyn Gruss Lipper Cryo-EM Resource Center at Rockefeller University for assistance in data collection; R.W. Aldrich (Univerisity of Texas at Austin) for comments on the manuscript; and members of the MacKinnon lab for assistance. This work was supported in part by GM43949. R.K.H. is a Howard Hughes Medical Institute postdoctoral fellow of the Helen Hay Whitney Foundation and R.M. is an investigator of the Howard Hughes Medical Institute.
Footnotes
Author Contributions
X.T. and R.K.H. performed the experiments. X.T., R.K.H. and R.M. designed the experiments, analyzed the results and prepared the manuscript.
Competing financial interests
The authors declare no competing financial interests.
References
- 1.Pallotta BS, Magleby KL, Barrett JN. Single channel recordings of Ca2+-activated K+ currents in rat muscle cell culture. Nature. 1981;293:471–474. doi: 10.1038/293471a0. [DOI] [PubMed] [Google Scholar]
- 2.Marty A. Ca-dependent K channels with large unitary conductance in chromaffin cell membranes. Nature. 1981;291:497–500. doi: 10.1038/291497a0. [DOI] [PubMed] [Google Scholar]
- 3.Latorre R, Vergara C, Hidalgo C. Reconstitution in planar lipid bilayers of a Ca2+-dependent K+ channel from transverse tubule membranes isolated from rabbit skeletal muscle. Proc Natl Acad Sci U S A. 1982;79:805–809. doi: 10.1073/pnas.79.3.805. [DOI] [PMC free article] [PubMed] [Google Scholar]
- 4.Barrett JN, Magleby KL, Pallotta BS. Properties of single calcium-activated potassium channels in cultured rat muscle. J Physiol. 1982;331:211–230. doi: 10.1113/jphysiol.1982.sp014370. [DOI] [PMC free article] [PubMed] [Google Scholar]
- 5.Contreras GF, et al. A BK (Slo1) channel journey from molecule to physiology. Channels (Austin) 2013;7:442–458. doi: 10.4161/chan.26242. [DOI] [PMC free article] [PubMed] [Google Scholar]
- 6.Jiang Y, Pico A, Cadene M, Chait BT, MacKinnon R. Structure of the RCK domain from the E. coli K+ channel and demonstration of its presence in the human BK channel. Neuron. 2001;29:593–601. doi: 10.1016/s0896-6273(01)00236-7. [DOI] [PubMed] [Google Scholar]
- 7.Long SB, Campbell EB, Mackinnon R. Crystal structure of a mammalian voltage-dependent Shaker family K+ channel. Science. 2005;309:897–903. doi: 10.1126/science.1116269. [DOI] [PubMed] [Google Scholar]
- 8.Long SB, Tao X, Campbell EB, MacKinnon R. Atomic structure of a voltage-dependent K+ channel in a lipid membrane-like environment. Nature. 2007;450:376–382. doi: 10.1038/nature06265. [DOI] [PubMed] [Google Scholar]
- 9.Wu Y, Yang Y, Ye S, Jiang Y. Structure of the gating ring from the human large-conductance Ca(2+)-gated K(+) channel. Nature. 2010;466:393–397. doi: 10.1038/nature09252. [DOI] [PMC free article] [PubMed] [Google Scholar]
- 10.Yuan P, Leonetti MD, Pico AR, Hsiung Y, MacKinnon R. Structure of the human BK channel Ca2+-activation apparatus at 3.0 A resolution. Science. 2010;329:182–186. doi: 10.1126/science.1190414. [DOI] [PMC free article] [PubMed] [Google Scholar]
- 11.Yuan P, Leonetti MD, Hsiung Y, MacKinnon R. Open structure of the Ca2+ gating ring in the high-conductance Ca2+-activated K+ channel. Nature. 2012;481:94–97. doi: 10.1038/nature10670. [DOI] [PMC free article] [PubMed] [Google Scholar]
- 12.Schreiber M, Salkoff L. A novel calcium-sensing domain in the BK channel. Biophys J. 1997;73:1355–1363. doi: 10.1016/S0006-3495(97)78168-2. [DOI] [PMC free article] [PubMed] [Google Scholar]
- 13.Xia XM, Zeng X, Lingle CJ. Multiple regulatory sites in large-conductance calcium-activated potassium channels. Nature. 2002;418:880–884. doi: 10.1038/nature00956. [DOI] [PubMed] [Google Scholar]
- 14.Zhang G, et al. Ion sensing in the RCK1 domain of BK channels. Proc Natl Acad Sci U S A. 2010;107:18700–18705. doi: 10.1073/pnas.1010124107. [DOI] [PMC free article] [PubMed] [Google Scholar]
- 15.Bao L, Rapin AM, Holmstrand EC, Cox DH. Elimination of the BK(Ca) channel’s high-affinity Ca(2+) sensitivity. J Gen Physiol. 2002;120:173–189. doi: 10.1085/jgp.20028627. [DOI] [PMC free article] [PubMed] [Google Scholar]
- 16.Bao L, Kaldany C, Holmstrand EC, Cox DH. Mapping the BKCa channel’s “Ca2+ bowl”: side-chains essential for Ca2+ sensing. J Gen Physiol. 2004;123:475–489. doi: 10.1085/jgp.200409052. [DOI] [PMC free article] [PubMed] [Google Scholar]
- 17.Golowasch J, Kirkwood A, Miller C. Allosteric effects of Mg2+ on the gating of Ca2+-activated K+ channels from mammalian skeletal muscle. J Exp Biol. 1986;124:5–13. doi: 10.1242/jeb.124.1.5. [DOI] [PubMed] [Google Scholar]
- 18.Oberhauser A, Alvarez O, Latorre R. Activation by divalent cations of a Ca2+-activated K+ channel from skeletal muscle membrane. J Gen Physiol. 1988;92:67–86. doi: 10.1085/jgp.92.1.67. [DOI] [PMC free article] [PubMed] [Google Scholar]
- 19.Shi J, et al. Mechanism of magnesium activation of calcium-activated potassium channels. Nature. 2002;418:876–880. doi: 10.1038/nature00941. [DOI] [PubMed] [Google Scholar]
- 20.Yang H, et al. Activation of Slo1 BK channels by Mg2+ coordinated between the voltage sensor and RCK1 domains. Nat Struct Mol Biol. 2008;15:1152–1159. doi: 10.1038/nsmb.1507. [DOI] [PMC free article] [PubMed] [Google Scholar]
- 21.Grissmer S, et al. Pharmacological characterization of five cloned voltage-gated K+ channels, types Kv1.1, 1.2, 1.3, 1.5, and 3.1, stably expressed in mammalian cell lines. Mol Pharmacol. 1994;45:1227–1234. [PubMed] [Google Scholar]
- 22.Zhang Y, et al. The appearance of a protein kinase A-regulated splice isoform of slo is associated with the maturation of neurons that control reproductive behavior. J Biol Chem. 2004;279:52324–52330. doi: 10.1074/jbc.M408543200. [DOI] [PubMed] [Google Scholar]
- 23.Horrigan FT, Aldrich RW. Coupling between voltage sensor activation, Ca2+ binding and channel opening in large conductance (BK) potassium channels. J Gen Physiol. 2002;120:267–305. doi: 10.1085/jgp.20028605. [DOI] [PMC free article] [PubMed] [Google Scholar]
- 24.Stefani E, et al. Voltage-controlled gating in a large conductance Ca2+-sensitive K+channel (hslo) Proc Natl Acad Sci U S A. 1997;94:5427–5431. doi: 10.1073/pnas.94.10.5427. [DOI] [PMC free article] [PubMed] [Google Scholar]
- 25.Horrigan FT, Aldrich RW. Allosteric voltage gating of potassium channels II. Mslo channel gating charge movement in the absence of Ca(2+) J Gen Physiol. 1999;114:305–336. doi: 10.1085/jgp.114.2.305. [DOI] [PMC free article] [PubMed] [Google Scholar]
- 26.Horrigan FT, Cui J, Aldrich RW. Allosteric voltage gating of potassium channels I. Mslo ionic currents in the absence of Ca(2+) J Gen Physiol. 1999;114:277–304. doi: 10.1085/jgp.114.2.277. [DOI] [PMC free article] [PubMed] [Google Scholar]
- 27.Sigworth FJ. The variance of sodium current fluctuations at the node of Ranvier. J Physiol. 1980;307:97–129. doi: 10.1113/jphysiol.1980.sp013426. [DOI] [PMC free article] [PubMed] [Google Scholar]
- 28.Long SB, Campbell EB, Mackinnon R. Voltage sensor of Kv1.2: structural basis of electromechanical coupling. Science. 2005;309:903–908. doi: 10.1126/science.1116270. [DOI] [PubMed] [Google Scholar]
- 29.Tao X, Lee A, Limapichat W, Dougherty DA, MacKinnon R. A gating charge transfer center in voltage sensors. Science. 2010;328:67–73. doi: 10.1126/science.1185954. [DOI] [PMC free article] [PubMed] [Google Scholar]
- 30.Jensen MO, et al. Mechanism of voltage gating in potassium channels. Science. 2012;336:229–233. doi: 10.1126/science.1216533. [DOI] [PubMed] [Google Scholar]
- 31.Ruta V, Chen J, MacKinnon R. Calibrated measurement of gating-charge arginine displacement in the KvAP voltage-dependent K+ channel. Cell. 2005;123:463–475. doi: 10.1016/j.cell.2005.08.041. [DOI] [PubMed] [Google Scholar]
- 32.Liu G, et al. Location of modulatory beta subunits in BK potassium channels. J Gen Physiol. 2010;135:449–459. doi: 10.1085/jgp.201010417. [DOI] [PMC free article] [PubMed] [Google Scholar]
- 33.Zhou Y, MacKinnon R. The occupancy of ions in the K+ selectivity filter: charge balance and coupling of ion binding to a protein conformational change underlie high conduction rates. J Mol Biol. 2003;333:965–975. doi: 10.1016/j.jmb.2003.09.022. [DOI] [PubMed] [Google Scholar]
- 34.Nishida M, MacKinnon R. Structural basis of inward rectification: cytoplasmic pore of the G protein-gated inward rectifier GIRK1 at 1.8 A resolution. Cell. 2002;111:957–965. doi: 10.1016/s0092-8674(02)01227-8. [DOI] [PubMed] [Google Scholar]
- 35.Hite RK, et al. Cryo-electron microscopy structure of the Slo2.2 Na(+)-activated K(+) channel. Nature. 2015;527:198–203. doi: 10.1038/nature14958. [DOI] [PMC free article] [PubMed] [Google Scholar]
- 36.Brelidze TI, Niu X, Magleby KL. A ring of eight conserved negatively charged amino acids doubles the conductance of BK channels and prevents inward rectification. Proc Natl Acad Sci U S A. 2003;100:9017–9022. doi: 10.1073/pnas.1532257100. [DOI] [PMC free article] [PubMed] [Google Scholar]
- 37.Nimigean CM, Chappie JS, Miller C. Electrostatic tuning of ion conductance in potassium channels. Biochemistry. 2003;42:9263–9268. doi: 10.1021/bi0348720. [DOI] [PubMed] [Google Scholar]
- 38.Budelli G, Geng Y, Butler A, Magleby KL, Salkoff L. Properties of Slo1 K+ channels with and without the gating ring. Proc Natl Acad Sci U S A. 2013;110:16657–16662. doi: 10.1073/pnas.1313433110. [DOI] [PMC free article] [PubMed] [Google Scholar]
- 39.Li W, Aldrich RW. Unique inner pore properties of BK channels revealed by quaternary ammonium block. J Gen Physiol. 2004;124:43–57. doi: 10.1085/jgp.200409067. [DOI] [PMC free article] [PubMed] [Google Scholar]
- 40.Armstrong CM, Bezanilla F. Charge movement associated with the opening and closing of the activation gates of the Na channels. J Gen Physiol. 1974;63:533–552. doi: 10.1085/jgp.63.5.533. [DOI] [PMC free article] [PubMed] [Google Scholar]
- 41.Seoh SA, Sigg D, Papazian DM, Bezanilla F. Voltage-sensing residues in the S2 and S4 segments of the Shaker K+ channel. Neuron. 1996;16:1159–1167. doi: 10.1016/s0896-6273(00)80142-7. [DOI] [PubMed] [Google Scholar]
- 42.Aggarwal SK, MacKinnon R. Contribution of the S4 segment to gating charge in the Shaker K+ channel. Neuron. 1996;16:1169–1177. doi: 10.1016/s0896-6273(00)80143-9. [DOI] [PubMed] [Google Scholar]
- 43.Shi J, Cui J. Intracellular Mg(2+) enhances the function of BK-type Ca(2+)-activated K(+) channels. J Gen Physiol. 2001;118:589–606. doi: 10.1085/jgp.118.5.589. [DOI] [PMC free article] [PubMed] [Google Scholar]
- 44.Amy K, Katz JPG, Beebe Scott A, Bock Charles W. Calcium Ion Coordination: A Comparison with That of Beryllium Magnesium and Zinc. J Am Chem Soc. 1996;1(118):5752–5763. [Google Scholar]
- 45.Bock Charles W, Jenny AK, Glusker P. Coordination of water to magnesium cations. Inorg Chem. 1994;33:419–427. [Google Scholar]
- 46.Qian X, Niu X, Magleby KL. Intra- and intersubunit cooperativity in activation of BK channels by Ca2+ J Gen Physiol. 2006;128:389–404. doi: 10.1085/jgp.200609486. [DOI] [PMC free article] [PubMed] [Google Scholar]
- 47.Sweet TB, Cox DH. Measurements of the BKCa channel’s high-affinity Ca2+ binding constants: effects of membrane voltage. J Gen Physiol. 2008;132:491–505. doi: 10.1085/jgp.200810094. [DOI] [PMC free article] [PubMed] [Google Scholar]
- 48.Zhang X, et al. Crystal structure of an orthologue of the NaChBac voltage-gated sodium channel. Nature. 2012;486:130–134. doi: 10.1038/nature11054. [DOI] [PMC free article] [PubMed] [Google Scholar]
- 49.Payandeh J, Gamal El-Din TM, Scheuer T, Zheng N, Catterall WA. Crystal structure of a voltage-gated sodium channel in two potentially inactivated states. Nature. 2012;486:135–139. doi: 10.1038/nature11077. [DOI] [PMC free article] [PubMed] [Google Scholar]
- 50.Guo J, et al. Structure of the voltage-gated two-pore channel TPC1 from Arabidopsis thaliana. Nature. 2016;531:196–201. doi: 10.1038/nature16446. [DOI] [PMC free article] [PubMed] [Google Scholar]
- 51.Ho BK, GF HOLLOW: generating accurate representations of channel and interior surfaces in molecular structures. BMC Struct Biol. 2008;8 doi: 10.1186/1472-6807-8-49. [DOI] [PMC free article] [PubMed] [Google Scholar]
- 52.Wong JP, Reboul E, Molday RS, Kast J. A carboxy-terminal affinity tag for the purification and mass spectrometric characterization of integral membrane proteins. J Proteome Res. 2009;8:2388–2396. doi: 10.1021/pr801008c. [DOI] [PMC free article] [PubMed] [Google Scholar]
- 53.Rothbauer U, et al. A versatile nanotrap for biochemical and functional studies with fluorescent fusion proteins. Mol Cell Proteomics. 2008;7:282–289. doi: 10.1074/mcp.M700342-MCP200. [DOI] [PubMed] [Google Scholar]
- 54.Fridy PC, et al. A robust pipeline for rapid production of versatile nanobody repertoires. Nat Methods. 2014;11:1253–1260. doi: 10.1038/nmeth.3170. [DOI] [PMC free article] [PubMed] [Google Scholar]
- 55.Wang W, Whorton MR, MacKinnon R. Quantitative analysis of mammalian GIRK2 channel regulation by G proteins, the signaling lipid PIP2 and Na+ in a reconstituted system. Elife. 2014;3:e03671. doi: 10.7554/eLife.03671. [DOI] [PMC free article] [PubMed] [Google Scholar]
- 56.Almers W. Gating currents and charge movements in excitable membranes. Rev Physiol Biochem Pharmacol. 1978;82:96–190. doi: 10.1007/BFb0030498. [DOI] [PubMed] [Google Scholar]
- 57.Almers W, Armstrong CM. Survival of K+ permeability and gating currents in squid axons perfused with K+-free media. J Gen Physiol. 1980;75:61–78. doi: 10.1085/jgp.75.1.61. [DOI] [PMC free article] [PubMed] [Google Scholar]
- 58.Bezanilla F, Stefani E. Voltage-dependent gating of ionic channels. Annu Rev Biophys Biomol Struct. 1994;23:819–846. doi: 10.1146/annurev.bb.23.060194.004131. [DOI] [PubMed] [Google Scholar]
- 59.Hirschberg B, Rovner A, Lieberman M, Patlak J. Transfer of twelve charges is needed to open skeletal muscle Na+ channels. J Gen Physiol. 1995;106:1053–1068. doi: 10.1085/jgp.106.6.1053. [DOI] [PMC free article] [PubMed] [Google Scholar]
- 60.Noceti F, et al. Effective gating charges per channel in voltage-dependent K+ and Ca2+ channels. J Gen Physiol. 1996;108:143–155. doi: 10.1085/jgp.108.3.143. [DOI] [PMC free article] [PubMed] [Google Scholar]
- 61.Sigg D, Bezanilla F. Total charge movement per channel. The relation between gating charge displacement and the voltage sensitivity of activation. J Gen Physiol. 1997;109:27–39. doi: 10.1085/jgp.109.1.27. [DOI] [PMC free article] [PubMed] [Google Scholar]
- 62.Conti F, Wanke E. Channel noise in nerve membranes and lipid bilayers. Q Rev Biophys. 1975;8:451–506. doi: 10.1017/s0033583500001967. [DOI] [PubMed] [Google Scholar]
- 63.Sigworth FJ. Sodium channels in nerve apparently have two conductance states. Nature. 1977;270:265–267. doi: 10.1038/270265a0. [DOI] [PubMed] [Google Scholar]
- 64.Lingle CJ. Empirical considerations regarding the use of ensemble-variance analysis of macroscopic currents. J Neurosci Methods. 2006;158:121–132. doi: 10.1016/j.jneumeth.2006.05.027. [DOI] [PubMed] [Google Scholar]
- 65.Mastronarde DN. Automated electron microscope tomography using robust prediction of specimen movements. J Struct Biol. 2005;152:36–51. doi: 10.1016/j.jsb.2005.07.007. [DOI] [PubMed] [Google Scholar]
- 66.Grant T, Grigorieff N. Measuring the optimal exposure for single particle cryo-EM using a 2.6 A reconstruction of rotavirus VP6. Elife. 2015;4:e06980. doi: 10.7554/eLife.06980. [DOI] [PMC free article] [PubMed] [Google Scholar]
- 67.Rohou A, Grigorieff N. CTFFIND4: Fast and accurate defocus estimation from electron micrographs. J Struct Biol. 2015;192:216–221. doi: 10.1016/j.jsb.2015.08.008. [DOI] [PMC free article] [PubMed] [Google Scholar]
- 68.Scheres SH. RELION: implementation of a Bayesian approach to cryo-EM structure determination. J Struct Biol. 2012;180:519–530. doi: 10.1016/j.jsb.2012.09.006. [DOI] [PMC free article] [PubMed] [Google Scholar]
- 69.Rubinstein JL, Brubaker MA. Alignment of cryo-EM movies of individual particles by optimization of image translations. J Struct Biol. 2015;192:188–195. doi: 10.1016/j.jsb.2015.08.007. [DOI] [PubMed] [Google Scholar]
- 70.Bell JM, Chen M, Baldwin PR, Ludtke SJ. High resolution single particle refinement in EMAN2.1. Methods. 2016;100:25–34. doi: 10.1016/j.ymeth.2016.02.018. [DOI] [PMC free article] [PubMed] [Google Scholar]
- 71.Lyumkis D, Brilot AF, Theobald DL, Grigorieff N. Likelihood-based classification of cryo-EM images using FREALIGN. J Struct Biol. 2013;183:377–388. doi: 10.1016/j.jsb.2013.07.005. [DOI] [PMC free article] [PubMed] [Google Scholar]
- 72.Rosenthal PB, Henderson R. Optimal determination of particle orientation, absolute hand, and contrast loss in single-particle electron cryomicroscopy. J Mol Biol. 2003;333:721–745. doi: 10.1016/j.jmb.2003.07.013. [DOI] [PubMed] [Google Scholar]
- 73.Pettersen EF, et al. UCSF Chimera--a visualization system for exploratory research and analysis. J Comput Chem. 2004;25:1605–1612. doi: 10.1002/jcc.20084. [DOI] [PubMed] [Google Scholar]
- 74.Emsley P, Lohkamp B, Scott WG, Cowtan K. Features and development of Coot. Acta Crystallogr D Biol Crystallogr. 2010;66:486–501. doi: 10.1107/S0907444910007493. [DOI] [PMC free article] [PubMed] [Google Scholar]
- 75.Adams PD, et al. The Phenix software for automated determination of macromolecular structures. Methods. 2011;55:94–106. doi: 10.1016/j.ymeth.2011.07.005. [DOI] [PMC free article] [PubMed] [Google Scholar]
- 76.Brown A, et al. Tools for macromolecular model building and refinement into electron cryo-microscopy reconstructions. Acta Crystallogr D Biol Crystallogr. 2015;71:136–153. doi: 10.1107/S1399004714021683. [DOI] [PMC free article] [PubMed] [Google Scholar]
- 77.Kucukelbir A, Sigworth FJ, Tagare HD. Quantifying the local resolution of cryo-EM density maps. Nat Methods. 2014;11:63–65. doi: 10.1038/nmeth.2727. [DOI] [PMC free article] [PubMed] [Google Scholar]
- 78.Morin A, et al. Collaboration gets the most out of software. Elife. 2013;2:e01456. doi: 10.7554/eLife.01456. [DOI] [PMC free article] [PubMed] [Google Scholar]
Associated Data
This section collects any data citations, data availability statements, or supplementary materials included in this article.
Data Availability Statement
The 3D cryo-EM density map of Ca2+-bound Slo1 with low-pass filter and amplitude modification and atomic coordinates for Ca2+-bound Slo1 have been deposited in the Worldwide Protein Data Bank (wwPDB) under accession number EMD-8410 and 5TJ6.