

Abstract
Identifying interactions between genetics and the environment (GxE) remains challenging. We have developed EAGLE, a hierarchical Bayesian model for identifying GxE interactions based on association between environment and allele-specific expression (ASE). Combining RNA-sequencing of whole blood and extensive environmental annotations collected from 922 human individuals, we identified 35 GxE interactions, compared to only four using standard GxE testing. EAGLE provides new opportunities to identify GxE interactions using functional genomic data.
Phenotypic variation results from the combined effect of environment and individual genetic background. Many environmental and behavioral influences have been shown to substantially affect human disease risk, and in model organisms gene-by-environment (GxE) interactions have been shown to be pervasive2. However, the prevalence and importance of GxE in human health is not well characterized, and identifying associations on a large scale in human populations has been both statistically and experimentally challenging3. Targeted experimental approaches are not always practical, and detection of GxE from genome-wide data faces considerations including small genetic effect sizes for most complex traits and high multiple hypothesis-testing burden.
In this study, we analyzed GxE in the context of transcriptomic phenotypes; these traits can mediate disease risk, and the effects of genetic variation on gene expression are large enough for well-powered, reproducible, genome-wide detection of expression quantitative trait loci (eQTLs) even in modestly-sized cohorts4,5. Gene expression can also reveal the impact of environmental factors6,7, and recently, in vitro immune stimulation has been used to detect hundreds of GxE effects in human monocytes8 and dendritic cells9,10. Further, agnostic to the specific environment involved, the presence of extensive GxE interactions affecting the transcriptome is supported by variance eQTLs11 and allele specific expression12 in mono- and dizygotic twins.
To improve power to discover GxE interactions, we developed EAGLE (Environment-ASE through Generalized LinEar modeling), a novel method to test for GxE interactions using allele specific expression (ASE). Intuitively, observing that allelic imbalance of a gene associates with a particular environmental factor suggests that there is a cis-regulatory effect whose impact on expression is modulated by that environment. For example, an environmentally responsive transcription factor that binds to one allele better than the other allele (Figure 1A) would result in allelic imbalance of the target gene in that environmental context. By comparing two alleles within the same sample, ASE provides an “internally matched” measure that inherently provides improved control for batch effects and other forms of confounding technical variation (Supplementary Figure S1). EAGLE uses a binomial generalized linear mixed model (GLMM, Supplementary Note 1), predicting the relative number of RNA-seq reads from each allele at exonic, heterozygous loci under different environmental conditions. EAGLE directly models allelic read counts, which we, and others13,14, have found display extra-binomial variation. EAGLE estimates a per-locus overdispersion parameter (random effect variance) that accounts for both technical overdispersion (e.g. from PCR amplification) and extrinsic variation between individuals. Statistical power is shared across loci by learning a genome-wide prior on these variance parameters. We controlled for known cis-eQTL by including heterozygosity of the lead eSNP as a covariate. EAGLE can additionally be used to identify associations with other factors, such as genetic variants (Supplementary Figure S2).
Figure 1.
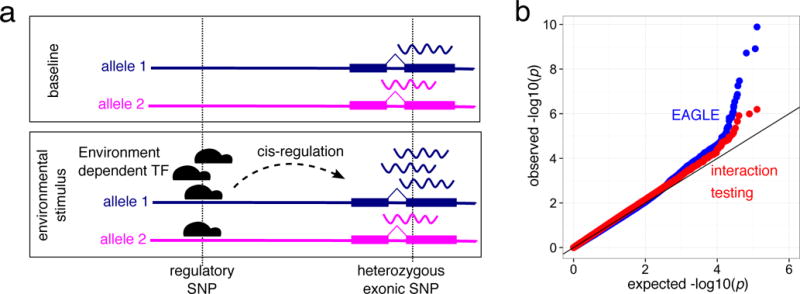
EAGLE associates allelic specific expression (ASE) with environmental covariates to detect GxE interactions. (a) Allelic imbalance can be driven by allele specific binding of an environmentally responsive transcription factor. (b) Relative to interaction QTL testing, using ASE increases power in the DGN cohort across 30 environmental variables. Interaction testing was performed on SNP within 200kb of each gene, followed by Bonferroni correction. EAGLE provides an internally controlled test and integrates across the cis-regulatory landscape of a gene.
A naïve approach to associate an environmental factor with ASE is to calculate Spearman correlation with a standard definition of allelic imbalance, , where y and n are the alternative and total counts respectively. However, we have shown using a simulation study (Supplementary Note 2) that by accounting for binomial sampling variance, EAGLE’s direct modeling of allelic read counts improved power (Supplementary Figure S3) and reduced false positives (Supplementary Figure S4). A binomial generalized linear model also failed to account for overdispersion, leading to overinflated p-values and excessive false positives especially at higher read depths (Supplementary Figure S5). In contrast, by using a mixed model, EAGLE effectively accounted for overdispersion and remained conservative (Supplementary Figures S5–7). EAGLE is computationally efficient: testing 19,050 exonic SNPs across one environmental factor in 922 samples takes under one hour on a modern workstation (Intel Core i5 Quad-Core 3.30GHz, 16Gb).
We applied EAGLE to a large, well-annotated, publicly-available cohort of 922 individuals with RNA-seq from the Depression Genes and Networks study4. The samples come from a primary tissue, enabling accurate analysis of environmental influences on the transcriptome; indeed, we detected thousands of environmentally responsive genes (Supplementary Figure S8).
We tested for EAGLE associations between 30 environmental factors (Supplementary Table S1) and ASE of 8795 genes (Online Methods). We found 35 significant associations (10% FDR, Supplementary Table S2). Among these, we detected a novel GxE interaction between exercise before blood draw and DYSF a skeletal muscle repair protein. Mutations in DYSF cause the recessive muscular dystrophy dysferlinopathy, with progression of the disease being exercise level dependent15. We also detected a GxE interaction for blood pressure medication with NPRL3, part of the NPR3 protein family involved in homeostasis of fluid volume (Figure 2a). Additionally, we observed that higher BMI is associated with increased allelic imbalance of VNN1, which is associated with high-density lipoprotein cholesterol16 and is predicted to be causally related to omental fat pad mass17. We found enrichment of EAGLE associations in relevant pathways, transcription factor target sets and trans-eQTL networks (Supplementary Notes 3–5, Supplementary Figure S9).
Figure 2.
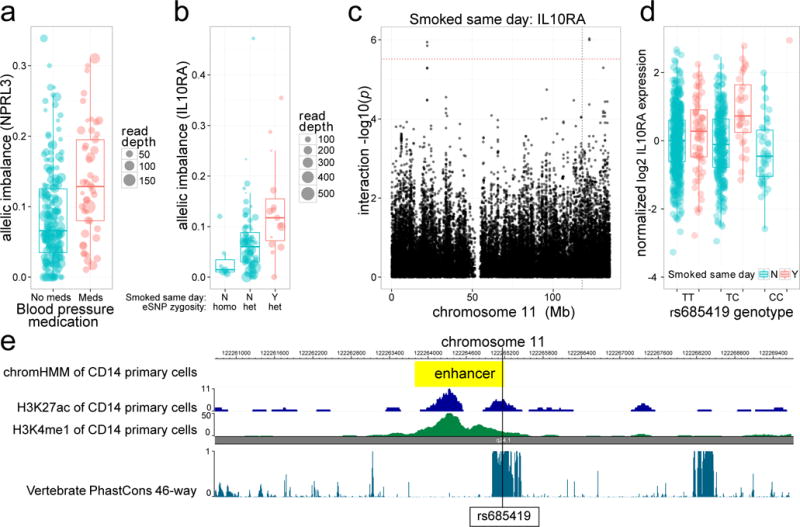
EAGLE detects GxE interactions missed by standard interaction QTL testing. (a) Blood pressure medication modulates regulation of NPRL3, involved in fluid homeostasis. (b) Smoking interacts with regulation of IL10RA. (c–e) Using standard interaction QTL testing as a second phase within EAGLE hits, we detect rs685419 as a promising candidate variant for smoking’s association with IL10RA, lying 4Mb from the TSS in a conserved region corresponding to an enhancer in CD14+ primary cells.
As a baseline, we mapped GxE interactions on total expression using a standard linear model interaction test (Online Methods). EAGLE showed much greater power to detect GxE interactions than standard interaction QTL testing (Figure 1B). In addition, using Bonferroni correction across the SNPs tested per gene (since there is no appropriate permutation strategy for interaction testing18) followed by controlling the FDR at 10%, we find only four associations across all 30 environmental factors compared to 35 discovered with EAGLE on the same set of tested genes.
We investigated the validity of EAGLE associations by analyzing replication both within DGN and between independent studies. First, we split the DGN cohort into equal-sized discovery and replication sets, while approximately matching sex and age. The proportion of EAGLE associations replicating (p<0.05) increases with the stringency of the discovery p-value threshold, which is not the case for standard interaction QTL associations (Supplementary Figure 10a). Despite halving the sample size, 50% of the associations discovered at replicate (corresponding approximately to 10% FDR). Second, we checked for replication of EAGLE associations from DGN in 723 native French-Canadians from the CARTaGENE whole blood cohort19,20. Despite differences in population, recruitment and recording of environmental factors, we observed replication (Supplementary Figure 10b), with the strongest pattern observed for BMI, a measurement with a quantitative definition and thus likely to be consistent between the two studies. Ten EAGLE hits from DGN corresponded to environmental factors recorded in both cohorts. Of these, six replicated in CARTaGENE (p<0.05).
EAGLE’s improved power over standard interaction QTL testing may derive from multiple sources, including the controlled, within-individual nature of our ASE-based test (Supplementary Figures S1), along with the direct modeling of read counts (Supplementary Figure S3). Supported by a simulation study where we varied the level of confounding (Supplementary Note 6, Supplementary Figure S11) we hypothesize that confounders, such as cell-type portion, are a key reason standard interaction QTL testing is underpowered. Further, EAGLE implicitly integrates over the entire cis-regulatory landscape of a gene rather than explicitly testing a specific candidate SNP, reducing the multiple hypothesis-testing burden and potentially capturing the contribution of multiple regulatory variants.
Since EAGLE does not directly test individual candidate SNPs responsible for the association between environment and ASE, we applied a two-step procedure to find candidate variants driving GxE associations. In step one, EAGLE was used with a lenient FDR of 20% to give a shortlist of 57 GxE associations. In step two, we looked for candidate variants within 1Mb of the TSS, using meta-analysis to combine EAGLE with standard interaction testing (Online Methods). SNPs with too few double heterozygous individuals were not testable using EAGLE, in which case we used standard interaction testing alone. For 15 out of 57 associations we found a cis-SNP with a nominally significant interaction QTL after Bonferroni correction across tested SNPs (p<0.05; Supplementary Table S3). The proportion of initial EAGLE hits with a significant cis-SNP is reasonably robust to the choice of FDR threshold and cis-window size (Supplementary Figure S12). Those with no candidate variant hit may arise from variants outside of the 1MB window, rare variants, or non-genetic factors. For the association between smoked same day and IL10RA (Figure 2b) the top candidate variant ( ) is rs685419, which lies 4Mb from the TSS of IL10RA (interleukin 10 receptor-α) in a conserved CD14 primary cell enhancer (Figure 2c–e). Polymorphisms in IL10 itself have been associated with the rate of lung function decline in firefighters21. In addition, since many diseases result from the combined effects of genetics and environment we investigated whether any of our candidate GxE variants, or variants in linkage disequilibrium (LD), are known genetic risk factors for disease using the NHGRI-EBI GWAS (accessed 6/17/2015) and Immunobase (www.immunobase.org; accessed 6/21/2015) catalogs. We identified eight disease-associated variants (Supplementary Table S4). For example, we found that rs1538257, which is the top candidate variant to modulate BMI’s association with LGALS3 expression, is in LD (R2=0.55) with rs2274273, which is associated with LGALS3 protein levels ( ). Interestingly, in mice, LGALS3 has been shown to have a protective role in obesity induced inflammation and diabetes22.
We investigated the degree to which EAGLE analyses, conducted within a large cohort, recapitulate GxE interactions discovered in vitro. The interplay of immune stimulation, gene expression and genetics has been characterized in several recent in vitro studies8–10. We focused on Fairfax et al.8 due to its large sample size, genome wide transcriptomic profiling and choice of interferon-γ (IFN-γ) and LPS immune stimulation (likely to be relevant in a population sample). Direct measurements of infection are not available for DGN, so we used the expression levels of differentially expressed genes for each stimulus as environmental “proxies”. We used 25, 16, and 26 genes, for LPS at 2h, LPS at 24h and IFN-γ respectively, identified to have an absolute log-fold change greater than 4 in the Fairfax et al. data. We then applied EAGLE genome-wide to find association between ASE and gene expression levels for each proxy gene. We excluded tests for interactions between proxy genes and allelic balance of genes on the same chromosome since these associations could represent direct cis-regulation rather than interaction. At 10% FDR (accounting for testing multiple proxy genes per condition), we found 26, 6 and 14 GxE interactions across the proxy genes for LPS at 2h, LPS at 24h and IFN-γ respectively. Evaluating t-statistics for the lead eQTL (Supplementary Note 7, Supplementary Figure S13), 11/26, 3/6 and 6/14 interactions replicated (p <10−4) for the three stimuli respectively in Fairfax et al. (Figure 3a). We used random sets of non-differentially expressed proxy genes to generate an empirical null distribution, providing empirical p-values for the observed replication rates of 0.048, 0.06, and 0.029 respectively, or 0.0017 for the overall replication frequency.
Figure 3.
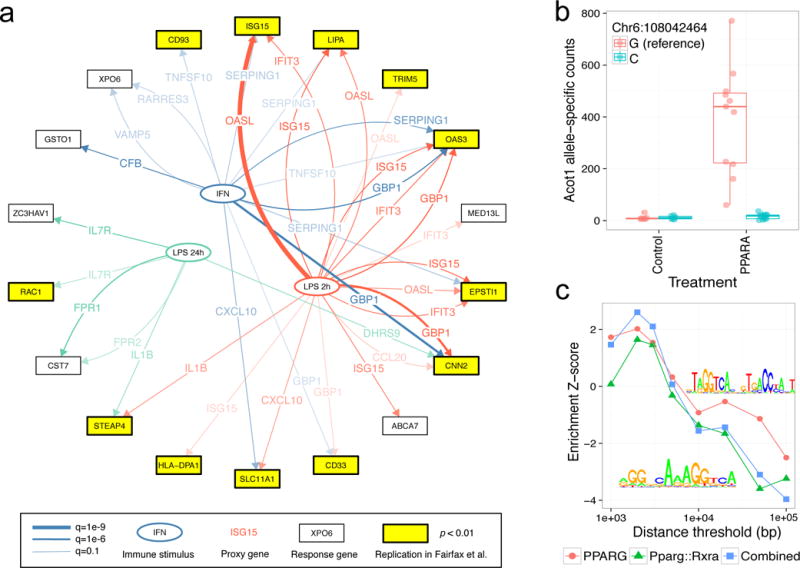
EAGLE detects allele-specific effects of environments measured by “proxy” genes and of direct perturbations. (a) EAGLE recapitulates GxE interactions discovered using immune stimulation of monocytes in vitro8. We used genes differentially expressed under immune stimulation in vitro as proxies for the environment (stimulus). The genes detected by EAGLE as being modulated by these environmental proxies replicate in the in vitro data: i.e. they have detectable response QTLs. Network depicts all EAGLE predictions for each stimulus, with replicating interactions highlighted in yellow; each edge is annotated with the tested proxy gene for reference. (b) EAGLE detects allele-specific responses to treatment of rat livers with various toxicants. The strongest association for agonists of the PPARα transcription factor is a known target, Acot1. While total Acot1 expression is up-regulated, we find that rats with the alternative C allele at exonic SNP Chr6:108042464 show no response. (c) Genes associated with PPARα by EAGLE show enrichment of relevant TF binding motifs within 5kb of the TSS.
While we developed EAGLE in the context of an observational population-scale RNA-seq cohort, it is equally applicable to direct perturbation experiments. We applied EAGLE to RNA-seq data from male Rattus norvegicus livers following exposure to seven different classes of small molecules23. Since genotypes were unavailable we called exonic SNPs from RNA-seq (Online Methods). Despite moderate sample sizes (30 controls and 8–18 treated samples), we detected 442 associations (10% FDR) across the seven classes (Supplementary Figure S14a). This power likely derives from controlled laboratory conditions, large effects of direct perturbations, and large haplotype blocks in the outbred rats used, where the exonic variant being tested will frequently co-segregate with the causal variant. EAGLE identified 117 associations (10% FDR) for agonists of PPARα, a well-characterized transcription factor. Examples include the known targets Ces1f (Supplementary Note 8) and Acot1. Acot1 is significantly upregulated by PPARα (Supplementary Figure S14b), but only for haplotypes with the reference allele at Chr6:108042464 (Figure 3b). PPARα associated genes showed enrichment of the binding motifs for both PPARα/γ and the heterodimer with RXR around their TSS (p<0.05, Figure 3c, Supplementary Note 9). Out of 85 known targets of PPARα24 testable by EAGLE, 37 (44%, compared to 10% for other genes, hypergeometric ) showed evidence of allele-specific response (10% FDR, Supplementary Figure S14c).
The associations detected by EAGLE indicate that common environmental risk factors, including substance use, exercise, and BMI interact with individual genetic variation in regulation of gene expression. EAGLE provided a substantial increase in power over standard methods, yet the overall number of associations remained modest, indicating that GxE effects on gene expression are not prevalent with large effect sizes compared with additive effects, or are obscured by confounders. Additionally, there are allele-specific, cis-regulatory mechanisms other than genetic effects that could potentially explain some of the discovered associations, for example epigenetic regulation of expression. As RNA-seq becomes increasingly prevalent in human cohort studies, EAGLE will be appropriate to obtain additional power to detect individual differences in response to diverse environmental conditions. More generally, EAGLE is a useful, extensible tool for understanding the combined effects of external stimuli, genetic variation, and cellular networks on regulation of gene expression.
Online Methods
Interaction QTL testing
Total expression for the DGN cohort was quantified as previously described4, including controlling for known and latent confounders using HCP25. We quantile normalize each gene to a standard normal distribution to remove outliers, and perform standard interaction testing to find GxE effects for the 8795 genes testable using ASE. For a specific combination of SNP, gene and environment consider the null model and alternative model ,
where is normalized total expression for individual i, is the genotype of the SNP encoded as , is the environmental factor, are genetic, environment and interaction effect sizes respectively and is an intercept. Under the null the likelihood ratio is -distributed with one degree of freedom, which allows us to obtain a well calibrated p-value. We test all SNPs within 200kb of the TSS (obtained from GENCODE, release 20). Since there is no appropriate permutation strategy for testing interaction terms18, we were constrained to using Bonferroni correction to obtain an approximate gene level p-value. The gene level p-values for a particular environment are then adjusted using the Benjamini-Hochberg procedure to control the FDR at a pre-specified level.
Replication cohort
The replication cohort included 723 native French-Canadians from the CARTaGENE cohort, consisting of 346 men and 377 women from Montreal (n=369), Quebec (n=221), and Saguenay (n=133). Whole-blood samples from these individuals were used to perform genotyping on Illumina’s Omni2.5M array and RNA sequencing using paired-end libraries on the Illumina HiSeq 2000 platform as previously described20. Heterozygous sites were filtered to include only exonic sites that have not been shown to exhibit mapping bias26. Read counts for both alleles were generated using a custom Perl script. Cis-eQTLs within 1Mb were called for 15,632 genes in a subset of the CARTaGENE cohort (n=689) using the R package MatrixEQTL. EAGLE was then run on this data as for the DGN cohort.
Allele specific expression quantification
Tophat227 (v2.1.0) with default settings was used to map reads to hg19 (for DGN) or rn5 (Ensembl RGSC3.4). Samtools28 mpileup (v1.3) was used to obtain reference and alternative allele counts at known common SNPs. For the rat data genotype data is not available, so we determine which individuals are heterozygous at each exonic SNP by requiring: a) two reads mapping to both the reference and alterative allele, b) that the alternate base observed in the RNA-seq reads matches the known allele.
EAGLE model
Existing approaches for calling allelic imbalance29,30, or leveraging allelic signal in molecular QTL mapping13,31, are unable to test for association between an environmental factor and allelic imbalance. We first present the EAGLE model itself and then motivate the various modeling choices. The null model is
and the alternative model is
where is the alternative read count for individual i at locus s, is the total read count, is the logistic function, denotes whether the top cis-eQTL is heterozygous, is an intercept term to take into account unexplained allelic imbalance unrelated to the environment (e.g. due to reference mapping bias13,30) and is a per individual per locus random effect modeling overdispersion. This model can be derived by assuming the log expression of each allele is linear in the environment and SNP genotype (Supplementary Note 1). The variance itself is given an inverse gamma prior . We learn the hyperparameters across all genes.
We expect that environmental effects on ASE are usually mediated by one or more causal cis-regulatory genetic variants, which would often be in linkage disequilibrium with the locus where ASE is measured. However, some responsive individuals may have different causal sites and therefore may exhibit opposite direction of allelic effect. EAGLE gains power by testing just a single association statistic per gene, rather than modeling each possible causal site and incurring a large multiple testing burden, but therefore cannot assume a consistent direction of allelic effect across the cohort. Additionally, linkage disequilibrium may be weak, especially for more distal elements. The EAGLE model is applicable in settings where causal sites vary between individual and also handles unphased data. We model the absolute deviation from allelic balance by considering rather than the minor allele count itself. This is analogous to using as a quantitative measure of allelic imbalance, but maintains the count nature of the data. We also experimented with introducing explicit auxiliary “flipping” variables to provide implicit phasing, but found this was susceptible to over-fitting.
Accounting for cis-regulation
Standard cis-eQTL analysis allowed us to identify proximal genetic variants associated to the expression of each gene. These variants often explain a significant proportion of observed ASE. To account for this, we add a dependence on , an indicator of whether the top cis-eQTL for the gene containing locus s is heterozygous in individual i. Additionally, in some cases one of the known cis-eQTLs could be the variant through which the environment influences the observed ASE, which we model by including an interaction term hiseis (Supplementary Note 10). We approximately integrate over the random effects and per locus variance using non-conjugate variational message passing32 while optimizing the coefficients and hyperparameters (Supplementary Note 11).
Parameter estimation and inference
Holding the overdispersion hyperparameters fixed we fit both the alternative and null models at each locus and use the variational lower bound as an approximation to the true marginal likelihood for each model, allowing us to calculate an approximate likelihood ratio. It is not obvious that the usual asymptotic theory should hold here since a) our data is not normally distributed, b) we only have an approximation of the true likelihood, and c) our model incorporates random effects terms. To investigate this we performed permutation experiments, using the conveniently valid strategy of separately permuting the individuals heterozygous or homozygous for the top cis-SNP18. These experiments show that our approximate likelihood ratios do in fact follow the asymptotic distribution quite closely, while being slightly conservative (Supplementary Figure S8). Therefore we choose to use the nominal likelihood ratio test p-values, avoiding having to run computationally expensive permutation analysis for every tested association.
Software
EAGLE was developed in C++ and R 3.1.2 using RcppEigen and is available as an R package at https://github.com/davidaknowles/eagle.
Supplementary Material
Acknowledgments
We would like to thank J. Leek for helpful comments and S. Kersten for providing the graphic from which the PPARα network figure was adapted. D.A.K. is supported by NIH U54CA149145. MJF is supported by a CIHR Neuroinflammation fellowship. P.A. is supported by the Ontario Ministry of Research and Innovation. A.B. and SBM are supported by NIH R01MH101814 and NIH R01HG008150. A.B. is supported by the Searle Scholars Program, NIH R01MH101820, NIH 1R01MH109905-01, and NIH 1R01GM120167-010. S.B.M. is supported by the Edward Mallinckrodt Jr. Foundation.
Footnotes
Accession Codes
Requests for replication cohort (CARTaGENE) data should be submitted to access@cartagene.qc.ca. For the rat toxicity study23: SRA: SRP039021; GEO: GSE55347.
Data Availability Statement
Genotype, raw RNA-seq, quantified expression, covariates and environmental data for the DGN cohort are available by application through the NIMH Center for Collaborative Genomic Studies on Mental Disorders. Instructions for requesting access to data can be found at https://www.nimhgenetics.org/access_data_biomaterial.php, and inquiries should reference the “Depression Genes and Networks study (D. Levinson, PI)”.
Author Contributions
D.A.K., S.B.M. and A.B. conceived the project and wrote the manuscript. D.A.K. and A.B. developed the method. D.A.K. implemented the software and performed the main analyses. J.R.D. and A.R. performed additional statistical analyses. X.Z., J.B.P., M.M.W., J.S., S.M. and D.F.L. gave input regarding the DGN cohort. Supervised by P.A. and M-J.F., H.E. ran EAGLE on the CARTaGENE replication cohort. S.B.M. and A.B. supervised the project.
Competing Financial Interests
The authors declare no competing financial interests.
References
- 1.Flint J, Mackay TFC. Genome Res. 2009;19:723–733. doi: 10.1101/gr.086660.108. [DOI] [PMC free article] [PubMed] [Google Scholar]
- 2.Eichler EE, et al. Nat Rev Genet. 2010;11:446–50. doi: 10.1038/nrg2809. [DOI] [PMC free article] [PubMed] [Google Scholar]
- 3.Battle A, et al. Genome Res. 2014;24:14–24. doi: 10.1101/gr.155192.113. [DOI] [PMC free article] [PubMed] [Google Scholar]
- 4.GTEx-Consortium. Science. 2015;348:648–660. doi: 10.1126/science.1262110. [DOI] [PMC free article] [PubMed] [Google Scholar]
- 5.Bray MS, et al. Am J Physiol Heart Circ Physiol. 2008;294:H1036–H1047. doi: 10.1152/ajpheart.01291.2007. [DOI] [PubMed] [Google Scholar]
- 6.Glass D, et al. Genome Biol. 2013;14:R75. doi: 10.1186/gb-2013-14-7-r75. [DOI] [PMC free article] [PubMed] [Google Scholar]
- 7.Fairfax BP, et al. Science. 2014;343:1118–1129. [Google Scholar]
- 8.Lee MN, et al. Science. 2014;343:1246980. doi: 10.1126/science.1246980. [DOI] [PMC free article] [PubMed] [Google Scholar]
- 9.Barreiro LB, et al. Proc Natl Acad Sci U S A. 2012;109:1204–9. doi: 10.1073/pnas.1115761109. [DOI] [PMC free article] [PubMed] [Google Scholar]
- 10.Brown AA, et al. Elife. 2014 [Google Scholar]
- 11.Buil A, et al. Nat Genet. 2014;47 [Google Scholar]
- 12.Geijn B, Van De Mcvicker G, Gilad Y, Pritchard JK. Nat Methods. 2015;12:1061–1063. doi: 10.1038/nmeth.3582. [DOI] [PMC free article] [PubMed] [Google Scholar]
- 13.Degner JF, et al. Bioinformatics. 2009;25:3207–3212. doi: 10.1093/bioinformatics/btp579. [DOI] [PMC free article] [PubMed] [Google Scholar]
- 14.Biondi O, et al. Am J Pathol. 2013;182:2298–2309. doi: 10.1016/j.ajpath.2013.02.045. [DOI] [PubMed] [Google Scholar]
- 15.Jacobo-Albavera L, et al. PLoS One. 2012;7:1–5. [Google Scholar]
- 16.Schadt EE, et al. Nat Genet. 2005;37:710–717. doi: 10.1038/ng1589. [DOI] [PMC free article] [PubMed] [Google Scholar]
- 17.Bůžková P, Lumley T, Rice K. Ann Hum Genet. 2011;75:36–45. doi: 10.1111/j.1469-1809.2010.00572.x. [DOI] [PMC free article] [PubMed] [Google Scholar]
- 18.Hussin JG, et al. Nat Genet. 2015;47:400–4. doi: 10.1038/ng.3216. [DOI] [PubMed] [Google Scholar]
- 19.Hodgkinson A, et al. Science. 2014;344:413–5. doi: 10.1126/science.1251110. [DOI] [PubMed] [Google Scholar]
- 20.Burgess JL, et al. J Occup Environ Med. 2004;46:1013–22. doi: 10.1097/01.jom.0000141668.70006.52. [DOI] [PubMed] [Google Scholar]
- 21.Pejnovic NN, et al. Diabetes. 2013;62:1932–44. doi: 10.2337/db12-0222. [DOI] [PMC free article] [PubMed] [Google Scholar]
- 22.Wang C, et al. Nat Biotechnol. 2014;32:926–32. doi: 10.1038/nbt.3001. [DOI] [PMC free article] [PubMed] [Google Scholar]
- 23.Kersten S. Mol Metab. 2014;3:354–71. doi: 10.1016/j.molmet.2014.02.002. [DOI] [PMC free article] [PubMed] [Google Scholar]
- 24.Mostafavi S, et al. PLoS One. 2013;8 doi: 10.1371/journal.pone.0068141. [DOI] [PMC free article] [PubMed] [Google Scholar]
- 25.Panousis NI, Gutierrez-Arcelus M, Dermitzakis ET, Lappalainen T. Genome Biol. 2014;15:467. doi: 10.1186/s13059-014-0467-2. [DOI] [PMC free article] [PubMed] [Google Scholar]
- 26.Kim D, et al. Genome Biol. 2013;14:R36. doi: 10.1186/gb-2013-14-4-r36. [DOI] [PMC free article] [PubMed] [Google Scholar]
- 27.Li H, et al. Bioinformatics. 2009;25:2078–9. doi: 10.1093/bioinformatics/btp352. [DOI] [PMC free article] [PubMed] [Google Scholar]
- 28.Harvey CT, et al. Bioinformatics. 2015;31:1235–1242. doi: 10.1093/bioinformatics/btu802. [DOI] [PMC free article] [PubMed] [Google Scholar]
- 29.Castel SE, Levy-Moonshine A, Mohammadi P, Banks E, Lappalainen T. Genome Biol. 2015;16:195. doi: 10.1186/s13059-015-0762-6. [DOI] [PMC free article] [PubMed] [Google Scholar]
- 30.Kumasaka N, Knights AJ, Gaffney DJ. Nat Genet. 2016;48:206–13. doi: 10.1038/ng.3467. [DOI] [PMC free article] [PubMed] [Google Scholar]
- 31.Knowles DA, Minka T. Adv Neural Inf Process Syst. 2011;24:1701–1709. [Google Scholar]
Associated Data
This section collects any data citations, data availability statements, or supplementary materials included in this article.