

Abstract
Rapidly progressive Alzheimer’s disease (rpAD) is a particularly aggressive form of Alzheimer’s disease, with a median survival time of 7–10 months after diagnosis. Why these patients have such a rapid progression of Alzheimer’s disease is currently unknown. To further understand pathological differences between rpAD and typical sporadic Alzheimer’s disease (sAD) we used localized proteomics to analyze the protein differences in amyloid plaques in rpAD and sAD. Label-free quantitative LC-MS/MS was performed on amyloid plaques microdissected from rpAD and sAD patients (n=22 for each patient group) and protein expression differences were quantified. On average, 913±30 (mean±SEM) proteins were quantified in plaques from each patient and 279 of these proteins were consistently found in plaques from every patient. We found significant differences in protein composition between rpAD and sAD plaques. We found that rpAD plaques contained significantly higher levels of neuronal proteins (p=0.0017) and significantly lower levels of astrocyte proteins (p=1.08x10⁻⁶). Unexpectedly, cumulative protein differences in rpAD plaques did not suggest accelerated typical sAD. Plaques from patients with rpAD were particularly abundant in synaptic proteins, especially those involved in synaptic vesicle release, highlighting the potential importance of synaptic dysfunction in the accelerated development of plaque pathology in rpAD. Combined, our data provides new direct evidence that amyloid plaques do not all have the same protein composition and that the proteomic differences in plaques could provide important insight into the factors that contribute to plaque development. The cumulative protein differences in rpAD plaques suggest rpAD may be a novel subtype of Alzheimer’s disease.
Introduction
The rate of progression of sporadic AD (sAD) varies widely between patients. Rapidly progressive AD (rpAD) occurs in a minor subset of patients; defined as having a disease survival of <3yrs (median survival time of 7–10 months) after diagnosis, that often leads to a clinical misdiagnosis of Creutzfeldt-Jakob disease (CJD), with AD only confirmed at autopsy[18, 68]. The accelerated progression of rpAD occurs in the absence of an autosomal dominant pattern of dementia or any pathogenic mutations in the APP, PSEN1, PSEN2 or PRNP genes. Research examining rpAD is limited; however the amyloid plaque and neurofibrillary tangle morphology and distribution, as well as CSF levels of total tau, phosphorylated tau, Aβ40 and Aβ42 are similar to sAD[18, 68]. Distinctions with sAD include a younger average age at onset, a low frequency of the APOE e4 allele, a higher proportion of patients having 14-3-3 in the CSF, and increased serum levels of specific pro-inflammatory cytokines (IL-6, IL-13, TNFα, G-CSF)[18, 68, 75]. Depending on how rpAD is defined, its frequency is estimated at ~10% of all AD cases[17]. At autopsy rpAD patients have similar neuropathology to sAD, although there is a higher prevalence of a low degree of pathology using standard NIA-Alzheimer’s Association guidelines[18, 51]. Additionally, it was recently shown that Aβ42 oligomers in rpAD have distinct properties, which promote the faster spread of Aβ42 pathology and may represent a separate “strain” of a prion-like Aβ conformation [17, 18].
Amyloid plaques primarily consist of Aβ, but they also contain a diverse range of amyloid binding proteins (e.g. apolipoprotein E [apoE], clusterin, ubiquitin, α-synuclein, etc.) and proteins found in astrocytes, microglia and dystrophic neurites that surround and infiltrate plaques. Amyloid binding proteins can significantly modulate the aggregation state of Aβ, and plaque-associated glia may have an important role in limiting or accelerating the pathological spread of amyloid[62]. For example apoE was first identified as an amyloid associated protein[84], prior to the discovery that inheritance apoE4 allele is the most significant genetic risk factor for sAD[62, 88]. ApoE modulates the aggregation and clearance of Aβ in an isoform specific manner[62, 88]. Hence, the relative amount of these non-amyloid plaque components could have an important mechanistic role in the development and spread of amyloid pathology in AD.
Traditionally, plaque associated proteins have been determined using targeted immunohistochemistry. However, the use of an alternative approach to identify plaque associated proteins, such as mass spectrometry, has many potential benefits over immunohistochemistry; proteomic studies are unbiased and therefore can identify novel proteins involved in AD pathogenesis and drug targets, protein abundance can be accurately quantified, it uses microscopic amounts of tissue, it is not limited by the availability and specificity of antibodies, and it allows the quantification of hundreds of proteins at once meaning that the involvement of pathways/families of proteins can examined at the same time. The vast majority of human tissue samples available for research are archived formalin-fixed and paraffin embedded (FFPE) tissue blocks collected at autopsy. Many previous studies have confirmed that mass spectrometry can be successfully performed using FFPE tissue and that similar proteomics data can be generated from FFPE and frozen tissue samples[10, 23, 27, 81, 93]. We recently developed a novel method combining laser capture microdissection and LC-MS/MS that allows localized proteomics using microscopic amounts of microdissected FFPE tissue[23]. Therefore, given that amyloid plaques rapidly develop and accumulate in rpAD, it was the aim of this study to use localized proteomics to compare the proteome of plaques in rpAD and typical, sporadic AD (sAD) with the goal of identifying proteins that are mechanistically involved in the rapid development and progression of amyloid pathology. We found that the protein composition of rpAD and sAD plaques was significantly different. rpAD plaques contain more neuronal proteins (particularly synaptic proteins and those involved in actin cytoskeleton signaling) and sAD plaques contain more astrocyte proteins. Our data provides further evidence that rpAD may be a separate subtype of AD.
Methods
Ethics statement
All procedures were performed under protocols approved by the Institutional Review Board at Case Western Reserve University and University Hospitals Case Medical Center in Cleveland, OH and New York University Alzheimer Disease Center, NY. In all cases, written informed consent for research was obtained from the patient or legal guardian, and the material used had appropriate ethical approval for use in this project. All patients’ data and samples were coded and handled according to NIH guidelines to protect patients’ identities.
Patients and clinical evaluations
The rpAD cohort was randomly selected from a group of 276 patients with a neuropathological diagnosis of AD who were referred to the National Prion Disease Pathology Surveillance Center with a clinical diagnosis of possible CJD[18]. The inclusion and exclusion criteria are detailed in Cohen et al.[18], with the neuropathological features of the rpAD cases having no significant differences with sAD. The rpAD cases had no evidence of increased α-synuclein or TDP43 pathology (compared to sAD) or any evidence of prion disease[18]. The sporadic AD cohort was randomly included from donated brain tissue collected at the Department of Pathology at Case Western Reserve University and at the New York University Alzheimer’s Disease Clinical Center (NYU ADC). Individual patient information (sex, age, disease duration, ABC neuropathological score [51], post-mortem interval time [PMI] and average size of microdissected plaques) is included in Table 1 (except for a few cases were PMI was not recorded). For the sAD cases, who were followed longitudinally at either the NYU ADC or at Case Western University, disease duration was defined as the time between a designation of a CDR diagnosis of 1 and/or a GDS of 4 [53, 64], until death. For the rpAD cases this interval was defined as the time between the patient initially presenting to medical attention with cognitive symptoms, and death. Most of the rpAD cases were not evaluated at specialist Dementia Centers, but were referred to the Prion Disease Surveillance Center at autopsy with a possible clinical diagnosis of CJD. 22 cases of rpAD and 22 cases of sAD were included in this study. As this is the first time that a quantitative proteomics study analyzing amyloid plaque protein composition has been reported, a sample size calculation could not be performed. This sample size was selected based on the degree of inter-patient variance observed in pilot studies.
Table 1.
Patient details
| Patient ID | Sex | Age | Disease duration (months) | ABC Score | PMI (hours) | Average plaque area (μm2) |
|---|---|---|---|---|---|---|
| rpAD1 | F | 59 | 12 | A3, B3, C3 | 47 | 3933 |
| rpAD2 | M | 77 | 7 | A3, B2, C3 | 44 | 4028 |
| rpAD3 | F | 71 | 15 | A3, B3, C2 | 55 | 2738 |
| rpAD4 | M | 83 | 2.3 | A1, B1, C0 | 175 | 2909 |
| rpAD5 | M | 75 | 24 | A3, B3, C2 | n/a | 2281 |
| rpAD6 | F | 67 | 8.5 | A3, B3, C3 | 8 | 4267 |
| rpAD7 | M | 74 | 7.7 | A3, B3, C3 | 17 | 2645 |
| rpAD8 | F | 54 | 12.1 | A1, B2, C0 | 22 | 5116 |
| rpAD9 | M | 84 | 10.8 | A3, B3, C3 | 26 | 3881 |
| rpAD10 | M | 63 | 12 | A1, B1, C0 | 84 | 5008 |
| rpAD11 | F | 87 | 5 | A2, B3, C2 | 17 | 3678 |
| rpAD12 | M | 49 | 4.6 | A3, B3, C3 | 63 | 3724 |
| rpAD13 | F | 83 | 9.1 | A2, B3, C2 | 20 | 2467 |
| rpAD14 | M | 71 | 10 | A2, B2, C1 | 28 | 2564 |
| rpAD15 | F | 83 | 1.2 | A2, B3, C2 | 31 | 1572 |
| rpAD16 | F | 72 | 2.1 | A3, B3, C3 | 31 | 1728 |
| rpAD17 | M | 64 | 1.9 | A2, B1, C0 | 48 | 2030 |
| rpAD18 | F | 56 | 24 | A3, B3, C3 | 35 | 2304 |
| rpAD19 | F | 65 | 6 | A3, B3, C2 | 34 | 3252 |
| rpAD20 | F | 66 | 12 | A3, B3, C2 | 40 | 2388 |
| rpAD21 | M | 67 | 7 | A3, B2, C1 | 56 | 3425 |
| rpAD22 | F | 71 | 7 | A3, B3, C2 | 66 | 2240 |
| sAD1 | M | 79 | 147 | A3, B3, C3 | 20 | 3355 |
| sAD2 | F | 73 | 125 | A3, B3, C3 | 17 | 3596 |
| sAD3 | F | 91 | 152 | A3, B3, C3 | 21 | 2883 |
| sAD4 | F | 90 | 180 | A3, B3, C3 | 22 | 2741 |
| sAD5 | F | 83 | 117 | A3, B3, C3 | 12 | 2838 |
| sAD6 | M | 69 | 102 | A3, B3, C3 | 36 | 2851 |
| sAD7 | M | 75 | 108 | A3, B3, C3 | 135 | 4175 |
| sAD8 | F | 71 | 108 | A3, B3, C3 | 10 | 3459 |
| sAD9 | M | 63 | 152 | A3, B3, C3 | 26 | 6489 |
| sAD10 | F | 89 | 108 | A3, B3, C3 | 62 | 2852 |
| sAD11 | M | 73 | 82 | A3, B3, C3 | 38 | 2536 |
| sAD12 | F | 67 | 96 | A3, B3, C3 | 67 | 3072 |
| sAD13 | F | 76 | 129 | A3, B3, C3 | 4 | 1760 |
| sAD14 | F | 84 | 96 | A3, B3, C2 | n/a | 2049 |
| sAD15 | M | 89 | 60 | A3, B3, C2 | n/a | 1607 |
| sAD16 | F | 83 | 96 | A2, B3, C2 | n/a | 2560 |
| sAD17 | M | 79 | 177 | A3, B3, C3 | 2.5 | 1888 |
| sAD18 | F | 100 | 108 | A3, B3, C3 | 30 | 2593 |
| sAD19 | F | 85 | 60 | A2, B2, C1 | n/a | 1906 |
| sAD20 | F | 85 | 191 | A3, B3, C3 | 28 | 2857 |
| sAD21 | F | 86 | 192 | A3, B3, C3 | 22 | 3549 |
| sAD22 | F | 73 | 108 | A3, B3, C3 | 8 | 3467 |
Laser Capture Microdissection
Formalin-fixed, paraffin embedded (FFPE) tissue blocks containing the hippocampus that were collected and processed as part of routine autopsy procedures were used in this study, which were matched in the rpAD and sAD cases. A subset of these tissue blocks were treated with 98% formic acid prior to paraffin embedding because of the presence of suspected prion disease. Formic acid treated tissue blocks were immersed in 98% formic acid for 1 hour at room temperature, rinsed 3 times with 10% formalin and allowed to post-fix with 10% formalin for an additional 48 hours prior to standard paraffin embedding. Immunostaining for amyloid plaques and laser capture microdissection (LCM) was performed using the method detailed in Drummond et al.[23]. Briefly, 8μm sections of FFPE tissue blocks were collected onto LCM-compatible slides and amyloid plaques were visualized using fluorescent immunohistochemistry using a combination of the pan-Aβ antibodies 4G8 (1:4000; BioLegend; Catalog #800709) and 6E10 (1:4000; BioLegend; Catalog #803001). LCM was performed using a LMD 6500 microscope (Leica). 2mm2 total area of fluorescently-labeled plaques was manually selected, microdissected using LCM and collected into double distilled water. Samples were stored at −80°C until sample processing for LC-MS.
Effect of formic acid treatment on LC-MS/MS
An initial study examining the effect of formic acid treatment of tissue blocks on downstream proteomics was completed. For this study 3 cases of sAD were included. At autopsy two consecutive hippocampal tissue blocks were collected; one was treated with formic acid prior to paraffin embedding using the method described above and the other was paraffin embedded only. 2mm2 of plaques were microdissected from all 6 samples using the method described above.
LC-MS/MS
Samples were processed for label-free quantitative LC-MS/MS analysis using the formic acid extraction protocol detailed in Drummond et al.[23]. Briefly, plaques were deparaffinized by heating at 95°C for one hour followed by 65°C for 2 hours and incubated in 70% LC-MS grade formic acid overnight at room temperature. Samples were sonicated three times for three minutes with a few seconds of votexing in between. Samples were dried using a SpeedVac concentrator, resuspended in 100mM ammonium bicarbonate and then reduced with Dithiothreitol (20mM) and alkylated with iodoacetamide (50mM). Protein samples were digested with 200ng of sequencing grade modified trypsin (Promega) overnight at room temperature with gentle agitation. Samples were acidified with 0.2% TFA and peptides were desalted using Poros beads. Briefly, a slurry of R2 20μm Poros beads (Life Technologies Corporation) was added to each sample. Samples were incubated with agitation at 4°C for 4 hours. The beads were loaded onto equilibrated C18 ziptips (Millipore) using a microcentrifuge for 30sec at 6000RPM. Poros beads were rinsed three times with 0.1% TFA followed by microcentrifugation. Extracted poros beads were further washed with 0.5% acetic acid. Peptides were eluted off the beads by addition of 40% acetonitrile in 0.5% acetic acid followed by the addition of 80% acetonitrile in 0.5% acetic acid. The organic solvent was removed using a SpeedVac concentrator and the samples were reconstituted in 0.5% acetic acid.
An aliquot of each sample was loaded onto the EASY spray 50cm C18 analytical column with <2μm bead size using the auto sampler of an EASY-nLC 1000 HPLC (ThermoFisher) in solvent A (2% acetonitrile, 0.5% acetic acid). The peptides were gradient eluted directly into a Q Exactive (Thermo Scientific) mass spectrometer using a two hour gradient from 2% to 30% solvent B (90% acetonitrile, 0.5% acetic acid), followed by 10 minutes from 30% to 40% solvent B and 10 minutes from 40% to 100% solvent B. The Q Exactive mass spectrometer acquired high resolution full MS spectra with a resolution of 70,000, AGC target of 1e6, with a maximum ion time of 120 ms, and scan range of 400 to 1500 m/z. Following each full MS twenty data-dependent high resolution HCD MS/MS spectra were acquired using the resolution of 17,500, AGC target of 5e4, maximum ion time of 120 ms, one microscan, 2 m/z isolation window, fixed first mass of 150 m/z, Normalized Collision Energy (NCE) of 27 and dynamic exclusion of 30 seconds.
Samples were processed and analyzed using LC-MS in three different batches. Batch #1 consisted of n=3 sAD cases that were used for the formic acid block treatment test. Batch #2 consisted of n=10 rpAD and n=8 sAD cases. Batch #3 consisted of n=12 rpAD cases and n=11 sAD cases.
Proteomics Computational Analysis
Protein quantitation was performed using MaxQuant software suite (Version 1.5.2.8)[19]. The MS/MS spectra were searched against the Uniprot Human reference proteome database (downloaded 2-25-16) using Andromeda within MaxQuant including Carbamidomethylation of Cysteine as a fixed modification and oxidation of methionine, acetylation of protein NTerm, formylation of lysine, phosphorylation of serine, threonine and tyrosine, deamidation of glutamine and asparagine as variable modifications. Both unique and razor peptides were considered for quantitation. Unique peptides are present only in a single protein and razor peptides are unique to a given protein group. The mass tolerance was set to 10ppm and 20ppm for MS1 and MS/MS searches respectively. False discovery rate (FDR) filtration was done first on peptide level and then on protein level. Both filtrations were done at 1% FDR using a standard target-decoy database approach. The MaxQuant grouped two homologous proteins or isoforms with different Uniprot identifiers, when they could not be distinguished based on the identified peptides. The identification of a protein group doesn’t imply that all proteins in the group are present, rather that at least one protein in the group is present[70].
Proteomics Data Analysis
The bioinformatics analysis was performed using open source software Perseus (Version 1.5.2.6). All the proteins identified with less than two unique+razor peptides were excluded from analysis. The results were further filtered to remove common contaminant proteins and reverse identifications. The intensity values were log2 transformed and missing values were imputed based on normal distribution. A two-sided Welch’s t-test and Benjamini-Hochberg FDR was performed. All expression levels, ratios and p-values were reported, but only protein groups having an estimated FDR less than the cut-off level of 5% were considered significantly up- or down-regulated in rpAD vs sAD. Principal Component Analysis (PCA) was applied to the entire expression matrix using the R statistical computing system.
Ingenuity Pathway Analysis (IPA)
Pathway analysis was completed using IPA (Qiagen). FDR adjusted Welch’s t-test p-values (q-values) and rpAD/sAD protein expression ratios for differently expressed proteins were uploaded into IPA. Significantly altered proteins were mapped to canonical pathways and disease/functional networks, which were determined to be statistically enriched using a right-tailed Fisher’s Exact Test in comparison to the background dataset of all proteins identified in plaques, with the threshold for significance set to p<0.05. IPA was also used to identify upstream regulator proteins, which were determined based on prior knowledge of expected effects between regulator and target proteins/genes stored in the Ingenuity Knowledge Base. This analysis determined whether known target proteins in the uploaded list of significantly altered proteins in rpAD plaques were enriched for a particular upstream regulator (statistically determined using Fisher’s Exact Test and threshold for significance set to p<0.01) and compared the direction of change of expression of each of the these target proteins to determine an activation z-score, which was a measure of probability of activation or inactivation of a particular upstream regulator (with threshold for activation set to z-score>2 and inactivation set to z-score<−2)[41].
STRING protein interaction analysis
Genes (that encoded for proteins identified in the proteomic analysis) were uploaded into the online STRING database (Version 10.0), which identifies protein-protein interactions and functional enrichment in comparison to the whole human genome in the following categories; biological process, molecular function, cellular component, KEGG pathways, PFAM protein domains and INTERPRO protein domains and features[79]. Two lists of genes were analyzed using STRING; genes encoding for all proteins present in plaques (found in Supplementary Table 1) and genes encoding for all proteins with significantly altered expression in rpAD plaques (found in Supplementary Table 3).
Proteomic comparison with Alzheimer’s disease database
A compilation of proteins with published association with AD was generated. This database combined the results from studies that identified proteins in neurofibrillary tangles[50, 66, 82], proteins enriched in plaques[32, 43], proteins that had significantly altered expression in various regions and/or fractions of AD brains in comparison to control brains and proteins that contained the keyword “Alzheimer” in the Uniprot human database[1, 2, 4, 11, 13, 14, 22, 31–33, 36, 37, 45, 54, 55, 77, 78, 89, 90, 96]. Protein groups identified in rpAD and sAD plaques were screened against this database to determine how many of the proteins identified in this study have been previously associated with AD pathology. Protein groups were annotated as up- or down-regulated in AD if they were previously reported as up- or down-regulated at least once and where no inconsistent reports were found. The proportion of up- and down-regulated proteins was compared in proteins that were found to be significantly increased or decreased in rpAD plaques using proteomics analysis. The resulting contingency table (Figure 3f) was analyzed using Fisher’s exact test.
Figure 3. Cell-type specific protein expression differences in rpAD plaques.

Each graph plots all proteins identified in plaques. The further the point is away from the dashed line at 0, the greater the difference in expression in rpAD and sAD plaques. Proteins with a positive log ratio have greater expression in rpAD plaques and proteins with a negative log ratio have a greater expression in sAD plaques. All proteins highlighted in red correspond to neuronal proteins (a), astrocyte proteins (b), microglial proteins (c), oligodendrocyte proteins (d) and endothelial cell proteins (e). The cumulative cell-type specific protein differences showed that there were significantly more neuronal proteins in rpAD plaques (p=0.0017) and significantly less astrocyte proteins in in rpAD plaques (p=1.08x10⁻⁶), and no differences in the amount of microglial, oligodendrocyte or endothelial cell proteins between rpAD and sAD plaques. Significance was determined using a two-tailed Fisher’s exact test comparing cumulative cell-type specific protein expression between rpAD (n=22) and sAD (n=22). (f) Shows a contingency table after comparison with the AD database. Proteins in the AD database were annotated as either up- or down-regulated in AD according to previous proteomics studies. Table shows grouping of plaque proteins identified in this study separated into the categories of inconsistent/novel association with AD, typically down-regulated in AD and typically up-regulated in AD. Fisher’s exact test showed that protein groups with significantly higher expression in sAD plaques were predominantly found in previous studies to be up-regulated in AD, whereas proteins that had higher expression in rpAD plaques were found to have lower expression in AD (p=2.67x10⁻¹¹).
Cell-type specificity
Genes (that encoded for the proteins identified using proteomics) were assigned cell-type specificity based on data published in Zhang et al.[94]. For each gene an average expression level was calculated per one of five possible cell types: neurons, astrocytes, microglia, oligodendrocytes or endothelial cells, where only expression in mature, non-diseased human cell types was considered. Only gene expression data from anti-GalC hybridoma supernatant harvested oligodendrocytes was used to determine oligodendrocyte specificity for our study, as this resulted in the purification of more mature oligodendrocytes in comparison to the oligodendrocyte precursor cells purified using anti-O4 hybridoma supernatant. Each gene’s mean expression level per cell type was row-normalized – if more than 66% of the normalized expression was attributable to any single cell-types, the gene was considered specific to that cell type. A two-tailed Fisher’s exact test was used to find significant associations between the resulting gene lists and a dichotomization of the protein-groups based on the sign of their log2-ratios (i.e. based on whether their rpAD/sAD ratios were positive or negative). Two cell-types were significantly associated with the up/down-regulated dichotomy even after Bonferroni correction.
Fluorescent immunohistochemistry
8μm thick FFPE tissue sections consecutive from those used for LCM were stained using fluorescent immunohistochemistry. Immunostaining was performed on one section containing the hippocampus and adjacent cortex per case for each staining combination. Sections were deparaffinized and rehydrated through a series of xylene and ethanol washes. Antigen retrieval was performed by treatment with 88% formic acid for 7min, followed by boiling in citrate buffer (10mM sodium citrate, 0.05% Tween-20; pH6). Sections were blocked with 10% normal goat serum, incubated overnight at 4°C with a combination of anti-Aβ antibodies 4G8 (1:4000; BioLegend; Catalog #800709) and 6E10 (1:4000; BioLegend; Catalog #803001), and with either anti-GFAP (1:1000; Dako; Z0334) to label astrocytes, anti-SMI312 (1:500; BioLegend; Catalog # 837901) to label dystrophic neurites or anti-Secernin-1 (1:50; LSBio; Catalog # LS-C162903). All primary antibodies were diluted in 4% normal goat serum in PBS. Sections were then incubated for 2 hours at room temperature with appropriate fluorescent secondary antibodies (all diluted 1:500, from Jackson ImmunoResearch). Sections were counter stained with Hoechst 33342 (Sigma) and coverslipped (PermaFluor, Thermo Fisher Scientific).
Quantification of amyloid plaque burden, and plaque-associated dystrophic neurites and astrocytes
Fluorescent imaging of the whole section was performed at 20x magnification using a NanoZoomer HT2 (Hamamatsu) whole slide scanner using the same settings for all slides. Four images containing the cortex were collected at 4x magnification per case for quantification. Quantification was performed using ImageJ. Amyloid burden was determined by thresholding the Aβ image to identify all pixels with positive Aβ labelling and the percentage Aβ burden in the cortex was calculated as the percentage of Aβ positive pixels in the total cortex area. Quantification of plaque-associated astrocytes and dystrophic neurites was performed by thresholding the Aβ cortex images to identify pixels with positive Aβ labelling followed by the “Analyze Particles” command to remove clusters of thresholded pixels with a combined area of less than 100 pixels to ensure that only plaque associated Aβ staining remained. As we were interested to see the amount of plaque associated dystrophic neurites and astrocytes, we then applied the “Enlarge” function to expand the area associated with each plaque to contain the Aβ-positive plaque core and the surrounding 50μm of plaque-associated tissue, consistent with published methodology[72]. A mask of the area selected in this plaque image was then applied to the corresponding GFAP or SMI312 stained image and the percentage burden (% of pixels with positive staining for GFAP or SMI312) and the average GFAP or SMI312 staining intensity was quantified in the plaque-associated area. Statistical comparison of burden and intensity between rpAD and sAD was performed using an unpaired t-test.
Representative images for figures were collected using a Zeiss LSM700 Confocal Microscope. Individual images were collected every 1μm through the width of the 8μm sections at 20x magnification and presented images show the maximum projection image. All images of a particular stain were collected using the same confocal settings.
Results
Amyloid plaque proteome
The amyloid plaque proteome was compared in 22 cases of rpAD and 22 cases of sAD that were matched for sex and tissue archival time (Table 2). The cohort of rpAD patients was randomly selected from the larger cohort reported in Cohen et al. [18]. Consistent with this previous study, the cohort of rpAD patients used in the current study had a >10 fold shorter disease duration (9.2±1.3 months) than patients with typical sAD (122±8.0 months), and rpAD patients were younger than sAD patients (Table 2). The distribution and morphology of amyloid plaques was similar between these rpAD and sAD cases[18]. Diffuse and neuritic plaques were present in both subtypes. Therefore, as both plaque subtypes proliferate rapidly in rpAD and this was the first time that such a large scale proteomic study has been done examining the amyloid plaque proteome, we microdissected and pooled both diffuse and neuritic plaques observed in the hippocampus and adjacent entorhinal cortex in each case. On average, each sample consisted of approximately 740 plaques and there was no difference in the number or size of plaques collected between rpAD and sAD cases (Table 2). On average, 913±30 (mean±SEM) proteins were quantified in plaques from each case and the number of proteins quantified in rpAD and sAD plaques were similar. As expected, there was some inter-patient variation in the specific proteins present in plaques (particularly in proteins with low abundance), resulting in quantification of 1934 proteins across all cases (Supplementary Table 1). Of these proteins, 279 were consistently detected in plaques from every case, regardless of whether rpAD or sAD (Table 3; Supplementary Table 2). These consistently detected, abundant plaque proteins included proteins previously confirmed to be present in amyloid plaques such as Aβ, apoE, ubiquitin, tau, GFAP and clusterin, therefore validating mass spectrometry proteomics as an alternative approach to immunohistochemistry for determining the composition of amyloid plaques. In sum, 86% (240/279 proteins) of the consistently detected, abundant plaque proteins had been associated with AD in previous proteomic studies (Supplementary Table 2). Our use of an unbiased mass spectrometry approach not only allowed sensitive and accurate identification of amyloid plaque proteins, but also permitted the detection of many novel proteins present in amyloid plaques. The most important example being the numerous novel plaque proteins that were consistently detected in all cases examined (Supplementary Table 2), suggesting that these proteins may have an important mechanistic role in plaque development. One example of a novel plaque protein identified using LC-MS was secernin-1. Secernin-1 was selected for further validation because of its consistently high expression in plaques in every patient, and the availability of a commercial antibody generated using an immunogen that directly corresponded with a peptide identified using LC-MS. Fluorescent immunohistochemistry was used to validate secrenin-1 expression in plaques in sAD and rpAD in comparison to basal expression in age-matched control tissue. A similarly high expression of secernin-1 was observed in plaques in rpAD and sAD, consistent with what would be expected based on LC-MS results. Particularly strong immunolabelling for secernin-1 appeared to be in plaque-associated dystrophic neurites, in addition to some weaker diffuse staining throughout plaques (Figure 1). Weak cytoplasmic staining appeared to be present in neurons in age-matched control tissue (95 years, Braak stage I/VI; Figure 1f).
Table 2.
General patient and microdissected plaque characteristics
| rpAD | sAD | |
|---|---|---|
| Number of cases | 22 (12 Female / 10 Male) | 22 (15 Female / 7 Male) |
| Average age (±SEM) | 70.0 (±2.2) years | 80.1 (±1.9) years** |
| Disease duration (±SEM) | 9.2 (±1.3) months | 122 (±8.0) months*** |
| Post mortem interval | 45.1 (±7.7) hours | 31.1 (±7.4) hours |
| Predominant plaque type microdissected | 6 neuritic / 5 diffuse / 11 mixed | 3 neuritic / 5 diffuse / 14 mixed |
| Number of plaques microdissected (±SEM) | 733 (±52) | 751 (±49) |
| Average size of plaques microdissected (±SEM) | 3099 (±213) μm2 | 2958 (±220) μm2 |
| Average number of proteins identified using LC-MS (±SEM) | 941 (±37) | 884 (±47) |
Data presented as mean ±SEM;
p<0.01;
p<0.001
Table 3.
Top 50 most abundant proteins in amyloid plaques
| Majority protein name | Majority Gene Name | Altered in rpAD? | Associated with AD in previous proteomic studies? | IHC confirmation in plaques? |
|---|---|---|---|---|
| Actin, cytoplasmic 1 | ACTB | ↑ T P | ||
| Glial fibrillary acidic protein | GFAP | ↓ | ↑ ↓ T P | Yes - humans[72] |
| Tubulin alpha-1B chain | TUBA1B | T | Yes – mice[67] | |
| Tubulin beta-4B chain | TUBB4B | ↑ ↓ | ||
| Dihydropyrimidinase-related protein 2 | DPYSL2 | ↑ ↓ | Yes – humans (using alternative name CRMP2)[80] | |
| ATP synthase subunit alpha, mitochondrial | ATP5A1 | ↑ | ↑ ↓ | Yes - humans[71] |
| Pyruvate kinase | PKM | ↑ ↓ | ||
| Spectrin alpha chain, non-erythrocytic 1 | SPTAN1 | ↑ P | Yes – humans and mice[34] | |
| Creatine kinase B-type | CKB | ↑ ↓ P | ||
| Glyceraldehyde-3-phosphate dehydrogenase | GAPDH | ↑ ↓ | ||
| Tubulin beta-2A chain | TUBB2A | P | ||
| Spectrin beta chain, non-erythrocytic 1 | SPTBN1 | ↑ ↓ P | Yes - humans[74] | |
| Syntaxin-binding protein 1 | STXBP1 | ↑ | ↑ ↓ | |
| Guanine nucleotide-binding protein G(o) subunit alpha | GNAO1 | ↓ | ||
| Heat shock cognate 71 kDa protein | HSPA8 | ↑ | ||
| Hemoglobin subunit alpha | HBA1 | ↑ ↓ | ||
| Fructose-bisphosphate aldolase A | ALDOA | ↑ ↓ | ||
| Amyloid beta A4 protein | APP | ↓ | ↑ P | Yes – humans [30] |
| Hemoglobin subunit beta | HBB | Yes – mice[15] | ||
| ATP synthase subunit beta, mitochondrial | ATP5B | ↑ | ↓ P | |
| Sodium/potassium-transporting ATPase subunit alpha-2 | ATP1A2 | ↓ | ||
| Alpha-enolase | ENO1 | ↓ | ↑ ↓ T P | |
| Neurofilament light polypeptide | NEFL | ↑ ↓ | ||
| Synapsin-1 | SYN1 | ↓ | Yes - mice[32] | |
| Plectin | PLEC | ↓ | ↑ | |
| Clathrin heavy chain 1 | CLTC | ↑ | P | |
| 14-3-3 protein epsilon | YWHAE | ↑ ↓ T P | ||
| Hexokinase-1 | HK1 | ↑ | ↓ P | |
| Fructose-bisphosphate aldolase C | ALDOC | ↑ P | ||
| Calcium/calmodulin-dependent protein kinase type II subunit alpha | CAMK2A | ↑ ↓ P | Yes - humans[83] | |
| Gamma-enolase | ENO2 | ↑ ↓ | Yes – humans and mice[95] | |
| Dynamin-1 | DNM1 | ↑ | ↑ ↓ T P | |
| Sodium/potassium-transporting ATPase subunit alpha-3 | ATP1A3 | ↓ | Yes - in neurites; mice[20] | |
| Calmodulin | CALM2;CALM1;CALM3 | ↑ ↓ | ||
| Peroxiredoxin -1 | PRDX1 | ↓ | ↑ | |
| 2,3-cyclic-nucleotide 3-phosphodiesterase | CNP | ↑ | ||
| Apolipoprotein E | APOE | ↑ | Yes - humans[84] | |
| Synaptosomal-associated protein 25 | SNAP25 | ↑ | ↑ ↓ P | Yes– humans and mice[32] |
| Alpha-internexin | INA | ↑ P | Yes – in neurites; humans[21] | |
| Neurofilament medium polypeptide | NEFM | ↑ ↓ T | Yes – in neurites; humans[21] | |
| Heat shock protein HSP 90-beta | HSP90AB1 | ↑ P | Yes - humans[38] | |
| Brain acid soluble protein 1 | BASP1 | ↓ | ||
| Glutamate dehydrogenase 1, mitochondrial | GLUD1 | ↑ ↓ | ||
| Vimentin | VIM | ↓ | ↑ ↓ T P | Yes - in surrounding astrocytes; humans[86] |
| V-type proton ATPase catalytic subunit A | ATP6V1A | ↑ | ↓ | |
| Malate dehydrogenase | MDH2 | ↑ ↓ T | ||
| Myelin basic protein | MBP | ↑ ↓ | Yes - humans[91] | |
| Tenascin-R | TNR | ↓ P | Yes – humans[52] | |
| Ubiquitin | UBB | ↑ | Yes - in neurites; humans[59] | |
| Tubulin beta-4A chain | TUBB4A | ↓ |
↑: proteins that had higher expression in AD vs control tissue in previous proteomic studies; ↓: proteins that had lower expression in AD vs control tissue in previous studies; T: proteins enriched in neurofibrillary tangles; P: proteins enriched in plaques.
Figure 1. Secernin-1 staining in plaques.
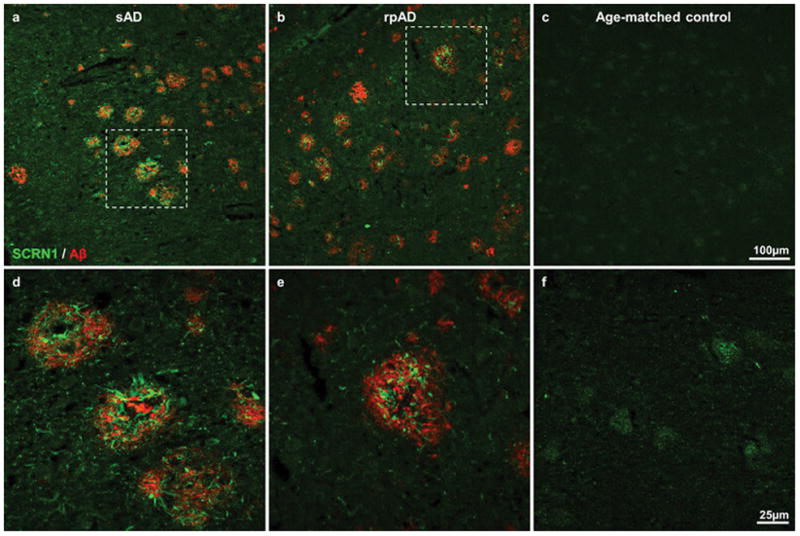
Double fluorescent immunohistochemistry confirmed the presence of secernin-1 (green) in plaques (visualized using immunohistochemistry for Aβ; red). Representative images show secernin-1 staining in the entorhinal cortex in sAD (a), rpAD (b) and age-matched control (c) subjects at low magnification. Higher magnification images of the boxed regions are shown in d–f, which highlight the abundance of secernin-1 in plaques.
Significantly different proteome of rpAD plaques
The main goal of this study was to determine whether the plaque proteome was significantly different in rpAD and sAD. Principal component analysis (PC2) showed an almost complete separation of sAD and rpAD cases, providing convincing evidence that rpAD plaques contained a significantly different protein composition than sAD plaques (Figure 2a; p=2.08x10⁻⁸). Separation of cases by PC1 was due to differences between batches of samples. While it is regrettable that there were apparent technical differences in either sample preparation or LC-MS analysis between batches of samples, this result actually increases our confidence in the proteomic differences between rpAD and sAD plaques, which were robust enough to overcome these batch differences. Quantification of individual proteins showed that 141 proteins had significantly different expression in rpAD and sAD plaques (Figure 2b; Supplementary Table 3); 85 had significantly higher expression in rpAD plaques (Table 4) and 56 had significantly lower expression in rpAD plaques (Table 5). Many of the proteins with significantly altered expression have been previously associated with the development and maintenance of amyloid plaques. For example, there were significantly lower levels of Aβ (p<0.001), gelsolin (p<0.01) and GFAP (p<0.0001) in rpAD plaques and significantly more α-synuclein (p<0.01), indicating that these proteins have a particularly important role in the rapid development of amyloid plaques that occurs in rpAD (Figure 2c). This role appeared to be unique to these specific proteins as levels of other important plaque associated proteins (such as tau, ubiquitin and apoE) were similar in rpAD and sAD plaques (Supplementary Table 1). The unbiased mass spectrometry approach used in this study also highlighted the important role in plaque development for many novel proteins that have not been previously associated with amyloidosis or AD. Most interesting was the dramatic increase in expression of POTEE/ACTBM in rpAD plaques (Figure 2c; 11.47 fold difference; p=1.73x10⁻⁸). We were not able to distinguish whether the increased protein was POTEE or ACTBM (which is encoded by the gene POTEKP, a pseudogene of the POTE family) based on the identified peptides. The C-terminus sequence of POTEE is homologous to the different actin isoforms (ACTA, ACTB, ACTBM, ACTC, ACTS etc.). In our results POTEE and ACTBM are grouped separately from other actin isoforms due to identification of the peptide “VAPEEHPILLTEAPLNPK” which is shared between POTEE and ACTBM but no other actin isoforms (Supplementary Figure 1). Importantly, this peptide is approximately 10 fold higher in rpAD than sAD plaques, thereby showing that POTEE or ACTBM is increased in rpAD rather than other actin isoforms. Neither POTEE nor ACTBM have been previously associated with AD, so the large increase in the expression of this protein in rpAD plaques is suggestive of a novel pathological pathway involved in the rapid progression of plaque pathology in rpAD.
Figure 2. Differences in the rpAD and sAD plaque proteome.
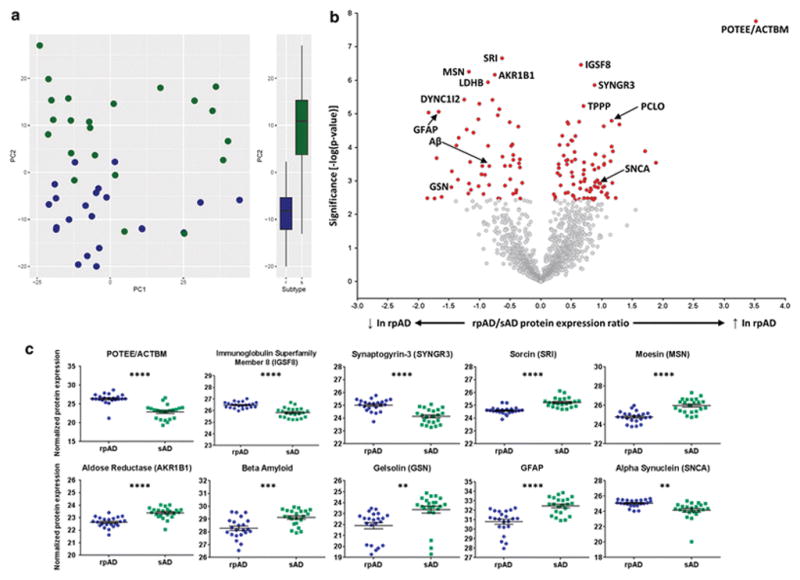
(a) Principal component analysis showed a near complete separation of rpAD (blue) and sAD (green) plaque proteins, showing that rpAD plaques contained significantly different protein expression (p=2.08x10⁻⁸) (b) Volcano plot showing protein expression differences of all proteins identified in plaques. All proteins highlighted in red had significantly altered expression in rpAD plaques. Significance was determined using a two-sided Welch’s t-test and Benjamini-Hochberg False Discovery Rate (FDR) set to 5% (exact p-values for each protein group are provided in Supplementary Table 1 and 3). Proteins with higher expression in rpAD plaques fall to the right of the plot and proteins with lower expression fall to the left of the plot. Proteins of interest are identified with gene names; the 5 proteins with the most significant increases and decreases in rpAD plaques are highlighted, as are proteins of particular interest in AD pathophysiology. (c) Proteins of interest with significantly altered levels in rpAD plaques. Individual points show protein expression in each individual case. Significance was determined using an unpaired t-test with Welch’s correction. Data shows mean ± SEM; **** p<0.0001; *** p<0.001; ** p<0.01. All analyses were generated comparing 22 cases of rpAD and sAD.
Table 4.
Top 50 proteins that had significantly increased expression in rpAD plaques
| Protein name | Gene Name | p-value | Fold change (rpAD:sAD) | Associated with AD in previous proteomic studies? | IHC confirmation in plaques |
|---|---|---|---|---|---|
| POTE ankyrin domain family member E | POTEE | 1.73E-08 | 11.47 | ↓ | |
| Immunoglobulin superfamily member 8 | IGSF8 | 3.44E-07 | 1.58 | ↓ P | |
| Synaptogyrin-3 | SYNGR3 | 1.39E-06 | 1.84 | ↓ | |
| Tubulin polymerization-promoting protein | TPPP | 5.84E-06 | 1.62 | ↑ ↓ P | Yes - humans[39] |
| Protein piccolo | PCLO | 1.6E-05 | 2.23 | ↑ | |
| Syntaxin-binding protein 1 | STXBP1 | 1.72E-05 | 1.55 | ↑↓ | |
| GTPase KRas | KRAS | 1.77E-05 | 1.35 | ||
| V-type proton ATPase 116 kDa subunit a isoform 1 | ATP6V0A1 | 1.98E-05 | 1.37 | ↓ P | |
| Cytochrome c oxidase subunit 7A2, mitochondrial | COX7A2 | 2.06E-05 | 2.44 | ||
| Guanine nucleotide-binding protein G(z) subunit alpha | GNAZ | 2.33E-05 | 2.04 | ↓ | |
| Prohibitin | PHB | 4.5E-05 | 1.28 | ↓ | |
| Cytochrome c oxidase subunit 2 | MT-CO2 | 4.58E-05 | 1.48 | ||
| NADH dehydrogenase [ubiquinone] iron-sulfur protein 3, mitochondrial | NDUFS3 | 6.15E-05 | 1.41 | ↓ | |
| Clathrin coat assembly protein AP180 | SNAP91 | 6.33E-05 | 1.43 | ↑ ↓ | |
| Dynamin-1 | DNM1 | 8.34E-05 | 1.36 | ↑ ↓ T P | |
| Hexokinase-1 | HK1 | 8.42E-05 | 1.24 | ↓ P | |
| Zinc transporter 3 | SLC30A3 | 9.39E-05 | 2.23 | ↓ | Yes - humans[92] |
| Protein MAL2 | MAL2 | 0.000129 | 3.27 | ↓ | |
| 60S ribosomal protein L22 | RPL22 | 0.000131 | 2.27 | ||
| Plasma membrane calcium-transporting ATPase 2 | ATP2B2 | 0.000136 | 1.47 | ↓ P | |
| Thiosulfate sulfurtransferase/rhodanese-like domain-containing protein 1 | TSTD1 | 0.000159 | 1.86 | ||
| Solute carrier family 2, facilitated glucose transporter member 14 | SLC2A14 | 0.00016 | 1.86 | ||
| Creatine kinase U-type, mitochondrial | CKMT1A | 0.000174 | 1.30 | ↓ | |
| Transcriptional activator protein Pur-alpha | PURA | 0.000185 | 2.05 | ||
| Synaptosomal-associated protein 25 | SNAP25 | 0.000228 | 1.48 | ↑ ↓ P | Yes – humans and mice[32] |
| Tubulin alpha-4A chain | TUBA4A | 0.000235 | 1.35 | P | Yes – mice[67] |
| Dihydrolipoyllysine-residue succinyltransferase component of 2-oxoglutarate dehydrogenase complex, mitochondrial | DLST | 0.000246 | 1.33 | ↓ | |
| 60S ribosomal protein L10a | RPL10A | 0.000257 | 2.21 | ↑ | |
| ATP synthase subunit beta, mitochondrial;ATP synthase subunit beta | ATP5B | 0.000261 | 1.42 | ↓ P | |
| AP-3 complex subunit beta-2 | AP3B2 | 0.000279 | 1.63 | ||
| Actin, alpha cardiac muscle 1 | ACTC1 | 0.000287 | 3.69 | T | |
| Rho guanine nucleotide exchange factor 2 | ARHGEF2 | 0.000308 | 2.05 | ||
| ATP synthase subunit alpha, mitochondrial | ATP5A1 | 0.000316 | 1.22 | ↑ ↓ | Yes – humans[71] and mice[85] |
| Septin-5 | SEPT5 | 0.000318 | 1.35 | ↓ | |
| 40S ribosomal protein S26 | RPS26 | 0.000326 | 1.80 | ||
| Leucine-rich repeat and immunoglobulin-like domain-containing nogo receptor-interacting protein 1 | LINGO1 | 0.000331 | 2.05 | ||
| NADH dehydrogenase [ubiquinone] 1 beta subcomplex subunit 4 | NDUFB4 | 0.000405 | 1.93 | ||
| Paralemmin-1 | PALM | 0.000411 | 1.23 | ||
| Voltage-dependent calcium channel subunit alpha-2/delta-1 | CACNA2D1 | 0.000456 | 1.84 | ↓ | |
| ATP-dependent RNA helicase A | DHX9 | 0.000471 | 1.63 | ||
| DnaJ homolog subfamily B member 2 | DNAJB2 | 0.000551 | 1.42 | ||
| V-type proton ATPase subunit B, brain isoform | ATP6V1B2 | 0.000579 | 1.21 | ↓ P | Yes - mice[32] |
| Visinin-like protein 1 | VSNL1 | 0.000634 | 1.62 | ↓ | Yes – humans[69] |
| NADH-ubiquinone oxidoreductase 75 kDa subunit, mitochondrial | NDUFS1 | 0.000678 | 1.24 | ↓ | |
| Transgelin-3 | TAGLN3 | 0.000737 | 1.43 | ↓ | |
| Stathmin | STMN1 | 0.000866 | 1.65 | ↑ | |
| 60S ribosomal protein L27 | RPL27 | 0.000951 | 1.90 | ||
| V-type proton ATPase subunit F | ATP6V1F | 0.001023 | 1.64 | ↑ | |
| Transmembrane protein 65 | TMEM65 | 0.001065 | 1.57 | ||
| Protein kinase C beta type | PRKCB | 0.00109 | 1.85 | ↓ | Yes - humans[46] |
↑: proteins that had higher expression in AD vs control tissue in previous proteomic studies; ↓: proteins that had lower expression in AD vs control tissue in previous proteomic studies; T: proteins enriched in neurofibrillary tangles; P: proteins enriched in plaques. P-values were generated using an unpaired t-test with Welch’s correction comparing protein expression in rpAD (n=22) and sAD (n=22) plaques (more detailed statistical information is provided in Supplementary Table 3).
Table 5.
Top 50 proteins that had significantly decreased expression in rpAD plaques
| Protein name | Gene Name | p-value | Fold change (sAD: rpAD) | Associated with AD in previous proteomic studies? | IHC confirmation in plaques? |
|---|---|---|---|---|---|
| Sorcin | SRI | 2.19E-07 | 1.55 | ||
| Moesin | MSN | 5.52E-07 | 2.26 | ↑ | |
| Aldose reductase | AKR1B1 | 6.82E-07 | 1.69 | ||
| L-lactate dehydrogenase B chain | LDHB | 1.13E-06 | 1.82 | ↑ ↓ | |
| Cytoplasmic dynein 1 intermediate chain 2 | DYNC1I2 | 3.74E-06 | 2.38 | Yes – in dystrophic neurites; mice[67] | |
| Phosphoserine aminotransferase | PSAT1 | 3.83E-06 | 1.73 | ↑ | |
| Vimentin | VIM | 5E-06 | 2.01 | ↑ ↓ T P | Yes – in surrounding astrocytes; humans[86] |
| Plectin | PLEC | 7.26E-06 | 1.60 | ↑ | |
| Glial fibrillary acidic protein | GFAP | 8.63E-06 | 3.18 | ↑ ↓ T P | Yes - humans[72] |
| Tenascin | TNC | 9.09E-06 | 3.57 | ↑ | Yes - humans[49] |
| Alpha-aminoadipic semialdehyde dehydrogenase | ALDH7A1 | 1.09E-05 | 1.63 | ↑ | |
| Hepatocyte cell adhesion molecule | HEPACAM | 1.44E-05 | 2.03 | ↑ | |
| Peroxiredoxin-1 | PRDX1 | 1.77E-05 | 1.42 | ↑ | |
| Alpha-adducin | ADD1 | 2.4E-05 | 1.29 | ↑ ↓ | |
| Lambda-crystallin homolog | CRYL1 | 2.93E-05 | 2.32 | ||
| Band 4.1-like protein 2 | EPB41L2 | 3.63E-05 | 2.15 | ↑ | |
| Complement C4-A | C4A | 5.17E-05 | 2.54 | ↑ | Yes - humans[76] |
| Transketolase | TKT | 8.12E-05 | 1.38 | ↑ P | |
| Superoxide dismutase [Mn], mitochondrial | SOD2 | 8.77E-05 | 2.60 | ↑ | Yes – mice[9] |
| Ezrin | EZR | 8.97E-05 | 1.82 | ↑ | |
| Adenylate kinase isoenzyme 1 | AK1 | 9.01E-05 | 1.40 | ↑ ↓ | |
| Alpha-enolase | ENO1 | 0.000168 | 1.37 | ↑ ↓ T P | |
| Cathepsin D | CTSD | 0.000188 | 1.54 | ↑ P | Yes - mice[67] |
| Radixin | RDX | 0.000207 | 3.26 | ||
| WD repeat-containing protein 1 | WDR1 | 0.000224 | 1.27 | ||
| Dihydropyrimidinase-related protein 3 | DPYSL3 | 0.000234 | 1.37 | ↑ | |
| Macrophage-capping protein | CAPG | 0.00027 | 2.23 | ||
| Cytosolic non-specific dipeptidase | CNDP2 | 0.000298 | 1.28 | ↑ | |
| Methylmalonate-semialdehyde dehydrogenase [acylating], mitochondrial | ALDH6A1 | 0.000351 | 1.41 | ↑ ↓ | |
| Versican core protein | VCAN | 0.000355 | 1.50 | ↑ ↓ | Yes - humans[7] |
| Actin-related protein 2/3 complex subunit 1A | ARPC1A | 0.000356 | 1.94 | ↓ | |
| Amyloid beta A4 protein | APP | 0.00036 | 1.79 | ↑ P | Yes – humans[30] |
| Aldehyde dehydrogenase, mitochondrial | ALDH2 | 0.000393 | 1.27 | ↑ | Yes - humans[61] |
| Acyl-CoA-binding protein | DBI | 0.000514 | 2.74 | ||
| Palmitoyl-protein thioesterase 1 | PPT1 | 0.000634 | 1.96 | ||
| Cytosol aminopeptidase | LAP3 | 0.000656 | 1.88 | ||
| Amine oxidase [flavin-containing] B | MAOB | 0.000885 | 1.41 | ↑ | Yes – in surrounding astrocytes; humans[56] |
| Filamin-A | FLNA | 0.000913 | 2.56 | ↑ | |
| Ras-related protein Rab-7a | RAB7A | 0.001141 | 1.23 | ||
| Serum amyloid P-component | APCS | 0.00119 | 2.26 | ↑ | Yes - humans[24] |
| Methyltransferase-like protein 7A | METTL7A | 0.001312 | 1.80 | ↑ | |
| Trifunctional enzyme subunit alpha, mitochondrial | HADHA | 0.001377 | 1.50 | ↑ | |
| Pyridoxine-5-phosphate oxidase | PNPO | 0.001427 | 2.02 | ↓ | |
| Gelsolin | GSN | 0.001526 | 2.76 | ↑ ↓ | |
| Ig gamma-2 chain C region | IGHG2 | 0.001838 | 2.21 | ||
| F-box only protein 2 | FBXO2 | 0.001864 | 1.32 | ||
| Phosphatidylethanolamine-binding protein 1 | PEBP1 | 0.002239 | 1.32 | ↑ | Yes – in surrounding astrocytes; mice and humans[29] |
| Phospholysine phosphohistidine inorganic pyrophosphate phosphatase | LHPP | 0.002357 | 2.27 | ↑ | |
| Peroxiredoxin-6 | PRDX6 | 0.002408 | 1.37 | ↑ | Yes in surrounding astrocytes; humans[63] |
| Membrane protein MLC1 | MLC1 | 0.002442 | 1.91 | ↑ |
↑: proteins that had higher expression in AD vs control tissue in previous proteomic studies; ↓: proteins that had lower expression in AD vs control tissue in previous proteomic studies; T: proteins enriched in neurofibrillary tangles; P: proteins enriched in plaques. P-values were generated using an unpaired t-test with Welch’s correction comparing protein expression in rpAD (n=22) and sAD (n=22) plaques (more detailed statistical information is provided in Supplementary Table 3).
An unavoidable variable encountered in this study was that rpAD brain tissue was treated with formic acid during autopsy tissue collection because clinical symptoms in these patients resulted in a clinical diagnosis of possible CJD, and therefore tissue blocks were treated with formic acid prior to paraffin embedding according to prion tissue protocol. As this was not standard protocol for sAD tissue, additional experiments were necessary to determine if formic acid treatment of brain tissue prior to LCM was compatible with LC-MS and to ensure that formic acid treatment did not significantly alter downstream protein detection. To do this, two consecutive blocks of hippocampal tissue were collected from three sAD cases; one treated with formic acid prior to paraffin embedding and one that was not. Quantitative LC-MS showed that formic acid treatment of tissue blocks did not significantly alter the type or abundance of proteins detected in plaques (Supplementary Table 4), ensuring that any protein differences observed between rpAD and sAD plaques were not a result of formic acid treatment of tissue blocks.
Cell type specific protein changes in rpAD plaques
We were interested to determine whether protein differences in rpAD plaques were predominantly associated with a specific cell type. Therefore, we compared our proteomic data with the RNA sequencing dataset recently published by Zhang et al.[94], who examined RNA expression in neurons, astrocytes, microglia, oligodendrocytes and endothelial cells isolated directly from healthy adult human temporal cortex collected during surgery, therefore allowing identification of genes that are specific to each particular cell type. We found that rpAD plaques contained significantly higher levels of neuronal proteins (p=0.0017) and significantly lower levels of astrocyte proteins (p=1.08x10⁻⁶). The number of microglial, oligodendrocyte and endothelial cell-type specific proteins were low in plaques and there was no significant difference in the amount of these proteins between rpAD and sAD plaques (Figure 3). Fluorescent immunohistochemistry was performed to determine if the increased amount of neuronal proteins and the decreased amount of astrocyte proteins in rpAD plaques were due to increased numbers of plaque-associated dystrophic neurites and decreased numbers of plaque-associated astrocytes respectively. Indeed, plaque-associated astrocytosis was found to be significantly lower in rpAD than sAD (Figure 4a, b, g), confirming our proteomic results and suggesting that the cumulative decrease in astrocyte proteins in rpAD plaques was a result of decreased number of plaque associated astrocytes. In contrast, the number of plaque associated dystrophic neurites was similar in rpAD and sAD (Figure 4d, e, h), suggesting that the increased presence of neuronal proteins in rpAD plaques was not due to an increased amount of dystrophic neurites within plaques.
Figure 4. Altered levels of plaque-associated astrocytes, but not plaque-associated dystrophic neurites in rpAD.
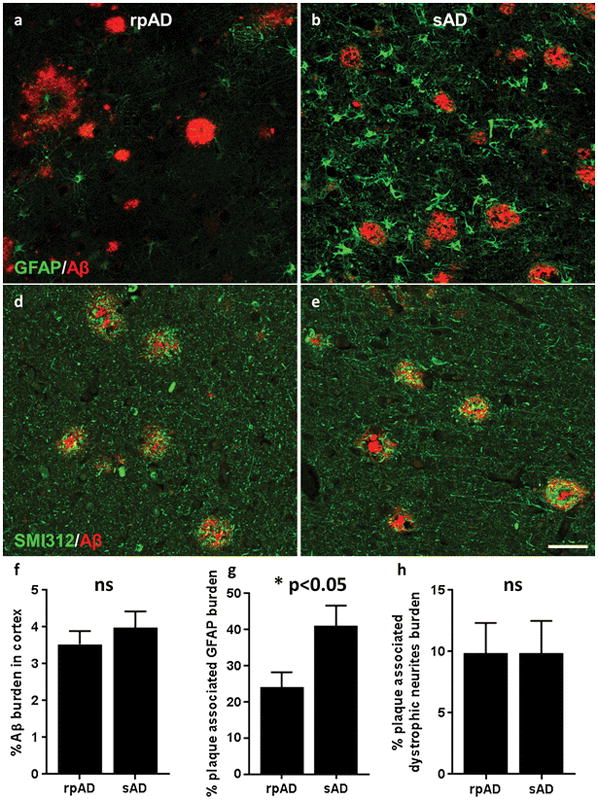
The number of plaque-associated astrocytes and dystrophic neurites was identified using immunohistochemistry. Quantification of the plaque-associated GFAP burden showed that there was significantly less plaque-associated astrocytosis in rpAD (a, b, g; p=0.0199), while the number of plaque associated dystrophic neurites was similar in rpAD and sAD (d, e, h). (f) The Aβ burden in the cortex was also quantified and showed no significant differences between rpAD and sAD. Significance was determined using an unpaired t-test comparing the burden of Aβ, plaque-associated astrocytes and plaque-associated dystrophic neurites in rpAD (n=18) and sAD (n=14); * p<0.05; data show mean ± SEM. Scale = 50μm
Network and pathway analyses of protein differences in rpAD plaques
The large number of protein differences between rpAD and sAD plaques suggested that networks of proteins, rather than individual proteins, were mechanistically involved in the rapid development of rpAD plaques. First, the significantly altered proteins in rpAD plaques were compared to our database of AD associated proteins identified in previous proteomic studies[1, 2, 4, 11, 13, 14, 22, 31–33, 36, 37, 43, 45, 50, 54, 55, 66, 77, 78, 82, 89, 90, 96]. In this database we annotated proteins as up-regulated in AD, down-regulated in AD and proteins that are enriched in plaques or tangles (Supplementary Table 1). We then used this database to apply these annotations to the proteomic data generated in this study (column ALZdirection in Supplementary Tables 1 and 3). Interestingly, we found a significant association between expression change in the literature and expression change across rpAD and sAD (p=2.67x10⁻¹¹, Figure 3f). Specifically, it was found that protein groups with significantly higher expression in sAD plaques were predominantly found in previous studies to be up-regulated in AD, whereas proteins that had higher expression in rpAD plaques were found to have lower expression in AD. Ingenuity Pathway Analysis (IPA) also supported these results. As expected, the cumulative significant protein differences in rpAD plaques were most significantly associated with biological pathways affiliated with Neurological Disease (86/141 proteins involved; 76 individual pathways; p= 3.70x10⁻⁶ – 4.70x10⁻²). Specifically, cumulative protein changes in rpAD plaques were most indicative of increased degeneration of the forebrain (p=3.0x10⁻⁶), dystrophy of neurites (p=2.90x10⁻⁵) and engulfment of cells (p=2.71x10⁻⁵). The cumulative directional changes of significantly altered proteins were also indicative of significantly increased amyloidosis (activation z-score = 2.279). All of these findings are consistent with the rapid pathological changes known to occur in rpAD. Based on published data IPA is also able to determine the likelihood of whether certain upstream regulators are activated or inhibited. Contrary to traditional pathological mechanisms that occur in typical sAD, the cumulative protein directional changes (i.e. increased or decreased expression) in rpAD plaques were significantly indicative of inhibition of APP/Aβ (37/141 significantly altered proteins regulated by APP; p=1.07x10⁻⁵; activation z-score = −2.933). Together, these results suggest that different pathological mechanisms beyond those mediated by APP/Aβ likely underlie the rapid spread of plaque pathology in rpAD. Other upstream regulators that were predicted to be inhibited in rpAD included the tumor suppressor protein p53 (regulates 27/141 of significantly altered proteins; activation z-score −3.434), mTORC2 component rictor (regulated 15/141 of significantly altered proteins; activation z-score −2.840) and inflammatory cytokine IL-1β (regulated 15/141 of significantly altered proteins; activation z-score −2.207).
IPA of altered proteins in rpAD plaques showed that a number of distinct pathways were associated with the rapidity of the disease course. Pathways mediating actin cytoskeleton signaling (p=1.39x10⁻³), signaling by Rho family GTPases (p=4.81x10⁻³), virus entry via endocytic pathways (p=6.14x10⁻³) and phagosome maturation (p=6.69x10⁻³) were significantly enriched in proteins with significantly altered expression in rpAD plaques, suggesting that these pathways may have a mechanistic role in rpAD pathology. Interestingly, tau was identified as the most significant upstream regulator of significantly altered proteins in rpAD plaques (27/141 proteins regulated by tau upstream; p=3.99x10⁻⁶), suggesting that there may be an important role of tau in the accelerated plaque pathology in rpAD. It was also evident that proteins with significantly altered expression in rpAD plaques were more strongly associated with other neurological disorders ahead of AD; for example Huntington’s disease (31/141 proteins involved; p=6.19x10⁻⁵), Schizophrenia (22/141 proteins involved; p=6.60x10⁻⁵) and disorders of the basal ganglia (39/141 proteins involved; p=7.89x10⁻⁵) in comparison to Alzheimer’s disease (20/141 proteins involved; p=0.0273). Finally, analysis using multiple pathway analysis tools suggested that all proteins present in plaques and those proteins with significantly altered expression in rpAD plaques were most highly enriched in vesicle proteins (STRING version 10.0; GO cellular component enrichment; All plaque proteins – 1021/1911 proteins [p<1.0x10−281]; significantly altered plaque proteins - 94/141 proteins [p=1.96x10−38]). IPA also supported and extended this finding, showing that the cumulative directional changes in protein expression in rpAD was most significantly associated with increased neurotransmission (activation z-score= 3.079). Together, these findings suggest that synaptic vesicle release may have a very important role in plaque formation and that this process is increased in rpAD.
Discussion
We have performed the most comprehensive analysis of amyloid plaque associated proteins to date, identifying numerous novel amyloid associated proteins that were present in all rpAD and sAD cases examined. We verified the presence of one of these novel amyloid associated proteins, secernin-1 (chosen based on availability of an appropriate commercial antibody), using standard immunohistochemical methods (Figure 1). Secernin-1 has previously been reported to be up-regulated in an animal model of retinitis pigmentosa[26], but has no prior reported association with AD. We have confirmed that amyloid plaques consistently contain hundreds of proteins and that this protein expression can potentially provide important insight into the dysfunctional mechanistic pathways that underlie AD. Importantly, we have shown for the first time that not all amyloid plaques contain the same proteins, suggesting that there may be different subtypes of plaques, which in turn could help to clarify the heterogeneity in AD pathogenesis between patients. We demonstrated that plaques from patients with rpAD contained significantly different protein expression than plaques from patients with sAD, suggesting that rpAD is a distinct subset of sAD. This is consistent with genetic data showing that rpAD has a low apoE4 allele frequency (compared to sAD), which is the most important genetic risk factor for sAD, as well as biochemical data indicating that Aβ42 oligomers in rpAD are distinct[17, 18, 68]. The protein differences in rpAD plaques we document suggest that there could be different pathological mechanisms mediating the rapid spread of pathology in rpAD in comparison to sAD, despite the similar morphology and distribution of amyloid plaques and neurofibrillary tangles in rpAD and sAD at autopsy[18, 68]. We also verified that there were no significant differences in the amyloid burden in the rpAD and sAD cases in the hippocampal tissue block used for this proteomic study. If rpAD represents merely one side of a normal distributed duration of AD illness, then one might expect predominantly quantitative differences of a similar set of proteins in rpAD and sAD, in contrast to our finding of numerous distinct proteins in rpAD plaques. The principal component analysis showed an almost complete separation of sAD and rpAD cases with network and pathway analyses also showing significant differences, consistent with the hypothesis that rpAD is a distinct subset of AD.
rpAD plaques contained significantly more neuronal proteins than sAD plaques. A large proportion of proteins with higher expression in rpAD plaques were synaptic proteins (66% of proteins with increased expression in rpAD plaques), particularly key presynaptic proteins such as SNAP25, syntaxin binding protein 1 (munc-18), syntaxin 1A and piccolo. Many of the synaptic proteins with increased expression in rpAD plaques have an important functional role in neurotransmitter release and vesicle proteins were particularly enriched, hence providing new evidence to support previous studies that have proposed that synaptic processes have an important role in plaque development and selective vulnerability in AD[28, 73]. Immunohistochemistry results showed that the increased presence of synaptic proteins was not simply a result of increased numbers of plaque associated neurites in rpAD. Previous immunohistochemistry studies have confirmed that many synaptic proteins can be found dispersed throughout plaques[32, 65], therefore, this may be the case in rpAD plaques also. Aβ oligomers are known to accumulate in synapses, particularly in synapses near plaques[60]. Aβ oligomers are also known to be toxic to synapses[25], and the presence of synaptic Aβ oligomers correlates with cognitive impairment in early AD[8]. Based on these previous findings we propose that Aβ42 oligomers may accumulate in synapses, binding to key synaptic proteins, and causing synaptic dysfunction, cognitive impairment and plaque formation. Given the increased amount of higher order Aβ42 oligomers in rpAD[18], it is plausible to suggest that this process occurs to a greater extent in rpAD. This hypothesis is supported by a recent study that showed that Aβ oligomers bind to syntaxin 1A, which is an example key presynaptic protein that is up-regulated in rpAD plaques, and this binding prevents synaptic vesicle release and leads to synaptic impairment[87].
Another important finding from this study is that there are significantly fewer plaque associated astrocytes in rpAD, which was confirmed using both immunohistochemistry and proteomics. Previous studies suggest that plaque associated astrocytes are neuroprotective in AD; they are involved in clearance of oligomeric and fibrillar Aβ[58], and decreased numbers correlate with greater cognitive impairment[47] and accelerated plaque formation in transgenic mice[40]. The decreased amount of plaque associated astrocytes in rpAD suggests that the typical Aβ-induced astrocyte activation response was impaired in rpAD. This could potentially result from either dysfunctional astrocytes or from astrocytes not reacting to the different conformation of Aβ present in rpAD. Regardless of the underlying cause, the decreased plaque-associated astrogliosis could contribute to the rapid spread of plaque pathology in rpAD.
The expression of POTEE/ACTBM in rpAD plaques was dramatically increased. Neither POTEE nor ACTBM have been previously associated with AD pathogenesis. Even the cellular localization and regional distribution of POTEE or ACTBM in the brain is currently unknown due to the lack of available appropriate antibodies. The genes for both POTEE and ACTBM are located in close proximity at 2q21.1. POTEE belongs to the POTE family of genes, which are primate specific and contain Ankyrin repeats and coiled coil domains. These structural features have been suggested to mediate oligomerization of proteins and protein-protein interactions[3]. Several POTE family members (including POTEE) contain a beta actin domain at the C-terminus[42], which is the region with high homology with ACTBM. Functionally, POTEE is known to be a tumor-associated antigen; tissue protein expression is low in normal circumstances, but expression is dramatically increased in a variety of human cancers including prostate, breast, lung, colon, ovarian and pancreatic cancers[5, 6, 16] and increased expression of a similar POTE family member (POTEF) promotes apoptosis[44]. The functional role of POTEE in the brain is currently unknown. Less is known about ACTBM (also known as kappa actin). Kappa actins are also associated with cancer; expression is increased hepatocellular carcinoma[12]. ACTBM has been mapped to the subcellular locations of cytoskeleton, cytosol, extracellular space, vesicles and exosomes (IPA). However, the functional role of ACTBM in the brain is currently unknown. Interestingly, pathway analysis also suggested that other proteins involved in actin cytoskeleton signaling were particularly abundant in rpAD plaques in comparison to sAD plaques. This finding could be linked to the increased amount of synaptic proteins in rpAD plaques as actin filaments are particularly concentrated in synapses, dendritic spines and growth cones[35, 48]. The cumulative protein differences in rpAD plaques indicated that there was an increase in proteins responsible for actin polymerization. Mechanistically an increase in actin polymerization could contribute to enhanced plaque formation as polymerized actin is capable of cross-seeding Aβ, promoting enhanced Aβ aggregation[57].
In conclusion, the differences in the rpAD plaque proteome provide new direct evidence that amyloid plaques do not all have the same protein composition. Whether this alternative pathogenesis is triggered by the higher levels of Aβ42 with distinct prion-like strain properties has to be addressed in future bioassay experiments[17, 18]. Our results suggest that proteomic differences in plaques could provide important insight into the factors that contribute to plaque development, which can be pursued in future targeted studies. It will be particularly interesting for future studies to determine the mechanistic role of presynaptic dysfunction and the role of POTEE/ACTBM in the development of plaques, as these could represent novel future drug targets specifically targeted to stop the rapid formation of amyloid plaques in AD. The cumulative protein differences in rpAD plaques potentially suggest that rpAD is a separate subtype of AD. We also identified numerous novel amyloid associated proteins (such as secernin-1) that could open up new therapeutic directions for AD.
Supplementary Material
Sequence alignment of detected peptides mapped to POTEE and ACTBM. Sequence alignment was performed using Clustal Omega. Detected peptides are highlighted in yellow. Amino acid differences between POTEE and ACTBM are shown in red. The table lists identified peptides mapped to POTEE, whether each peptide is also found in ACTBM or any other actin isoforms and their corresponding average LFQ intensity values in rpAD and sAD plaques.
The first tab shows imputed data. All results discussed in this paper were generated using this dataset. Relative protein abundance was quantified using MaxQuant. Data shows Log2 transformed LFQ intensities with missing values imputed from normal distribution. This also contains comparison with the in-house developed Alzheimer’s protein database. ALZproteins column identifies the number of proteins in the protein group that are also present in the Alzheimer’s protein database. ALZscore lists the total number of previous studies that a protein group was significantly associated with Alzheimer’s disease in the Alzheimer’s disease database (i.e. the higher the number, the more associated with Alzheimer’s disease the protein group). ALZdetails shows the breakdown of how a protein group has been previously associated with Alzheimer’s disease; U – up-regulated in previous Alzheimer’s disease studies; D – down-regulated in previous Alzheimer’s disease studies; N – enriched in neurofibrillary tangles; P – enriched in plaques). ALZdirection gives the overall annotation for the whole protein group as either up (U) or down-regulated (D) in Alzheimer’s disease. The second tab details the same dataset, but time including raw, unimputed data.
The list of all quantified proteins was filtered to include only proteins that had measurable expression in all plaques before imputation. Proteins are sorted by average expression in rpAD plaques. Proteins with novel involvement in AD have an “ALZproteins” score of 0.
The list of all proteins with significantly altered expression in rpAD plaques, sorted by –Log Welch’s t-test p-value rpAD_sAD. Proteins with a positive Welch’s t-test difference have significantly higher expression in rpAD plaques. This also contains comparison with the in-house developed Alzheimer’s protein database (see Supplementary Table 1 figure legend for details).
Data shows Log2 transformed LFQ intensities with missing values imputed from normal distribution.
Acknowledgments
The authors are grateful to the patient’s families, the CJD Foundation, and all the members of the National Prion Disease Pathology Surveillance Center for their help. This study was supported by the following grants: NS074317, U51 CK000309, AG08051, AG20245, NS073502, the Spitz Family Foundation Grant and a Seix Dow Foundation Grant.
Footnotes
Author Contributions
ED and TW conceived and supervised the project. ED, SN, AF, GP and RH performed the experiments. BU supervised the proteomics experiments. MA, SN and BU performed the proteomics data analysis, TW, JS, MC, TH and CK performed neuropathology, characterized and classified all cases, and sampled the brain tissue. ED, SN, MA, XH, YS, BU and TW analyzed the data. ED and TW wrote the paper with input from all authors.
References
- 1.Andreev VP, Petyuk VA, Brewer HM, Karpievitch YV, Xie F, Clarke J, Camp D, Smith RD, Lieberman AP, Albin RL, et al. Label-free quantitative LC-MS proteomics of Alzheimer’s disease and normally aged human brains. J Proteome Res. 2012;11:3053–3067. doi: 10.1021/pr3001546. [DOI] [PMC free article] [PubMed] [Google Scholar]
- 2.Bai B, Hales CM, Chen PC, Gozal Y, Dammer EB, Fritz JJ, Wang X, Xia Q, Duong DM, Street C, et al. U1 small nuclear ribonucleoprotein complex and RNA splicing alterations in Alzheimer’s disease. Proc Natl Acad Sci U S A. 2013;110:16562–16567. doi: 10.1073/pnas.1310249110. [DOI] [PMC free article] [PubMed] [Google Scholar]
- 3.Beck K, Brodsky B. Supercoiled protein motifs: the collagen triple-helix and the alpha-helical coiled coil. J Struct Biol. 1998;122:17–29. doi: 10.1006/jsbi.1998.3965. [DOI] [PubMed] [Google Scholar]
- 4.Begcevic I, Kosanam H, Martinez-Morillo E, Dimitromanolakis A, Diamandis P, Kuzmanov U, Hazrati LN, Diamandis EP. Semiquantitative proteomic analysis of human hippocampal tissues from Alzheimer’s disease and age-matched control brains. Clin Proteomics. 2013;10:5. doi: 10.1186/1559-0275-10-5. [DOI] [PMC free article] [PubMed] [Google Scholar]
- 5.Bera TK, Huynh N, Maeda H, Sathyanarayana BK, Lee B, Pastan I. Five POTE paralogs and their splice variants are expressed in human prostate and encode proteins of different lengths. Gene. 2004;337:45–53. doi: 10.1016/j.gene.2004.05.009. [DOI] [PubMed] [Google Scholar]
- 6.Bera TK, Zimonjic DB, Popescu NC, Sathyanarayana BK, Kumar V, Lee B, Pastan I. POTE, a highly homologous gene family located on numerous chromosomes and expressed in prostate, ovary, testis, placenta, and prostate cancer. Proc Natl Acad Sci U S A. 2002;99:16975–16980. doi: 10.1073/pnas.262655399. [DOI] [PMC free article] [PubMed] [Google Scholar]
- 7.Bignami A, LeBlanc A, Perides G. A role for extracellular matrix degradation and matrix metalloproteinases in senile dementia? Acta Neuropathol. 1994;87:308–312. doi: 10.1007/BF00296747. [DOI] [PubMed] [Google Scholar]
- 8.Bilousova T, Miller CA, Poon WW, Vinters HV, Corrada M, Kawas C, Hayden EY, Teplow DB, Glabe C, Albay R, 3rd, et al. Synaptic Amyloid-beta Oligomers Precede p-Tau and Differentiate High Pathology Control Cases. Am J Pathol. 2016;186:185–198. doi: 10.1016/j.ajpath.2015.09.018. [DOI] [PMC free article] [PubMed] [Google Scholar]
- 9.Blanchard V, Moussaoui S, Czech C, Touchet N, Bonici B, Planche M, Canton T, Jedidi I, Gohin M, Wirths O, et al. Time sequence of maturation of dystrophic neurites associated with Abeta deposits in APP/PS1 transgenic mice. Exp Neurol. 2003;184:247–263. doi: 10.1016/s0014-4886(03)00252-8. [DOI] [PubMed] [Google Scholar]
- 10.Bronsert P, Weisser J, Biniossek ML, Kuehs M, Mayer B, Drendel V, Timme S, Shahinian H, Kusters S, Wellner UF, et al. Impact of routinely employed procedures for tissue processing on the proteomic analysis of formalin-fixed paraffin-embedded tissue. Proteomics Clin Appl. 2014;8:796–804. doi: 10.1002/prca.201300082. [DOI] [PubMed] [Google Scholar]
- 11.Castano EM, Maarouf CL, Wu T, Leal MC, Whiteside CM, Lue LF, Kokjohn TA, Sabbagh MN, Beach TG, Roher AE. Alzheimer disease periventricular white matter lesions exhibit specific proteomic profile alterations. Neurochem Int. 2013;62:145–156. doi: 10.1016/j.neuint.2012.12.001. [DOI] [PMC free article] [PubMed] [Google Scholar]
- 12.Chang KW, Yang PY, Lai HY, Yeh TS, Chen TC, Yeh CT. Identification of a novel actin isoform in hepatocellular carcinoma. Hepatol Res. 2006;36:33–39. doi: 10.1016/j.hepres.2006.05.003. [DOI] [PubMed] [Google Scholar]
- 13.Chang RY, Etheridge N, Nouwens AS, Dodd PR. SWATH analysis of the synaptic proteome in Alzheimer’s disease. Neurochem Int. 2015;87:1–12. doi: 10.1016/j.neuint.2015.04.004. [DOI] [PubMed] [Google Scholar]
- 14.Chen S, Lu FF, Seeman P, Liu F. Quantitative proteomic analysis of human substantia nigra in Alzheimer’s disease, Huntington’s disease and Multiple sclerosis. Neurochem Res. 2012;37:2805–2813. doi: 10.1007/s11064-012-0874-2. [DOI] [PubMed] [Google Scholar]
- 15.Chuang JY, Lee CW, Shih YH, Yang T, Yu L, Kuo YM. Interactions between amyloid-beta and hemoglobin: implications for amyloid plaque formation in Alzheimer’s disease. PLoS One. 2012;7:e33120. doi: 10.1371/journal.pone.0033120. [DOI] [PMC free article] [PubMed] [Google Scholar]
- 16.Cine N, Baykal AT, Sunnetci D, Canturk Z, Serhatli M, Savli H. Identification of ApoA1, HPX and POTEE genes by omic analysis in breast cancer. Oncol Rep. 2014;32:1078–1086. doi: 10.3892/or.2014.3277. [DOI] [PubMed] [Google Scholar]
- 17.Cohen M, Appleby B, Safar JG. Distinct prion-like strains of amyloid beta implicated in phenotypic diversity of Alzheimer’s disease. Prion. 2016;10:9–17. doi: 10.1080/19336896.2015.1123371. [DOI] [PMC free article] [PubMed] [Google Scholar]
- 18.Cohen ML, Kim C, Haldiman T, ElHag M, Mehndiratta P, Pichet T, Lissemore F, Shea M, Cohen Y, Chen W, et al. Rapidly progressive Alzheimer’s disease features distinct structures of amyloid-beta. Brain. 2015;138:1009–1022. doi: 10.1093/brain/awv006. [DOI] [PMC free article] [PubMed] [Google Scholar]
- 19.Cox J, Hein MY, Luber CA, Paron I, Nagaraj N, Mann M. Accurate proteome-wide label-free quantification by delayed normalization and maximal peptide ratio extraction, termed MaxLFQ. Mol Cell Proteomics. 2014;13:2513–2526. doi: 10.1074/mcp.M113.031591. [DOI] [PMC free article] [PubMed] [Google Scholar]
- 20.Dickey CA, Gordon MN, Wilcock DM, Herber DL, Freeman MJ, Morgan D. Dysregulation of Na+/K+ ATPase by amyloid in APP+PS1 transgenic mice. BMC Neurosci. 2005;6:7. doi: 10.1186/1471-2202-6-7. [DOI] [PMC free article] [PubMed] [Google Scholar]
- 21.Dickson TC, Chuckowree JA, Chuah MI, West AK, Vickers JC. alpha-Internexin immunoreactivity reflects variable neuronal vulnerability in Alzheimer’s disease and supports the role of the beta-amyloid plaques in inducing neuronal injury. Neurobiol Dis. 2005;18:286–295. doi: 10.1016/j.nbd.2004.10.001. [DOI] [PubMed] [Google Scholar]
- 22.Donovan LE, Higginbotham L, Dammer EB, Gearing M, Rees HD, Xia Q, Duong DM, Seyfried NT, Lah JJ, Levey AI. Analysis of a membrane-enriched proteome from postmortem human brain tissue in Alzheimer’s disease. Proteomics Clin Appl. 2012;6:201–211. doi: 10.1002/prca.201100068. [DOI] [PMC free article] [PubMed] [Google Scholar]
- 23.Drummond E, Nayak S, Ueberheide B, Wisniewski T. Proteomic analysis of individual neurons isolated from formalin-fixed paraffin embedded brain sections using laser microdissection. Scientific Reports. 2015;5:15456. doi: 10.1038/srep15456. [DOI] [PMC free article] [PubMed] [Google Scholar]
- 24.Duong T, Pommier EC, Scheibel AB. Immunodetection of the amyloid P component in Alzheimer’s disease. Acta Neuropathol. 1989;78:429–437. doi: 10.1007/BF00688180. [DOI] [PubMed] [Google Scholar]
- 25.Ferreira ST, Lourenco MV, Oliveira MM, De Felice FG. Soluble amyloid-beta oligomers as synaptotoxins leading to cognitive impairment in Alzheimer’s disease. Front Cell Neurosci. 2015;9:191. doi: 10.3389/fncel.2015.00191. [DOI] [PMC free article] [PubMed] [Google Scholar]
- 26.Finnegan S, Robson J, Hocking PM, Ali M, Inglehearn CF, Stitt A, Curry WJ. Proteomic profiling of the retinal dysplasia and degeneration chick retina. Mol Vis. 2010;16:7–17. [PMC free article] [PubMed] [Google Scholar]
- 27.Fowler CB, O’Leary TJ, Mason JT. Toward improving the proteomic analysis of formalin-fixed, paraffin-embedded tissue. Expert Rev Proteomics. 2013;10:389–400. doi: 10.1586/14789450.2013.820531. [DOI] [PubMed] [Google Scholar]
- 28.Freer R, Sormanni P, Vecchi G, Ciryam P, Dobson CM, Vendruscolo M. A protein homeostasis signature in healthy brains recapitulates tissue vulnerability to Alzheimer’s disease. Sci Adv. 2016;2:e1600947. doi: 10.1126/sciadv.1600947. [DOI] [PMC free article] [PubMed] [Google Scholar]
- 29.George AJ, Holsinger RM, McLean CA, Tan SS, Scott HS, Cardamone T, Cappai R, Masters CL, Li QX. Decreased phosphatidylethanolamine binding protein expression correlates with Abeta accumulation in the Tg2576 mouse model of Alzheimer’s disease. Neurobiol Aging. 2006;27:614–623. doi: 10.1016/j.neurobiolaging.2005.03.014. [DOI] [PubMed] [Google Scholar]
- 30.Glenner GG, Wong CW. Alzheimer’s disease: initial report of the purification and characterization of a novel cerebrovascular amyloid protein. Biochem Biophys Res Commun. 1984;120:885–890. doi: 10.1016/s0006-291x(84)80190-4. [DOI] [PubMed] [Google Scholar]
- 31.Gozal YM, Duong DM, Gearing M, Cheng D, Hanfelt JJ, Funderburk C, Peng J, Lah JJ, Levey AI. Proteomics analysis reveals novel components in the detergent-insoluble subproteome in Alzheimer’s disease. J Proteome Res. 2009;8:5069–5079. doi: 10.1021/pr900474t. [DOI] [PMC free article] [PubMed] [Google Scholar]
- 32.Hadley KC, Rakhit R, Guo H, Sun Y, Jonkman JE, McLaurin J, Hazrati LN, Emili A, Chakrabartty A. Determining composition of micron-scale protein deposits in neurodegenerative disease by spatially targeted optical microproteomics. Elife. 2015;4 doi: 10.7554/eLife.09579. [DOI] [PMC free article] [PubMed] [Google Scholar]
- 33.Hashimoto M, Bogdanovic N, Volkmann I, Aoki M, Winblad B, Tjernberg LO. Analysis of microdissected human neurons by a sensitive ELISA reveals a correlation between elevated intracellular concentrations of Abeta42 and Alzheimer’s disease neuropathology. Acta Neuropathol. 2010;119:543–554. doi: 10.1007/s00401-010-0661-6. [DOI] [PubMed] [Google Scholar]
- 34.Higuchi M, Iwata N, Matsuba Y, Takano J, Suemoto T, Maeda J, Ji B, Ono M, Staufenbiel M, Suhara T, et al. Mechanistic involvement of the calpain-calpastatin system in Alzheimer neuropathology. FASEB J. 2012;26:1204–1217. doi: 10.1096/fj.11-187740. [DOI] [PubMed] [Google Scholar]
- 35.Hirokawa N, Sobue K, Kanda K, Harada A, Yorifuji H. The cytoskeletal architecture of the presynaptic terminal and molecular structure of synapsin 1. J Cell Biol. 1989;108:111–126. doi: 10.1083/jcb.108.1.111. [DOI] [PMC free article] [PubMed] [Google Scholar]
- 36.Ho Kim J, Franck J, Kang T, Heinsen H, Ravid R, Ferrer I, Hee Cheon M, Lee JY, Shin Yoo J, Steinbusch HW, et al. Proteome-wide characterization of signalling interactions in the hippocampal CA4/DG subfield of patients with Alzheimer’s disease. Sci Rep. 2015;5:11138. doi: 10.1038/srep11138. [DOI] [PMC free article] [PubMed] [Google Scholar]
- 37.Hondius DC, van Nierop P, Li KW, Hoozemans JJ, van der Schors RC, van Haastert ES, van der Vies SM, Rozemuller AJ, Smit AB. Profiling the human hippocampal proteome at all pathologic stages of Alzheimer’s disease. Alzheimers Dement. 2016;12:654–668. doi: 10.1016/j.jalz.2015.11.002. [DOI] [PubMed] [Google Scholar]
- 38.Kakimura J, Kitamura Y, Takata K, Umeki M, Suzuki S, Shibagaki K, Taniguchi T, Nomura Y, Gebicke-Haerter PJ, Smith MA, et al. Microglial activation and amyloid-beta clearance induced by exogenous heat-shock proteins. FASEB J. 2002;16:601–603. doi: 10.1096/fj.01-0530fje. [DOI] [PubMed] [Google Scholar]
- 39.Kovacs GG, Laszlo L, Kovacs J, Jensen PH, Lindersson E, Botond G, Molnar T, Perczel A, Hudecz F, Mezo G, et al. Natively unfolded tubulin polymerization promoting protein TPPP/p25 is a common marker of alpha-synucleinopathies. Neurobiol Dis. 2004;17:155–162. doi: 10.1016/j.nbd.2004.06.006. [DOI] [PubMed] [Google Scholar]
- 40.Kraft AW, Hu X, Yoon H, Yan P, Xiao Q, Wang Y, Gil SC, Brown J, Wilhelmsson U, Restivo JL, et al. Attenuating astrocyte activation accelerates plaque pathogenesis in APP/PS1 mice. FASEB J. 2013;27:187–198. doi: 10.1096/fj.12-208660. [DOI] [PMC free article] [PubMed] [Google Scholar]
- 41.Kramer A, Green J, Pollard J, Jr, Tugendreich S. Causal analysis approaches in Ingenuity Pathway Analysis. Bioinformatics. 2014;30:523–530. doi: 10.1093/bioinformatics/btt703. [DOI] [PMC free article] [PubMed] [Google Scholar]
- 42.Lee Y, Ise T, Ha D, Saint Fleur A, Hahn Y, Liu XF, Nagata S, Lee B, Bera TK, Pastan I. Evolution and expression of chimeric POTE-actin genes in the human genome. Proc Natl Acad Sci U S A. 2006;103:17885–17890. doi: 10.1073/pnas.0608344103. [DOI] [PMC free article] [PubMed] [Google Scholar]
- 43.Liao L, Cheng D, Wang J, Duong DM, Losik TG, Gearing M, Rees HD, Lah JJ, Levey AI, Peng J. Proteomic characterization of postmortem amyloid plaques isolated by laser capture microdissection. J Biol Chem. 2004;279:37061–37068. doi: 10.1074/jbc.M403672200. [DOI] [PubMed] [Google Scholar]
- 44.Liu XF, Bera TK, Liu LJ, Pastan I. A primate-specific POTE-actin fusion protein plays a role in apoptosis. Apoptosis. 2009;14:1237–1244. doi: 10.1007/s10495-009-0392-0. [DOI] [PMC free article] [PubMed] [Google Scholar]
- 45.Manavalan A, Mishra M, Sze SK, Heese K. Brain-site-specific proteome changes induced by neuronal P60TRP expression. Neurosignals. 2013;21:129–149. doi: 10.1159/000343672. [DOI] [PubMed] [Google Scholar]
- 46.Masliah E, Cole GM, Hansen LA, Mallory M, Albright T, Terry RD, Saitoh T. Protein kinase C alteration is an early biochemical marker in Alzheimer’s disease. J Neurosci. 1991;11:2759–2767. doi: 10.1523/JNEUROSCI.11-09-02759.1991. [DOI] [PMC free article] [PubMed] [Google Scholar]
- 47.Mathur R, Ince PG, Minett T, Garwood CJ, Shaw PJ, Matthews FE, Brayne C, Simpson JE, Wharton SB, Function MRCC, et al. A reduced astrocyte response to beta-amyloid plaques in the ageing brain associates with cognitive impairment. PLoS One. 2015;10:e0118463. doi: 10.1371/journal.pone.0118463. [DOI] [PMC free article] [PubMed] [Google Scholar]
- 48.Matus A, Ackermann M, Pehling G, Byers HR, Fujiwara K. High actin concentrations in brain dendritic spines and postsynaptic densities. Proc Natl Acad Sci U S A. 1982;79:7590–7594. doi: 10.1073/pnas.79.23.7590. [DOI] [PMC free article] [PubMed] [Google Scholar]
- 49.Mi Z, Halfter W, Abrahamson EE, Klunk WE, Mathis CA, Mufson EJ, Ikonomovic MD. Tenascin-C Is Associated with Cored Amyloid-beta Plaques in Alzheimer Disease and Pathology Burdened Cognitively Normal Elderly. J Neuropathol Exp Neurol. 2016;75:868–876. doi: 10.1093/jnen/nlw062. [DOI] [PMC free article] [PubMed] [Google Scholar]
- 50.Minjarez B, Valero Rustarazo ML, Sanchez del Pino MM, Gonzalez-Robles A, Sosa-Melgarejo JA, Luna-Munoz J, Mena R, Luna-Arias JP. Identification of polypeptides in neurofibrillary tangles and total homogenates of brains with Alzheimer’s disease by tandem mass spectrometry. J Alzheimers Dis. 2013;34:239–262. doi: 10.3233/JAD-121480. [DOI] [PubMed] [Google Scholar]
- 51.Montine TJ, Phelps CH, Beach TG, Bigio EH, Cairns NJ, Dickson DW, Duyckaerts C, Frosch MP, Masliah E, Mirra SS, et al. National Institute on Aging-Alzheimer’s Association guidelines for the neuropathologic assessment of Alzheimer’s disease: a practical approach. Acta Neuropathol. 2012;123:1–11. doi: 10.1007/s00401-011-0910-3. [DOI] [PMC free article] [PubMed] [Google Scholar]
- 52.Morawski M, Bruckner G, Jager C, Seeger G, Matthews RT, Arendt T. Involvement of perineuronal and perisynaptic extracellular matrix in Alzheimer’s disease neuropathology. Brain Pathol. 2012;22:547–561. doi: 10.1111/j.1750-3639.2011.00557.x. [DOI] [PMC free article] [PubMed] [Google Scholar]
- 53.Morris JC. The Clinical Dementia Rating (CDR): current version and scoring rules. Neurology. 1993;43:2412–2414. doi: 10.1212/wnl.43.11.2412-a. [DOI] [PubMed] [Google Scholar]
- 54.Musunuri S, Kultima K, Richard BC, Ingelsson M, Lannfelt L, Bergquist J, Shevchenko G. Micellar extraction possesses a new advantage for the analysis of Alzheimer’s disease brain proteome. Anal Bioanal Chem. 2015;407:1041–1057. doi: 10.1007/s00216-014-8320-8. [DOI] [PubMed] [Google Scholar]
- 55.Musunuri S, Wetterhall M, Ingelsson M, Lannfelt L, Artemenko K, Bergquist J, Kultima K, Shevchenko G. Quantification of the brain proteome in Alzheimer’s disease using multiplexed mass spectrometry. J Proteome Res. 2014;13:2056–2068. doi: 10.1021/pr401202d. [DOI] [PubMed] [Google Scholar]
- 56.Nakamura S, Kawamata T, Akiguchi I, Kameyama M, Nakamura N, Kimura H. Expression of monoamine oxidase B activity in astrocytes of senile plaques. Acta Neuropathol. 1990;80:419–425. doi: 10.1007/BF00307697. [DOI] [PubMed] [Google Scholar]
- 57.Ono K, Takahashi R, Ikeda T, Mizuguchi M, Hamaguchi T, Yamada M. Exogenous amyloidogenic proteins function as seeds in amyloid beta-protein aggregation. Biochim Biophys Acta. 2014;1842:646–653. doi: 10.1016/j.bbadis.2014.01.002. [DOI] [PubMed] [Google Scholar]
- 58.Osborn LM, Kamphuis W, Wadman WJ, Hol EM. Astrogliosis: An integral player in the pathogenesis of Alzheimer’s disease. Prog Neurobiol. 2016;144:121–141. doi: 10.1016/j.pneurobio.2016.01.001. [DOI] [PubMed] [Google Scholar]
- 59.Perry G, Friedman R, Shaw G, Chau V. Ubiquitin is detected in neurofibrillary tangles and senile plaque neurites of Alzheimer disease brains. Proc Natl Acad Sci U S A. 1987;84:3033–3036. doi: 10.1073/pnas.84.9.3033. [DOI] [PMC free article] [PubMed] [Google Scholar]
- 60.Pickett EK, Koffie RM, Wegmann S, Henstridge CM, Herrmann AG, Colom-Cadena M, Lleo A, Kay KR, Vaught M, Soberman R, et al. Non-Fibrillar Oligomeric Amyloid-beta within Synapses. J Alzheimers Dis. 2016;53:787–800. doi: 10.3233/JAD-160007. [DOI] [PubMed] [Google Scholar]
- 61.Picklo MJ, Olson SJ, Markesbery WR, Montine TJ. Expression and activities of aldo-keto oxidoreductases in Alzheimer disease. J Neuropathol Exp Neurol. 2001;60:686–695. doi: 10.1093/jnen/60.7.686. [DOI] [PubMed] [Google Scholar]
- 62.Potter H, Wisniewski T. Apolipoprotein E: essential catalyst of the Alzheimer amyloid cascade. Int J Alz Dis. 2012;2012:489428. doi: 10.1155/2012/489428. [DOI] [PMC free article] [PubMed] [Google Scholar]
- 63.Power JH, Asad S, Chataway TK, Chegini F, Manavis J, Temlett JA, Jensen PH, Blumbergs PC, Gai WP. Peroxiredoxin 6 in human brain: molecular forms, cellular distribution and association with Alzheimer’s disease pathology. Acta Neuropathol. 2008;115:611–622. doi: 10.1007/s00401-008-0373-3. [DOI] [PMC free article] [PubMed] [Google Scholar]
- 64.Reisberg B, Ferris SH, De Leon MJ, Crook T. The global deterioration scale for assessment of primary degenerative dementia. Am J Psychiatry. 1982;139:1136–1139. doi: 10.1176/ajp.139.9.1136. [DOI] [PubMed] [Google Scholar]
- 65.Rosenberger AF, Rozemuller AJ, van der Flier WM, Scheltens P, van der Vies SM, Hoozemans JJ. Altered distribution of the EphA4 kinase in hippocampal brain tissue of patients with Alzheimer’s disease correlates with pathology. Acta Neuropathol Commun. 2014;2:79. doi: 10.1186/s40478-014-0079-9. [DOI] [PMC free article] [PubMed] [Google Scholar]
- 66.Rudrabhatla P, Jaffe H, Pant HC. Direct evidence of phosphorylated neuronal intermediate filament proteins in neurofibrillary tangles (NFTs): phosphoproteomics of Alzheimer’s NFTs. FASEB J. 2011;25:3896–3905. doi: 10.1096/fj.11-181297. [DOI] [PMC free article] [PubMed] [Google Scholar]
- 67.Sadleir KR, Kandalepas PC, Buggia-Prevot V, Nicholson DA, Thinakaran G, Vassar R. Presynaptic dystrophic neurites surrounding amyloid plaques are sites of microtubule disruption, BACE1 elevation, and increased Abeta generation in Alzheimer’s disease. Acta Neuropathol. 2016;132:235–256. doi: 10.1007/s00401-016-1558-9. [DOI] [PMC free article] [PubMed] [Google Scholar]
- 68.Schmidt C, Haik S, Satoh K, Rabano A, Martinez-Martin P, Roeber S, Brandel JP, Calero-Lara M, de Pedro-Cuesta J, Laplanche JL, et al. Rapidly progressive Alzheimer’s disease: a multicenter update. Journal of Alzheimer’s disease : JAD. 2012;30:751–756. doi: 10.3233/JAD-2012-120007. [DOI] [PubMed] [Google Scholar]
- 69.Schnurra I, Bernstein HG, Riederer P, Braunewell KH. The neuronal calcium sensor protein VILIP-1 is associated with amyloid plaques and extracellular tangles in Alzheimer’s disease and promotes cell death and tau phosphorylation in vitro: a link between calcium sensors and Alzheimer’s disease? Neurobiol Dis. 2001;8:900–909. doi: 10.1006/nbdi.2001.0432. [DOI] [PubMed] [Google Scholar]
- 70.Serang O, Noble W. A review of statistical methods for protein identification using tandem mass spectrometry. Stat Interface. 2012;5:3–20. doi: 10.4310/sii.2012.v5.n1.a2. [DOI] [PMC free article] [PubMed] [Google Scholar]
- 71.Sergeant N, Wattez A, Galvan-valencia M, Ghestem A, David JP, Lemoine J, Sautiere PE, Dachary J, Mazat JP, Michalski JC, et al. Association of ATP synthase alpha-chain with neurofibrillary degeneration in Alzheimer’s disease. Neuroscience. 2003;117:293–303. doi: 10.1016/s0306-4522(02)00747-9. [DOI] [PubMed] [Google Scholar]
- 72.Serrano-Pozo A, Betensky RA, Frosch MP, Hyman BT. Plaque-Associated Local Toxicity Increases over the Clinical Course of Alzheimer Disease. Am J Pathol. 2016;186:375–384. doi: 10.1016/j.ajpath.2015.10.010. [DOI] [PMC free article] [PubMed] [Google Scholar]
- 73.Shinohara M, Fujioka S, Murray ME, Wojtas A, Baker M, Rovelet-Lecrux A, Rademakers R, Das P, Parisi JE, Graff-Radford NR, et al. Regional distribution of synaptic markers and APP correlate with distinct clinicopathological features in sporadic and familial Alzheimer’s disease. Brain. 2014;137:1533–1549. doi: 10.1093/brain/awu046. [DOI] [PMC free article] [PubMed] [Google Scholar]
- 74.Sihag RK, Cataldo AM. Brain beta-spectrin is a component of senile plaques in Alzheimer’s disease. Brain Res. 1996;743:249–257. doi: 10.1016/s0006-8993(96)01058-x. [DOI] [PubMed] [Google Scholar]
- 75.Stoeck K, Schmitz M, Ebert E, Schmidt C, Zerr I. Immune responses in rapidly progressive dementia: a comparative study of neuroinflammatory markers in Creutzfeldt-Jakob disease, Alzheimer’s disease and multiple sclerosis. J Neuroinflammation. 2014;11:170. doi: 10.1186/s12974-014-0170-y. [DOI] [PMC free article] [PubMed] [Google Scholar]
- 76.Stoltzner SE, Grenfell TJ, Mori C, Wisniewski KE, Wisniewski TM, Selkoe DJ, Lemere CA. Temporal accrual of complement proteins in amyloid plaques in Down’s syndrome with Alzheimer’s disease. Am J Pathol. 2000;156:489–499. doi: 10.1016/S0002-9440(10)64753-0. [DOI] [PMC free article] [PubMed] [Google Scholar]
- 77.Sultana R, Boyd-Kimball D, Cai J, Pierce WM, Klein JB, Merchant M, Butterfield DA. Proteomics analysis of the Alzheimer’s disease hippocampal proteome. J Alzheimers Dis. 2007;11:153–164. doi: 10.3233/jad-2007-11203. [DOI] [PubMed] [Google Scholar]
- 78.Sweet RA, MacDonald ML, Kirkwood CM, Ding Y, Schempf T, Jones-Laughner J, Kofler J, Ikonomovic MD, Lopez OL, Garver ME, et al. Apolipoprotein E*4 (APOE*4) Genotype Is Associated with Altered Levels of Glutamate Signaling Proteins and Synaptic Coexpression Networks in the Prefrontal Cortex in Mild to Moderate Alzheimer Disease. Mol Cell Proteomics. 2016;15:2252–2262. doi: 10.1074/mcp.M115.056580. [DOI] [PMC free article] [PubMed] [Google Scholar]
- 79.Szklarczyk D, Jensen LJ. Protein-protein interaction databases. Methods Mol Biol. 2015;1278:39–56. doi: 10.1007/978-1-4939-2425-7_3. [DOI] [PubMed] [Google Scholar]
- 80.Takata K, Kitamura Y, Nakata Y, Matsuoka Y, Tomimoto H, Taniguchi T, Shimohama S. Involvement of WAVE accumulation in Abeta/APP pathology-dependent tangle modification in Alzheimer’s disease. Am J Pathol. 2009;175:17–24. doi: 10.2353/ajpath.2009.080908. [DOI] [PMC free article] [PubMed] [Google Scholar]
- 81.Tanca A, Pagnozzi D, Addis MF. Setting proteins free: progresses and achievements in proteomics of formalin-fixed, paraffin-embedded tissues. Proteomics Clin Appl. 2012;6:7–21. doi: 10.1002/prca.201100044. [DOI] [PubMed] [Google Scholar]
- 82.Wang Q, Woltjer RL, Cimino PJ, Pan C, Montine KS, Zhang J, Montine TJ. Proteomic analysis of neurofibrillary tangles in Alzheimer disease identifies GAPDH as a detergent-insoluble paired helical filament tau binding protein. FASEB J. 2005;19:869–871. doi: 10.1096/fj.04-3210fje. [DOI] [PubMed] [Google Scholar]
- 83.Wang YJ, Chen GH, Hu XY, Lu YP, Zhou JN, Liu RY. The expression of calcium/calmodulin-dependent protein kinase II-alpha in the hippocampus of patients with Alzheimer’s disease and its links with AD-related pathology. Brain Res. 2005;1031:101–108. doi: 10.1016/j.brainres.2004.10.061. [DOI] [PubMed] [Google Scholar]
- 84.Wisniewski T, Frangione B. Apolipoprotein E: a pathological chaperone protein in patients with cerebral and systemic amyloid. Neurosci Lett. 1992;135:235–238. doi: 10.1016/0304-3940(92)90444-c. [DOI] [PubMed] [Google Scholar]
- 85.Xing SL, Chen B, Shen DZ, Zhu CQ. beta-amyloid peptide binds and regulates ectopic ATP synthase alpha-chain on neural surface. Int J Neurosci. 2012;122:290–297. doi: 10.3109/00207454.2011.649867. [DOI] [PubMed] [Google Scholar]
- 86.Yamada T, Kawamata T, Walker DG, McGeer PL. Vimentin immunoreactivity in normal and pathological human brain tissue. Acta Neuropathol. 1992;84:157–162. doi: 10.1007/BF00311389. [DOI] [PubMed] [Google Scholar]
- 87.Yang Y, Kim J, Kim HY, Ryoo N, Lee S, Kim Y, Rhim H, Shin YK. Amyloid-beta Oligomers May Impair SNARE-Mediated Exocytosis by Direct Binding to Syntaxin 1a. Cell Rep. 2015;12:1244–1251. doi: 10.1016/j.celrep.2015.07.044. [DOI] [PMC free article] [PubMed] [Google Scholar]
- 88.Yu JT, Tan L, Hardy J. Apolipoprotein E in Alzheimer’s disease: an update. Annu Rev Neurosci. 2014;37:79–100. doi: 10.1146/annurev-neuro-071013-014300. [DOI] [PubMed] [Google Scholar]
- 89.Zahid S, Oellerich M, Asif AR, Ahmed N. Differential expression of proteins in brain regions of Alzheimer’s disease patients. Neurochem Res. 2014;39:208–215. doi: 10.1007/s11064-013-1210-1. [DOI] [PubMed] [Google Scholar]
- 90.Zelaya MV, Perez-Valderrama E, de Morentin XM, Tunon T, Ferrer I, Luquin MR, Fernandez-Irigoyen J, Santamaria E. Olfactory bulb proteome dynamics during the progression of sporadic Alzheimer’s disease: identification of common and distinct olfactory targets across Alzheimer-related co-pathologies. Oncotarget. 2015;6:39437–39456. doi: 10.18632/oncotarget.6254. [DOI] [PMC free article] [PubMed] [Google Scholar]
- 91.Zhan X, Jickling GC, Ander BP, Stamova B, Liu D, Kao PF, Zelin MA, Jin LW, DeCarli C, Sharp FR. Myelin basic protein associates with AbetaPP, Abeta1–42, and amyloid plaques in cortex of Alzheimer’s disease brain. J Alzheimers Dis. 2015;44:1213–1229. doi: 10.3233/JAD-142013. [DOI] [PMC free article] [PubMed] [Google Scholar]
- 92.Zhang LH, Wang X, Stoltenberg M, Danscher G, Huang L, Wang ZY. Abundant expression of zinc transporters in the amyloid plaques of Alzheimer’s disease brain. Brain Res Bull. 2008;77:55–60. doi: 10.1016/j.brainresbull.2008.03.014. [DOI] [PubMed] [Google Scholar]
- 93.Zhang Y, Muller M, Xu B, Yoshida Y, Horlacher O, Nikitin F, Garessus S, Magdeldin S, Kinoshita N, Fujinaka H, et al. Unrestricted modification search reveals lysine methylation as major modification induced by tissue formalin fixation and paraffin embedding. Proteomics. 2015;15:2568–2579. doi: 10.1002/pmic.201400454. [DOI] [PubMed] [Google Scholar]
- 94.Zhang Y, Sloan SA, Clarke LE, Caneda C, Plaza CA, Blumenthal PD, Vogel H, Steinberg GK, Edwards MS, Li G, et al. Purification and Characterization of Progenitor and Mature Human Astrocytes Reveals Transcriptional and Functional Differences with Mouse. Neuron. 2016;89:37–53. doi: 10.1016/j.neuron.2015.11.013. [DOI] [PMC free article] [PubMed] [Google Scholar]
- 95.Zhao J, Fu Y, Yasvoina M, Shao P, Hitt B, O’Connor T, Logan S, Maus E, Citron M, Berry R, et al. Beta-site amyloid precursor protein cleaving enzyme 1 levels become elevated in neurons around amyloid plaques: implications for Alzheimer’s disease pathogenesis. J Neurosci. 2007;27:3639–3649. doi: 10.1523/JNEUROSCI.4396-06.2007. [DOI] [PMC free article] [PubMed] [Google Scholar]
- 96.Zhou J, Jones DR, Duong DM, Levey AI, Lah JJ, Peng J. Proteomic analysis of postsynaptic density in Alzheimer’s disease. Clin Chim Acta. 2013;420:62–68. doi: 10.1016/j.cca.2013.03.016. [DOI] [PMC free article] [PubMed] [Google Scholar]
Associated Data
This section collects any data citations, data availability statements, or supplementary materials included in this article.
Supplementary Materials
Sequence alignment of detected peptides mapped to POTEE and ACTBM. Sequence alignment was performed using Clustal Omega. Detected peptides are highlighted in yellow. Amino acid differences between POTEE and ACTBM are shown in red. The table lists identified peptides mapped to POTEE, whether each peptide is also found in ACTBM or any other actin isoforms and their corresponding average LFQ intensity values in rpAD and sAD plaques.
The first tab shows imputed data. All results discussed in this paper were generated using this dataset. Relative protein abundance was quantified using MaxQuant. Data shows Log2 transformed LFQ intensities with missing values imputed from normal distribution. This also contains comparison with the in-house developed Alzheimer’s protein database. ALZproteins column identifies the number of proteins in the protein group that are also present in the Alzheimer’s protein database. ALZscore lists the total number of previous studies that a protein group was significantly associated with Alzheimer’s disease in the Alzheimer’s disease database (i.e. the higher the number, the more associated with Alzheimer’s disease the protein group). ALZdetails shows the breakdown of how a protein group has been previously associated with Alzheimer’s disease; U – up-regulated in previous Alzheimer’s disease studies; D – down-regulated in previous Alzheimer’s disease studies; N – enriched in neurofibrillary tangles; P – enriched in plaques). ALZdirection gives the overall annotation for the whole protein group as either up (U) or down-regulated (D) in Alzheimer’s disease. The second tab details the same dataset, but time including raw, unimputed data.
The list of all quantified proteins was filtered to include only proteins that had measurable expression in all plaques before imputation. Proteins are sorted by average expression in rpAD plaques. Proteins with novel involvement in AD have an “ALZproteins” score of 0.
The list of all proteins with significantly altered expression in rpAD plaques, sorted by –Log Welch’s t-test p-value rpAD_sAD. Proteins with a positive Welch’s t-test difference have significantly higher expression in rpAD plaques. This also contains comparison with the in-house developed Alzheimer’s protein database (see Supplementary Table 1 figure legend for details).
Data shows Log2 transformed LFQ intensities with missing values imputed from normal distribution.