

Inactivation of uncoupling protein 1 is linked to shifts in metabolic rate, body size, and species richness of eight mammalian lineages.
Abstract
Mitochondrial uncoupling protein 1 (UCP1) is essential for nonshivering thermogenesis in brown adipose tissue and is widely accepted to have played a key thermoregulatory role in small-bodied and neonatal placental mammals that enabled the exploitation of cold environments. We map ucp1 sequences from 133 mammals onto a species tree constructed from a ~51-kb sequence alignment and show that inactivating mutations have occurred in at least 8 of the 18 traditional placental orders, thereby challenging the physiological importance of UCP1 across Placentalia. Selection and timetree analyses further reveal that ucp1 inactivations temporally correspond with strong secondary reductions in metabolic intensity in xenarthrans and pangolins, or in six other lineages coincided with a ~30 million–year episode of global cooling in the Paleogene that promoted sharp increases in body mass and cladogenesis evident in the fossil record. Our findings also demonstrate that members of various lineages (for example, cetaceans, horses, woolly mammoths, Steller’s sea cows) evolved extreme cold hardiness in the absence of UCP1-mediated thermogenesis. Finally, we identify ucp1 inactivation as a historical contingency that is linked to the current low species diversity of clades lacking functional UCP1, thus providing the first evidence for species selection related to the presence or absence of a single gene product.
INTRODUCTION
Adaptive nonshivering thermogenesis (NST) of placental mammals is predominantly mediated by uncoupling protein 1 (UCP1), which resides at high levels in the mitochondrial inner membrane of brown adipose tissue (BAT) (1). Upon activation, UCP1 facilitates proton leak into the mitochondrial matrix (2) without concomitant adenosine triphosphate (ATP) production, thereby intensifying substrate oxidation and, hence, cellular heat production. BAT deposits are located adjacent to major blood vessels in the neck, thorax, and abdomen to promote the rapid distribution of NST heat (3). In addition to the strategic location of these deposits, the observation that chronic cold stress stimulates the proliferation and activity of BAT (4) highlights the canonical importance of NST for small-bodied and torpor-expressing placental mammals, together with neonates of larger cold-tolerant species (5). UCP1 has also been implicated in the regulation of food intake, energy balance, fever response, prevention of cold-induced oxidative stress, and, possibly, even longevity (6–9). The recent discovery of UCP1 induction in a class of white adipocytes (termed brite or beige fat) in response to exercise and cold exposure expands the repertoire of this protein and moreover offers therapeutic interventions for obesity, hyperlipidemia, cachexia, and other metabolic disorders (10, 11).
The presence of a UCP1 orthologue lacking adaptive NST responses in marsupials, monotremes, and both ray- and lobe-finned fishes (12) indicates that ucp1 was likely recruited for NST sometime during the Mesozoic ancestry of placental mammals (13, 14). This ancestor is reconstructed as a small (6- to 245-g) nocturnal insectivore that gave birth to hairless, altricial young and likely exhibited torpor (that is, heterothermy) (15, 16). Facultative BAT thermogenesis may have evolved to defend against the natural cold stress of birth (17), to decrease the energetic costs of rewarming from torpor (18), or to enable endothermy during the reproductive season (19) and is postulated to underlie the subsequent radiation of crown eutherians into cold environments (3). Evolution of this thermogenic tissue was presumably also driven by small body size, as maximal NST capacity is inversely proportional to mass, with little to no thermal contribution predicted in mammals above 10 kg (20, 21). Although limited data are available for larger-bodied species, ucp1 is only transiently expressed in BAT deposits of neonatal cattle [~40 kg (22)] and preweaned harp seals [<30 kg (23)], with minor depots either absent or present in adult humans (11). Conversely, the persistence of UCP1 in BAT depots of subadult harbor seals [34 and 38 kg (5)] and the discovery of a large cervical mass of fat that is histologically similar to BAT in a preserved 1-month-old (~100 kg) woolly mammoth (24), but not extant elephants, imply that this tissue may underpin the evolution of extreme cold hardiness in at least some larger-bodied species. Consistent with this hypothesis, ucp1 inactivation is documented only within the pig lineage, whose newborns lack discernible BAT and are notoriously cold-intolerant (17, 25).
Support for a de novo gain of thermogenic function in early eutherians is bolstered by an elevated rate of nucleotide substitutions on the stem placental branch (13, 14), although these results were based on limited sample sizes (10 and 16 species) and heavily biased toward small-bodied forms from only two (Euarchontoglires and Laurasiatheria) of the four major clades of placental mammals. Notably, distinct BAT deposits have been positively identified in neonates of only 11 of the 18 traditional eutherian orders (17, 26). Given that body size and energetic considerations are expected to alter the selective advantage of BAT-mediated NST (20, 21, 26), we posited that evolution of large body size or reduced thermogenic capacity would be accompanied by relaxed selection and/or inactivation of the ucp1 locus that may, at least in part, underlie this latter observation. To test this hypothesis, we used genome mining, polymerase chain reaction (PCR) and hybridization capture techniques to obtain ucp1, ucp2, and ucp3 coding sequences from 141 vertebrate species (see Materials and Methods and table S1). Translated coding sequences were examined for disrupting mutations (for example, frameshift indels, premature termination codons, mutated start/stop codons, and splice site mutations), and ortholog assignments were verified on the basis of synteny analyses and/or a maximum likelihood ucp1-ucp2-ucp3 tree (fig. S1) before conducting selection analyses using the CODEML program in the PAML 4.8 software package (27) based on a custom-built 41-loci (51-kb) RAxML species tree (see Materials and Methods and data file S1).
RESULTS
In line with previous studies (13, 14), our phylogenetically informed results demonstrate an increased rate of molecular evolution on the stem placental branch for ucp1 (ω = 0.65) that was presumably associated with the acquisition of classical NST, although no sites exhibited statistically significant signatures of positive selection (table S2). These analyses further verify that eutherian branches with intact ucp1 sequences evolved under strong purifying selection (ω = 0.16), consistent with maintenance of an adaptive function. In support of our hypothesis that relaxed selection and/or inactivation of the ucp1 locus may be associated with increased body size or reduced thermogenic capacity, these analyses reveal independent inactivating mutations of ucp1 (including exon and whole-gene deletions) in at least eight placental clades: xenarthrans (Cingulata and Pilosa), pangolins (Pholidota), dolphins and whales (Cetacea), sea cows (Sirenia), elephants (Proboscidea), hyraxes (Hyracoidea), pigs (Suidae), and horses, donkeys, and zebras (Equidae) (Figs. 1 and 2 and fig. S2). Notably, these findings are corroborated by a signature of neutral evolution (ω = 0.94 in pseudogenic branches versus 0.16 in species containing an intact ucp1 locus; table S2 and data file S2) and a lack of discernable BAT in neonates of each of these groups (17). To better facilitate comparisons between the genomic record and fossil record and identify potential climatic and ecological factors underlying ucp1 loss in these lineages, we calculated gene inactivation date ranges based on a fossil-informed Bayesian molecular timetree that used an autocorrelated rates model (see Materials and Methods and data file S1) and dN/dS ratios in functional, pseudogenic, and mixed branches (where ucp1 inactivation was deemed to have occurred) (28).
Fig. 1. Schematic illustrating disrupting mutations in ucp1 across the placental mammal phylogeny.
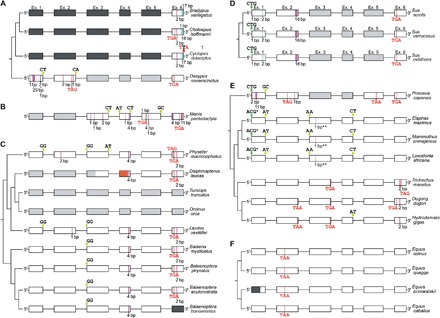
(A) Xenarthra, (B) Pholidota, (C) Cetacea [note insert from ~800 bp upstream of ucp1 exon 4 of beluga (orange)], (D) Suidae, (E) Paenungulata [*, putative start codon located 36 bp downstream; **, creates 15 downstream stop codons (not shown)], and (F) Equidae. The six coding exons of ucp1 are represented by open rectangles; missing data (black), deleted exons (gray), mutated start codons (green), nonsense mutations (red), deletions (magenta), insertions (cyan), splice site mutations (yellow), and a mutated stop codon (“TTA” in Cyclopes) are indicated.
Fig. 2. Large-scale deletions of the ucp1 locus in select placental species.
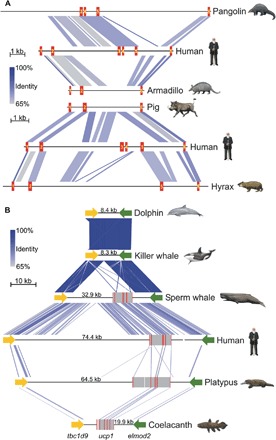
(A) Linear comparisons of ucp1 illustrating exon deletions in pangolin, armadillo, pig, and hyrax relative to the intact human locus. The coding exons of ucp1 are numbered and highlighted in red. (B) Patterns of conserved synteny in the genomic region flanking the ucp1 locus of select vertebrates illustrating the complete deletion of ucp1 in a common ancestor of the dolphin and killer whale. Coding exons are highlighted in red, intervening sequences are highlighted in gray, and sequencing gaps are denoted by white spaces. Distances in kilobases between the termination codons of the upstream (tbc1d9) and downstream (elmod2) loci are given for each species. Note that the platypus ucp1 locus contains an additional upstream exon relative to other vertebrate species. Artwork by C. Buell.
The earliest disruptions of ucp1 function (likely Cretaceous; Fig. 3 and table S3) occur in the ancestors of xenarthrans and pangolins, two groups that exhibit marked convergence in many ecological, morphological, and physiological traits and which are generally characterized by mediocre temperature-regulating mechanisms and low, labile body temperatures (29–32). The ancient inactivations of ucp1 in these lineages may, in part, underlie this convergence and are presumably linked to strong secondary reductions in metabolic intensity associated with the ancestral burrowing habits and energy-poor diets of these taxa (29, 30). Although aardvarks, in which UCP1 appears to be functional, share some ecological and dietary commonalities with pangolins and insectivorous xenarthrans, they exhibit only minor reductions in mass-specific basal metabolic rate (~20% lower than expected for its body mass) compared to pangolins, armadillos, and anteaters of similar size (~50 to 65% lower than predicted) (33) and are hence likely able to adequately provision offspring with thermogenic BAT (that is, with elevated energetic costs). Although BAT-mediated NST has been shown to enhance cold tolerance (34) and accelerate rewarming from torpor at a reduced net energy cost (18), at least some xenarthrans exhibit torpor (32), whereas others exploited thermally taxing environments. The latter was presumably enabled by elaborate countercurrent heat exchangers (arteriovenous rete) in the limbs that promote heat conservation (35), which, coupled with a relatively thick pelt and the recurrent development of gigantism (36), likely facilitated the colonization of subarctic environments (68°N) by the Pleistocene sloth Megalonyx jeffersonii (37) and the aquatic niche by Miocene/Pliocene marine sloths of the genus Thalassocnus (38) in the absence of functional UCP1.
Fig. 3. UCP1 inactivation across a time-calibrated placental mammal phylogeny.
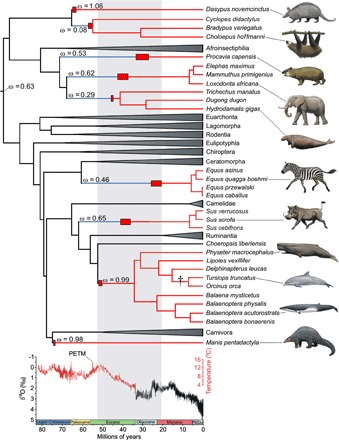
Functional ucp1 branches are denoted in black, pseudogenic branches in red, and mixed branches (where ucp1 inactivation occurred) in blue. Clades having intact ucp1 loci are collapsed. Red boxes indicate ucp1 inactivation date ranges as determined by dN/dS analyses (see table S3), whereas the dagger represents the complete deletion of this locus in the delphinid lineage (see Fig. 2B). Pre-Oligocene temperatures are based on a benthic foraminifera δ18O isotope data set assuming an ice-free ocean (165–167). Note that most inactivations correspond to a period of intense global cooling (gray shading) following the Paleocene-Eocene thermal maximum (PETM). Within this window, ucp1 was inactivated earlier in the two aquatic species, consistent with the much higher thermal conductivity of water relative to air (~24.1× higher at 25°C). Because only remnants of ucp1 were identified from representative Pilosa (Bradypus, Choleopus, and Cyclopes), the presented inactivation range should be interpreted with caution, and it is possible that ucp1 pseudogenization preceded its divergence from Cingulata. Artwork by C. Buell.
For the remaining six lineages, our estimates indicate that ucp1 was predominantly silenced from the Early Eocene to the Late Oligocene, a period characterized by marked global cooling (Fig. 3) that spurred the diversification of grass and deciduous woodland communities (39). Because these factors have been proposed to underlie body mass increases of numerous mammalian groups during the Cenozoic Era (40), we assembled a data set to explore potential links between mammalian body size evolution (data file S3) and ucp1 inactivation (table S3). In each case, our ucp1 inactivation date ranges overlap or immediately precede magnitude scale increases in body size (Fig. 4A). For example, the earliest proboscideans [59 to 60 million–year–old (Ma) Eritherium (41)] and hyraxes [~55-Ma Seggeurius (42)] were small (~3 to 5 kg) but gave rise to much larger species (for example, 3600-kg Barytherium and 800- to 1400-kg Titanohyrax ulitimus), coincident with our estimates of ucp1 inactivation. Although large-bodied (~625- to 800-kg) hyracoids such as “Titanohyrax” mongereaui are also known from earlier deposits, the presence of only a single, “primitive” Seggeurius-sized species (Dimaitherium patnaiki) from the early Priabonian (~37 Ma) suggests that gigantism evolved independently in Middle and Late Eocene hyracoids (43). Although extant hyraxes are generally rabbit-sized (~1 to 5 kg) and thought to have arisen from small, derived saghatheriines such as Thyrohyrax (42), their long gestation (8 months) (42) coupled with multiple disruptions in ucp1 (Figs. 1 and 2A) is instead suggestive of evolutionary descent from a large-bodied ancestor. Our estimate of ucp1 inactivation in the family Equidae (25.1 to 20.7 Ma) is also coincident with an ~8- to 10-fold increase in body size in this lineage (Fig. 4A). Potential thermogenic limitations arising from UCP1 loss [as suggested for suids (25)] were clearly not an impediment to the ability of equines to exploit cold environments given “that Alaskan horses prospered during the LGM [last glacial maximum; ~18,000 years ago], and appear to have been particularly well adapted to the more intense versions of the cold/arid Mammoth Steppe” (44).
Fig. 4. Body mass and taxon diversity relative to estimates of ucp1 inactivation in five lineages of eutherian mammals.
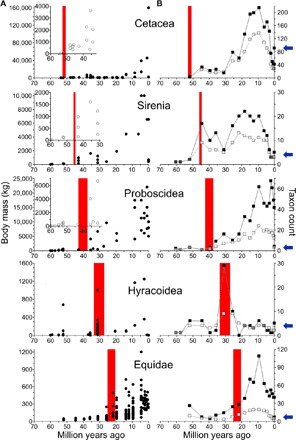
(A) Calculated ucp1 inactivation range (red shading) in relation to body size estimates (open and closed circles). The y axis is reduced in the insets to better visualize changes in body mass relative to ucp1 inactivation. (B) Calculated ucp1 inactivation range (red shading) in relation to records of the number of species (closed squares) and genera (open squares) per geological stage. Blue arrows denote current species diversity for each taxon.
Loss of ucp1 in pigs has been previously dated to ~20 Ma (25). However, the absence of BAT in newborn peccaries (17) suggests that its inactivation may have predated the divergence of Suoidea in the Late Eocene to Early Oligocene (45, 46). Owing to a fragmentary fossil record, potential selection pressures favoring ucp1 inactivation in early suids remain unclear, although it is notable that—like whales and adult pinnipeds—cold-stressed domestic swine shunt blood away from the entire body surface, thereby forming a steep thermal gradient to minimize heat loss (47). Nonetheless, loss of BAT has not prevented exploitation of cold north temperature niches by some members of this clade (25).
We estimate that ucp1 inactivation in Cetacea occurred soon after their divergence from hippopotamids (~52.75 Ma) and document the complete deletion of this locus in delphinids (Fig. 2B) by the Late Miocene. These findings directly contradict recent claims of UCP1 expression in blubber of four delphinoid species (48) (which we attribute to unspecific antibody hybridization to UCP1 paralogs in this tissue) and intact UCP1 proteins in the genomes of six cetacean species [including bottlenose dolphin and killer whale (49)]. Notably, the non-delphinid cetacean UCP1 primary sequences presented in the latter study show premature stop codons stemming from both nonsense and frameshift mutations (as also seen in Fig. 1), whereas the presented killer whale and bottlenose dolphin “UCP1” sequences correspond to UCP2 and UCP3, respectively. Our results further indicate that the pseudogenization of ucp1 also immediately predates strong increases in body size during the early amphibious stages of archaeocete evolution [that is, from 15- to 30-kg Himalayacetus (52.5 Ma) to 590- to 720-kg Ambulocetus/Rodhocetus (48 Ma) (50, 51)]. Body mass changes of similar scale followed the inactivation of ucp1 in sirenians 46.0 to 44.8 Ma (Fig. 4A), the only other fully aquatic mammalian lineage. Notably, loss of UCP1 function does not appear to be linked to the advent of aquatic birth in these lineages (pinnipeds and other semiaquatic mammals are born on land or ice and generally do not enter the aquatic environment until after weaning), as our estimates of ucp1 inactivation precede the loss of hindlimb land locomotion—and, hence, emergence of fully aquatic lifestyles—in primitive dugongids (52) and early basilosaurids [for example, Basilosaurus and Durodon (53)] during the Bartonian by 5 to 10 Ma. Moreover, absence of UCP1-mediated NST is not mechanistically linked with inferior thermoregulatory capabilities in neonates of either lineage, as evidenced by year-round resident high Arctic whales (for example, bowhead, beluga, and narwhal) and the recently extinct sub-Arctic Steller’s sea cow (Hydrodamalis gigas). The presence of a pseudogenic copy of ucp1 in woolly mammoths further precludes a UCP1-mediated thermogenic function for the BAT-like tissue described from a 1-month-old specimen (24) and again illustrates that ucp1 is not uniquely associated with the evolution of extreme cold hardiness in placental mammals.
In addition to abrupt changes in body mass (Fig. 4A), the inactivation of ucp1 also coincided with rapid species diversification evident in the fossil record of these lineages (Fig. 4B), consistent with recent work linking increased body mass with cladogenesis (54). However, because most lineages lacking a functional UCP1 currently exhibit relatively low species diversities, we performed analyses with binary state speciation and extinction (BiSSE) (55) on a eutherian mammal species tree with 5138 taxa (see Materials and Methods) (56), as implemented in the diversitree package for R (57), to determine whether diversification rates among extant placental mammals have been higher in taxa that retain a functional copy of this gene (“UCP1-plus”) versus taxa that have a pseudogenic copy of this gene (“UCP1-minus”). These analyses provide support for the hypothesis that diversification rates have been higher in UCP1-plus taxa than in UCP1-minus taxa (table S4). An important caveat is that BiSSE is prone to high type 1 error rates even for neutral characters that are not associated with trait-dependent diversification rates (58). We therefore simulated neutral characters on the same mammalian species trees that we used for the above UCP1 diversification analyses and confirmed that BiSSE has a high type 1 error rate (P < 0.05 in 43 of 100 simulations) for our trees (table S5). However, 35 of these runs resulted in P values that were less supported than the least significant P value (0.000023) for UCP1.
The observation that brown-throated sloths (Bradypus variegatus) exposed to cold exhibit markedly improved temperature regulation abilities when pregnant (31) suggests the presence of inducible NST mechanism(s) in this and potentially other clades lacking a functional UCP1. One candidate recently implicated in muscle-based NST is sarcolipin (sln) (59, 60), which intriguingly exhibits two unique residue deletions in equids that may alter ATP-dependent Ca2+ uptake in skeletal muscle, although this gene is inactivated in extant sloths (fig. S3). It is unlikely that other paralogs (that is, ucp2 and ucp3) assumed a UCP1-like role in BAT in these species because dN/dS analyses failed to identify differential selection acting upon these loci in branches where ucp1 was lost (data files S4 to S5). These ancillary analyses pinpoint additional pseudogenization events [for example, ucp2 and ucp3 inactivation in armadillos (table S6)] that provide natural model systems to help elucidate the precise function of these proteins.
DISCUSSION
Although NST is often thought to be an effective means to counter low ambient temperatures, heavy reliance on thermogenesis comes at a high energetic cost that may be difficult to meet in species that consume energy-poor diets and exhibit marked reductions in metabolic intensity (xenarthrans and pangolins). Selection for larger body size is also predicted to reduce reliance on BAT by decreasing the relative surface area for heat loss (20, 21) and enabling the development of size-dependent heat conservation measures (for example, countercurrent rete). In this regard, selection pressures contributing to the loss of ucp1 may also be expected to favor precocial species due to their heightened insulation at birth and generally transient reliance on BAT-mediated NST relative to altricial taxa (61). In this context, note that only one of the eight lineages lacking a functional ucp1 locus is altricial (pangolins).
In light of the apparent link between our ucp1 inactivation estimates and body mass changes evident in the fossil record (Fig. 4A), it is perhaps surprising that ucp1 is intact and ostensibly evolving under purifying selection in large-bodied rhinocerotids, pinnipeds (walrus, Weddell seals, and harbor seals), and hippopotamuses (ω = 0.25 to 0.29) (table S2). This suggests that other factors including diet, metabolic intensity, developmental strategy, litter size, and birth weight, together with potential adaptive roles in brite/beige tissue, may have also played a role in the retention (or loss) of UCP1. Nonetheless, relatively low ω values for the above branches should be treated with caution in the absence of protein expression and functional data, as long branches may conflate multiple evolutionary histories (that is, a recent transition to neutral selection that is obscured by a much longer period of purifying selection). ucp1 expression was not detected in a ~32-kg Weddell seal nor in ~27-kg hooded seal neonates, both of which lacked conspicuous BAT depots (62); hippopotamuses similarly appear to lack BAT as newborns (17). Conversely, the intact ucp1 locus of camels intriguingly exhibits a signature of neutral evolution (ω = 1.03) (table S2) coupled with a four-residue deletion within a highly conserved region of the third matrix loop that borders the guanosine diphosphate–binding domain, which may compromise its function (fig. S2).
The regressive evolution of ucp1 together with attendant increases in body mass may thus have contributed to the initial exploitation of seasonal temperate niches (and other large-bodied terrestrial and aquatic habitats vacated by dinosaurs/marine reptiles following the Cretaceous-Paleogene extinction) by these lineages and presumably underlies their rapid diversification apparent in the fossil record (Fig. 4B). This evolutionary success was, however, not devoid of negative long-term fitness consequences. For example, the reevolution of small body size (<5 kg) is presumably constrained by competitive disadvantages versus species with UCP1-mediated NST or has restricted medium-sized members of these lineages to tropical/subtropical environments (that is, xenarthrans, pangolins, and hyraxes). These factors coupled with observations that large-bodied taxa exhibit higher risks of extinction (63) lead us to hypothesize that loss of UCP1-dependent thermogenesis may represent a historical contingency that underlies the current low species diversity of placental clades lacking a functional ucp1 gene (Fig. 4B). This assertion is supported by our BiSSE analyses, as we demonstrate higher diversification rates in UCP1-plus taxa than in UCP1-minus taxa. Although we confirm that this method is susceptible to high type 1 error rates, most P values arising from our simulations were substantially less supported than those of our diversification analysis (compare tables S5 and S6). Thus, to our knowledge, these results provide the first evidence that links diversification rates and, hence, species selection to the presence or absence of a single gene product. A second limitation to this interpretation is that other traits, which are unrelated to UCP1 inactivation, may also have contributed to lower diversification rates in UCP1-minus taxa. One possible example is the complete loss of teeth (edentulism), which occurs in four UCP1-minus clades (pangolins, anteaters, baleen whales, and Steller’s sea cow) with highly specialized diets and feeding adaptations. All of these groups also have inactivating mutations in one or more tooth-specific genes (28, 64) that effectively preclude the reappearance of teeth in these taxa.
Because adult and obese humans have only negligible brown adipose depots, species lacking UCP1 provide unexplored model systems for adipocyte remodeling and alternative pathways of thermogenesis in response to cold that may be more transformative to biomedical applications. Together, our findings raise important questions regarding the roles and physiological significance of UCPs over the course of eutherian evolution, challenge the perception that BAT underlies cold tolerance in large-bodied eutherian mammals, and identify ucp1 inactivation as a historical contingency that may underlie the current low species diversity of these clades.
MATERIALS AND METHODS
Taxon sampling
This study included representatives of 141 vertebrates, 133 of which are mammals (1 monotreme, 4 marsupials, 4 xenarthrans, 11 afrotherians, 59 laurasiatherians, and 54 euarchontoglires). Outgroup representatives included seven fish and one amphibian species. Because of the documented loss of ucp1 in the archosaur lineage (65), birds and reptiles were not included in the data set. We used genome mining, PCR, and hybridization capture to obtain ucp1, ucp2, ucp3, and sln coding sequences examined in this study. Taxon sampling and GenBank accession numbers are provided in table S1.
Genome mining
We used key word searches to identify ucp1, ucp2, ucp3, and sln mRNA sequences in GenBank. We also performed standard nucleotide blasts (blastn) (66) against whole-genome shotgun contigs using the “discontinuous megablast” setting and human ucp1, ucp2, ucp3, or sln coding sequences (accession numbers NM_021833.4, U82819.1, U84763.1, and NM_003063.2) as queries. Retrieved contigs from the top blast hits for each species were imported into the program Sequencher version 5.0 and manually annotated by aligning human ucp/sln exons against the individual contigs. In cases where putative exon lengths did not match those of the human loci, exon/intron boundary splice sites were identified following the GT-AG rule (67). For fragmentary and highly degraded ucp1 pseudogenes (for example, armadillo, pangolin, hyrax, and sloth), we generated dot plots versus ucp1 mRNA sequences of closely related species using the EMBOSS:dotmatcher feature in Geneious R6.1 to identify exons. Linear comparison figures illustrating coding regions of these genes were prepared using Easyfig 2.1 (68).
The synteny of ucp1 is highly conserved among vertebrates with ucp1 located between the upstream tbc1d9 and downstream elmod2 loci (13, 65). Thus, wherever possible, exons of these flanking genes were annotated on ucp1-containing contigs to ensure our annotated genes are ucp1 orthologs. For example, a gene fragment (exon 6) housed on GenBank contig ABDV02364175.1 of Hoffman’s two-toed sloth (Choloepus hoffmanni) was on the same contig (7.6-kb upstream) from elmod2 and thus positively identified as ucp1.
Finally, discontiguous megablasts against the National Center for Biotechnology Information sequence read archive (SRA) database were performed for the woolly mammoth (Mammuthus primigenius), donkey (Equus asinus), fin whale (Balaenoptera physalus), and snow leopard (Panthera uncia) using queries of known ucp coding sequences from the nearest phylogenetic relative (listed below). Retrieved SRAs were imported into Sequencher and assembled against respective reference ucp contigs of the African elephant (Loxodonta africana), horse (Equus caballus), minke whale (Balaenoptera acutorostrata), and tiger (Panthera tigris altaica) to generate consensus ucp1, ucp2, ucp3, and sln coding sequences.
DNA amplification and Sanger sequencing
The African elephant ucp1 sequence on GenBank exhibited a 1-bp frameshift deletion in exon 3 (incorrectly annotated on Ensembl). We thus verified this deletion in both African and Asian elephant (Elephas maximus) DNA samples via PCR and Sanger sequencing techniques. PCR was also used to obtain ucp1 sequences from the three-toed brown-throated sloth (B. variegatus), silky anteater (Cyclopes didactylus), bowhead whale (Balaena mysticetus), Grant’s zebra (Equus quagga boehmi), black rhinoceros (Diceros bicornis), and Indian rhinoceros (Rhinoceros unicornis). Specimen information is provided in table S7 (64, 69–71).
Genomic DNA extractions were performed using the DNeasy Blood and Tissue Kit (Qiagen). For the bowhead whale sample, a whole-genome amplification was performed using the REPLI-g Mini Kit (Qiagen) following the manufacturer’s directions before PCR amplification to increase the amount of available DNA. Primers were designed to target each of the six individual ucp1 exons from the available draft genome of the nearest phylogenetic relative using the Primer Premier 5.0 software. PCRs were performed using 2 U of OneTaq DNA polymerase (New England Biolabs) in 20 μl of reactions using the following thermal cycling profile: initial denaturation at 94°C for 2 min 30 s, followed by 35 cycles at 94°C (denaturation) for 30 s, 48° to 62°C (annealing) for 30 s and 68°C (extension) for 30 s, followed by a final extension of 5 min at 68°C. Products were visualized on 1.5% agarose gels. In cases where this protocol did not result in a distinct amplification product, nested or heminested PCRs were performed using aliquots of the initial amplification reactions as template DNA. Distinct bands of appropriate size were excised from agarose gels and purified using the GeneJET Gel Extraction Kit (Fermentas). The purified PCR products were either sequenced directly or cloned into pDrive cloning vectors (Qiagen) and transformed into Escherichia coli plasmids (New England Biolabs). Clones were grown overnight on agar plates at 37°C. Positive clones were identified using a blue-white screening technique, followed by PCR amplification and visualization of the targeted DNA by gel electrophoresis. Cells containing inserts of the correct size were grown overnight in LB culture medium, and the DNA was subsequently purified using the Zyppy Plasmid Miniprep Kit (Zymo Research). Sequencing reactions were conducted using the BigDye Terminator v3.1 Cycle Sequencing Kit (Applied Biosystems) as per the manufacturer’s directions. Sequencing reactions were purified using the Zymo Research DNA Sequencing Clean-up Kit (Zymo Research) and sequenced in both directions with an Applied Biosystems 3130 Genetic Analyzer.
DNA hybridization capture and next-generation sequencing
Methods for obtaining ucp1, ucp2, ucp3, and sln sequences from the dugong (Dugong dugon) and recently extinct Steller’s sea cow (H. gigas) are detailed elsewhere (64, 70). Briefly, barcoded DNA libraries suitable for Illumina sequencing were prepared from dugong and Steller’s sea cow DNA extracts and hybridized to Agilent SureSelect Capture arrays imprinted with the coding region (plus 25 to 30 bp of flanking sequence for each exon) of African elephant ucp1, ucp2, ucp3, and sln sequences. Eluted DNA fragments were sequenced on Illumina GAIIx and HiSeq 2500 genome analyzers and trimmed of adapter sequences, and those <20 bp were removed from the data set (64). Remaining reads were assembled to manatee reference sequences using Geneious. The Steller’s sea cow assemblies were manually examined for C→U[T] and G→A DNA damage artifacts (72), with any polymorphic C/T or G/A sites subsequently scored as C or G; nonpolymorphic C→T or G→A changes relative to dugong or manatee sequences were treated as genuine (64).
For pygmy hippopotamus (Choeropsis liberiensis) and beluga (Delphinapterus leucas), genomic DNA was extracted using the DNeasy Blood and Tissue kit (Qiagen). Three micrograms of genomic DNA was sheared into fragments with the highest concentration at ~180 to 190 bp using a Bioruptor (Diagenode), followed by treatment with the PreCR Repair Mix (New England Biolabs). The SureSelectXT Target Enrichment System for the Illumina Paired-End Sequencing Library kit (Agilent) was used for library construction and target enrichment. Target enrichment was done with a custom-designed SureSelect biotinylated RNA library that included cow ucp1, ucp2, and ucp3 sequences. Target-enriched libraries were paired-end 2 × 100 sequenced on an Illumina HiSeq 2500 platform at the University of California, Riverside Institute for Integrative Genome Biology Genomics Core. Per base quality distributions of demultiplexed fastq files were visualized for both read pair files using FastQC v.0.10.0 (www.bioinformatics.babraham.ac.uk/projects/fastqc/) with the no group setting. On the basis of these results, FASTX-Toolkit v.0.0.13.2 (http://hannonlab.cshl.edu/fastx_toolkit/index.html) was used to trim the first three bases and the last base, which resulted in 97-bp reads. Reads with all but three identical bases or a quality score below 30 at any base position were then filtered out. PRINSEQ lite v.0.20.4 (73) was then used to find read pairs that passed the filtering conditions. These read pairs were then interleaved into a single file using the ShuffleFastq script in RACKJ v.0.95 (http://rackj.sourceforge.net/Scripts/index.html#ShuffleFastq).
DNA libraries were also constructed for the Malayan tapir (Tapirus indicus), black rhinoceros (D. bicornis), Indian rhinoceros (R. unicornis), Sumatran rhinoceros (Dicerorhinus sumatrensis), and the extinct woolly rhinoceros (Coelodonta antiquitatis). Briefly, previously extracted genomic DNA samples of the black and Indian rhinoceroses (see above) were amplified using the REPLI-g Mini Kit (Qiagen) to increase the quantity of available DNA. DNA fragments were then enzymatically sheared using NEBNext dsDNA Fragmentase (New England Biolabs), and libraries were created using NEXTFlex barcoded adaptors and a NEBNext Fast DNA Library Prep Set for Ion Torrent (New England Biolabs) following the manufacturer’s protocol. The DNeasy Blood and Tissue Kit (Qiagen) was used to perform extractions from Malayan tapir and Sumatran rhinoceros blood samples, whereas ancient DNA was extracted from three woolly rhinoceros bone samples in an ancient DNA dedicated laboratory following the methods described by Dabney et al. (74). DNA libraries were constructed for these species using a NEBNext DNA Library Prep Master Mix Set for 454 (New England Biolabs). All libraries were then size-selected using an E-gel iBase (Invitrogen) and target-enriched using biotinylated 120-mer MyBaits RNA probes (Mycroarray) designed with a 4× tilling pattern from the draft genome of the white rhinoceros (Ceratotherium simum) following the manufacturer’s protocol. Enriched DNA libraries were then amplified in 25 μl of PCR cocktails with the following thermocycling profile: initial denaturation of 98°C for 30 s, 14 to 20 cycles of 98°C for 20 s (denaturation), 58°C for 30 s (annealing), and 72°C for 30 s (extension), followed by a final extension period of 72°C for 5 min. Libraries were sequenced at the University of Manitoba on an Ion Torrent PGM platform using the Ion PGM Hi-Q Sequencing Kit and Ion 314 v2 and Ion 318 v2 barcoded chips (Applied Biosystems). Sequenced reads were assembled to white rhinoceros ucp1, ucp2, ucp3, and sln reference sequences in Geneious R7.1.9 at 20% maximum mismatch to build consensus sequences. Ancient DNA reads from the woolly rhinoceros libraries were examined for C→T and G→A mutations as described above for the Steller’s sea cow.
UCP coding sequence alignments
Translated ucp coding sequence files were created for each species and all sequences visually examined for nonsense, insertion or deletion frameshift, start codon, termination codon, and splice site mutations. Multiple nucleotide sequence alignments were constructed for ucp1, ucp2, and ucp3 data sets, both individually and combined, using the program MUSCLE 3.6 (75), and manually adjusted to eliminate ambiguous regions. The single ucp1 sequence retrieved from the SRA database of the Darwin’s ground sloth (Mylodon darwinii) was deemed to be too short for selection pressure analyses and therefore excluded from the final ucp1 alignment. Insertions unique to fish (9 bp), marsupials (12 bp), and Canis lupus familiaris (6 bp) were also excluded from the ucp1 alignment. The final ucp1 alignment included 141 species and totaled 936 bp in length (data file S6). The ucp2 alignment included 131 species and totaled 948 bp in length (data file S7), the ucp3 alignment included 128 species and totaled 936 bp in length (data file S8), whereas the combined ucp1-ucp2-ucp3 alignment included 400 loci and totaled 983 bp in length.
UCP gene tree analysis
To further ensure all ucp sequences were correctly assigned, a maximum likelihood ucp1-ucp2- ucp3 tree was constructed with the RAxML 7.2.8 plugin in Geneious using the GTR + Γ option (fig. S1). The ucp tree was generated starting with a randomized tree and 500 bootstrap replicates using the “rapid bootstrapping setting and search for the best-scoring ML tree” parameter.
Species tree analysis
We constructed a species tree for 136 mammals and four outgroups [western clawed frog (Xenopus tropicalis), Carolina anole (Anolis carolinensis), red junglefowl (Gallus gallus), and zebrafinch (Taeniopygia guttata)] on the basis of a supermatrix for 30 nuclear (A2AB, ADRB2, APP, ATP7A, Adora3, ApoB, BCHE, BDNF, BMI1, BRCA1, BRCA2, CHRNA1, CMYC, CNR1, CREM, DMP1, ENAM, EDG1, FBN1, GHR, IRBP, MC1R, PLCB4, PNOC, Rag1, Rag2, SWS1, TTN, TYR1, and VWF) and 11 mitochondrial genes (12S rRNA, 16S rRNA, CYTB, COI, COII, COIII, ND1, ND2, ND3, ND4, and ND5). Sequences were obtained from GenBank, Ensembl, PreEnsembl, and other genomic resources (that is, www.gigadb.org for Ursus maritimus and Pantholops hodgsonii and www.bowhead-whale.org for Balaena mysticetus) and were culled from larger sequence alignments for all available mammalian species. Accession numbers, scaffold numbers, etc. are given in data file S9. Alignment-ambiguous regions were excluded before phylogenetic analysis. Additional sites with missing data/gaps for our reduced set of species were removed in RAxML. The final alignment comprises 50,879 bp (data file S10). A species tree was obtained with RAxML-HPC2 on XSEDE (RAxML version 8.1.11) on CIPRES (76). The RAxML analysis was performed with 32 partitions, each of which was given its own GTR + Γ model of sequence evolution. The 32 partitions included one for each of 30 nuclear genes, one for the 12S rRNA + 16S rRNA, and one for the nine mitochondrial protein-coding genes. We used the GTRGAMMA model for both rapid bootstrap analysis (500 bootstrap iterations) and a search for the best ML tree.
Timetree analyses
Timetree analyses were performed on the 41-gene supermatrix tree with the MCMCTree program in PAML 4.5 (27), which implements the MCMC algorithms of Rannala and Yang (77). Analyses were performed with the autocorrelated rates model. Each of 32 partitions (see above) was allowed to have its own GTR + Γ model of sequence evolution. We set one time unit = 100 million years (My). Analyses were run with cleandata = 0. Shape (α) and scale (β) parameters for the gamma prior of the overall rate parameter μ (that is, rgene_gamma in mcmctree) were 1 and 4.74, respectively. Calculations for the shape and scale parameters of the gamma prior for the rate-drift parameter (that is, sigma2_gamma in mcmctree) assumed an age of 344 Ma for the most recent common ancestor of Tetrapoda [average of minimum and maximum constraints in Benton et al. (78)]. Chains were run for 100,000 generations after a burn-in of 10,000 generations and were sampled every 20 generations. We used hard-bounded constraints for 37 nodes including the root node (Tetrapoda). Minimum ages were based on the oldest crown fossils that are assignable to each clade, whereas maximum ages were based on stratigraphic bounding, phylogenetic bracketing, and phylogenetic uncertainty (46, 64, 79, 80). Stratigraphic bounds were extended by one stage for younger deposits (Late Miocene, Pliocene, and Pleistocene) and two stages for older deposits (Middle Miocene and earlier). Minimum and maximum constraints (53, 64, 78, 81–162) are summarized in table S8. Stage boundaries are from the International Chronostratigraphic Chart v.2014/02 (www.stratigraphy.org) (163).
Evolutionary selection pressure and inactivation analyses
The CODEML program in the PAML 4.8 software package (27) was used to estimate the nonsynonymous/synonymous substitution rate ratio (dN/dS or ω value) to infer the modes of natural selection acting upon the three ucp loci. All frameshift insertions in the alignments were deleted, and nonsense mutations were recoded as missing data before analysis. Our constructed species tree was used to guide the phylogeny of all CODEML runs with outgroup fish species added to the guide tree following the phylogenetic relationships described by Near et al. (164). All CODEML runs were performed using the F3x4 codon frequency model. The free-ratio (M1) model, which calculates an independent ω value for every branch of the tree, was performed for all three ucp alignments (data files S6 to S8). Results of this analysis for ucp1 were used as a starting point to target specific lineages later tested with the branch (M2) model for neutral evolution or positive selection. Target lineages for these analyses included the stem placental branch, the stem pinniped branch, the stem rhinoceros branch, the pygmy hippo branch, the camel branch, and all pseudogenic ucp1 branches. Individual M2 branch models for the stem placental, pinniped, rhinoceros, pygmy hippo, and camel branches were performed using the same branch categories described below for the ucp1 pseudogene analysis plus an additional branch category to target the lineage(s) of interest. Likelihood ratio tests (table S2) were then performed against the ucp1 pseudogene M2 branch model to test whether the obtained ω values were significantly different from all functional placental branches. The M2 models were run with the method = 0 setting, which simultaneously calculates all branch lengths.
Branch site analyses were also performed to identify potential amino acids under positive selection that may have contributed to the gain of nonshivering thermogenic function of ucp1 in a stem placental ancestor. Here, the stem placental branch of the species tree was set to the foreground, whereas all others were background branches. To reduce the possibility of signatures of neutral evolution skewing the results, pseudogenes were not included in this analysis, resulting in a data set of 115 species. The branch site MA model, under the Bayes empirical Bayes method, resulted in the identification of eight sites with a posterior probability >0.95 being greater than one (table S2). However, when tested against the null model, where the ω values of positively selected sites under the MA model are fixed at neutrality (ω = 1), the likelihood ratio test demonstrated that ω values for these sites were not significantly greater than 1 (2Δℓ = 0.706; df = 1; P = 0.400).
For each ucp1 pseudogenization event, we calculated the transition point from purifying selection to neutral evolution following the method and equations of Meredith et al. (28). The ucp1 inactivations are considered to have occurred at or following this date. Branches were first divided into three categories: functional, transitional (mixed), and pseudogenic. Functional branches are those that lead to internal or terminal nodes with an intact copy of ucp1 and presumably evolved under functional constraints. Transitional branches record the first evidence of ucp1 pseudogenization (for example, stop codon, frameshift mutation) and are deemed to contain both functional and pseudogenic segments that evolved under purifying selection and neutral evolution, respectively. Pseudogenic branches postdate mixed branches and are expected to have dN/dS values at or near the neutral value of 1 in the absence of purifying or positive selection (28). In taxonomic clades where all members share inactivating ucp1 mutations (that is, Cetacea, Equidae, Proboscidea, Sirenia, and Pilosa), the transitional branches were deemed to be immediately ancestral to the radiation of the clade. The guide tree was labeled to calculate the ω values for all functional nonmammalian vertebrate branches, all functional nonplacental mammalian branches, all functional placental mammal branches, and all pseudogenic placental mammal branches as distinct branch categories as well as each individual transitional branch using the M2 branch model. The equations developed by Meredith et al. (28) were used to estimate the transition dates from purifying selection to neutral evolution of ucp1 along transitional branches using our the upper and lower nodes for each branch from our time-calibrated phylogeny (data file S1).
Paleotemperature calculations
We used stable oxygen isotope (δ18O) values (‰) of benthic foraminifera [fig. S3 data set of Friedrich et al. (165)] as a proxy for global temperature over the last ~82 My (see Fig. 3). Within this window, paleotemperatures were calculated (166) from the Cretaceous to Oligocene as temperature (°C) = 16.5 − 4.8(δc − δw), where δc is the measured δ18O value of foraminifera calcite and δw (−1.0 ‰) is the estimated value for an ice-free ocean (167).
Fossil body mass and diversity
Fossil body mass estimates recorded at each geological stage for Cetacea, Sirenia, Proboscidea, Hyracoidea, and Equidae were assembled from the literature (41, 50, 51, 168–184) (data file S3). We also downloaded all species occurrence records for these eutherian clades from each geological stage ranging from the Selandian to the Holocene from the Paleobiology database (www.fossilworks.org) and other literature sources (41, 43, 168, 175, 182, 185–197). Species and genera counts were then plotted for the median date of each stage (data file S3). Owing to fragmentary fossil records and few body mass estimates for early Xenarthra, Pholidota, and Suidae, these groups were not included in these analyses.
Diversification analysis
We selected five fully resolved timetrees (numbers 1, 101, 201, 301, and 401) from Faurby and Svenning (56) to allow for phylogenetic uncertainty. Each of these trees included all extant mammalian species plus late Quaternary extinct mammals. We pruned all nonplacental taxa from these trees. For the remaining placentals, we only retained extant taxa and recently extinct taxa that are included in the work of Wilson and Reeder (198). After pruning, our trees comprised 5138 placental species. The presence versus absence of a functional copy of ucp1 was inferred from the condition of the gene in the closest relative for which there is DNA sequence evidence, supplemented by evidence from shared mutations and our estimates for inactivation times of ucp1 in UCP1-minus lineages. For example, molecular data provide evidence for inactivation of ucp1 in representatives of all three clades of Xenarthra (armadillos, anteaters, and sloths), and our inactivation date for this gene is estimated in the latest Cretaceous. We therefore coded all xenarthrans as UCP1-minus. Similarly, diverse rodent and bat taxa with genome sequences all have intact copies of ucp1. On the basis of this evidence, and the general absence of very large rodents and bats, we coded all extant rodent and bat species as UCP1-plus. Data file S3 contains all of the inferred character states for ucp1 that were used in our diversification analyses, which were performed with the BiSSE method (55) as implemented in diversitree in R (57). We compared two diversification models, each of which fixed the transition rate from UCP1-minus to UCP1-plus at zero given the absence of empirical evidence for such transitions and the low probability of resuscitating a functional copy of a gene from an inactivated copy with frameshift and/or premature stop codon mutations. The first model allowed for separate speciation (λ) and extinction (μ) rates in UCP1-plus taxa versus UCP1-minus taxa, whereas the second model constrained equal diversification rates in UCP1-plus taxa and UCP1-minus taxa (that is, λ0 = λ1, μ0 = μ1). Simulations with neutral characters were performed with the same five trees from Faurby and Svenning (56). We performed 20 simulations for each of these trees (total, 100) and used the same q01 transition rates that were inferred from analyses with the UCP1 data (table S4).
Supplementary Material
Acknowledgments
We thank S. Petersen, J. Gatesy, C. Y. Hayashi, R. D. E. MacPhee, E. Willerslev, M. Bertelsen, R. Havmøller, and T. Gilbert for providing tissue samples, O. Friedrich for assistance with δ18O isotope to temperature conversions, and M. Uhen and F. Smith for providing access to the MAMMOTH v1.5 database. Authorization to use paintings by C. Buell was provided by J. Gatesy. Funding: This work was supported by Natural Sciences and Engineering Research Council of Canada (NSERC) Discovery Grants to K.L.C. (238838) and J.R.T. (418503), an NSERC Discovery Accelerator Supplement to K.L.C. (412336), the Canada Research Chairs program to J.R.T. (950-223744), a German Center for Diabetes Research (DZD) grant to M.J., and an NSF grant (DEB-1457735) to M.S.S. M.J.G. was funded in part by a University of Manitoba Undergraduate Research Award, a University of Manitoba Graduate Fellowship, and a Manitoba Graduate Fellowship. J.L.A.P. was funded, in part, by a Natural Environment Research Council student fellowship and the University of York. A.V.S. was funded, in part, by an NSERC Alexander Graham Bell Canada Graduate Scholarship-Doctoral Program. Author contributions: M.J.G. conceived the project, designed the research, conducted the experiments, performed selection and dating analysis, interpreted the results, prepared the figures, and assisted with manuscript writing; K.L.C. conceived the project, designed the research, interpreted the results, prepared the figures, and drafted the manuscript; M.J., J.R.T., and M.H. designed the research and interpreted the results; J.S., J.L.A.P., N.W., and A.V.S. conducted the hybridization capture and sequencing experiments; M.S.S. performed phylogenetic, timetree, selection, and diversification analyses, interpreted the results, and assisted with manuscript writing; All authors discussed the results and helped revise the manuscript. Competing interests: The authors declare that they have no competing interests. Data and materials availability: New sequences obtained in this study are archived at GenBank (accession numbers KY886638 to KY886677). All data needed to evaluate the conclusions in the paper are present in the paper and/or the Supplementary Materials. Additional data related to this paper may be requested from the authors.
SUPPLEMENTARY MATERIALS
Supplementary material for this article is available at http://advances.sciencemag.org/cgi/content/full/3/7/e1602878/DC1
fig. S1. Schematic maximum-likelihood tree of ucp sequences used in this study (n = 400).
fig. S2. Exon alignments depicting deleterious mutations found in UCP1 sequences of placental mammal taxa.
fig. S3. Ribbon diagram of residues 13 to 304 of human UCP1 (UniProt accession number P25874) structurally modeled by SWISS-MODEL.
fig. S4. Amino acid alignment of vertebrate sln.
table S1. GenBank accession numbers of species used in this study.
table S2. Likelihood ratio tests for ucp1 CODEML models.
table S3. Calculated ucp1 inactivation dates (Ma) within the placental mammal lineage.
table S4. Results of BiSSE models with and without constraints on the diversification rate for five trees from the work of Faurby and Svenning (56).
table S5. BiSSE results for neutral character simulations.
table S6. Deleterious mutations found in ucp2 and ucp3 sequences of placental mammal taxa.
table S7. Specimen data and sources of tissue samples used for PCR amplification and DNA hybridization capture.
table S8. Fossil constraints used in timetree analysis.
data file S1. Gene partitions, a maximum likelihood phylogram, and mcmctree (text file).
data file S2. ucp1 free ratio model (text file).
data file S3. Fossil body mass, taxon diversity, and UCP1 diversification codings (Excel file).
data file S4. ucp2 free ratio model (Text file).
data file S5. ucp3 free ratio model (Text file).
data file S6. ucp1 coding sequence alignment (Fasta file).
data file S7. ucp2 coding sequence alignment (Fasta file).
data file S8. ucp3 coding sequence alignment (Fasta file).
data file S9. Accession numbers for the 41 loci used to construct the 51-kb maximum likelihood species tree (Fasta file).
data file S10. A 51-kb alignment (41 genes) for 140 vertebrate species (Text file).
REFERENCES AND NOTES
- 1.Nicholls D. G., Locke R. M., Thermogenic mechanisms in brown fat. Physiol. Rev. 64, 1–64 (1984). [DOI] [PubMed] [Google Scholar]
- 2.Heaton G. M., Wagenvoord R. J., Kemp A. Jr., Nicholls D. G., Brown adipose tissue mitochondria: Photoaffinity labelling of the regulatory site of energy dissipation. Eur. J. Biochem. 82, 515–521 (1978). [DOI] [PubMed] [Google Scholar]
- 3.Cannon B., Nedergaard J., Brown adipose tissue: Function and physiological significance. Physiol. Rev. 84, 277–359 (2004). [DOI] [PubMed] [Google Scholar]
- 4.Rafael J., Vsiansky P., Heldmaier G., Increased contribution of brown adipose tissue to nonshivering thermogenesis in the Djungarian hamster during cold-adaptation. J. Comp. Physiol. B 155, 717–722 (1985). [DOI] [PubMed] [Google Scholar]
- 5.Sakurai Y., Okamatsu-Ogura Y., Saito M., Kimura K., Nakao R., Ohnuma A., Kobayashi M., Brown adipose tissue expresses uncoupling protein 1 in newborn harbor seals (Phoca vitulina). Mar. Mamm. Sci. 31, 818–827 (2015). [Google Scholar]
- 6.Cannon B., Houstek J., Nedergaard J., Brown adipose tissue: More than an effector of thermogenesis? Ann. N. Y. Acad. Sci. 856, 171–187 (1998). [DOI] [PubMed] [Google Scholar]
- 7.Feldmann H. M., Golozoubova V., Cannon B., Nedergaard J., UCP1 ablation induces obesity and abolishes diet-induced thermogenesis in mice exempt from thermal stress by living at thermoneutrality. Cell Metab. 9, 203–209 (2009). [DOI] [PubMed] [Google Scholar]
- 8.Stier A., Bize P., Habold C., Bouillaud F., Massemin S., Criscuolo F., Mitochondrial uncoupling prevents cold-induced oxidative stress: A case study using UCP1 knockout mice. J. Exp. Biol. 217, 624–630 (2014). [DOI] [PubMed] [Google Scholar]
- 9.Golozoubova V., Hohtola E. S. A., Matthias A., Jacobsson A., Cannon B., Nedergaard J., Only UCP1 can mediate adaptive nonshivering thermogenesis in the cold. FASEB J. 15, 2048–2050 (2001). [DOI] [PubMed] [Google Scholar]
- 10.Petruzzelli M., Schweiger M., Schreiber R., Campos-Olivas R., Tsoli M., Allen J., Swarbrick M., Rose-John S., Rincon M., Robertson G., Zechner R., Wagner E. F., A switch from white to brown fat increases energy expenditure in cancer-associated cachexia. Cell Metab. 20, 433–447 (2014). [DOI] [PubMed] [Google Scholar]
- 11.Rosen E. D., Spiegelman B. M., What we talk about when we talk about fat. Cell 156, 20–44 (2014). [DOI] [PMC free article] [PubMed] [Google Scholar]
- 12.Jastroch M., Wuertz S., Kloas W., Klingenspor M., Uncoupling protein 1 in fish uncovers an ancient evolutionary history of mammalian nonshivering thermogenesis. Physiol. Genomics 22, 150–156 (2005). [DOI] [PubMed] [Google Scholar]
- 13.Saito S., Saito C. T., Shingai R., Adaptive evolution of the uncoupling protein 1 gene contributed to the acquisition of novel nonshivering thermogenesis in ancestral eutherian mammals. Gene 408, 37–44 (2008). [DOI] [PubMed] [Google Scholar]
- 14.Hughes D. A., Jastroch M., Stoneking M., Klingenspor M., Molecular evolution of UCP1 and the evolutionary history of mammalian non-shivering thermogenesis. BMC Evol. Biol. 9, 4 (2009). [DOI] [PMC free article] [PubMed] [Google Scholar]
- 15.O’Leary M. A., Bloch J. I., Flynn J. J., Gaudin T. J., Giallombardo A., Giannini N. P., Goldberg S. L., Kraatz B. P., Luo Z.-X., Meng J., Ni X., Novacek M. J., Perini F. A., Randall Z. S., Rougier G. W., Sargis E. J., Silcox M. T., Simmons N. B., Spaulding M., Velazco P. M., Weksler M., Wible J. R., Cirranello A. L., The placental mammal ancestor and the post–K-Pg radiation of placentals. Science 339, 662–667 (2013). [DOI] [PubMed] [Google Scholar]
- 16.Lovegrove B. G., The evolution of endothermy in Cenozoic mammals: A plesiomorphic-apomorphic continuum. Biol. Rev. Camb. Philos. Soc. 87, 128–162 (2012). [DOI] [PubMed] [Google Scholar]
- 17.Rowlatt U., Mrosovsky N., English A., A comparative survey of brown fat in the neck and axilla of mammals at birth. Biol. Neonate 17, 53–83 (1971). [DOI] [PubMed] [Google Scholar]
- 18.Oelkrug R., Heldmaier G., Meyer C. W., Torpor patterns, arousal rates, and temporal organization of torpor entry in wildtype and UCP1-ablated mice. J. Comp. Physiol. B 181, 137–145 (2011). [DOI] [PubMed] [Google Scholar]
- 19.Oelkrug R., Goetze N., Exner C., Lee Y., Ganjam G. K., Kutschke M., Müller S., Stöhr S., Tschöp M. H., Crichton P. G., Heldmaier G., Jastroch M., Meyer C. W., Brown fat in a protoendothermic mammal fuels eutherian evolution. Nat. Commun. 4, 2140 (2013). [DOI] [PMC free article] [PubMed] [Google Scholar]
- 20.Heldmaier G., Zitterfreie wärmebildung und körpergröße bei säugetieren. Z. Vergl. Physiol. 73, 222–247 (1971). [Google Scholar]
- 21.Oelkrug R., Polymeropoulos E. T., Jastroch M., Brown adipose tissue: Physiological function and evolutionary significance. J. Comp. Physiol. B 185, 587–606 (2015). [DOI] [PubMed] [Google Scholar]
- 22.Alexander G., Bennett J. W., Gemmell R. T., Brown adipose tissue in the new-born calf (Bos taurus). J. Physiol. 244, 223–234 (1975). [DOI] [PMC free article] [PubMed] [Google Scholar]
- 23.Pearson L. E., Liwanag H. E. M., Hammill M. O., Burns J. M., Shifts in thermoregulatory strategy during ontogeny in harp seals (Pagophilus groenlandicus). J. Therm. Biol. 44, 93–102 (2014). [DOI] [PubMed] [Google Scholar]
- 24.Fisher D. C., Tikhonov A. N., Kosintsev P. A., Rountrey A. N., Buigues B., van der Plicht J., Anatomy, death, and preservation of a woolly mammoth (Mammuthus primigenius) calf, Yamal Peninsula, northwest Siberia. Quat. Int. 255, 94–105 (2012). [Google Scholar]
- 25.Berg F., Gustafson U., Andersson L., The uncoupling protein 1 gene (UCP1) is disrupted in the pig lineage: A genetic explanation for poor thermoregulation in piglets. PLOS Genet. 2, e129 (2006). [DOI] [PMC free article] [PubMed] [Google Scholar]
- 26.Rothwell N. J., Stock M. J., Biological distribution and significance of brown adipose tissue. Comp. Biochem. Physiol. 82, 745–751 (1985). [DOI] [PubMed] [Google Scholar]
- 27.Yang Z., PAML 4: Phylogenetic analysis by maximum likelihood. Mol. Biol. Evol. 24, 1586–1591 (2007). [DOI] [PubMed] [Google Scholar]
- 28.Meredith R. W., Gatesy J., Murphy W. J., Ryder O. A., Springer M. S., Molecular decay of the tooth gene enamelin (ENAM) mirrors the loss of enamel in the fossil record of placental mammals. PLOS Genet. 5, e1000634 (2009). [DOI] [PMC free article] [PubMed] [Google Scholar]
- 29.B. K. McNab, Energetics, population biology, and distribution of xenarthrans, living and extinct, in The Evolution and Ecology of Armadillos, Sloths and Vermilinguas, G. G. Montgomery, Ed. (Smithsonian Institution Press, 1985), pp. 219–232. [Google Scholar]
- 30.Heath M. E., Hammel H. T., Body temperature and rate of O2 consumption in Chinese pangolins. Am. J. Physiol. 250, R377–R382 (1986). [DOI] [PubMed] [Google Scholar]
- 31.Morrison P. R., Acquired homiothermism in the pregnant sloth. J. Mammal. 26, 272–275 (1945). [PubMed] [Google Scholar]
- 32.Superina M., Boily P., Hibernation and daily torpor in an armadillo, the pichi (Zaedyus pichiy). Comp. Biochem. Physiol. A Mol. Integr. Physiol. 148, 893–898 (2007). [DOI] [PubMed] [Google Scholar]
- 33.McNab B. K., Metabolic scaling: Energy constraints on carnivore diet. Nature 407, 584–584 (2000). [DOI] [PubMed] [Google Scholar]
- 34.Meyer C. W., Willershäuser M., Jastroch M., Rourke B. C., Fromme T., Oelkrug R., Heldmaier G., Klingenspor M., Adaptive thermogenesis and thermal conductance in wild-type and UCP1-KO mice. Am. J. Physiol. 299, R1396–R1406 (2010). [DOI] [PMC free article] [PubMed] [Google Scholar]
- 35.Scholander P. F., Evolution of climatic adaptation in homeotherms. Evolution 9, 15–26 (1955). [Google Scholar]
- 36.Pant S. R., Goswami A., Finarelli J. A., Complex body size trends in the evolution of sloths (Xenarthra: Pilosa). BMC Evol. Biol. 14, 184 (2014). [DOI] [PMC free article] [PubMed] [Google Scholar]
- 37.McDonald H. G., Harington C. R., De Iuliis G., The ground sloth Megalonyx from Pleistocene deposits of the Old Crow Basin, Yukon, Canada. Arctic 53, 213–220 (2000). [Google Scholar]
- 38.De Muizon C., McDonald H. G., An aquatic sloth from the Pliocene of Peru. Nature 375, 224–227 (1995). [Google Scholar]
- 39.Janis C. M., Tertiary mammal evolution in the context of changing climates, vegetation, and tectonic events. Annu. Rev. Ecol. Syst. 24, 467–500 (1993). [Google Scholar]
- 40.Lovegrove B. G., Mowoe M. O., The evolution of mammal body sizes: Responses to Cenozoic climate change in North American mammals. J. Evol. Biol. 26, 1317–1329 (2013). [DOI] [PubMed] [Google Scholar]
- 41.Gheerbrant E., Paleocene emergence of elephant relatives and the rapid radiation of African ungulates. Proc. Natl. Acad. Sci. U.S.A. 106, 10717–10721 (2009). [DOI] [PMC free article] [PubMed] [Google Scholar]
- 42.E. Gheerbrant, D. P. Domning, P. Tassy, Paenungulata (Sirenia, Proboscidea, Hyracoidea, and relatives), in The Rise of Placental Mammals: Origins and Relationships of the Major Extant Clades, K. D. Rose, J. D. Archibald, Eds. (Johns Hopkins Univ. Press, 2005), pp. 84–105. [Google Scholar]
- 43.Barrow E., Seiffert E. R., Simons E. L., A primitive hyracoid (Mammalia, Paenungulata) from the early Priabonian (late Eocene) of Egypt. J. Syst. Palaeontol. 8, 213–244 (2010). [Google Scholar]
- 44.Guthrie R. D., Rapid body size decline in Alaskan Pleistocene horses before extinction. Nature 426, 169–171 (2003). [DOI] [PubMed] [Google Scholar]
- 45.Orliac M. J., Pierre-Olivier A., Ducrocq S., Phylogenetic relationships of the Suidae (Mammalia, Cetartiodactyla): New insights on the relationships within Suoidea. Zool. Scripta 39, 315–330 (2010). [Google Scholar]
- 46.Meredith R. W., Janečka J. E., Gatesy J., Ryder O., Fisher C. A., Teeling E. C., Goodbla A., Eizirik E., Simão T. L. L., Stadler T., Rabosky D. L., Honeycutt R. L., Flynn J. J., Ingram C. M., Steiner C., Williams T. L., Robinson T. J., Burk-Herrick A., Westerman M., Ayoub N. A., Springer M. S., Murphy W. J., Impacts of the Cretaceous terrestrial revolution and KPg extinction on mammal diversification. Science 334, 521–524 (2011). [DOI] [PubMed] [Google Scholar]
- 47.Irving L., Peyton L. J., Monson M., Metabolism and insulation of swine as bare-skinned mammals. J. Appl. Physiol. 9, 421–426 (1956). [DOI] [PubMed] [Google Scholar]
- 48.Hashimoto O., Ohtsuki H., Kakizaki T., Amou K., Sato R., Doi S., Kobayashi S., Matsuda A., Sugiyama M., Funaba M., Matsuishi T., Terasawa F., Shindo J., Endo H., Brown adipose tissue in cetacean blubber. PLOS ONE 10, e0116734 (2015). [DOI] [PMC free article] [PubMed] [Google Scholar]
- 49.Lewis K. N., Soifer I., Melamud E., Roy M., McIsaac R. S., Hibbs M., Buffenstein R., Unraveling the message: Insights into comparative genomics of the naked mole-rat. Mamm. Genome 27, 259–278 (2016). [DOI] [PMC free article] [PubMed] [Google Scholar]
- 50.Bajpai S., Gingerich P. D., A new Eocene archaeocete (Mammalia, Cetacea) from India and the time of origin of whales. Proc. Natl. Acad. Sci. U.S.A. 95, 15464–15468 (1998). [DOI] [PMC free article] [PubMed] [Google Scholar]
- 51.P. D. Gingerich, Paleobiological perspectives on Mesonychia, Archaeoceti, and the origin of whales, in The Emergence of Whales: Evolutionary Patterns in the Origin of Cetacea, J. G. M. Thewissen, Ed. (Plenum, 1998), pp. 423–449. [Google Scholar]
- 52.Domning D. P., The readaptation of Eocene sirenians to life in water. Hist. Biol. 14, 115–119 (2000). [Google Scholar]
- 53.Uhen M. D., The origin(s) of whales. Annu. Rev. Earth Planet. Sci. 38, 189–219 (2010). [Google Scholar]
- 54.Bokma F., Godinot M., Maridet O., Ladevèze S., Costeur L., Solé F., Gheerbrant E., Peigné S., Jacques F., Laurin M., Testing for Depéret’s Rule (body size increase) in mammals using combined extinct and extant data. Syst. Biol. 65, 98–108 (2016). [DOI] [PMC free article] [PubMed] [Google Scholar]
- 55.Maddison W. P., Midford P. E., Otto S. P., Estimating a binary character’s effect on speciation and extinction. Syst. Biol. 56, 701–710 (2007). [DOI] [PubMed] [Google Scholar]
- 56.Faurby S., Svenning J.-C., Historic and prehistoric human-driven extinctions have reshaped global mammal diversity patterns. Divers. Distrib. 21, 1155–1166 (2015). [Google Scholar]
- 57.FitzJohn R. G., Diversitree: Comparative phylogenetic analyses of diversification in R. Methods Ecol. Evol. 3, 1084–1092 (2012). [Google Scholar]
- 58.Rabosky D. L., Goldberg E. E., Model inadequacy and mistaken inferences of trait-dependent speciation. Syst. Biol. 64, 340–355 (2015). [DOI] [PubMed] [Google Scholar]
- 59.Bal N. C., Maurya S. K., Sopariwala D. H., Sahoo S. K., Gupta S. C., Shaikh S. A., Pant M., Rowland L. A., Bombardier E., Goonasekera S. A., Tupling A. R., Molkentin J. D., Periasamy M., Sarcolipin is a newly identified regulator of muscle-based thermogenesis in mammals. Nat. Med. 18, 1575–1579 (2012). [DOI] [PMC free article] [PubMed] [Google Scholar]
- 60.Rowland L. A., Bal N. C., Kozak L. P., Periasamy M., Uncoupling protein 1 and sarcolipin are required to maintain optimal thermogenesis and loss of both systems compromises survival of mice under cold stress. J. Biol. Chem. 290, 12282–12289 (2015). [DOI] [PMC free article] [PubMed] [Google Scholar]
- 61.Nedergaard J., Golozoubova V., Matthias A., Asadi A., Jacobsson A., Cannon B., UCP1: The only protein able to mediate adaptive non-shivering thermogenesis and metabolic inefficiency. Biochim. Biophys. Acta 1504, 82–106 (2001). [DOI] [PubMed] [Google Scholar]
- 62.Pearson L. E., Liwanag H. E. M., Hammill M. O., Burns J. M., To each its own: Thermoregulatory strategy varies among neonatal polar phocids. Comp. Biochem. Physiol. A Mol. Integr. Physiol. 178, 59–67 (2014). [DOI] [PubMed] [Google Scholar]
- 63.Cardillo M., Mace G. M., Jones K. E., Bielby J., Bininda-Emonds O. R., Sechrest W., Orme C. D. L., Purvis A., Multiple causes of high extinction risk in large mammal species. Science 309, 1239–1241 (2005). [DOI] [PubMed] [Google Scholar]
- 64.Springer M. S., Signore A. V., Paijmans J. L. A., Domning D. P., Vélez-Juarbe J., Bauer C., He K., Crerar L., Campos P. F., Murphy W. J., Meredith R. M., Gatesy J., Willerslev E., MacPhee R. D. E., Hofreiter M., Campbell K. L., Interordinal gene capture, the phylogenetic position of Steller’s sea cow based on molecular and morphological data, and the macroevolutionary history of Sirenia. Mol. Phylo. Evol. 91, 178–193 (2015). [DOI] [PubMed] [Google Scholar]
- 65.Mezentseva N. V., Kumaratilake J. S., Newman S. A., The brown adipocyte differentiation pathway in birds: An evolutionary road not taken. BMC Biol. 6, 17 (2008). [DOI] [PMC free article] [PubMed] [Google Scholar]
- 66.Altschul S. F., Madden T. L., Schäffer A. A., Zhang J., Zhang Z., Miller W., Lipman D. J., Gapped BLAST and PSI-BLAST: A new generation of protein database search programs. Nucleic Acids Res. 25, 3389–3402 (1997). [DOI] [PMC free article] [PubMed] [Google Scholar]
- 67.Burset M., Seledtsov I. A., Solovyev V. V., Analysis of canonical and non-canonical splice sites in mammalian genomes. Nucleic Acids Res. 28, 4364–4375 (2000). [DOI] [PMC free article] [PubMed] [Google Scholar]
- 68.Sullivan M. J., Petty N. K., Beatson S. A., Easyfig: A genome comparison visualiser. Bioinformatics 27, 1009–1010 (2011). [DOI] [PMC free article] [PubMed] [Google Scholar]
- 69.Opazo J. C., Sloan A. M., Campbell K. L., Storz J. F., Origin and ascendency of a chimeric fusion gene: The β/δ-globin gene of paenungulate mammals. Mol. Biol. Evol. 26, 1469–1478 (2009). [DOI] [PMC free article] [PubMed] [Google Scholar]
- 70.Mirceta S., Signore A. V., Burns J. M., Cossins A. R., Campbell K. L., Berenbrink M., Evolution of mammalian diving capacity traced by myoglobin net charge. Science 340, 1234192 (2013). [DOI] [PubMed] [Google Scholar]
- 71.Springer M. S., Emerling C. A., Fugate N., Patel R., Starrett J., Morin P. A., Hayashi C., Gatesy J., Inactivation of cone-specific phototransduction genes in rod monochromatic cetaceans. Front. Ecol. Evol. 4, 61 (2016). [Google Scholar]
- 72.Briggs A. W., Stenzel U., Johnson P. L. F., Green R. E., Kelso J., Prüfer K., Meyer M., Krause J., Ronan M. T., Lachmann M., Pääbo S., Patterns of damage in genomic DNA sequences from a Neandertal. Proc. Natl. Acad. Sci. U.S.A. 104, 14616–14621 (2007). [DOI] [PMC free article] [PubMed] [Google Scholar]
- 73.Schmieder R., Edwards R., Quality control and preprocessing of metagenomic datasets. Bioinformatics 27, 863–864 (2011). [DOI] [PMC free article] [PubMed] [Google Scholar]
- 74.Dabney J., Knapp M., Glocke I., Gansauge M.-T., Weihmann A., Nickel B., Valdiosera C., García N., Pääbo S., Arsuaga J.-L., Meyer M., Complete mitochondrial genome sequence of a Middle Pleistocene cave bear reconstructed from ultrashort DNA fragments. Proc. Natl. Acad. Sci. U.S.A. 110, 15758–15763 (2013). [DOI] [PMC free article] [PubMed] [Google Scholar]
- 75.Edgar R. C., MUSCLE: Multiple sequence alignment with high accuracy and high throughput. Nucleic Acids Res. 32, 1792–1797 (2004). [DOI] [PMC free article] [PubMed] [Google Scholar]
- 76.M. A. Miller, W. Pfeiffer, T. Schwartz, Creating the CIPRES Science Gateway for inference of large phylogenetic trees, in Proceedings of the Gateway Computing Environments Workshop (CGE) (IEEE, 2010), pp. 1–8. [Google Scholar]
- 77.Rannala B., Yang Z., Anderson F., Inferring speciation times under an episodic molecular clock. Syst. Biol. 56, 453–466 (2007). [DOI] [PubMed] [Google Scholar]
- 78.Benton M. J., Donoghue P. C. J., Asher R. J., Friedman M., Near T. J., Vinther J., Constraints on the timescale of animal evolutionary history. Palaeontol. Electron. 18, 1–116 (2015). [Google Scholar]
- 79.Meredith R. W., Mendoza M. A., Roberts K. K., Westerman M., Springer M. S., A phylogeny and timescale for the evolution of Pseudocheiridae (Marsupialia: Diprotodontia) in Australia and New Guinea. J. Mamm. Evol. 17, 75–99 (2010). [DOI] [PMC free article] [PubMed] [Google Scholar]
- 80.Springer M. S., Meredith R. W., Janecka J. E., Murphy W. J., The historical biogeography of Mammalia. Philos. Trans. R. Soc. Lond. B Biol. Sci. 366, 2478–2502 (2011). [DOI] [PMC free article] [PubMed] [Google Scholar]
- 81.Horovitz I., Martin T., Bloch J., Ladevèze S., Kurz C., Sánchez-Villagra M. R., Cranial anatomy of the earliest marsupials and the origin of opossums. PLOS ONE 4, e8278 (2009). [DOI] [PMC free article] [PubMed] [Google Scholar]
- 82.Bergqvist L. P., Abrantes É. A. L., dos Santos Avilla L., The Xenarthra (Mammalia) of Sãn José de Itaboraí Basin (upper Paleocene, Itaboraian), Rio de Janeiro, Brazil. Geodiversitas 26, 323–337 (2004). [Google Scholar]
- 83.Benton M. J., Donoghue P. C. J., Paleontological evidence to date the tree of life. Mol. Biol. Evol. 24, 26–53 (2007). [DOI] [PubMed] [Google Scholar]
- 84.Woodburne M. O., Goin F. J., Bond M., Carlini A. A., Gelfo J. N., López G. M., Iglesias A., Zimicz A. N., Paleogene land mammal faunas of South America; A response to global climatic changes and indigenous floral diversity. J. Mamm. Evol. 21, 1–73 (2014). [Google Scholar]
- 85.Vignaud P., Duringer P., Mackaye H. T., Likius A., Blondel C., Boisserie J.-R., de Bonis L., Eisenmann V., Etienne M.-E., Geraads D., Guy F., Lehmann T., Lihoreau F., Lopez-Martinez N., Mourer-Chauviré C., Otero O., Rage J.-C., Schuster M., Viriot L., Zazzo A., Brunet M., Geology and palaeontology of the Upper Miocene Toros-Menalla hominid locality, Chad. Nature 418, 152–155 (2002). [DOI] [PubMed] [Google Scholar]
- 86.Lebatard A.-E., Bourlès D. L., Duringer P., Jolivet M., Braucher R., Carcaillet J., Schuster M., Arnaud N., Monié P., Lihoreau F., Likius A., Cosmogenic nuclide dating of Sahelanthropus tchadensis and Australopithecus bahrelghazali: Mio-Pliocene hominids from Chad. Proc. Natl. Acad. Sci. U.S.A. 105, 3226–3231 (2008). [DOI] [PMC free article] [PubMed] [Google Scholar]
- 87.Shoshani J., Tassy P., Advances in proboscidean taxonomy & classification, anatomy & physiology, and ecology & behavior. Quatern. Int. 126–128, 5–20 (2005). [Google Scholar]
- 88.P. Tassy, Elephantoidea from Lothagam, in Lothagam: The Dawn of Humanity in Eastern Africa, M. G. Leakey, J. M. Harris, Eds. (Columbia Univ. Press, 2003), pp. 331–358. [Google Scholar]
- 89.Vélez-Juarbe J., Domning D. P., Fossil Sirenia of the West Atlantic and Caribbean region. XI. Callistosiren boriquensis, gen. et sp. nov. J. Vertebr. Paleontol. 35, e885034 (2015). [Google Scholar]
- 90.Vélez-Juarbe J., Domning D. P., Pyenson N. D., Iterative evolution of sympatric seacow (Dugongidae, Sirenia) assemblages during the past ~26 million years. PLOS ONE 7, e31294 (2012). [DOI] [PMC free article] [PubMed] [Google Scholar]
- 91.Vélez-Juarbe J., Domning D. P., Fossil Sirenia of the West Atlantic and Caribbean region. IX. Metaxytherium albifontanum, sp. nov. J. Vertebr. Paleontol. 34, 444–464 (2014). [Google Scholar]
- 92.Kocsis L., Gheerbrant E., Mouflih M., Cappetta H., Yans J., Amaghzaz M., Comprehensive stable isotope investigation of marine biogenic apatite from the late Cretaceous–early Eocene phosphate series of Morocco. Palaeogeogr. Palaeoclimatol. Palaeoecol. 394, 74–88 (2014). [Google Scholar]
- 93.Eiting P., Gunnell G. F., Global completeness of the bat fossil record. J. Mamm. Evol. 16, 151–173 (2009). [Google Scholar]
- 94.Phillips M. J., Four mammal fossil calibrations: Balancing competing palaeontological and molecular considerations. Palaeontol. Electron. 18.1.5FC, 1–16 (2015). [Google Scholar]
- 95.N. J. Czaplewski, G. S. Morgan, S. A. McLeod, Chiroptera, in Evolution of Tertiary Mammals of North America, C. M. Janis, G. F. Gunnell, M. D. Uhen, Eds. (Cambridge Univ. Press, 2008), vol. 2, pp. 174–197. [Google Scholar]
- 96.Simmons N. B., Seymour K. L., Habersetzer J., Gunnell G. F., Primitive early Eocene bat from Wyoming and the evolution of flight and location. Nature 451, 818–821 (2008). [DOI] [PubMed] [Google Scholar]
- 97.Teeling E. C., Springer M. S., Madsen O., Bates P., O’Brien S. J., Murphy W. J., A molecular phylogeny for bats illuminates biogeography and the fossil record. Science 307, 580–584 (2005). [DOI] [PubMed] [Google Scholar]
- 98.Meredith R. W., Westerman M., Case J. A., Springer M. S., A phylogeny and timescale for marsupial evolution based on sequences for five nuclear genes. J. Mamm. Evol. 15, 1–36 (2009). [Google Scholar]
- 99.Teeling E. C., Scally M., Kao D. J., Romagnoli M. L., Springer M. S., Stanhope M. J., Molecular evidence regarding the origin of echolocation and flight in bats. Nature 403, 188–192 (2000). [DOI] [PubMed] [Google Scholar]
- 100.Teeling E. C., Madsen O., Van Den Bussche R. A., de Jong W. W., Stanhope M. J., Springer M. S., Microbat paraphyly and the convergent evolution of a key innovation in Old World rhinolophoid microbats. Proc. Natl. Acad. Sci. U.S.A. 99, 1431–1436 (2002). [DOI] [PMC free article] [PubMed] [Google Scholar]
- 101.Springer M. S., Teeling E. C., Madsen O., Stanhope M. J., de Jong W. W., Integrated fossil and molecular data reconstruct bat echolocation. Proc. Natl. Acad. Sci. U.S.A. 98, 6241–6246 (2001). [DOI] [PMC free article] [PubMed] [Google Scholar]
- 102.Gunnell G. F., Simmons N. B., Fossil evidence and the origin of bats. J. Mamm. Evol. 12, 209–246 (2005). [Google Scholar]
- 103.X.-M. Wang, R. H. Tedford, Canidae, in The Terrestrial Eocene-Oligocene Transition in North America, D. R. Prothero, R. J. Emry, Eds. (Cambridge Univ. Press, 1996), pp. 433–452. [Google Scholar]
- 104.Spaulding M., Flynn J. J., Anatomy of the postcranial skeleton of “Miacis” uintensis (Mammalia: Carnivoramorpha). J. Vertebr. Paleontol. 29, 1212–1223 (2009). [Google Scholar]
- 105.Finarelli J. A., A total evidence phylogeny of the Arctoidea (Carnivora: Mammalia): Relationships among basal taxa. J. Mamm. Evol. 15, 231 (2008). [Google Scholar]
- 106.Wang X., McKenna M. C., Dashzeveg D., Amphicticeps and Amphicynodon (Arctoidea, Carnivora) from Hsanda Gol Formation, Central Mongolia and phylogeny of basal arctoids with comments on zoogeography. Am. Mus. Novit. 3483, 1–57 (2005). [Google Scholar]
- 107.Banyue W., Zhanxiang Q., Notes on early Oligocene ursids (Carnivora, Mammalia) from Saint Jacques, Nei Mongol, China. Bull. Am. Mus. Nat. Hist. 279, 116–124 (2003). [Google Scholar]
- 108.J. A. Baskin, Mustelidae, in Evolution of Tertiary Mammals of North America, C. M. Janis, K. M. Scott, L. L. Jacobs, Eds. (Cambridge Univ. Press, 1998), vol. 1, pp. 152–173. [Google Scholar]
- 109.Sato J. J., Wolsan M., Minami S., Hosoda T., Sinaga M. H., Hiyama K., Yamaguchi Y., Suzuki H., Deciphering and dating red panda’s ancestry and early adaptive radiation. Mol. Phylogenet. Evol. 53, 907–922 (2009). [DOI] [PubMed] [Google Scholar]
- 110.Tomiya S., A new basal caniform (Mammalia: Carnivora) from the middle Eocene of North America and remarks on the phylogeny of early carnivorans. PLOS ONE 6, e24146 (2011). [DOI] [PMC free article] [PubMed] [Google Scholar]
- 111.M. D. Uhen, R. E. Fordyce, L. G. Barnes, Odontoceti, in Evolution of Tertiary Mammals of North America, C. M. Janis, G. F. Gunnell, M. D. Uhen, Eds. (Cambridge Univ. Press, 2008), vol. 2, pp. 566–606. [Google Scholar]
- 112.Deméré T. A., Berta A., Adam P. J., Pinnipedimorph evolutionary biogeography. Bull. Am. Mus. Nat. Hist. 279, 32–76 (2003). [Google Scholar]
- 113.Wesley-Hunt G. D., Flynn J. J., Phylogeny of the Carnivora: Basal relationships among the carnivoramorphans, and assessment of the position of ‘Miacoidea’ relative to Carnivora. J. Syst. Palaeontol. 3, 1–28 (2005). [Google Scholar]
- 114.R. M. Hunt, R. H. Tedford, Phylogenetic relationships within the aeluroid Carnivora and implications of their temporal and geographic distribution, in Mammal Phylogeny: Placentals, F. S. Szalay, M. J. Novacek, M. C. McKenna, Eds. (Springer-Verlag, 1993), pp. 53–73. [Google Scholar]
- 115.J. J. Flynn, Carnivoran phylogeny and rates of evolution: Morphological, taxic, and molecular, in Carnivore Behavior, Ecology, and Evolution, J. L. Gittleman, Ed. (Cornell Univ. Press, 1996), vol. 2, pp. 542–581. [Google Scholar]
- 116.Barycka E., Evolution and systematics of the feliform Carnivora. Mamm. Biol. 72, 257–282 (2007). [Google Scholar]
- 117.Woodburne M. O., Gunnell G. F., Stucky R. K., Climate directly influences Eocene mammal faunal dynamics in North America. Proc. Natl. Acad. Sci. U.S.A. 106, 13399–13403 (2009). [DOI] [PMC free article] [PubMed] [Google Scholar]
- 118.M. J. Benton, P. C. J. Donoghue, R. J. Asher, Calibrating and constraining molecular clocks, in The Timetree of Life, S. B. Hedges, S. Kumar, Eds. (Oxford Univ. Press, 2009), pp. 35–86. [Google Scholar]
- 119.O’Leary M. A., Gatesy J., Impact of increased character sampling on the phylogeny of Cetartiodactyla (Mammalia): Combined analysis including fossils. Cladistics 24, 397–442 (2008). [DOI] [PubMed] [Google Scholar]
- 120.Mitchell E. D., A new cetacean from the late Eocene La Meseta Formation, Seymour Island, Antarctic Peninsula. Can. J. Fish. Aquat. Sci. 46, 2219–2235 (1989). [Google Scholar]
- 121.Fitzgerald E. M. G., Pliocene marine mammals from the Whalers Bluff Formation of Portland, Victoria, Australia. Mem. Mus. Vic. 62, 67–89 (2005). [Google Scholar]
- 122.Fordyce R. E., Oligocene origin of skim-feeding right whales: A small archaeic balaenid from New Zealand. J. Vertebr. Paleontol. 22, 54A (2002). [Google Scholar]
- 123.Bajpai S., Kay R. F., Williams B. A., Das D. P., Kapur V. V., Tiwari B. N., The oldest Asian record of Anthropoidea. Proc. Natl. Acad. Sci. U.S.A. 105, 11093–11098 (2008). [DOI] [PMC free article] [PubMed] [Google Scholar]
- 124.Rose K. D., Rana R. S., Sahni A., Kumar K., Missiaen P., Singh L., Smith T., Early Eocene Primates from Gujarat, India. J. Human Evol. 56, 366–404 (2009). [DOI] [PubMed] [Google Scholar]
- 125.Bloch J. I., Silcox M. T., Boyer D. M., Sargis E. J., New Paleocene skeletons and the relationship of plesiadapiforms to crown-clade primates. Proc. Natl. Acad. Sci. U.S.A. 104, 1159–1164 (2007). [DOI] [PMC free article] [PubMed] [Google Scholar]
- 126.Prasad G. V. R., Divergence time estimates of mammals from molecular clocks and fossils: Relevance of new fossil finds from India. J. Biosci. 34, 649–659 (2009). [DOI] [PubMed] [Google Scholar]
- 127.Seiffert E. R., Simons E. L., Clyde W. C., Rossie J. B., Attia Y., Bown T. M., Chatrath P., Mathison M. E., Basal anthropoids from Egypt and the antiquity of Africa’s higher primate radiation. Science 310, 300–304 (2005). [DOI] [PubMed] [Google Scholar]
- 128.Williams B. A., Kay R. F., Kirk E. C., New perspectives on anthropoid origins. Proc. Natl. Acad. Sci. U.S.A. 107, 4797–4808 (2010). [DOI] [PMC free article] [PubMed] [Google Scholar]
- 129.Beard K. C., Qi T., Dawson M. R., Wang B., Li C., A diverse new primate fauna from middle Eocene fissure-fillings in southeastern China. Nature 368, 604–609 (1994). [DOI] [PubMed] [Google Scholar]
- 130.Rossie J. B., Ni X., Beard K. C., Cranial remains of an Eocene tarsier. Proc. Natl. Acad. Sci. U.S.A. 103, 4381–4385 (2006). [DOI] [PMC free article] [PubMed] [Google Scholar]
- 131.Kay R. F., Fleagle J. G., Mitchell T. R. T., Colbert M., Bown T., Powers D. W., The anatomy of Dolichocebus gaimanensis, a stem platyrrhine monkey from Argentina. J. Hum. Evol. 54, 323–382 (2008). [DOI] [PubMed] [Google Scholar]
- 132.Tabuce R., Marivaux L., Lebrun R., Adaci M., Bensalah M., Fabre P.-H., Fara E., Rodrigues H. G., Hautier L., Jaeger J.-J., Lazzari V., Mebrouk F., Peigné S., Sudre J., Tafforeau P., Valentin X., Mahboubi M., Anthropoid versus strepsirhine status of the African Eocene primates Algeripithecus and Azibius: Craniodental evidence. Proc. Biol. Sci. 276, 4087–4094 (2009). [DOI] [PMC free article] [PubMed] [Google Scholar]
- 133.Harrison T., Andrews P., The anatomy and systematic position of the early Miocene proconsulid from Meswa Bridge, Kenya. J. Hum. Evol. 56, 479–496 (2009). [DOI] [PubMed] [Google Scholar]
- 134.Young N. M., MacLatchy L., The phylogenetic position of Morotopithecus. J. Hum. Evol. 46, 163–184 (2004). [DOI] [PubMed] [Google Scholar]
- 135.Finarelli J. A., Clyde W. C., Reassessing hominoid phylogeny: Evaluating congruence in the morphological and temporal data. Paleobiology 30, 614–651 (2004). [Google Scholar]
- 136.M. I. Jensen-Seaman, K. A. Hooper-Boyd, Molecular clocks: Determining the age of the human-chimpanzee divergence, in Encyclopedia of Life Sciences (ELS) (Wiley, 2008), pp. 1–6. [Google Scholar]
- 137.Seiffert E. R., Simons E. L., Astragalar morphology of late Eocene anthropoids from the Fayum Depression (Egypt) and the origin of catarrhine primates. J. Hum. Evol. 41, 577–606 (2001). [DOI] [PubMed] [Google Scholar]
- 138.Seiffert E. R., Revised age estimates for the later Paleogene mammal faunas of Egypt and Oman. Proc. Natl. Acad. Sci. U.S.A. 103, 5000–5005 (2006). [DOI] [PMC free article] [PubMed] [Google Scholar]
- 139.Seiffert E. R., Simons E. L., Attia Y., Fossil evidence for an ancient divergence of lorises and galagos. Nature 422, 421–424 (2003). [DOI] [PubMed] [Google Scholar]
- 140.Seiffert E. R., Perry J. M. G., Simons E. L., Boyer D. M., Convergent evolution of anthropoid-like adaptations in Eocene adapiform primates. Nature 461, 1118–1121 (2009). [DOI] [PubMed] [Google Scholar]
- 141.Galewski T., Mauffrey J.-F., Leite Y. L. R., Patton J. L., Douzery E. J. P., Ecomorphological diversification among South American rats (Rodentia; Echimyidae): A phylogenetic and chronological approach. Mol. Phylogenet. Evol. 34, 601–615 (2005). [DOI] [PubMed] [Google Scholar]
- 142.Patterson B. D., Velazco P. M., Phylogeny of the rodent genus Isothrix (Hystricognathi, Echimyidae) and its diversification in Amazonia and the Eastern Andes. J. Mamm. Evol. 15, 181–201 (2008). [Google Scholar]
- 143.Vucetich M. G., Verzi D. H., Hartenberger J.-L., Review and analysis of the radiation of the South American Hystricognathi (Mammalia, Rodentia). C. R. Acad. Sci. Paris Earth Planet. Sci. 329, 763–769 (1999). [Google Scholar]
- 144.J. J. Flynn, C. C. Swisher III, Cenozoic South American land mammal ages: Correlation to global geochronologies, in Geochronology, Time-Scales, and Global Stratigraphic Correlation, SEPM, W. A. Berggren, D. V. Kent, J. Hardenbol, Eds. (Society for Sedimentary Geology, 1995), pp. 317–333. [Google Scholar]
- 145.Flynn J. J., Wyss A. R., Recent advances in South American mammalian paleontology. Trends Ecol. Evol. 13, 449–454 (1998). [DOI] [PubMed] [Google Scholar]
- 146.Campbell K. E. Jr., Frailey C. D., Romero-Pittman L., The Paleogene Santa Rosa Local Fauna of Amazonian Peru: Geographic and geologic setting. Nat. Hist. Mus. Los Angeles County Sci. Ser. 40, 3–14 (2004). [Google Scholar]
- 147.C. D. Frailey, K. E. Campbell Jr., Paleogene rodents from Amazonian Peru: The Santa Rosa Local Fauna, in The Paleogene Mammalian Fauna of Santa Rosa, Amazonian Peru, K. E. Campbell Jr., Ed. (Natural History Museum of Los Angeles County, 2004), vol. 40, pp. 71–130. [Google Scholar]
- 148.Antoine P.-O., Marivaux L., Croft D. A., Billet G., Ganerød M., Jaramillo C., Martin T., Orliac M. J., Tejada J., Altamirano A. J., Duranthon F., Fanjat G., Rousse S., Gismondi R. S., Middle Eocene rodents from Peruvian Amazonia reveal the pattern and timing of caviomorph origins and biogeography. Proc. Biol. Sci. 279, 1319–1326 (2011). [DOI] [PMC free article] [PubMed] [Google Scholar]
- 149.Hartenberger J.-L., Description de la radiation des Rodentia (Mammalia) du Paléocène supérieur au Miocène; Incidences phylogénétiques. C. R. Acad. Sci. Paris Earth Planet. Sci. 326, 439–444 (1998). [Google Scholar]
- 150.Rose K. D., DeLeon V. B., Missiaen P., Rana R. S., Sahni A., Singh L., Smith T., Early Eocene lagomorph (Mammalia) from Western India and the early diversification of Lagomorpha. Proc. Biol. Sci. 275, 1203–1208 (2008). [DOI] [PMC free article] [PubMed] [Google Scholar]
- 151.Meng J., Phylogeny and divergence of basal Glires. Bull. Am. Mus. Nat. Hist. 285, 93–109 (2004). [Google Scholar]
- 152.Asher R. J., Meng J., Wible J. R., McKenna M. C., Rougier G. W., Dashzeveg D., Novacek M. J., Stem Lagomorpha and the antiquity of Glires. Science 307, 1091–1094 (2005). [DOI] [PubMed] [Google Scholar]
- 153.Li C., Meng J., Wang Y., Dawsonolagus antiquus, a primitive lagomorph from the Eocene Arshanto Formation, Nei Mongol, China. Bull. Carnegie Mus. Nat. Hist. 39, 97–110 (2007). [Google Scholar]
- 154.Luo Z.-X., Cifelli R. L., Kielan-Jaworowska Z., Dual origin of tribosphenic mammals. Nature 409, 53–57 (2001). [DOI] [PubMed] [Google Scholar]
- 155.Woodburne M. O., Rich T. H., Springer M. S., The evolution of tribospheny and the antiquity of mammalian clades. Mol. Phylogenet. Evol. 28, 360–385 (2003). [DOI] [PubMed] [Google Scholar]
- 156.Z. Kielan-Jaworowska, R. L. Ciefelli, Z.-X. Luo, Mammals from the Age of Dinosaurs: Origins, Evolution, and Structure (Columbia Univ. Press, 2004), 630 p. [Google Scholar]
- 157.Bi S., Wang Y., Guan J., Sheng X., Meng J., Three new Jurassic euharamiyidan species reinforce early divergence of mammals. Nature 514, 579–584 (2015). [DOI] [PubMed] [Google Scholar]
- 158.Krause D. W., Hoffmann S., Wible J. R., Kirk E. C., Schultz J. A., von Koenigswald W., Groenke J. R., Rossie J. B., O’Connor P. M., Seiffert E. R., Dumont E. R., Holloway W. L., Rogers R. R., Rahantarisoa L. J., Kemp A. D., Andriamialison H., First cranial remains of a gondwanatherian mammal reveal remarkable mosaicism. Nature 515, 512–517 (2014). [DOI] [PubMed] [Google Scholar]
- 159.Lucas S. G., Luo Z., Adelobasileus from the upper Triassic of West Texas: The oldest mammal. J. Vertebr. Paleontol. 13, 309–334 (1993). [Google Scholar]
- 160.Datta P. M., Earliest mammal with transversely expanded upper molar from the Late Triassic (Carnian) Tiki Formation, South Rewa Gondwana Basin, India. J. Vertebr. Paleontol. 25, 200–207 (2005). [Google Scholar]
- 161.Clarke J. A., Tambussi C. P., Noriega J. I., Erickson G. M., Ketcham R. A., Definitive fossil evidence for the extant avian radiation in the Cretaceous. Nature 433, 305–308 (2005). [DOI] [PubMed] [Google Scholar]
- 162.F. M. Gradstein, J. G. Ogg, M. Schmitz, G. Ogg, The Geologic Time Scale (Elsevier, 2012), 1176 p. [Google Scholar]
- 163.Cohen K. M., Finney S. C., Gibbard P. L., Fan J.-X., The ICS International Chronostratigraphic Chart. Episodes 36, 199–204 (2013). [Google Scholar]
- 164.Near T. J., Eytan R. I., Dornburg A., Kuhn K. L., Moore J. A., Davis M. P., Wainwright P. C., Friedman M., Smith W. L., Resolution of ray-finned fish phylogeny and timing of diversification. Proc. Natl. Acad. Sci. U.S.A. 109, 13698–13703 (2012). [DOI] [PMC free article] [PubMed] [Google Scholar]
- 165.Friedrich O., Norris R. D., Erbacher J., Evolution of middle to Late Cretaceous oceans–A 55 my record of Earth’s temperature and carbon cycle. Geology 40, 107–110 (2012). [Google Scholar]
- 166.Bemis B. E., Spero H. J., Bijma J., Lea D. W., Reevaluation of the oxygen isotopic composition of planktonic foraminifera: Experimental results and revised paleotemperature equations. Paleoceanography 13, 150–160 (1998). [Google Scholar]
- 167.Shackleton N. J., Kennett J. P., Paleotemperature history of the Cenozoic and the initiation of Antarctic glaciation: Oxygen and carbon isotope analysis in DSDP Sites 277, 279, and 281. Init. Repts. DSDP 29, 743–755 (1975). [Google Scholar]
- 168.Smith F. A., Boyer A. G., Brown J. H., Costa D. P., Dayan T., Ernest S. M., Evans A. R., Fortelius M., Gittleman J. L., Hamilton M. J., Harding L. E., Lintulaakso K., Lyons S. K., McCain C., Okie J. G., Saarinen J. J., Sibly R. M., Stephens P. R., Theodor J., Uhen M. D., The evolution of maximum body size of terrestrial mammals. Science 330, 1216–1219 (2010). [DOI] [PubMed] [Google Scholar]
- 169.Gingerich P. D., ul Haq M., Zalmout I. S., Khan I. H., Malkani M. S., Origin of whales from early artiodactyls: Hands and feet of Eocene Protocetidae from Pakistan. Science 293, 2239–2242 (2001). [DOI] [PubMed] [Google Scholar]
- 170.Gingerich P. D., Body weight and relative brain size (encephalization) in Eocene Archaeoceti (Cetacea). J. Mamm. Evol. 23, 7–31 (2016). [Google Scholar]
- 171.Gingerich P. D., Ul-Haq M., Khan I. H., Zalmout I. S., Eocene stratigraphy and archaeocete whales (Mammalia, Cetacea) of Drug Lahar in the eastern Sulaiman Range, Balochistan (Pakistan). Contrib. Mus. Paleontol. Univ. Mich. 30, 269–319 (2001b). [Google Scholar]
- 172.Gingerich P. D., von Koenigswald W., Sanders W. J., Smith B. H., Zalmout I. S., New protocetid whale from the middle Eocene of Pakistan: Birth on land, precocial development, and sexual dimorphism. PLOS ONE 4, e4366 (2009). [DOI] [PMC free article] [PubMed] [Google Scholar]
- 173.Montgomery S. H., Geisler J. H., McGowen M. R., Fox C., Marino L., Gatesy J., The evolutionary history of cetacean brain and body size. Evolution 67, 3339–3353 (2013). [DOI] [PubMed] [Google Scholar]
- 174.Gheerbrant E., Amaghzaz M., Bouya B., Goussard F., Letenneur C., Ocepeia (Middle Paleocene of Morocco): The oldest skull of an afrotherian mammal. PLOS ONE 9, e89739 (2014). [DOI] [PMC free article] [PubMed] [Google Scholar]
- 175.Puttick M. N., Thomas G. H., Fossils and living taxa agree on patterns of body mass evolution: A case study with Afrotheria. Proc. Biol. Sci. 282, 20152023 (2015). [DOI] [PMC free article] [PubMed] [Google Scholar]
- 176.Larramendi A., Shoulder height, body mass, and shape of proboscideans. Acta Palaeontol. Pol. 61, 537–574 (2016). [Google Scholar]
- 177.Gheerbrant E., Filippo A., Schmitt A., Convergence of Afrotherian and Laurasiatherian ungulate-like mammals: First morphological evidence from the Paleocene of Morocco. PLOS ONE 11, e0157556 (2016). [DOI] [PMC free article] [PubMed] [Google Scholar]
- 178.Seiffert E. R., Nasir S., Al-Harthy A., Groenke J. R., Kraatz B. P., Stevens N. J., Al-Sayigh A. R., Diversity in the later Paleogene proboscidean radiation: A small barytheriid from the Oligocene of Dhofar Governorate, Sultanate of Oman. Naturwissenschaften 99, 133–141 (2012). [DOI] [PubMed] [Google Scholar]
- 179.Delmer C., Reassessment of the generic attribution of Numidotherium savagei and the homologies of lower incisors in proboscideans. Acta Palaeontol. Pol. 54, 561–580 (2009). [Google Scholar]
- 180.Delmer C., Mahboubi M., Tabuce R., Tassy P., A new species of Moeritherium (Proboscidea, Mammalia) from the Eocene of Algeria: New perspectives on the ancestral morphotype of the genus. Palaeontology 49, 421–434 (2006). [Google Scholar]
- 181.D. A. Hooijer, Fossil Proboscidea from the Malay Archipelago and the Punjab (EJ Brill, 1955). [Google Scholar]
- 182.Tabuce R., Seiffert E. R., Gheerbrant E., Alloing-Séguier L., von Koenigswald W., Tooth enamel microstructure of living and extinct hyracoids reveals unique enamel types among mammals. J. Mamm. Evol. 24, 91–110 (2017). [Google Scholar]
- 183.Schwartz G. T., Rasmussen D. T., Smith R. J., Body-size diversity and community structure of fossil hyracoids. J. Mammal. 76, 1088–1099 (1995). [Google Scholar]
- 184.Shoemaker L., Clauset A., Body mass evolution and diversification within horses (family Equidae). Ecol. Lett. 17, 211–220 (2014). [DOI] [PubMed] [Google Scholar]
- 185.J. Alroy, A. K. Behrensmeyer, A. Turner, M. D. Uhen, Taxonomic occurrences of Equidae recorded in Fossilworks, the Evolution of Terrestrial Ecosystems database, and the Paleobiology Database (2016); http://fossilworks.org.
- 186.J. Alroy, A. K. Behrensmeyer, M. D. Uhen, A. Turner, Taxonomic occurrences of Proboscidea recorded in Fossilworks, the Evolution of Terrestrial Ecosystems database, and the Paleobiology Database (2016); http://fossilworks.org.
- 187.J. Alroy, A. K. Behrensmeyer, M. D. Uhen, A. Turner, Taxonomic occurrences of Hyracoidea recorded in Fossilworks, the Evolution of Terrestrial Ecosystems database, and the Paleobiology Database (2016); http://fossilworks.org.
- 188.Pickford M., New Neogene hyracoid specimens from the Peri-Tethys region and East Africa. Paleontol. Res. 13, 265–278 (2009). [Google Scholar]
- 189.Pickford M., Revision of the Early Miocene Hyracoidea (Mammalia) of East Africa. C. R. Palevol. 3, 675–690 (2004). [Google Scholar]
- 190.M. D. Uhen, Taxonomic occurrences of Sirenia recorded in Fossilworks, the Evolution of Terrestrial Ecosystems database, and the Paleobiology Database (2016); http://fossilworks.org.
- 191.Balaguer J., Alba D. M., A new dugong species (Sirenia, Dugongidae) from the Eocene of Catalonia (NE Iberian Peninsula). C. R. Palevol. 15, 489–500 (2016). [Google Scholar]
- 192.M. D. Uhen, Taxonomic occurrences of Cetacea recorded in Fossilworks, the Evolution of Terrestrial Ecosystems database, and the Paleobiology Database (2016); http://fossilworks.org.
- 193.Eisenmann V., Howe J., Pichardo M., Old world hemiones and new world slender species (Mammalia, Equidae). Palaeovertebrata 36, 159–233 (2008). [Google Scholar]
- 194.MacFadden B. J., Patterns of phylogeny and rates of evolution in fossil horses: Hipparions from the Miocene and Pliocene of North America. Paleobiology 11, 245–257 (1985). [Google Scholar]
- 195.H. F. Osborn, Equidae of the Oligocene, Miocene, and Pliocene of North America: Iconographic Type Revision (EJ Brill, 1918), vol. 2, pp. 1–217. [Google Scholar]
- 196.H. F. Osborn, W. D. Matthew, Cenozoic Mammal Horizons of Western North America, No. 361 (US Government Printing Office, 1909), 138 p. [Google Scholar]
- 197.C. M. Janis, K. M. Scott, L. L. Jacobs, Evolution of Tertiary Mammals of North America: Volume 1, Terrestrial Carnivores, Ungulates, and Ungulate Like Mammals (Cambridge Univ. Press, 1998), 691 p. [Google Scholar]
- 198.D. E. Wilson, D. M. Reeder, Eds. Mammal Species of the World: A Taxonomic and Geographic Reference (Johns Hopkins Univ. Press, 2005), 2142 p. [Google Scholar]
Associated Data
This section collects any data citations, data availability statements, or supplementary materials included in this article.
Supplementary Materials
Supplementary material for this article is available at http://advances.sciencemag.org/cgi/content/full/3/7/e1602878/DC1
fig. S1. Schematic maximum-likelihood tree of ucp sequences used in this study (n = 400).
fig. S2. Exon alignments depicting deleterious mutations found in UCP1 sequences of placental mammal taxa.
fig. S3. Ribbon diagram of residues 13 to 304 of human UCP1 (UniProt accession number P25874) structurally modeled by SWISS-MODEL.
fig. S4. Amino acid alignment of vertebrate sln.
table S1. GenBank accession numbers of species used in this study.
table S2. Likelihood ratio tests for ucp1 CODEML models.
table S3. Calculated ucp1 inactivation dates (Ma) within the placental mammal lineage.
table S4. Results of BiSSE models with and without constraints on the diversification rate for five trees from the work of Faurby and Svenning (56).
table S5. BiSSE results for neutral character simulations.
table S6. Deleterious mutations found in ucp2 and ucp3 sequences of placental mammal taxa.
table S7. Specimen data and sources of tissue samples used for PCR amplification and DNA hybridization capture.
table S8. Fossil constraints used in timetree analysis.
data file S1. Gene partitions, a maximum likelihood phylogram, and mcmctree (text file).
data file S2. ucp1 free ratio model (text file).
data file S3. Fossil body mass, taxon diversity, and UCP1 diversification codings (Excel file).
data file S4. ucp2 free ratio model (Text file).
data file S5. ucp3 free ratio model (Text file).
data file S6. ucp1 coding sequence alignment (Fasta file).
data file S7. ucp2 coding sequence alignment (Fasta file).
data file S8. ucp3 coding sequence alignment (Fasta file).
data file S9. Accession numbers for the 41 loci used to construct the 51-kb maximum likelihood species tree (Fasta file).
data file S10. A 51-kb alignment (41 genes) for 140 vertebrate species (Text file).