

Abstract
In this paper, we investigate the possibility that genetic variation contributes to self-perceived weight status among adolescents and young adults in the U.S. Using samples of identical and fraternal twins across four waves of the National Longitudinal Study of Adolescent to Adult Health (Add Health) study, we calculate heritability estimates for objective body mass index (BMI) that are in line with previous estimates. We also show that perceived weight status is heritable (h2 ~ 0.47) and most importantly that this trait continues to be heritable above and beyond objective BMI (h2 ~ 0.25). We then demonstrate significant sex differences in the heritability of weight identity across the four waves of the study, where h2women =0.39, 0.35, 0.40, and 0.50 for each wave, respectively, and h2men =0.10, 0.10, 0.23, and 0.03. These results call for a deeper consideration of both identity and gender in genetics research.
Keywords: United States, body mass index, self-perceived weight status, weight identity, heritability, gender
1. Introduction
Health scientists have long relied upon self-rated health (SRH) as a global indicator of overall well-being (Idler and Benyamini, 1997)—largely because self-reported health measures are consistently found to be at least as valid as physician assessed morbidity (Ferraro and Farmer, 1999), and SRH is strongly associated with overall mortality risk (Idler and Angel, 1990). A growing body of work has started to investigate self-ratings of health, and this work has shown important differences by age, gender, and specific morbidities (Chang and Christakis, 2003; Lee et al., 2010; Nelson et al., 2008). Because certain individuals’ health assessments are relatively rigid even in the face of new information about changes in objective health status (Boardman, 2006), scholars have argued that these measures tap into a more complex phenomenon that has been characterized as a “health identity” (McMullen and Luborsky, 2006). This argument is in line with the results of a recent study by Altman, Van Hook, and Hillemeier (2016), who show that obesity status is a critical part of the subjective component of health assessments, and that this relationship is consistent regardless of historical period. Grover, Keel, and Mitchell (2003) have argued that “weight identity” is, like health identity, a stable component of personal identity.
In this paper, we evaluate the possibility that variation, not just in weight itself but in weight identity, may be due in part to genetic variation in the population, and we examine gender differences in the heritability of weight identity. We use sibling-based quantitative genetic models to illustrate the importance of this genetic connection for social epidemiologic understandings of health assessments in general and weight identity in particular.
1.1. Health identity and weight identity
Social scientists have detailed the ways in which multiple and competing social roles, statuses, and life circumstances coalesce to define one’s identity (Goffman, 1959). More recently, researchers have made it clear that current health, health lifestyles, and healthcare interactions are all important components of overall health identity (Kelleher and Leavey, 2004). Critically, physical weight is consistently linked to overall health assessment (Altman, Van Hook, and Hillemeier, 2016; McMullen and Luborsky, 2006), and lifestyle indicators such as food choice are increasingly important signals of one’s health identity (Stead et al., 2011). Further, the connection between health self-assessments and identity is important to medical sociology and social epidemiology. Self-assessments about current health have two components: (1) a spontaneous assessment; and (2) an enduring self-concept (Bailis et al., 2003). This latter component is particularly important, because it suggests that simple questions about one’s health, including one’s weight, may tap into complex health-related identities that are relatively stable over time. Nonetheless, some individuals may be more likely than others to adjust their health self-assessments in light of new information, new life events, or changes in health status.
Previous work has demonstrated the stability of SRH as an enduring self-concept by evaluating the association between health assessments and reported morbidities and co-morbidities over time (Boardman, 2006). In this paper, we demonstrate the stability of weight identity by examining residual variation in subjective weight status (e.g., “Overall, how do you think of yourself in terms of your weight?”) after adjusting for objective BMI.
1.2. Genetics and identity
Results of a meta-analysis suggest that the heritability of subjective well-being is between 30% and 50% (Nes et al., 2006). That is, roughly one-third to one-half of the variance of subjective well-being in the population may be due to genetic variation. Yet the idea that health identity reflects a genetic component is rarely considered in the social sciences. Our study addresses this limitation by ascertaining for the first time the proportion of variance in weight identity that may be genetically influenced. Researchers have made gains in their efforts to assess the genetic origins of environmental sensitivity (Belsky and Pluess, 2009; Boyce and Ellis, 2005; Shanahan and Hofer, 2005), but very little work has considered health identities such as weight identity within this overall framework. This is very important because those who are less flexible in their health or weight identity may be less likely than others to make significant changes to improve or maintain their health (Boardman et al., 2011; Boardman et al., 2012). By studying the two phenotypes of objective BMI as well as one’s own perceived weight status, we examine the possibilities that the covariation between these traits is due, in part, to common genetic influences, and more importantly, that unique genetic influences contribute to subjective weight identity. That is, we explore the idea that some of the tendency to be open to change in weight self-assessment may have roots in observed or unobserved genotype.
1.3. Differential susceptibility and social triggers
The social trigger model of gene-environment interaction (GxE) anticipates that latent genetic influences manifest only when triggered by the individual’s environment. For example, the differential susceptibility model of GxE interaction suggests that some individuals possess more “plasticity” alleles, making these individuals similar to orchids, while others that possess relatively fewer resemble resilient dandelions (Belsky and Pluess, 2009). Given relatively average environments, these two groups of individuals would be expected to fare similarly, but when exposed to either beneficial or hostile social triggers, the genetic differences between individuals will manifest. Given the allure of such theoretical models for social scientists, the past decade has witnessed an explosion of research on GxE interactions (Manuck and McCaffery, 2014). The initial molecular empirical work evaluated polymorphisms in specific candidate genes that were hypothesized to moderate environmental influences on specific morbidities. Perhaps the most highly cited works in this area are two papers from Caspi and colleagues, which sought to demonstrate that certain genetic polymorphisms made individuals particularly sensitive to stimuli from the social as well as the physical environment. Though the replicability of this work is debatable, it emphasized noxious environmental exposures including stressful life events (Caspi et al., 2003) and serious forms of maltreatment among children (Caspi et al., 2002).
The results of these two studies have led to hundreds of attempted replications with mixed results (Risch et al., 2009), discussions about the plausible biological mechanisms of the purported GxE effects (Meaney, 2010), sharp criticisms about the likelihood of Type-I errors in underpowered and unreplicated gene-environment studies (Duncan and Keller, 2011), calls to extend the meaning of the environment to include social forces (Boardman, Daw, and Freese, 2013), and refinements to the emphasis on stressful environments (Pluess and Belsky, 2011). While these debates continue, there is growing consensus that a complete understanding of complex behavioral phenotypes requires information on the genetic architecture of individuals and the social contexts in which they interact (Landecker and Panofsky, 2013).
A number of replicated empirical regularities have emerged from twin and family studies, which are well-positioned to explore aggregate genetic architecture (even if the specific genetic markers are unknown). For example, heritability tends to increase with age (e.g., Bergen, Gardner, and Kendler, 2007; Briley and Tucker-Drob, 2013), and there is some evidence that heritabilities also differ across environmental context (e.g., Tucker-Drob and Bates, 2016; Tucker-Drob, Briley, and Harden, 2013). Rather than remaining fixed and static, genetic influences emerge across development as individuals encounter social triggers. Gender may also act as a social trigger. For example, the magnitude of genetic influences on some psychological measures, such as anxiety, depression, and aggressive behavior, differs across males and females (e.g., Eley, Lichtenstein, and Stevenson, 1999; Eley and Stevenson, 1999). One potential explanation of these findings is that biological processes link psychological development to the genome more strongly for either males or females. An equally plausible mechanism is that the social experience of being male or female differentially situates individuals within social environments that magnify or diminish genetic influences on development.
In the present paper, we propose that genetic sensitivity to social environmental factors may also contribute to identity formation in general and weight identity specifically. While only limited work has focused on genetics and identity, Settle, Dawes, and Fowler (2009) have found that intensity of partisan identification is a heritable phenotype, although the direction of the association is not heritable. That is, genes do not contribute to “liberal” or “conservative” ideologies; rather, genes seem to influence individuals’ propensity to express their political orientations as an important component of their identity. This work is in line with our understanding regarding the genetic contributions to the malleability of “identity negotiation,” and is comparable to other work on religious identities (Lewis and Bates, 2013).
1.4. Weight identity by gender
Symbolic interaction research has demonstrated that individuals constantly negotiate their own identities in light of their social roles, environmental cues, and observations of others. These negotiations coalesce in a process in which individuals internalize putatively external elements of their social world (Mead, 1913). This work emphasizes the importance of a “master status” (Becker, 1963) but also underscores the need to consider identity across multiple social roles.
Among U.S. adolescents and young adults, weight identity negotiation is likely to vary systematically with gender. Weight status is much more salient for women than for men in the U.S., and women and men experience different social environments in regard to weight. Further, women are at higher risk of weight discrimination than men, and young women are at higher risk of weight discrimination at lower levels of BMI (Puhl, Andreyeva, and Brownell, 2008). These social realities are reflected in differential self-assessments of weight. For example, objectively overweight men are disproportionately inclined to report that they are “about the right weight” (Chang and Christakis, 2003).
We believe that increasing objective BMI affects weight identity only insofar as it is subjectively meaningful. Thus, in our study, we bring the social meaning of gender to bear on the GxE literature. Because weight status is more highly salient for women than for men, and being overweight is more highly stigmatized for women than for men, we anticipate that these differential expectations regarding weight will render different environments, and that these environments will thus drive gendered differences in our genetic analyses, so that the effect of genetic variation on weight identity will manifest most among women. That is, the social mechanisms that are necessary to observe the heritability of this identity phenotype will be much stronger for women than for men in the United States.
2. Data and Methods
2.1. Dataset
This study uses data from the (U.S.) National Longitudinal Study of Adolescent to Adult Health (Add Health). Add Health is a nationally representative and longitudinal sample of adolescents originally assessed in grades 7–12 during the 1994–1995 school year. This cohort was followed into young adulthood with four in-home interviews, and the Add Health dataset contains detailed information on respondents’ social, psychological, and physical well-being, with information on their families, neighborhoods, schools, and peer groups. Thus it provides a unique way to study how social environments and behaviors in young people are linked to health outcomes in adulthood. Importantly for our study, Add Health purposely oversampled twin pairs to enable the behavioral genetic analyses that we use in our study (Harris et al., 2006).
2.2 Empirical analyses
We use monozygotic (MZ) and dizygotic (DZ) twin pairs in our analyses. In our final univariate and bivariate twin analyses we use a total of 286 MZ pairs, 251 same-sex DZ pairs, and 204 opposite-sex DZ pairs. Objective BMI was measured as a continuous outcome constructed from measured height and weight. Perceived weight status was assessed with the following response categories using the question “How do you think of yourself in terms of weight?” Response options included (1) “very underweight,” (2) “slightly underweight,” (3) “about the right weight,” (4) “slightly overweight,” or (5) “very overweight.”
Using twin modeling techniques in the structural equation modeling programs Mplus 7.4 (Muthén and Muthén, 1998–2015) and OpenMx (Boker et al., 2011) with the R 3.2.0 statistical program (R Core Team, 2016), we provide estimates for the genetic component (additive [A]) and two components of environmental influence (shared [C] and nonshared [E]) of our objective BMI and perceived weight status phenotypes. All of our models control for the main effects of age, sex, age2 and an age-×-sex interaction, as is standard in twin models (McGue and Bouchard, 1984). We compare nested models using χ2 difference tests to assess fit and arrive at the most parsimonious models. We estimate univariate models for each of the 4 waves of Add Health and provide standard errors for our parameter estimates.
We next fit bivariate twin models, or Cholesky triangular decomposition models, to 4 × 4 covariance matrices. Here we use the most parsimonious models from our univariate analyses to inform the models we fit in our bivariate approach. In these models we decompose the variance-covariance matrix with regression of observed measures on latent factors in which we model a variance-covariance path that approximates the variance shared between our 2 phenotypes: objective and perceived weight (Purcell, 2008). As shown by diagramming the bivariate path model in Figure 1, in these models objective BMI and perceived weight status are observed. A, C, and E are the latent factors of additive genetic variation, shared environmental variation, and nonshared environmental variation, respectively. The a11 and a22 paths represent the additive genetic variation associated with objective BMI and residualized perceived weight status, respectively. Likewise, the c11, c22, e11, and e22 paths represent the environmental variation associated with objective BMI and residualized perceived weight status respectively. Put differently, the pathways specific to perceived weight status represent unique genetic and environmental influences that are not shared with objective BMI. Unique to the bivariate models, the covariance paths (a21, c21, and e21) represent genetic and environmental variation shared between objective BMI and perceived weight status, and these paths can be interpreted similarly to regression coefficients. When squared, the coefficients represent the proportion of variance in perceived weight status that is shared with objective BMI. These shared paths also allow us to estimate a genetic correlation coefficient (rg) that indicates the extent to which latent-factor variation (e.g., genetic influence) is shared between our two phenotypes. The paths described in Figure 1 can be used with Equation 1 to estimate the genetic correlation coefficient as:
| (Equation 1) |
Fig. 1.

ACE bivariate path model for objective BMI and perceived weight status.
Thus in these models we can get a sense of the amount of genetic variation that is influencing both objective BMI and perceived weight status at the same time. We estimate bivariate models across all 4 waves of Add Health and provide standard errors for our rg estimates.
As a final step, we investigate whether the above estimates of genetic and environmental influences are consistent across genders. In the behavior genetic literature, this phenomenon is referred to as a sex-limitation model (Neale and Cardon, 1992). Two forms of sex-limitation are possible. First, qualitative sex-limitation refers to the possibility that different genetic influences matter for men and women. For example, different genes may regulate pubertal development across gender that also influences BMI, or the social experience of puberty may magnify different genetic influences across gender. Here, the main point is that the genetic variation that matters for BMI might differ across gender. Second, quantitative sex-limitation refers to the possibility that the magnitude of genetic or environmental influences may differ across gender. For example, genetic influences may exert a larger or smaller influence on BMI across gender due to a variety of biological or social mechanisms, but the same sort of genetic influences matter across gender. Testing for qualitative sex-limitation requires opposite-sex DZ twin pairs and evaluates whether these pairs differ systematically from same-sex pairs. Quantitative sex-limitation estimates genetic and environmental effects separately across males and females. These models are nested and can be compared using χ2 difference tests.
3. Results
Table 1 reports the twin pair descriptive statistics for our outcome phenotypes, objective BMI and perceived weight status. As we expected, BMI increased as twins aged, and thus mean BMI ranged from 22.10 to 28.03 across waves. Mean perceived weight status (on a 5-point Likert Scale) ranged from 3.08 to 3.49 across waves, or from “about the right weight” to “slightly overweight.” Table 1 also reports the number of MZ, same-sex DZ, and opposite sex DZ twin pairs used for each phenotype by wave. Finally, we report MZ, same-sex DZ, and opposite sex DZ phenotypic correlations for each trait by wave. For objective BMI, phenotypic correlations were roughly 0.8 for MZ pairs and about 0.4 for same-sex DZ pairs. For perceived weight status, phenotypic correlations were on average about 0.5 for MZ pairs and about 0.25 for same-sex DZ twin pairs. Opposite sex DZ correlations were much lower than same-sex DZ correlations, an indication of sex differences. That the same-sex DZ correlations were on average about half the MZ correlations suggests that genetic influences are additive (Plomin et al., 1990). To check this observation, we procedurally fit a model for non-additive (dominance) genetic effects, and we find estimates of zero for the dominance genetic parameter, providing further evidence that an additive genetic model is the most appropriate.
Table 1.
Add Health waves 1–4 twin pair descriptive statistics for objective BMI and perceived weight status.
| Twin Wave | OBJECTIVE BMI | |||||||
|---|---|---|---|---|---|---|---|---|
|
| ||||||||
| Mean | sd | NMZ | NSS DZ | NOS DZ | rMZ | rSS DZ | rOS DZ | |
| Wave 1 | 22.10 | 4.17 | 257 | 218 | 188 | 0.84 | 0.39 | 0.18 |
| Wave 2 | 22.43 | 4.43 | 232 | 202 | 177 | 0.80 | 0.38 | 0.20 |
| Wave 3 | 25.46 | 5.67 | 202 | 170 | 146 | 0.81 | 0.42 | 0.17 |
| Wave 4 | 28.03 | 7.04 | 215 | 176 | 165 | 0.83 | 0.50 | 0.18 |
|
| ||||||||
| Twin Wave | PERCEIVED WEIGHT STATUS | |||||||
|
| ||||||||
| Mean | sd | NMZ | NSS DZ | NOS DZ | rMZ | rSS DZ | rOS DZ | |
|
| ||||||||
| Wave 1 | 3.08 | 0.80 | 263 | 223 | 193 | 0.49 | 0.21 | 0.13 |
| Wave 2 | 3.10 | 0.69 | 239 | 205 | 178 | 0.53 | 0.18 | 0.12 |
| Wave 3 | 3.20 | 0.78 | 216 | 184 | 153 | 0.47 | 0.24 | 0.13 |
| Wave 4 | 3.49 | 0.85 | 215 | 182 | 165 | 0.48 | 0.29 | 0.14 |
Table 2 and Figure 2 present the results of our univariate models. The final three columns in Table 2 indicate model fit statistics for the ACE vs. the AE model. Because we were able to drop C from all of our univariate models without loss of model fit (last column in Table 2), we only present the results of the AE models in Table 2 and Figure 2. Heritability for objective BMI remains quite stable across all waves at about 0.80, and this value is consistent with previous estimates using these data (Haberstick et al., 2010) as well as with estimates for similarly aged populations across other settings (Min et al., 2013). As shown in Figure 2, confidence intervals, even with our somewhat small twin sample, remain tight (please see the standard errors in Table 2). For perceived weight status, heritability values again stay very stable across waves at about 0.45, suggesting that perceived weight status is more heavily influenced by environmental factors than is objective BMI. Confidence intervals and standard errors are again relatively small, although they are somewhat larger than the confidence intervals and standard errors for objective BMI. In both phenotypes we see significant genetic influence across all 4 waves of Add Health.
Table 2.
Univariate twin AE parameter estimates for objective BMI and perceived weight status.
| OBJECTIVE BMI | |||||
|---|---|---|---|---|---|
|
| |||||
| Variance components | Fit statistics (χ2) | ||||
| A | E | AE | ACE | pr. < | |
| Wave 1 | 0.84 (.02) | 0.16 (.02) | 12.2 | 12.2 | 1.00 |
| Wave 2 | 0.80 (.02) | 0.20 (.02) | 4.87 | 4.87 | 1.00 |
| Wave 3 | 0.81 (.02) | 0.19 (.02) | 3.97 | 3.97 | 1.00 |
| Wave 4 | 0.81 (.02) | 0.19 (.02) | 3.20 | 3.20 | 1.00 |
|
| |||||
| PERCEIVED WEIGHT STATUS | |||||
|
| |||||
| Variance components | Fit statistics (χ2) | ||||
| A | E | AE | ACE | pr. < | |
|
| |||||
| Wave 1 | 0.45 (.04) | 0.55 (.04) | 3.91 | 3.91 | 1.00 |
| Wave 2 | 0.42 (.05) | 0.58 (.05) | 11.48 | 11.48 | 1.00 |
| Wave 3 | 0.45 (.05) | 0.55 (.05) | 3.91 | 3.44 | 0.49 |
| Wave 4 | 0.47 (.05) | 0.53 (.05) | 1.14 | 1.12 | 0.89 |
Note: Standard errors for variance estimates provided in parentheses
Fig. 2.

Twin heritability estimates for univariate models. 95% confidence intervals included.
We present our first bivariate model in Table 3 for all respondents. In the first several columns, we present standard errors and path coefficients for both the additive genetic [A] and nonshared environmental [E] components of our model. In Figure 3, to highlight how these coefficients map onto our structural model, we present the Wave 1 [A] and [E] path coefficients, genetic and environmental correlations, and standard errors using the same diagramming as in Figure 1.
Table 3.
Bivariate AE estimates for objective BMI and perceived weight status among all pairs.
| Path Coefficients | Heritability Estimates | |||||||||
|---|---|---|---|---|---|---|---|---|---|---|
|
| ||||||||||
| a11 | e11 | a21 | e21 | a22 | e22 | BMI | Perceived Weight | Unique Perceived Weight | rg | |
| Wave 1 | 0.92 (.01) | 0.40 (.02) | 0.57 (.03) | 0.18 (.04) | 0.41 (.04) | 0.69 (.03) | 0.84 | 0.49 | 0.25 | 0.82 (.03) |
| Wave 2 | 0.90 (.01) | 0.45 (.02) | 0.57 (.03) | 0.26 (.05) | 0.36 (.05) | 0.69 (.03) | 0.8 | 0.46 | 0.21 | 0.85 (.04) |
| Wave 3 | 0.89 (.01) | 0.45 (.03) | 0.52 (.03) | 0.33 (.05) | 0.42 (.05) | 0.66 (.03) | 0.80 | 0.45 | 0.29 | 0.78 (.04) |
| Wave 4 | 0.90 (.01) | 0.43 (.02) | 0.59 (.03) | 0.28 (.05) | 0.36 (.05) | 0.67 (.03) | 0.81 | 0.48 | 0.23 | 0.85 (.03) |
Note: Standard errors provided in parentheses below parameter estimates
Fig. 3.
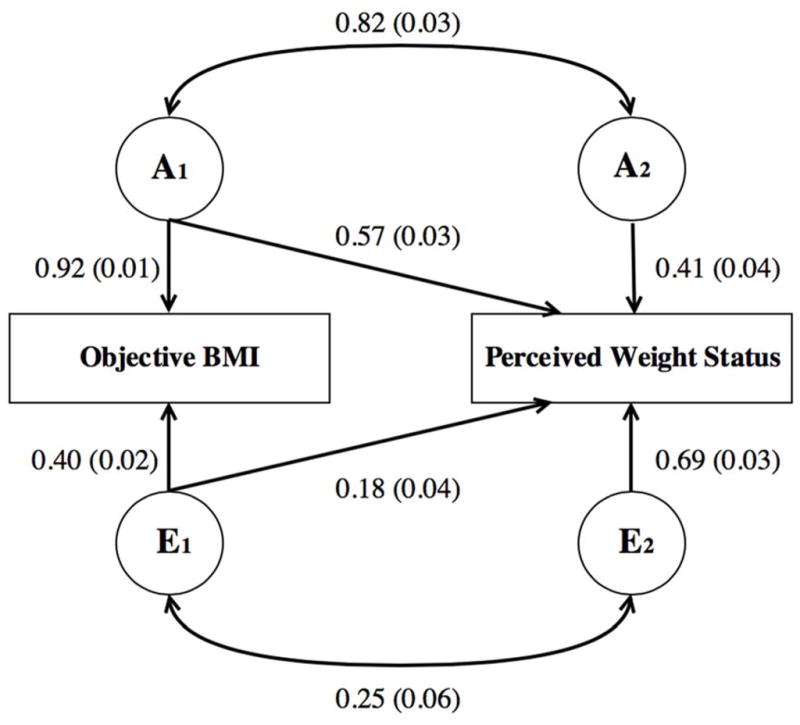
AE bivariate path model for objective BMI and perceived weight status, with Wave 1 path coefficients and standard errors included.
Next, using path coefficient-based equations (see Equations S1 and S2 in Section 1 of the online supplement), we calculate heritabilities for objective BMI and perceived weight status (Table 3). We find that these estimates are directly in line with the estimates from our univariate models in Table 2 and Figure 2, and this observation serves as a methodologically consistent robustness check. Unique to the Cholesky bivariate method, the shared variance-covariance paths (a21 and e21) allow for the determination of variance that is unique to perceived weight status, independent of objective BMI. We use the below equation to calculate this residual heritability estimate:
| (Equation 2) |
As reported in Table 3, we find consistent heritability estimates for this residual phenotype of 0.25, 0.21, 0.29, and 0.23 across each of our 4 waves, respectively. Importantly, these estimates indicate that perceived weight status contains a heritable component that is truly above and beyond either objective weight status or environmental influences. Further, these heritability estimates provide the first evidence that weight identity may have genetic underpinnings. (For a robustness check of this method, see Section 2 of the online supplement.) In Figure 4, we graphically decompose our bivariate results, splitting genetic and environmental variance into variance shared between objective BMI and perceived weight and variance unique to each of these phenotypes. The light gray portion of the bars in this figure correspond to genetic variance unique to perceived weight status.
Fig. 4.

Variance decomposition of bivariate models for all respondents by wave. Genetic and nonshared environmental variance is split into variance shared between objective BMI and perceived weight status, and variance unique to perceived weight status.
Across each of the 4 waves our estimates of genetic correlation (rg) remains stable between 0.78 and 0.85 with small and consistent standard errors. These rg values provide strong evidence that there is a substantial overlap between the genetic variance that is associated with BMI and the genetic variance that is associated with perceived weight status. Finally, using the path coefficients in Table 3, we can calculate a ratio of the genetic covariance between objective BMI and perceived weight status to the phenotypic correlation between the two traits (Plomin and DeFries, 1979):
| (Equation 3) |
For our bivariate model, Equation 3 yields consistent values of 0.88, 0.81, 0.76, and 0.81 across our 4 waves, which suggests that a much of the observed phenotype covariance between our two traits is due to additive genetic influences. This result, in conjunction with the results for the residualized weight identity phenotype, supports the notion that the heritability of one component of weight identity operates above and beyond simple changes in physical weight.
We next turn toward the question of sex differences in the genetic influences on weight identity. First, we formally test for both qualitative and quantitative sex differences, or sex-limitation, in our univariate models. We find weak evidence for either of these types of sex differences (for methodology and results, see Section 3 of the online supplement). Thus, we move to a more informative test of quantitative sex differences for our bivariate model. This test measures whether the additive genetic paths, including the a21 cross-path, are equivalent across males and females. Put differently, this test assesses whether gender moderates the relation between the genetic variance in objective BMI and perceived weight status. In order to perform this test, we fix the additive genetic bivariate pathways (a11, a21, and a22) and similar environmental pathways across males and females to be equal. We then compare the χ2 statistic of this model to a model where we freely estimate each of these parameters. As shown in Table 4 below, in general we find strong and statistically significant evidence that we cannot fix these parameters to be equal, and therefore that genetic and environmental effects on objective BMI and perceived weight status differ greatly across gender in our bivariate model. (For a robustness check of this test, see Section 4 of the online supplement). There are two other important takeaways from this test. First, it appears that gender moderates the association between the genetic variance related to objective BMI and the genetic variance related to perceived weight status. Second, in the case of our bivariate model, any differences between the genetic influences for men and women come as a result of residual genetic variation in perceived weight status. In other words, genetic variation in weight identity that is unique to perceived weight status and independent of objective BMI is driving any gendered, genetic differences we might observe in our 2 phenotypes.
Table 4.
Test of quantitative sex-limitation for the bivariate model, by wave.
| Model fit statistics (χ2) | |||
|---|---|---|---|
|
| |||
| Free parameters across gender | Fix parameters across gender | Model Diff. pr. < | |
| Wave 1 | 78.87 | 101.47 | 0.00 |
| Wave 2 | 80.12 | 88.47 | 0.40 |
| Wave 3 | 83.84 | 124.95 | 0.00 |
| Wave 4 | 71.29 | 118.47 | 0.00 |
Note: Freely estimated model has 54 degrees of freedom; fixed model has 62.
Having established statistically significant gender differences in genetic variance, we re-estimate the parameters of our bivariate model, this time separately for men and women. In Table 5, we report these results similarly to the full bivariate model. The heritability estimates in this table show that the amount of genetic variance related to objective BMI is relatively similar for men and women, with gender differences ranging only from about 0.05 to 0.10 across the 4 waves. For the heritability of perceived weight status, gender differences are more extreme, this time ranging from about 0.10 to 0.25 across waves. Most strikingly, and in line with what we expect from our sex-limitation tests, the genetic variation that is unique to perceived weight status (independent of objective BMI) differs the most by gender. For these heritability estimates, we see gender differences ranging from about 0.20 all the way to 0.50 across waves. Further, these heritability values for men are about 0.10 on average, while for women the average is about 0.40. These results confirm that, for women, the genetic influences on perceived weight that are unique to perceived weight and not shared with objective physical weight are significantly greater than for men. Put another way, genetic variability in weight identity is much higher for young women than for young men in the United States. As previous researchers have noted (Perry, 2015; Perry et al., 2013; Perry, 2016; Short, Yang, and Jenkins, 2013), this gender-specific genetic association is perfectly in line with a sociological understanding of gender as a critical environmental moderator of biological processes and reflects the salience of weight identity for women in the United States.
Table 5.
Bivariate AE estimates for objective BMI and perceived weight status by gender.
| Path Coefficients | Heritability Estimates | ||||||||||
|---|---|---|---|---|---|---|---|---|---|---|---|
| a11 | e11 | a21 | e21 | a22 | e22 | BMI | Perceived Weight | Unique Perceived Weight | rg | ||
| Wave 1 | Male | 0.91 (.01) | 0.42 (.03) | 0.62 (.04) | 0.13 (.06) | 0.25 (.08) | 0.73 (.03) | 0.82 | 0.44 | 0.1 | 0.93 (.05) |
| Female | 0.93 (.01) | 0.37 (.03) | 0.53 (.04) | 0.23 (.06) | 0.51 (.05) | 0.64 (.04) | 0.86 | 0.54 | 0.39 | 0.71 (.04) | |
| Wave 2 | Male | 0.88 (.02) | 0.48 (.04) | 0.52 (.05) | 0.32 (.07) | 0.25 (.10) | 0.75 (.04) | 0.77 | 0.33 | 0.1 | 0.9 (.07) |
| Female | 0.91 (.02) | 0.42 (.03) | 0.61 (.04) | 0.21 (.06) | 0.45 (.05) | 0.62 (.04) | 0.83 | 0.58 | 0.35 | 0.81 (.04) | |
| Wave 3 | Male | 0.92 (.01) | 0.39 (.03) | 0.61 (.04) | 0.13 (.07) | 0.37 (.07) | 0.68 (.04) | 0.85 | 0.41 | 0.23 | 0.86 (.05) |
| Female | 0.87 (.02) | 0.49 (.04) | 0.43 (.06) | 0.5 (.06) | 0.47 (.06) | 0.59 (.04) | 0.76 | 0.52 | 0.4 | 0.67 (.06) | |
| Wave 4 | Male | 0.86 (.02) | 0.5 (.04) | 0.58 (.05) | 0.29 (.07) | 0.12 (.19) | 0.75 (.04) | 0.75 | 0.35 | 0.03 | 0.98 (.06) |
| Female | 0.92 (.01) | 0.39 (.03) | 0.59 (.04) | 0.29 (.06) | 0.53 (.04) | 0.53 (.04) | 0.85 | 0.63 | 0.5 | 0.74 (.04) | |
Note: Standard errors provided in parentheses below parameter estimates
In Figure 5, we again graphically decompose our bivariate results where the light gray portion of the bars correspond to the portion of genetic variance that is unique to perceived weight status by gender. Finally, we note that the average genetic correlation for men across the 4 waves is 0.92, while for women the average genetic correlation is 0.73. In other words, for women the percentage of the genetic variation between objective BMI and perceived weight status that is due to common genetic factors that influence both traits is much lower than for men. That the average genetic correlation values are different and much lower for women adds a final piece of support that, for young women in particular, genetic variation in perceived weight status operates above and beyond simple changes in physical weight.
Fig. 5.

Variance decomposition of bivariate models for all respondents by wave and gender (M and F). Genetic and nonshared environmental variance is split into variance shared between objective BMI and perceived weight status and variance unique to perceived weight status.
4. Discussion
Our results demonstrate strong links between objective measures of BMI and subjective perception of weight status. Individuals with higher BMI view themselves as somewhat more overweight, and this association is mediated through common genetic effects. Beyond genetic effects, we consistently find a positive nonshared environmental association across four waves of data and across males and females. This effect represents the tendency for (genetically identical) twins with higher BMI to also perceive themselves as overweight. Over and above these links with BMI, we find residual genetic and environmental effects on subjective weight perception. This result implies that individuals vary in the sensitivity of identify formation processes to objective facts, and the relative contributions of genetic and environmental factors to such processes differ across men and women. In this case, we believe that patterned differences in the social meaning of weight are reflected in gender differences in the observable contributions of genetics to weight identity.
While it has long been understood at the molecular level that genes play a role in shaping biological development and human disease, social scientists and epidemiologists have made it clear that health outcomes are affected not just by biological mechanisms, but also by social and environmental factors (Boardman et al., 2013). The differential susceptibility model adds that people with different genotypes may have biologically differential responses to the same environment, and thus demonstrates that understanding complex phenotypes like health requires simultaneous consideration of social and biological inputs. Our investigation is important because as Idler and Benyamini (1997) and many others have shown, health assessments are independent and robust predictors of adult mortality; how one evaluates one’s own health has critical and lasting consequences, because it shapes one’s health management decisions. If subjective health identities are “sticky” (Bailis et al., 2003)—not always reflecting actual health states, or changes in health states—it is important to understand why.
We recognize that other explanations for our results are possible. In particular, it could be that observed differences reflect global health assessments rather than a more narrowly defined weight identity (Mosing et al., 2010). To explore this possibility, in ancillary analyses, we estimated comparable bivariate Cholesky models with self-rated health and weight identity, and we calculated an rg of 0.44, 0.64, 0.58, and 0.64 for waves 1–4 respectively. Thus, although these two phenotypes are correlated (r about 0.16 – 0.27 across waves), and this association is derived from common sources of genetic variation, these analyses are consistent with the idea that weight identity is a unique phenotype above and beyond a general perception of physical health.
Further, the literature points toward gendered mismatches in weight reporting whereby men are likely to overestimate their weight (Merrill and Richardson, 2009; Shapiro and Anderson, 2003). Accordingly, it is likely some gender-related measurement error exists in our subjective weight assessment outcome variables. However, we believe that this misreporting most likely reflects the gendered social environment surrounding weight, and is thus part of the environmental factors behind the gendered genetic outcomes we observe in our study. Nevertheless, it is important to keep in mind the mechanisms behind such measurement errors and how they might affect the parameter estimates. If misreporting of weight perception falls neatly along gender lines, then only opposite-sex twin pairs would be affected. This process may explain our (somewhat weak) evidence of qualitative sex limitation. Same-sex pairs would not be biased by such an effect if it applies equally to all members of a gender because, while shifting the means for weight perception, it would not affect the covariance matrix from which the models derive information. Importantly, our primary results held when only same-sex pairs were analyzed. If such a bias does not apply to all members of a gender equally, then the nonshared environmental link between BMI and subjective weight perception may break down. Said differently, this source of error implies that some men need to gain even more weight than their (identical) twin to report a higher subjective weight perception compared to their twin. In fact, we do see in our results that this nonshared environmental connection is weaker for men (average e21 = .22) compared to women (average e21 = .31).
Finally, we note that it in era of increasing access to molecular genetic data, it is important to consider both the strengths and the limitations of the twin model and to compare these models to methods that utilize measured genetic data. For readers interested in this topic, we provide a detailed discussion in Section 5 of the online supplement.
5. Conclusion
To date, few researchers have conceptualized genetics as contributing to identity formation, and even fewer have extended this conceptualization to the realm of health identity. We emphasize that suggesting a role for genetics does not mean that identities do not and cannot change; it instead reflects social science paradigms built around the idea that not all individuals respond to the same environments in the same way—and that the sources of this heterogeneity are theoretically and empirically important. We propose that genetic variance influences subjective health assessments, and in particular, weight and health identity. We further show that the extent to which genetic variance plays a role in weight identity depends on gender. This research is of particular importance because what constitutes a healthy body size is determined in part by the social contexts in which one lives, works, and socializes (Qvortrup, 2010). These factors ultimately affect what individuals do to monitor and manage their own weight (Levine, Smolak, and Hayden, 1994). We are optimistic that we have developed a solid starting place for empirically investigating genetic contributions to weight and health identities.
Finally, we end on a note that we believe is critical and often neglected in any social science genetics study. In 1979 the prolific economist Arthur Goldberger noted a growing concern for the interpretation of genetic results, a concern which still plagues interpretations even today. In line with Goldberger’s critique, we caution against committing the naturalistic fallacy when interpreting genetic results, or concluding that simply because a phenotype might, in part, have a natural cause, policy has little scope to affect an outcome. While genetic variation plays a role in almost any phenotype (Turkheimer, 2000), the extent to which the social environment affects these phenotypes is ever-changing, and policy can and will always have an important role in shaping phenotypic outcomes.
Supplementary Material
References
- Altman CE, et al. What does self-rated health mean? Changes and variations in the association of obesity with objective and subjective components of self-rated health. Journal of health and social behavior. 2016;57(1):39–58. doi: 10.1177/0022146515626218. [DOI] [PMC free article] [PubMed] [Google Scholar]
- Bailis DS, et al. Two views of self-rated general health status. Social Science & Medicine. 2003;56(2):203–217. doi: 10.1016/s0277-9536(02)00020-5. [DOI] [PubMed] [Google Scholar]
- Becker H. Outsiders: Studies in the Sociology of Deviance. Free Press; New York: 1963. [Google Scholar]
- Belsky J, Pluess M. Beyond diathesis stress: Differential susceptibility to environmental influences. Psychological Bulletin. 2009;135(6):885. doi: 10.1037/a0017376. [DOI] [PubMed] [Google Scholar]
- Bergen SE, Gardner CO, Kendler KS. Age-related changes in heritability of behavioral phenotypes over adolescence and young adulthood: a meta-analysis. Twin Research and Human Genetics. 2007;10(03):423–433. doi: 10.1375/twin.10.3.423. [DOI] [PubMed] [Google Scholar]
- Boardman JD, et al. Is the gene-environment interaction paradigm relevant to genome-wide studies? The case of education and body mass index. Demography. 2014;51(1):119–139. doi: 10.1007/s13524-013-0259-4. [DOI] [PMC free article] [PubMed] [Google Scholar]
- Boardman JD, et al. Defining the environment in gene–environment research: Lessons from social epidemiology. American Journal of Public Health. 2013;103(S1):S64–S72. doi: 10.2105/AJPH.2013.301355. [DOI] [PMC free article] [PubMed] [Google Scholar]
- Boardman JD, et al. Gene-environment interactions related to body mass: School policies and social context as environmental moderators. Journal of Theoretical Politics. 2012;24(3):370–388. doi: 10.1177/0951629812437751. [DOI] [PMC free article] [PubMed] [Google Scholar]
- Boardman JD, et al. Population composition, public policy, and the genetics of smoking. Demography. 2011;48(4):1517–1533. doi: 10.1007/s13524-011-0057-9. [DOI] [PMC free article] [PubMed] [Google Scholar]
- Boardman JD. Self-rated health among US adolescents. Journal of Adolescent Health. 2006;38(4):401–408. doi: 10.1016/j.jadohealth.2005.01.006. [DOI] [PMC free article] [PubMed] [Google Scholar]
- Boker S, et al. OpenMx: An open source extended structural equation modeling framework. Psychometrika. 2011;76(2):306–317. doi: 10.1007/s11336-010-9200-6. [DOI] [PMC free article] [PubMed] [Google Scholar]
- Boyce WT, Ellis BJ. Biological sensitivity to context: I. An evolutionary–developmental theory of the origins and functions of stress reactivity. Development and Psychopathology. 2005;17(02):271–301. doi: 10.1017/s0954579405050145. [DOI] [PubMed] [Google Scholar]
- Briley DA, Tucker-Drob EM. Explaining the increasing heritability of cognitive ability across development: A meta-analysis of longitudinal twin and adoption studies. Psychological Science. 2013;24(9):1704–1713. doi: 10.1177/0956797613478618. [DOI] [PMC free article] [PubMed] [Google Scholar]
- Bulik-Sullivan BK, et al. LD score regression distinguishes confounding from polygenicity in genome-wide association studies. Nature genetics. 2015;47(3):291–295. doi: 10.1038/ng.3211. [DOI] [PMC free article] [PubMed] [Google Scholar]
- Caspi A, et al. Role of genotype in the cycle of violence in maltreated children. Science. 2002;297(5582):851–854. doi: 10.1126/science.1072290. [DOI] [PubMed] [Google Scholar]
- Caspi A, et al. Influence of life stress on depression: Moderation by a polymorphism in the 5-HTT gene. Science. 2003;301(5631):386–389. doi: 10.1126/science.1083968. [DOI] [PubMed] [Google Scholar]
- Chang VW, Christakis NA. Self-perception of weight appropriateness in the United States. American Journal of Preventive Medicine. 2003;24(4):332–339. doi: 10.1016/s0749-3797(03)00020-5. [DOI] [PubMed] [Google Scholar]
- Domingue BW, et al. Genome-wide estimates of heritability for social demographic outcomes. Biodemography and Social Biology. 2016;62(1):1–18. doi: 10.1080/19485565.2015.1068106. [DOI] [PMC free article] [PubMed] [Google Scholar]
- Duncan LE, Keller MC. A critical review of the first 10 years of candidate gene-by-environment interaction research in psychiatry. Perspectives. 2011;168(10) doi: 10.1176/appi.ajp.2011.11020191. [DOI] [PMC free article] [PubMed] [Google Scholar]
- Eley TC, Stevenson J. Exploring the covariation between anxiety and depression symptoms: A genetic analysis of the effects of age and sex. Journal of Child Psychology and Psychiatry. 1999;40(8):1273–1282. [PubMed] [Google Scholar]
- Eley TC, Lichtenstein P, Stevenson J. Sex differences in the etiology of aggressive and nonaggressive antisocial behavior: Results from two twin studies. Child development. 1999;70(1):155–168. doi: 10.1111/1467-8624.00012. [DOI] [PubMed] [Google Scholar]
- Ferraro KF, Farmer MM. Utility of health data from social surveys: Is there a gold Standard for measuring morbidity? American Sociological Review. 1999;64(2):303–315. [Google Scholar]
- Goffman E. The Presentation of Everyday Life. Anchor Books; New York: 1959. [Google Scholar]
- Goldberger AS. Heritability. Economica. 1979;46(184):327–347. [Google Scholar]
- Grover VP, et al. Gender differences in implicit weight identity. International Journal of Eating Disorders. 2003;34(1):125–135. doi: 10.1002/eat.10167. [DOI] [PubMed] [Google Scholar]
- Haberstick BC, et al. Stable genes and changing environments: Body mass index across adolescence and young adulthood. Behavior Genetics. 2010;40(4):495–504. doi: 10.1007/s10519-009-9327-3. [DOI] [PMC free article] [PubMed] [Google Scholar]
- Harris KM, et al. The National Longitudinal Study of Adolescent Health (Add Health) twin data. Twin Research and Human Genetics. 2006;9(06):988–997. doi: 10.1375/183242706779462787. [DOI] [PubMed] [Google Scholar]
- Idler EL, Angel RJ. Self-rated health and mortality in the NHANES-I epidemiologic follow-up study. American Journal of Public Health. 1990;80(4):446–452. doi: 10.2105/ajph.80.4.446. [DOI] [PMC free article] [PubMed] [Google Scholar]
- Idler EL, Benyamini Y. Self-rated health and mortality: A review of twenty-seven community studies. Journal of Health and Social Behavior. 1997:21–37. [PubMed] [Google Scholar]
- Kendler KS, et al. The prediction of major depression in women: Toward an integrated etiologic model. American Journal of Psychiatry. 1993;150:1139–1139. doi: 10.1176/ajp.150.8.1139. [DOI] [PubMed] [Google Scholar]
- Kelleher D, Leavey G, editors. Identity and Health. Routledge; London: 2004. [Google Scholar]
- Landecker H, Panofsky A. From social structure to gene regulation, and back: A critical introduction to environmental epigenetics for sociology. Annual Review of Sociology. 2013;39:333–357. [Google Scholar]
- Lee JM, et al. Getting heavier, younger: Trajectories of obesity over the life course. International Journal of Obesity. 2010;34(4):614–623. doi: 10.1038/ijo.2009.235. [DOI] [PMC free article] [PubMed] [Google Scholar]
- Levine MP, et al. The relation of sociocultural factors to eating attitudes and behaviors among middle school girls. The Journal of Early Adolescence. 1994;14(4):471–490. [Google Scholar]
- Lewis GJ, Bates TC. Common genetic influences underpin religiosity, community integration, and existential uncertainty. Journal of Research in Personality. 2013;47(4):398–405. [Google Scholar]
- Manuck SB, McCaffery JM. Gene-environment interaction. Annual Review of Psychology. 2014;65:41–70. doi: 10.1146/annurev-psych-010213-115100. [DOI] [PubMed] [Google Scholar]
- McGue M, Bouchard TJ. Adjustment of twin data for the effects of age and sex. Behavior Genetics. 1984;14(4):325–343. doi: 10.1007/BF01080045. [DOI] [PubMed] [Google Scholar]
- McMullen CK, Luborsky MR. Self-rated health appraisal as cultural and identity process: African American elders’ health and evaluative rationales. The Gerontologist. 2006;46(4):431–438. doi: 10.1093/geront/46.4.431. [DOI] [PMC free article] [PubMed] [Google Scholar]
- Mead GH. The social self. The Journal of Philosophy, Psychology and Scientific Methods. 1913:374–380. [Google Scholar]
- Merrill RM, Richardson JS. Validity of self-reported height, weight, and body mass index: findings from the National Health and Nutrition Examination Survey, 2001–2006. Preventing Chronic Disease. 2009;6(4):A121. [PMC free article] [PubMed] [Google Scholar]
- Min J, et al. Variation in the heritability of body mass index based on diverse twin studies: A systematic review. Obesity Review. 2013;14(11):271–882. doi: 10.1111/obr.12065. [DOI] [PMC free article] [PubMed] [Google Scholar]
- Meaney MJ. Epigenetics and the biological definition of gene×environment interactions. Child Development. 2010;81(1):41–79. doi: 10.1111/j.1467-8624.2009.01381.x. [DOI] [PubMed] [Google Scholar]
- Mosing MA, et al. Sex differences in the genetic architecture of optimism and health and their interrelation: A study of Australian and Swedish twins. Twin Research and Human Genetics. 2010;13(04):322–329. doi: 10.1375/twin.13.4.322. [DOI] [PubMed] [Google Scholar]
- Muthén LK, Muthén BO. Mplus User’s Guide. 6. Los Angeles, CA: Muthén & Muthén; 1998–2015. [Google Scholar]
- Neale M, Cardon L. Methodology for Genetic Studies of Twins and Families. Vol. 67. Springer Science & Business Media; 1992. [Google Scholar]
- Nelson MC, et al. Emerging adulthood and college-aged youth: An overlooked age for weight-related behavior change. Obesity. 2008;16(10):2205–2211. doi: 10.1038/oby.2008.365. [DOI] [PubMed] [Google Scholar]
- Nes RB, et al. Subjective well-being: Genetic and environmental contributions to stability and change. Psychological Medicine. 2006;36(07):1033–1042. doi: 10.1017/S0033291706007409. [DOI] [PubMed] [Google Scholar]
- Okbay A, et al. Genome-wide association study identifies 74 loci associated with educational attainment. Nature. 2016;533(7604):539–542. doi: 10.1038/nature17671. [DOI] [PMC free article] [PubMed] [Google Scholar]
- Perry BL. The sociology of, in, and with genetics: The role of medical sociology in the era of ‘-omics’. Genetics, Health and Society (Advances in Medical Sociology) 2015;16:xi–xxiii. [Google Scholar]
- Perry BL, et al. Gender-specific gene–environment interactions in alcohol dependence: The impact of daily life events and GABRA2. Behavior Genetics. 2013;43(5):402–414. doi: 10.1007/s10519-013-9607-9. [DOI] [PMC free article] [PubMed] [Google Scholar]
- Perry BL. Gendering genetics: Biological contingencies in the protective effects of social integration for men and women. American Journal of Sociology. 2016;121(6):1655–96. doi: 10.1086/685486. [DOI] [PubMed] [Google Scholar]
- Plomin R, DeFries JC. Multivariate behavioral genetic analysis of twin data on scholastic abilities. Behavior genetics. 1979;9(6):505–517. doi: 10.1007/BF01067347. [DOI] [PubMed] [Google Scholar]
- Plomin R, et al. Genetic influence on life events during the last half of the life span. Psychology and Aging. 1990;5(1):25. doi: 10.1037//0882-7974.5.1.25. [DOI] [PubMed] [Google Scholar]
- Pluess M, Belsky J. Prenatal programming of postnatal plasticity? Development and Psychopathology. 2011;23(01):29–38. doi: 10.1017/S0954579410000623. [DOI] [PubMed] [Google Scholar]
- Puhl RM, et al. Perceptions of weight discrimination: Prevalence and comparison to race and gender discrimination in America. International Journal of Obesity. 2008;32(6):992–1000. doi: 10.1038/ijo.2008.22. [DOI] [PubMed] [Google Scholar]
- Purcell S. Statistical methods in behavioral genetics, appendix. In: Plomin R, DeFries J, McClearn G, McGuffin P, editors. Behavioral Genetics. 5. Worth Publishers; New York: 2008. [Google Scholar]
- Qvortrup MG. Social determinants of obesity. In: Tsichlia G, Johnstone A, editors. Fat Matters: From Sociology to Science. M&K Publishing; Cumbria, CA: 2010. [Google Scholar]
- R Core Team. R: A language and environment for statistical computing. R Foundation for Statistical Computing; Vienna, Austria: Vienna, Austria: 2016. < https://www.R-project.org/> Computing. URL https://www.R-project.org/ [Google Scholar]
- Risch N, et al. Interaction between the serotonin transporter gene (5-HTTLPR), stressful life events, and risk of depression: A meta-analysis. Jama. 2009;301(23):2462–2471. doi: 10.1001/jama.2009.878. [DOI] [PMC free article] [PubMed] [Google Scholar]
- Settle JE, et al. The Heritability of partisan attachment. Political Research Quarterly. 2009;62(3):601–613. [Google Scholar]
- Shapiro JR, Anderson DA. The effects of restraint, gender, and body mass index on the accuracy of self-reported weight. International Journal of Eating Disorders. 2003;34(1):177–180. doi: 10.1002/eat.10166. [DOI] [PubMed] [Google Scholar]
- Short SE, et al. Sex, gender, genetics, and health. American Journal of Public Health. 2013;103(S1):S93–S101. doi: 10.2105/AJPH.2013.301229. [DOI] [PMC free article] [PubMed] [Google Scholar]
- Stead M, et al. Why healthy eating is bad for young people’s health: Identity, belonging and food. Social Science & Medicine. 2011;72(7):1131–1139. doi: 10.1016/j.socscimed.2010.12.029. [DOI] [PubMed] [Google Scholar]
- Shanahan MJ, Hofer SM. Social context in gene–environment interactions: Retrospect and prospect. The Journals of Gerontology Series B: Psychological Sciences and Social Sciences. 2005;60(Special Issue 1):65–76. doi: 10.1093/geronb/60.special_issue_1.65. [DOI] [PubMed] [Google Scholar]
- Tucker-Drob EM, Bates TC. Large cross-national differences in gene× socioeconomic status interaction on intelligence. Psychological science. 2016;27(2):138–149. doi: 10.1177/0956797615612727. [DOI] [PMC free article] [PubMed] [Google Scholar]
- Tucker-Drob EM, Briley DA, Harden KP. Genetic and environmental influences on cognition across development and context. Current Directions in Psychological Science. 2013;22(5):349–355. doi: 10.1177/0963721413485087. [DOI] [PMC free article] [PubMed] [Google Scholar]
- Turkheimer E. Three laws of behavior genetics and what they mean. Current Directions in Psychological Science. 2000;9(5):160–164. [Google Scholar]
- Turkheimer E. Still missing. Research in Human Development. 2011;8(3–4):227–241. [Google Scholar]
- Yang J, et al. Common SNPs explain a large proportion of the heritability for human height. Nature Genetics. 2010;42(7):565–69. doi: 10.1038/ng.608. [DOI] [PMC free article] [PubMed] [Google Scholar]
- Yang J, et al. GCTA: A tool for genome-wide complex trait analysis. The American Journal of Human Genetics. 2011;88(1):76–82. doi: 10.1016/j.ajhg.2010.11.011. [DOI] [PMC free article] [PubMed] [Google Scholar]
Associated Data
This section collects any data citations, data availability statements, or supplementary materials included in this article.