Abstract
Under stress conditions, such as nutrient deprivation, bacteria enter into a hibernation stage, which is characterized by the appearance of 100S ribosomal particles. In Escherichia coli, dimerization of 70S ribosomes into 100S requires the action of the ribosome modulation factor (RMF) and the hibernation‐promoting factor (HPF). Most other bacteria lack RMF and instead contain a long form HPF (LHPF), which is necessary and sufficient for 100S formation. While some structural information exists as to how RMF and HPF mediate formation of E. coli 100S (Ec100S), structural insight into 100S formation by LHPF has so far been lacking. Here we present a cryo‐EM structure of the Bacillus subtilis hibernating 100S (Bs100S), revealing that the C‐terminal domain (CTD) of the LHPF occupies a site on the 30S platform distinct from RMF. Moreover, unlike RMF, the Bs HPF‐CTD is directly involved in forming the dimer interface, thereby illustrating the divergent mechanisms by which 100S formation is mediated in the majority of bacteria that contain LHPF, compared to some γ‐proteobacteria, such as E. coli.
Keywords: cryo‐EM, hibernation, HPF, RMF, translation
Subject Categories: Microbiology, Virology & Host Pathogen Interaction; Protein Biosynthesis & Quality Control; Structural Biology
Introduction
The translational activity of the bacterial cell is able to respond rapidly to a variety of environmental cues. This is exemplified by the decrease in translational activity observed in bacteria entering into stationary growth phase due to stress conditions, such as nutrient deprivation. Under such circumstances, the decrease in translational activity is correlated with the appearance of 100S particles, which arise due to the dimerization of 70S ribosomes (Wada et al, 1990), reviewed by Yoshida and Wada (2014). In E. coli, 100S formation requires the presence of the ribosome modulation factor (RMF) and the hibernation‐promoting factor (HPF, previously referred to as YhbH; Yamagishi et al, 1993; Wada et al, 1995; Maki et al, 2000; Ueta et al, 2005, 2008). Stationary phase E. coli cells also express a homolog of HPF (Fig 1A), termed YfiA (also referred to as pY or RaiA), which binds and inactivates 70S ribosomes (Agafonov & Spirin, 2004; Vila‐Sanjurjo et al, 2004), and is antagonistic to RMF and HPF action by preventing 100S formation (Maki et al, 2000; Ueta et al, 2005). The hibernation state (Yoshida et al, 2002) appears to be important for bacterial survival since inactivation of the rmf gene leads to loss of viability in stationary phase cells (Yamagishi et al, 1993; Wada et al, 2000; Shcherbakova et al, 2015) as well as increased sensitivity to osmotic (Garay‐Arroyo et al, 2000), heat (Niven, 2004), and acid stress (El‐Sharoud & Niven, 2007).
Figure 1. Cryo‐EM reconstruction of the Bs70S‐30S subcomplex.

-
ASchematic representation of the domain structure of Escherichia coli short form HPF (SHPF), RMF, and YfiA (C‐terminal extension in yellow) compared to Bacillus subtilis long form HPF (LHPF) harboring an N‐terminal (NTD, green) and C‐terminal domains (CTD, red).
-
B, CTwo views of the cryo‐EM map of the Bs70S‐30S subcomplex, with separated densities for the 30S‐A (yellow), 50S‐A (gray), 30S‐B (orange), and additional densities in green and red.
Phylogenetic analyses have revealed that the presence of RMF and HPF is restricted to a subset of γ‐proteobacteria, including E. coli, whereas the majority of other bacteria lack both RMF and YfiA, and instead contain a long form of HPF (LHPF; Fig 1A; Ueta et al, 2008, 2013; Yoshida & Wada, 2014). LHPFs comprise an N‐terminal domain (NTD) homologous to the short form HPF (SHPF) and a unique C‐terminal domain (CTD; Fig 1A), which was proposed to have weak homology with RMF (Ueta et al, 2010). LHPFs have been shown to be necessary and sufficient for 100S formation in a variety of different bacteria, including Staphylococcus aureus (Ueta et al, 2010, 2013; Basu & Yap, 2016), Lactobacillus paracasei, Thermus thermophilus (Ueta et al, 2010, 2013), Lactococcus lactis (Puri et al, 2014), and B. subtilis (Tagami et al, 2012; Akanuma et al, 2016). Unlike E. coli SHPF‐100S (Ec100S), low levels of LHPF‐containing 100S are also observed in exponentially growing cells (Ueta et al, 2010, 2013; Akanuma et al, 2016). Proteomics studies indicate that expression levels of BsLHPF increase under conditions of nutrient deprivation, but also in response to antibiotics, heat, salt, and ethanol stress (Drzewiecki et al, 1998; Reiss et al, 2012; Tagami et al, 2012). In Listeria monocytogenes, LHPF is necessary for tolerance of bacteria to aminoglycoside antibiotics during stationary phase (McKay & Portnoy, 2015) and for optimal fitness and pathogenesis (Kline et al, 2015).
Cryo‐EM and cryo‐electron tomography (cryo‐ET) structures of the Ec100S have revealed that the 70S monomers interact with each other via the back of the 30S subunits (Kato et al, 2010; Ortiz et al, 2010), consistent with earlier negative stain images (Wada, 1998; Yoshida et al, 2002). Unfortunately, the low resolution (18–38 Å) of these structures was insufficient to resolve the binding positions of the RMF and SHPF proteins within the Ec100S (Kato et al, 2010; Ortiz et al, 2010). However, structures of E. coli SHPF and RMF were subsequently determined on the T. thermophilus 70S ribosome by X‐ray crystallography (Polikanov et al, 2012), providing insight into how SHPF and RMF dimerize 70S ribosomes and inactivate translation in γ‐proteobacteria. To date, there is, however, little structural information available as to how LHPFs interact with 70S ribosomes to mediate 100S formation in the majority of bacteria other than E. coli and its close relatives.
Here we present a cryo‐EM structure of the B. subtilis 100S particle (Bs100S) revealing the binding site for the BsHPF (also referred to as YvyD). The BsHPF‐NTD binds in a position overlapping the mRNA, A‐ and P‐tRNAs, analogous to YfiA, SHPF, and the NTD of the LHPF from spinach chloroplasts (Vila‐Sanjurjo et al, 2004; Sharma et al, 2007, 2010; Polikanov et al, 2012; Graf et al, 2016; Bieri et al, 2017), indicating how LHPFs inhibit translation (Ueta et al, 2013; Basu & Yap, 2016). Unexpectedly, we observe that the BsHPF‐CTD forms a homodimer with the CTD of the BsHPF from the second 70S ribosome, thus providing a structural basis for LHPF‐mediated 100S formation. Our findings reveal that 100S formation mediated by RMF and HPF in γ‐proteobacteria, such as E. coli, is mechanistically unrelated to 100S formation mediated by LHPF in the majority of other bacteria.
Results
Cryo‐EM structure of Bs100S
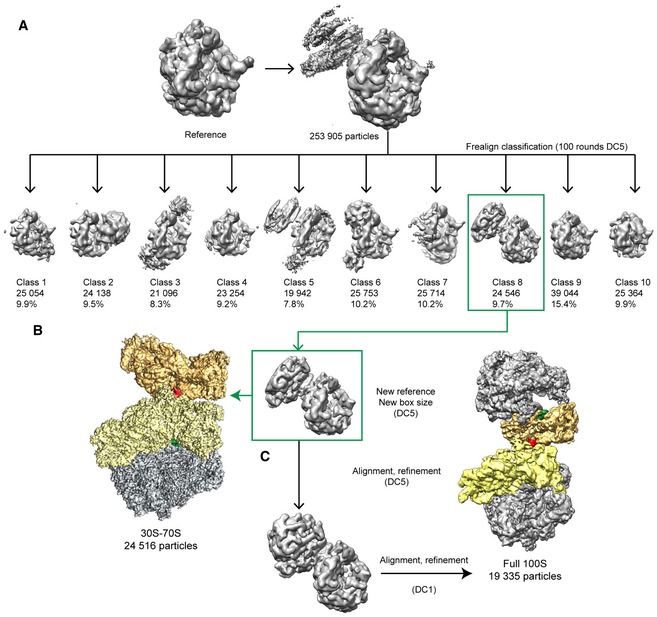
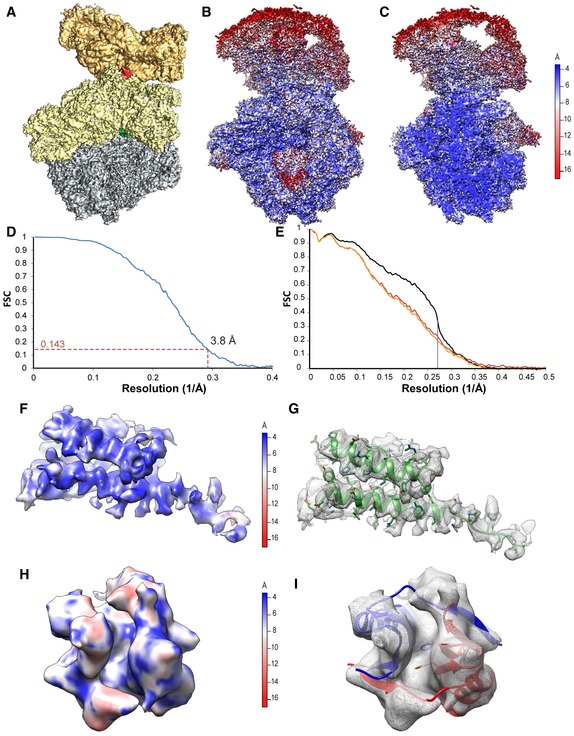
Bs100S ribosomal particles were isolated from lysates of late exponential phase cells using sucrose density gradient centrifugation (Fig EV1A, see Materials and Methods). Negative stain electron microscopy images of the isolated Bs100S revealed the characteristic dimer arrangement of 70S monomers interacting via their 30S subunits (Fig EV1B), as observed previously for B. subtilis (Tagami et al, 2012), Lactococcus lactis (Puri et al, 2014), but distinct from Ec100S (Wada, 1998; Yoshida et al, 2002; Kato et al, 2010). The presence of the BsHPF (YvyD) in the Bs100S was further confirmed using mass spectrometry. The LHPF‐containing 100S particles were then subjected to single particle cryo‐EM analysis (see Materials and Methods). Processing of the Bs100S was performed by aligning the 70S ribosomes within each 100S to a vacant 70S reference. The box size was maintained large enough so that the majority of the small 30S subunit of the second 70S ribosome in the dimer would also be represented during the reconstruction. The initial reconstructions revealed significant flexibility in the 100S, which was indicated by a stable aligned ribosome (70S‐A) with a blurred density for the second 70S ribosome (70S‐B). By implementing in silico sorting procedures, we were able to obtain a subpopulation of 100S particles with better‐defined density for the 70S‐B ribosome (Fig EV2). Subsequent refinement yielded a cryo‐EM reconstruction of the Bs70S‐30S subcomplex (Fig 1B and C) with an average resolution of 3.8 Å (Fig EV3A–D and Table EV1). Local resolution calculations indicate that the resolution for the 70S‐A monomer ranges in the core between 3.5 and 5.0 Å, whereas, as expected, the resolution for 70S‐B is worse, ranging between 5.0 and 10 Å (Fig EV3B and C). The cryo‐EM map was fitted with the molecular model of the B. subtilis 70S ribosome (Sohmen et al, 2015), revealing that the 70S‐A monomer adopts a classic non‐rotated state, as observed previously (Sohmen et al, 2015). Moreover, the swivel of head observed when E. coli SHPF and RMF bind to T. thermophilus 70S ribosomes (Polikanov et al, 2012) is not observed in the Bs100S, indicating that dimerization of B. subtilis 70S ribosomes, unlike E. coli, does not require head movement. After fitting of the 70S models, two unassigned densities remained, one located within the intersubunit space of the 70S‐A ribosome and a second located on the back of the 30S platform at the interface of the 70S‐A and 70S‐B ribosomes (Fig 1B and C).
Figure EV1. Isolation of Bacillus subtilis 100S and sequence alignments of BsHPF with EcHPF‐NTD and CaCTD.
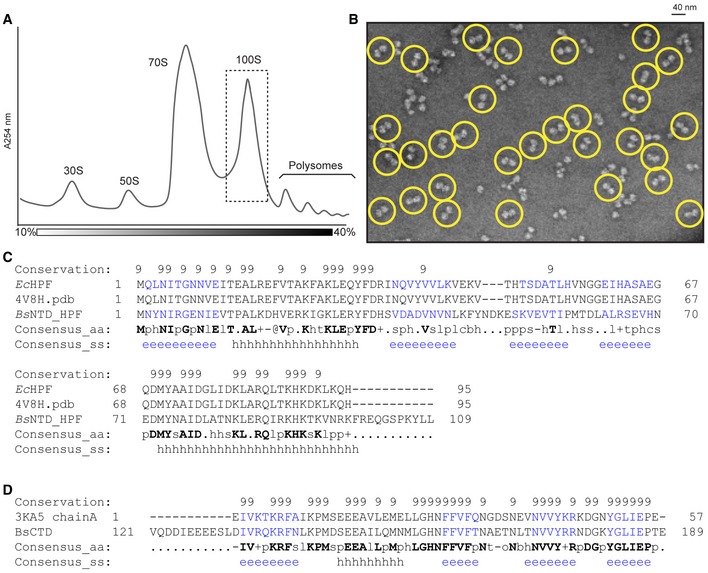
- Sucrose density gradient profile of B. subtilis extract from late log phase cells, with 30S, 50S, 70S, 100S, and polysome peaks indicated.
- Negative stain electron microscopy images of purified Bs100S from (A), with selected 70S dimers circled in yellow.
- PROMALS3D (Pei et al, 2008) sequence alignment of BsHPF‐CTD with Clostridium acetobutylicum HPF‐CTD (CaCTD; PDB ID 3KA5) that was used to generate the homology model for BsHPF‐CTD.
Figure EV2. In silico sorting and refinement scheme for the Bs70S‐30S subcomplex and complete Bs100S.
-
A–C253,905 particles were sorted into 10 classes. Class 8 had the most defined density for the 70S‐B and was taken for further refinement using (B) a box size that includes the 70S‐A ribosome and the 30S part of the 70S‐B, and (C) a larger box size that encompasses both the 70S‐A and 70S‐B ribosomes.
Figure EV3. Resolution of 70S‐A in the Bs70S‐30S subcomplex.
-
AOverview of the Bs70S‐30S subcomplex with 30S‐A (yellow), 50S‐A (gray), and 30S‐B (orange), as well as BsHPF‐NTD (green) and BsHPF‐CTD (red).
-
B, COverview (B) and transverse section (C) of the Bs70S‐30S subcomplex colored according to the local resolution, as calculated using ResMap (Kucukelbir et al, 2014).
-
DFourier‐shell correlation curve of the refined cryo‐EM map, indicating the average resolution of 70S‐A in the Bs70S‐30S subcomplex is 3.8 Å.
-
EFit of models to maps. FSC curves calculated between the refined model and the final map (black), with the self‐ and cross‐validated correlations in orange and red, respectively. Information beyond 4 Å was not used during refinement and preserved for validation.
-
F–IMap density for the (F, G) BsHPF‐NTD and (H, I) BsHPF‐CTD, which are (F, H) colored according to the local resolution, as calculated using ResMap (see Materials and Methods), or (G, I) shown as a gray mesh with molecular models (G) for BsHPF‐NTD (green) or (I) BsHPF‐CTD for 70S‐A (red) and 70S‐B (blue), using the same respective view as in (F, H).
Binding site of the BsHPF‐NTD on the small 30S subunit
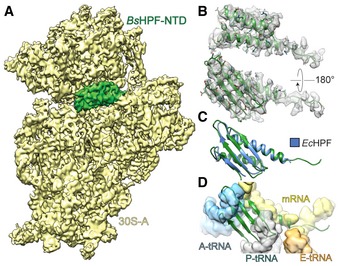
The additional map density within the intersubunit space located between the head and body of the 30S subunit was assigned to the N‐terminal domain of BsHPF (BsHPF‐NTD; Fig 2A). This was based on the high sequence similarity of the BsHPF‐NTD with E. coli YfiA and HPF (Fig EV1C), both of which were shown to bind to this region of the ribosome (Vila‐Sanjurjo et al, 2004; Polikanov et al, 2012). The local resolution of the BsHPF‐NTD ranged between 3.5 and 5.0 Å (Fig EV3F–G), enabling an unambiguous fit of the homology model to the density (Fig 2B). Aligning the E. coli SHPF‐70S structure (Polikanov et al, 2012) to the 70S‐A ribosome in the Bs100S based on the 16S rRNA revealed the expected similarity in their binding positions (Fig 2C). As noted previously for E. coli YfiA and HPF (Vila‐Sanjurjo et al, 2004; Polikanov et al, 2012) and for the NTD of the LHPF from Spinach chloroplast (Sharma et al, 2007, 2010; Graf et al, 2016; Bieri et al, 2017), the binding position of BsHPF‐NTD overlaps with the mRNA and anticodon‐stem loop regions of tRNAs bound in the ribosomal A‐ and P‐sites (Fig 2D), thus explaining the observed inhibitory effect by LHPFs when added to in vitro translation assays (Ueta et al, 2013; Basu & Yap, 2016). The BsHPF‐NTD is connected by a 34 aa linker to the CTD (Fig 1A). Map density for the linker region was not observed in the cryo‐EM map of the Bs100S, indicating that it is highly flexible. An exception is the 5–6 aa stretch of the linker region that directly follows the terminal α‐helix of the BsHPF‐NTD (Fig 2B). Map density for this N‐terminal part of the linker passes, analogous to mRNA, through the opening created by the β‐hairpin of ribosomal protein S7 and helix h23 of the 16S rRNA, and extends in the general direction of the platform cavity at the back of the 30S subunit (Fig EV4).
Figure 2. Interaction of the BsHPF‐NTD with the ribosome.
-
AInterface view of cryo‐EM map of the 30S‐A (yellow) from the Bs70S‐30S subcomplex with separated BsHPF‐NTD density (green).
-
BMap density (gray mesh) with model of BsHPF‐NTD (green).
- C, D
Figure EV4. BsHPF linker region approaches the 30S platform cavity.
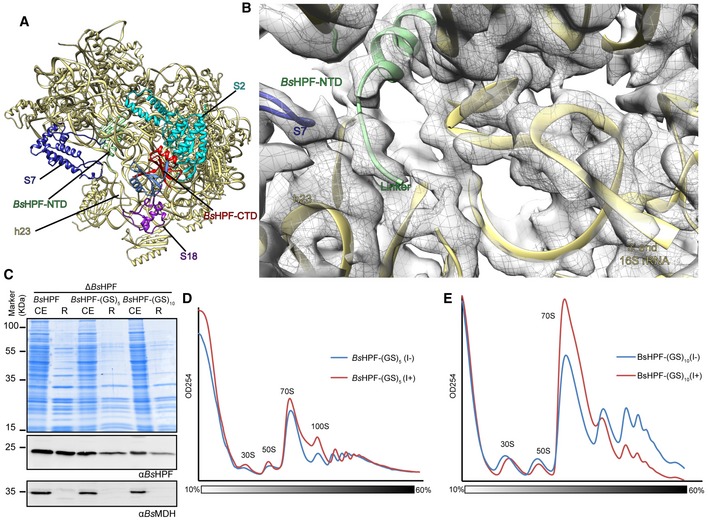
-
AOverview of the 30S cavity region showing BsHPF‐NTD (green) and BsHPF‐CTD (red) and 30S (yellow), except S2 (cyan), S7 (blue), and S18 (purple).
-
BZoom of (A), showing map density (gray mesh) for the N‐terminal part of the linker region of BsHPF (green) as well as for the 3′ end of the 16S rRNA.
-
CCoomassie (upper panel) and Western blot of cell extracts (CE) and ribosome pelleted fractions (R) of the wild‐type Bs168 (wt) strain or the ∆BsHPF strains expressing either wild‐type BsHPF, BsHPF‐(GS)5, or BsHPF‐(GS)10.
-
D, ESucrose gradient profiles of cell extracts from the (D) Bs168 ∆BsHPF amyE::BsHPF‐(GS)5 strain and (E) Bs168 ∆BsHPF amyE::BsHPF‐(GS)10 strain, in the absence (I−) or presence (I+) of IPTG.
BsHPF‐CTD is present as a dimer on the small 30S subunit
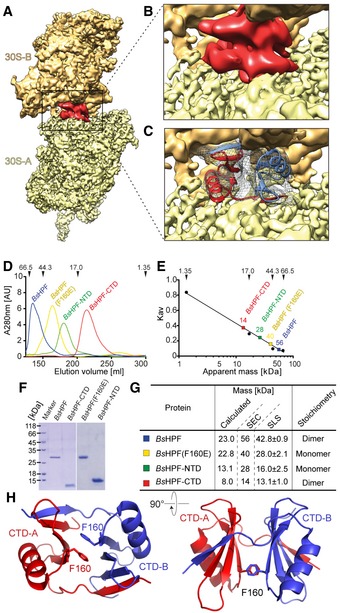
Given the general direction of the linker, we assigned the additional density located on the back of the 30S platform to the BsHPF‐CTD (Fig 3A and B). It was possible to generate a homology model for the BsHPF‐CTD based on the deposited crystal structure of the LHPF‐CTD from a closely related Firmicute, Clostridium acetobutylicum (PDB ID 3KA5; Fig EV1D). Curiously, the C. acetobutylicum LHPF‐CTD is present as a dimer in the crystal, and it was possible to make an unambiguous rigid body fit of the homology model of the BsHPF‐CTD dimer into the unassigned map density of the cryo‐EM map (Fig 3C). We note that while the structurally conserved L. monocytogenes HPF‐CTD (PDB ID 3K2T) appears as a monomer in the asymmetric unit, the homodimer forms across the crystallographic twofold symmetry. This suggests that the LHPF‐CTDs are not only dimeric on the ribosome, but are likely to be dimeric in solution. To investigate this further, we performed size‐exclusion chromatography (SEC) on the recombinantly expressed and purified wild‐type BsHPF and BsHPF variants (see Materials and Methods). Analysis of the full‐length BsHPF and the BsHPF‐CTD revealed that they have apparent molecular masses of 56 and 14 kDa, respectively, rather than the expected 23 kDa and 8 kDa (Fig 3D–G), indeed suggesting that both proteins are dimeric in solution as well as on the ribosome. The apparent migration behavior of BsHPF on SEC reflects the elongated shape of the dimer as also seen in our cryo‐EM structure of the Bs100S. Based on the structures of the dimeric C. acetobutylicum and L. monocytogenes LHPF‐CTD, we rationalized that the highly conserved Phe160 in the BsHPF‐CTD is critical for dimerization (Fig 3H). Phe160 is present within the very hydrophobic dimer interface where it forms stacking interactions with Phe160 of the second monomer (Fig 3H). We predicted that a mutation of Phe160 to Glu (F160E) would disrupt the dimer interface via introduction of a negative charge into the hydrophobic environment. To test this, we also subjected the full‐length BsHPF‐F160E protein to SEC (Fig 3D and E), revealing that the protein eluted with an apparent molecular mass of 40 kDa, smaller than the 56 kDa observed for the wild‐type BsHPF (Fig 3G). Although 40 kDa is larger than the expected size of 22.8 kDa, we believe this is due to retardation of the NTD and subsequent linker. Indeed, a BsHPF variant lacking the CTD (BsHPF‐NTD) eluted with an apparent molecular mass of 28 kDa (rather than the expected 13.1 kDa; Fig 3G). This observation is in good agreement with structural information on the NTDs of other hibernation factors showing a non‐globular shape (Polikanov et al, 2012). Our conclusions based on SEC were also confirmed using static light scattering (SLS), revealing the full‐length BsHPF had an absolute molecular mass of 42.8 ± 0.9 kDa, corresponding with a dimer (46 kDa), whereas the mass of the BsHPF‐F160E variant (28 ± 2.1 kDa) was more consistent with a monomer (22.8 kDa; Fig 3G). Taken together, our biochemical data clearly show that BsHPF forms a homodimer in solution that is mediated via its CTD.
Figure 3. Binding site of dimeric LHPF‐CTD on the Bs70S‐30S subcomplex.
-
ACryo‐EM map of the 30S‐A (yellow) from the Bs70S‐30S subcomplex with separated LHPF‐CTD density (red).
-
B, CDensity (gray mesh) with fitted model of dimeric LHPF‐CTD with monomers from 70S‐A and 70S‐B colored red and blue, respectively.
-
DGel‐filtration profiles of full‐length BsHPF (blue), BsHPF‐F160E (yellow), BsHPF‐NTD (green), and BsHPF‐CTD (red). Arrows indicate the molecular mass in kDa of the size standard.
-
EStandard curve with estimated molecular masses for full‐length BsHPF (blue), BsHPF‐F160E (yellow), BsHPF‐NTD (green), and BsHPF‐CTD (red). Arrows indicate the molecular mass in kDa of the size standard.
-
FCoomassie‐stained SDS–PAGE of the peak fractions containing BsHPF or its variants.
-
GTable summarizing the actual and apparent molecular mass of proteins in (D‐F). Size‐exclusion chromatography (SEC) and static light scattering (SLS) determined the apparent and absolute MWs, respectively. “Stoichiometry” indicates whether BsHPF and its variants exist as mono‐ or homodimer.
-
HHomology model of the BsHPF‐CTD homodimer illustrating the position of Phe160 (F160) at the dimer interface.
Dimerization of 70S ribosomes via the BsHPF‐CTD
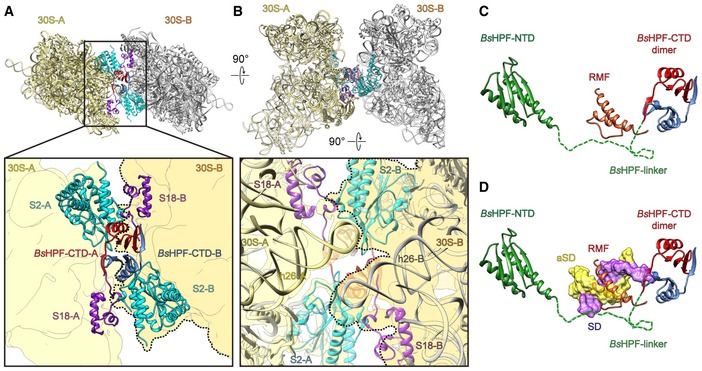
While the limited resolution of the BsHPF‐CTD (Fig EV3H and I) does not allow a detailed analysis of the contacts with the ribosomal components to be made, the fitted model nevertheless enables a general description of the interaction mode (Fig 4A). The BsHPF‐CTD appears to interact exclusively with ribosomal proteins S2 and S18 and does not establish contact with the 16S rRNA. Importantly, each BsHPF‐CTD monomer contacts S2 from the 70S to which the corresponding BsHPF‐NTD is bound, whereas the interaction with the N‐terminal extension of S18 is from the second 70S ribosome (Fig 4A). The 100S dimer is also stabilized by direct interactions between the 70S‐A and 70S‐B monomers (Fig 4A and B). In addition to the contacts established between the N‐terminal helix of S2 and the N‐terminal extension of S18, the N‐terminal β‐hairpin and proximal region of the α2‐helix of S2 establish a large interaction surface with the stem‐loop of helix h26 of the 16S rRNA of the second 70S (Fig 4B). Thus, the dimerization of the HPF‐CTDs stabilizes and facilitates direct interaction between the 70S‐A and 70S‐B monomers in the Bs100S. Our findings highlight the importance of the BsHPF‐CTD for 70S dimerization, and therefore 100S formation, which is in complete agreement with biochemical studies demonstrating that truncation of the CTD from LHPF leads to loss of 100S formation (Puri et al, 2014; Basu & Yap, 2016). Moreover, it was reported that the CTD of the LHPF from Lactococcus lactis can dimerize E. coli 70S ribosomes, but only when acting in concert with the SHPF from E. coli (Puri et al, 2014). This observation supports to some extent the previous assertion that the HPF‐CTD functions analogously to RMF; an assertion that was partly based on proposed sequence homology between HPF‐CTD and RMF (Ueta et al, 2010). However, comparison of the structures of BsHPF‐CTD with that of RMF on the ribosome (Polikanov et al, 2012) reveals that there is no structural similarity in terms of the protein fold and, despite both binding at the platform region at the back of the 30S subunit, there is no overlap in their binding sites on the ribosome (Fig 4C). The binding position of RMF was suggested to inhibit translation by sterically preventing formation of the Shine‐Dalgarno‐helix (SD‐helix) between the 5′ end of the mRNA and the 3′ end of the 16S rRNA (Polikanov et al, 2012). In contrast, the HPF‐CTD does not overlap with the SD‐helix (Fig 4D), although we cannot exclude the possibility that the flexible linker of BsHPF traverses the RMF binding site since it was not visualized in the cryo‐EM map.
Figure 4. Dimerization interface of the Bs70S‐30S subcomplex.
-
A, BDistinct views of the dimer interface between 30S‐A (yellow) with BsHPF‐CTD‐A (red) and 30S‐B (gray, darker yellow with dashed line in zoomed panel) with BsHPF‐CTD‐B (blue). Ribosomal proteins S2 (cyan), S18 (purple), and 16S rRNA are shown only, and the surface outline of the 30S subunit is included schematically for reference.
-
C, DBinding site of BsHPF‐NTD (green) and dimeric BsHPF‐CTD (red, blue) relative to (C) RMF (orange; Polikanov et al, 2012) and (D) SD–anti‐SD helix (yellow‐purple surface; Sohmen et al, 2015). The dashed line indicates the linker and is shown only to illustrate that the 34 amino acids are more than sufficient to connect the NTD and CTD; however, no density for the linker was observed, suggesting it does not adopt a defined conformation on the ribosome.
Importance of the linker–CTD for 100S formation
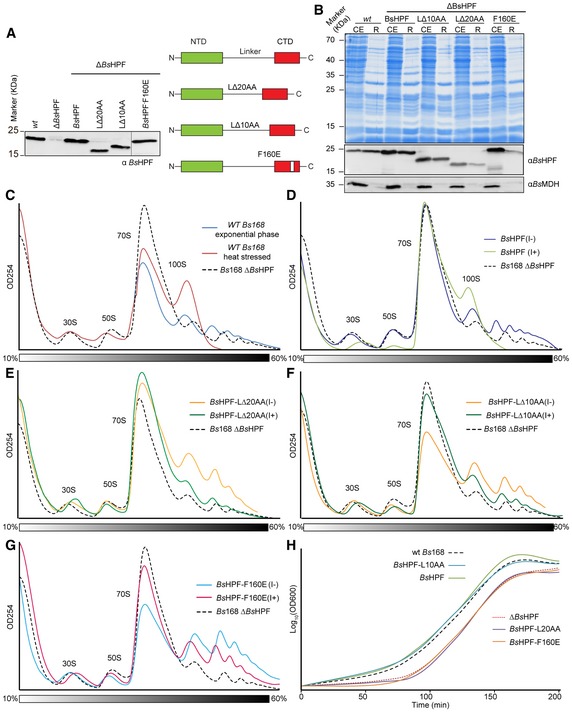
To assess the importance of the linker and CTD of BsHPF for 100S formation in vivo, we generated a B. subtilis 168 strain where the yvyD gene was inactivated (∆BsHPF), as confirmed by Western blotting using antibodies specific to BsHPF (Fig 5A). We then re‐introduced the wild‐type yvyD gene, as well as yvyD variants, into the amyE locus and monitored the IPTG‐induced expression of the BsHPFs (Fig 5A). To investigate the importance of the linker between the NTD and CTD of BsHPF, we generated ∆BsHPF strains expressing BsHPF deletion variants lacking 10 aa (BsHPF‐L∆10AA, lacking residues 110–119) or 20 aa (BsHPF‐L∆20AA, lacking residues 105–124) from the central region of the linker (Fig 5A). In addition, we generated a BsHPF variant bearing the F160E mutation in the CTD (BsHPF‐F160E), which interferes with homodimerization (Fig 3G). Western blotting of cell extracts from stationary phase bacteria indicated that all BsHPF variants inserted into the amyE locus were expressed in the presence of IPTG at similar levels to wild‐type BsHPF observed in the parental Bs168 strain (Fig 5A). Pelleting experiments indicated that full‐length BsHPF co‐migrated with the ribosome fraction as expected, as did the BsHPF‐L∆10AA variant (Fig 5B). In contrast, the BsHPF‐L∆20AA and BsHPF‐F160E variants had significantly reduced association with the ribosomal pellets (Fig 5B), suggesting that the deletion of 20 aa within the linker or preventing homodimerization via the CTD disrupts the interaction of BsHPF with the ribosome. This is consistent with previous studies using S. aureus LHPF where C‐terminal truncations of 42 aa (∆CTD) and 90 aa (∆linker–CTD) led to progressive loss in ribosome binding (Basu & Yap, 2016).
Figure 5. Monitoring 100S formation in vivo for BsHPF variants.
-
AWestern blot using antibodies raised against BsHPF to assess the levels of BsHPF in cell extracts of wild‐type Bs168 (wt), ∆BsHPF, and ∆BsHPF strains expressing either wild‐type BsHPF or BsHPF‐L∆20AA, BsHPF‐L∆10AA, BsHPF‐F160E variants.
-
BCoomassie (above) and Western blot of cell extracts (CE) and ribosome pelleted fractions (R) of the wild‐type Bs168 (wt) strain or the ∆BsHPF strains expressing either wild‐type BsHPF, BsHPF‐L∆10AA, BsHPF‐L∆20AA, and BsHPF‐F160E.
-
CSucrose gradient profiles of cell extracts from the wild‐type Bs168 (wt) strain in exponential phase (blue) or heat stressed (red), compared with the extract from the Bs168 ∆BsHPF strain (dashed line).
-
D–GSucrose gradient profiles of cell extracts from the (D) Bs168 ∆BsHPF amyE::BsHPF strain, (E) Bs168 ∆BsHPF amyE::BsHPF‐L∆20AA strain, (F) Bs168 ∆BsHPF amyE::BsHPF‐L∆10AA strain, and (G) Bs168 ∆BsHPF amyE::BsHPF‐F160E strain in the absence (I−) or presence (I+) of IPTG. The dashed line of the Bs168 ∆BsHPF strain from (C) is shown for reference.
-
HGrowth curves illustrating the recovery from stationary phase of the wild‐type Bs168 (wt), ∆BsHPF, and ∆BsHPF strains expressing either wild‐type BsHPF or BsHPF‐L∆20AA, BsHPF‐L∆10AA, BsHPF‐F160E variants.
Source data are available online for this figure.
We next employed sucrose density gradient centrifugation to monitor the formation of 100S ribosomes using the different Bs168 strains (Fig 5C–G). As controls, the wild‐type Bs168 strain was harvested during exponential phase, where a large 70S peak and lots of polysomes were observed, but little or no 100S were evident (Fig 5C). In contrast, a short heat treatment of the wild‐type cells led to a complete loss of polysomes and the appearance of a prominent 100S peak (Fig 5C), as observed previously for B. subtilis (Akanuma et al, 2016). Formation of 100S was never observed in the ∆BsHPF strain (Fig 5C) regardless of the stress conditions tested, in agreement with the strict dependence on BsHPF for 70S dimerization (Akanuma et al, 2016). However, when the yvyD gene was reintroduced into the amyE locus of the ∆BsHPF strain, 100S formation (and loss of polysomes) was observed, but only when BsHPF expression was induced by the presence of IPTG (Fig 5D). No significant increase in the 100S peak, nor reduction in polysomes, was observed when expression of the BsHPF‐L∆20AA variant was induced (Fig 5E), consistent with the lack of ribosome binding (Fig 5B). Surprisingly, similar results were obtained for BsHPF‐L∆10AA (Fig 5F), suggesting that although the BsHPF‐L∆10AA can still bind to the ribosome (Fig 5B), it is impaired in 100S formation. BsHPF variants where the 10 aa or 20 aa were substituted (rather than deleted) by glycine‐serine (GS) repeats, creating BsHPF‐(GS)5 or BsHPF‐(GS)10, respectively, also led to both a reduction in ribosome binding and 100S formation (Fig EV4C–E), suggesting that the sequence and not just the length of the linker is critical for BsHPF activity. Lastly, we also monitored 100S formation in the Bs168 strain expressing the BsHPF‐F160E variant. As expected, no increase in the 100S peak or decrease in the polysome peaks was observed upon BsHPF‐F160E induction (Fig 5G), indicating that BsHPF‐CTD homodimerization is necessary for 100S formation.
Further support for the loss of activity of the BsHPF‐L∆20AA and BsHPF‐F160E variants comes from growth assays. Compared to the wild‐type Bs168 strain, the ∆BsHPF strain exhibits a lag phase when stationary phase cells are diluted into fresh media (Fig 5H), as reported previously (Akanuma et al, 2016). The lag phenotype can be restored by expression of wild‐type BsHPF, but not by BsHPF‐L∆20AA and BsHPF‐F160E variants (Fig 5H). Curiously, the BsHPF‐L∆10AA variant also rescued the growth phenotype (Fig 5H), suggesting that ribosome binding rather than 100S formation may be important for efficient stationary phase recovery.
Distinct arrangement of 70S monomers in the Bs100S
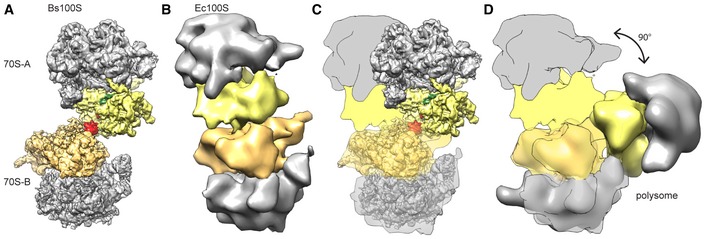
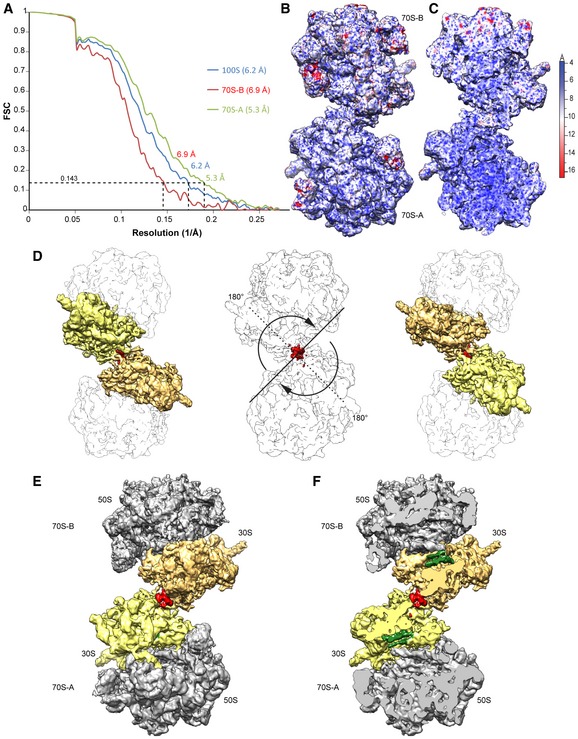
In order to obtain a reconstruction of the complete Bs100S particle to compare with previous Ec100S reconstructions, we also reprocessed the cryo‐EM data using a larger box size that completely encompassed both 70S monomers (Fig EV2). Despite the inherent flexibility between the 70S monomers, we were able to obtain a reconstruction of the Bs100S (Fig 6A) with an average resolution of 6.2 Å (Fig EV5A–C). The relative orientation of the 70S‐A and 70S‐B monomers within the Bs100S was related by a 180° rotational symmetry with the axis of rotation centered on the dimeric BsHPF‐CTD (Fig EV5D). As expected, we observed additional density for the HPF‐NTD within the intersubunit space and for the HPF‐CTD at the back of the 30S subunit (Fig EV5E and F). Comparison of the Bs100S with the previous cryo‐EM and cryo‐ET reconstructions of the Ec100S (Fig 6B) revealed a dramatically different monomer arrangement (Fig 6C). While Ec100S dimerization involves a “back‐to‐back” interaction of the 30S subunits of each 70S monomers, Bs100S dimerization involves a more “side‐to‐side” (platform‐to‐platform) interaction of the 30S subunits. In the Ec100S, dimerization is proposed to be stabilized by contacts between S2 on one 70S with the cavity formed by S3/S4/S5 on the other (Kato et al, 2010), which may be facilitated by a swivel movement of the head of the 30S subunit that was observed upon RMF binding (Polikanov et al, 2012). In contrast, the head position of the Bs100S is identical to that observed in the classic post‐translocational state ribosome (Sohmen et al, 2015) and, unlike RMF, the BsHPF‐CTD directly comprises part of the dimerization interface. The spatial orientation of the 70S monomers in the Bs100S (Fig 6A) could be considered intermediate between that observed in the Ec100S (Fig 6B; Kato et al, 2010) and the orientation observed in the cryo‐ET reconstructions of E. coli polysomes (Fig 6D; Brandt et al, 2009).
Figure 6. Spatial organization of Bs100S, Ec100S, and polysomes.
-
A–DComparison of the 70S‐A and 70S‐B monomer arrangement in (A) Bs100S, compared with (B, C) Ec100S (Ortiz et al, 2010) and (D) Escherichia coli polysomes (Brandt et al, 2009). The 30S‐A (yellow), 30S‐B (orange), 50S (gray), BsHPF‐NTD (green), and BsHPF‐CTD (red) are colored for reference, and schematics of the Ec100S are presented in (C) and (D) for ease of comparison.
Figure EV5. Resolution of the complete dimeric Bs100S.
-
AFourier‐shell correlation curve of the refined cryo‐EM map, indicating the average resolution of 70S‐A, 70S‐B, and the complete Bs100S is 5.3, 6.9 and 6.2 Å, respectively.
-
B, CCryo‐EM map of the dimeric Bs100S colored according to local resolution showing (B) overview and (C) transverse section of the complete 100S disome.
-
DThe 70S‐A and 70S‐B monomers in the Bs100S are related by rotational symmetry of ˜180°.
-
E, FCryo‐EM map of the (E) dimeric Bs100S with 30S‐A (yellow), 30S‐B (orange) and 50S (gray), and (F) transverse section of (E) highlighting the densities for the BsHPF‐NTD (green) and BsHPF‐CTD (red).
Discussion
The appearance of hibernating 100S ribosomes is a near universal response of bacteria to adapt to a variety of stress conditions, in particular nutrient limitation (Ueta et al, 2013; Yoshida & Wada, 2014). Under these circumstances, bacteria employ second messenger signaling molecules, such as (p)ppGpp and cyclic AMP (cAMP), to reprogram the cellular activity network, down‐regulating genes associated with translation and up‐regulating stress response and amino acid biogenesis pathways (Hauryliuk et al, 2015; Steinchen & Bange, 2016). In E. coli, transcription of rmf, the gene encoding RMF, is up‐regulated by (p)ppGpp when amino acids become limiting (Izutsu et al, 2001) and by cAMP upon carbon starvation (Shimada et al, 2013). Transcription of yvyD, the gene encoding BsLHPF, is under the control of the sigma factors σH and σB (Drzewiecki et al, 1998; Tam le et al, 2006; Akanuma et al, 2016), and up‐regulated by the presence of the alarmone (p)ppGpp (Eymann et al, 2001; Tagami et al, 2012; Shimada et al, 2013; Fig 7A). Similarly, in the cyanobacterium Synechococcus elongatus, LHPF is also up‐regulated by (p)ppGpp to enable dark adaptation (Hood et al, 2016).
Figure 7. Model for BsHPF‐induced 100S formation.
-
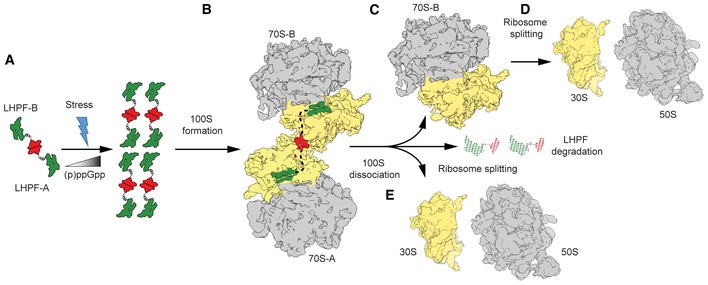
AStress conditions, such as nutrient deprivation, lead to elevated levels of (p)ppGpp, which up‐regulates expression of the LHPF (NTD, green; CTD, red). The LHPF‐CTD can interact to form homodimers in solution and therefore may also be present as dimers in the cell.
-
BThe long linker of the dimeric LHPF enables the LHPF‐NTD to interact with two independent 70S ribosomes and by bringing them in to close proximity stabilizes the 70S dimers, forming 100S.
-
C–EFollowing removal of the stress conditions, BsHPF levels decline leading to (C) dissociation of 100S into 70S ribosomes and (D) eventually ribosome splitting into 30S and 50S subunits, or (E) alternatively directly in 30S and 50S subunits.
The up‐regulation of LHPF leads to increased 100S formation, indicating that LHPF competes effectively with translation factors, as evidenced by LHPF inhibition of in vitro translation systems (Ueta et al, 2013; Basu & Yap, 2016). Since we observed that BsHPF is dimeric in solution, we favor a model whereby dimeric BsHPF interacts independently with two 70S ribosomes (Fig 7B). In this model, we propose that BsHPF utilizes the free NTDs and long linker to initially bring 70S ribosomes into close proximity, and then further stabilizes the 70S dimer using the BsHPF‐CTD ribosome interface (Fig 7B). However, we cannot exclude that at a fraction of BsHPF resides as a monomer in vivo, and these BsHPF monomers bind separately to the 70S ribosome, such that 100S formation could then occur concomitantly with BsHPF‐CTD homodimerization. Moreover, it remains unclear how hibernating 100S ribosomes exactly provide protection against stress. What is clear however is that in the absence of 100S, 70S ribosomes are slowly degraded leading to early cell death, suggesting that hibernating 100S are less susceptible to degradation by RNases (Fukuchi et al, 1995; Wada, 1998; Niven, 2004; Shcherbakova et al, 2015; Akanuma et al, 2016). Because 100S formation does not significantly alter the large rRNA surface exposed to RNases, we believe LHPF binding and 100S formation may interfere with a specific ribosome degradation pathway, rather than preventing non‐specific RNase action on ribosomes. The identification of BsHPF variant, such as the BsHPF‐L∆10AA, which binds to the ribosome but does not promote 100S formation, may allow the contribution of these activities to ribosome protection to be dissected further.
In E. coli, disassembly of 100S is rapid and occurs within 1 min upon transfer to fresh medium, suggesting that an active mechanism exists to remove EcHPF and RMF from the ribosome (Wada, 1998; Aiso et al, 2005). In contrast, Bs100S are more stable than Ec100S (Ueta et al, 2013) and upon transfer to fresh media significant dissociation of Bs100S was only observed after 120 min, where LHPF protein levels were also significantly decreased (Akanuma et al, 2016). Nevertheless, recycling factors, such as IF3, RRF, and EF‐G, which have been reported to remove LHPF (PSRP‐1) from Spinach chloroplast ribosomes (Sharma et al, 2010), might also be involved in BsHPF release and 100S dissociation (Fig 7C–E).
In conclusion, the high conservation of the LHPF proteins suggests that most, if not all, LHPF proteins are present as dimers in the cell, with the implication that the majority of bacteria are likely to utilize an identical mechanism to induce 100S formation as we have described here for B. subtilis (Fig 7).
Materials and Methods
Cloning of BsHPF and BsHPF variants for protein purification
The yvyD gene encoding BsHPF was amplified from B. subtilis PY79 genomic DNA by polymerase chain reaction using Phusion High‐Fidelity DNA Polymerase (NEB) according to the manufacturer's manual. The forward primer encoded a hexa‐histidine tag in‐frame with the DNA sequence of yvyD. The fragment was cloned via NcoI/XhoI restriction sites into a modified pGAT2‐vector incorporating a GST‐tag N‐terminal of His6‐BsHPF. BsHPF‐CTD (amino acids 130–189 of BsHPF), BsHPF‐NTD (amino acids 1–104 of BsHPF), and BsHPF(F160E) containing an N‐terminal hexa‐histidine tag were amplified by PCR as described above and cloned via NcoI/XhoI restriction sites into pET24d(+) vector (Novagen). Mutations within BsHPF were introduced by overlapping PCR.
Protein production and purification for SEC and SLS
Escherichia coli BL21(DE3) cells (NEB) carrying the expression plasmid were grown in lysogeny broth (LB) medium supplemented with ampicillin (100 μg/ml) or kanamycin (50 μg/ml) and D(+)‐lactose‐monohydrate (12.5 g/l) for 16 h at 30°C under rigorous shaking (180 rpm). The cells were harvested (3,500 × g, 20 min, 4°C), resuspended in lysis buffer (20 mM HEPES‐KOH, pH 8.0, 20 mM KCl, 20 mM MgCl2, 500 mM NaCl, 40 mM imidazole) and lysed using a M‐110L Microfluidizer (Microfluidics). After centrifugation (47,850 × g, 20 min, 4°C), the clear supernatant was loaded on a HisTrap HP 1 ml column (GE Healthcare) equilibrated with 15 column volumes (CV) of lysis buffer. After washing with 15 CV of lysis buffer, the protein was eluted with 5 CV of elution buffer (lysis buffer containing 500 mM imidazole). The GST‐tag was removed from BsHPF variants by incubation with 100 U of bovine thrombin (Merck Millipore) for 2 h at 20°C. After dilution with 12 volume parts of lysis buffer without imidazole, BsHPF variants were resubjected to Ni‐NTA affinity chromatography as described above and the elution fraction containing BsHPF were collected. BsHPF and BsHPF variants were then concentrated using an Amicon Ultracel‐10K or 3K, respectively (Merck Millipore), and applied to size‐exclusion chromatography (HiLoad 26/600 Superdex 75 pg, GE Healthcare) equilibrated in SEC buffer (20 mM HEPES‐KOH, pH 8.0, 20 mM KCl, 20 mM MgCl2, 500 mM NH4Cl). Protein‐containing fractions were pooled and concentrated to ~500 μM as determined by a spectrophotometer (NanoDrop Lite, Thermo Scientific).
Analysis of oligomerization states of BsHPF variants by SEC and SLS
The apparent molecular weight was analyzed by size‐exclusion chromatography using a HiLoad 26/600 Superdex 75 pg column (GE Healthcare) equilibrated in SEC buffer. A standard curve for molecular mass determination was obtained using BSA (66.5 kDa), ovalbumin (chicken, 44.3 kDa), myoglobin (horse, 17 kDa), and vitamin B12 (1.35 kDa). The absolute molecular weight was determined by static light scattering (SLS) with a DelsaMax CORE (Beckmann Coulter) according to the manufacturer's instructions.
Cloning of BsHPF and BsHPF variants for in vivo studies
Full‐length yvyD was amplified from genomic DNA by PCR as described above with the forward primer encoding the strong ribosomal binding site of the gsiB gene (AGGAGGAATTCAAA) and cloned via SalI/SphI restriction sites into the pDR111 plasmid (Ben‐Yehuda et al, 2003). The BsHPF‐LΔ10AA, BsHPF‐LΔ20AA, and BsHPF‐F160E mutation were introduced by overlap extension PCR and cloned via SalI/SphI restriction sites as described above. The resulting plasmids were linearized by digestion with ScaI and transformed into naturally competent B. subtilis cells. Proper integration into the amyE locus was checked by growing selected transformants on LB‐Agar containing 1% starch overnight and staining the plates with a solution of 0.5% (w/v) iodine, 1% (w/v) potassium iodine. Strains and oligonucleotides used in this study are presented in Tables EV2 and EV3.
Western blotting of BsHPF variants
Strains expressing HPF variants in trans were grown in LB medium supplemented with 1 mM IPTG with rigorous shaking to until the mid‐exponential phase (OD600 of ~0.8), harvested by centrifugation at 11,000 × g, 4°C for 5 min, washed once in TE buffer (10 mM Tris–HCl, 1 mM EDTA, pH 8.0), and disrupted by sonication three times for 30 s on ice in TE buffer supplemented with 1 mM PMSF. The soluble protein was cleared from cell debris by centrifugation at 11,000 × g, 4°C for 5 min. 10 μg of the protein extract (as determined by the Bradford assay) was analyzed by SDS–PAGE and Western Blotting onto a nitrocellulose membrane. As controls, equally treated samples from a stationary phase overnight culture of B. subtilis wild‐type or Δhpf cells were loaded. The BsHPF protein was detected using a polyclonal antibody raised against BsHPF (Pineda Antibody Service) and a polyclonal Goat anti‐Rabbit IgG alkaline Phosphatase conjugated antibody (Antikörper Online). Western blotting using an antibody against the malate dehydrogenase (MDH) was used as a loading control. The ECF reagent (GE Healthcare) was used as a substrate according to the manufacturer's manual, and chemifluorescent signals were detected using a cooled CCD camera in a ChemiBIS 4.2 Bioimaging system (DNR).
Binding assay for BsHPF variants with pelleted ribosomes
Bacillus subtilis cells were grown in 200‐ml LB medium supplemented with 1 mM IPTG with rigorous shaking (200 rpm) to the mid‐exponential phase (OD600 ~0.8) and harvested by centrifugation at 15,300 × g, 10 min, 4°C. Ribosomes were pelleted as described in (Schmalisch et al, 2002). Briefly, cells were washed once in buffer A (20 mM Tris–HCl, 100 mM NH4Cl, 10 mM MgCl2, 10 mM 2‐mercaptoethanol, pH 7.5), resuspended in 3 ml of the same buffer with 1 mM PMSF and disrupted in a French Pressure Cell three times at 1,000 psi. The lysate was cleared from cell debris by centrifugation for 30 min at 29,953 × g, 4°C (SW55‐Ti, Beckman Coulter), layered on top of a 8 ml 1.1 M sucrose cushion in buffer A, and centrifuged for 16 h at 119,307 × g, 4°C (SW40‐Ti, Beckman Coulter). The cell pellet was washed three times in buffer A and resuspended in buffer B (20 mM Tris–HCl, 100 mM NH4Cl, 6 mM MgCl2, 2 mM DTT). The suspension was centrifuged at 10,000 × g, 10 min, 4°C, and the supernatant containing the ribosomes was collected. 10 μg of the total soluble protein (“CE”, as determined by the Bradford assay) and an equal volume of the ribosome suspension (“R”) was subjected to 15% SDS–PAGE and subsequent stained with Coomassie using standard procedures or Western blotting as described above.
Growth recovery from stationary phase
Precultures of B. subtilis cells were grown in 5‐ml LB medium supplemented with 0.5 mM IPTG at 37°C for 18 h, to ensure the cells reached the stationary growth phase. The cultures were then diluted to an OD600 of 0.05 into 20‐ml fresh LB medium and grown at 37°C with rigorous shaking. The cell growth was monitored by determining the optical density at 600 nm (OD600) at regular intervals.
Sucrose density gradient centrifugation analysis
Analysis of 100S formation was performed as described previously for B. subtilis (Akanuma et al, 2016). Briefly, 50‐ml LB medium was inoculated at a 1:100 dilution with an overnight culture. Expression was induced using 1 mM IPTG at an OD600 of 0.4. Cells were harvested at the stationary phase by centrifugation at 4,000 × g for 10 min at 4°C (Hettich Rotanta 46R) and the cell pellet re‐suspended in buffer C (50 mM HEPES‐KOH, pH7.4, 100 mM KOAc, 25 mM Mg(OAc)2, 6 mM β‐mercaptoethanol). Cells were lysed using the sonifier three times, with each cycle consisting of 30 s at 30% power followed by centrifugation at 16,000 × g for 15 min at 4°C to remove cellular debris. A total OD260 of 10 of the cleared lysate was loaded onto sucrose density gradients (10–60% sucrose in buffer C) by centrifugation at 154,693 × g (SW‐40 Ti, Beckman Coulter) for 3 h at 4°C and then analyzed using a Gradient Station (Biocomp) with an Econo UV Monitor (Bio‐Rad) and a FC203B Fraction Collector (Gilson).
Preparation of Bacillus subtilis S12 extract
Bacillus subtilis S12 extract was prepared as described (Sohmen et al, 2015). Briefly, an “INFORCE HT minifors” bench top fermenter was used to grow B. subtilis strain 168 cells to an OD600 4.5 in 2× YPTG medium (16 g/l peptone, 10 g/l yeast extract, 5 g/l NaCl, 22 mM NaH2PO4, 40 mM Na2HPO4, 19.8 g/l glucose (sterile filtered)), with extra glucose feeding at 37°C while maintaining a pH 7.0 and oxygen level (60%). After collecting cells at 5,000 × g at 4°C for 15 min, they were washed 3× in cold Buffer A (10 mM Tris–acetate (pH 8.2), 14 mM magnesium acetate, 60 mM potassium glutamate, 1 mM dithiothreitol, and 6 mM β‐mercaptoethanol). Cells were then snap‐frozen in liquid nitrogen and stored at −80°C. 15 g of cells was thawed on ice, resuspended in 10 ml of cold buffer B (buffer A missing β‐mercaptoethanol), and lysed 3× at 15,000 psi in an “microfluidics model 110I lab homogenizer”. The lysate was cleared at 12,000 × g and 4°C for 10 min and incubated in a water bath for 30 min at 37°C. The cell extract was aliquoted, snap‐frozen, and stored at −80°C. Extracts were analyzed on sucrose density gradients (10–50% sucrose in buffer C), by centrifugation at 89,454 × g (SW‐28, Beckman Coulter) for 4 h at 4°C. For 100S purification, 100S fractions were collected using a Gradient Station (Biocomp) with an Econo UV Monitor (Bio‐Rad) and a FC203B Fraction Collector (Gilson). Purified 100S ribosomes were concentrated by centrifugation at 92,159 × g for 2.5 h at 4°C (TLA110 rotor, Beckman Coulter).
Negative stain electron microscopy
Ribosomal particles were diluted in buffer C to a final concentration of 0.2 OD260/ml. A 3.5 μl sample was applied onto a carbon‐coated grid. After 30 s, the grids were washed with distilled water and then stained with 2% aqueous uranyl acetate for 15 s. The remaining liquid was removed by touching the grid with filter paper. Micrographs were taken using a Morgagni transmission electron microscope (FEI).
Cryo‐electron microscopy and single particle reconstruction
A total of 4 OD260/ml Bs100S sample were applied to 2 nm pre‐coated Quantifoil R3/3 holey carbon‐supported grids and vitrified using Vitrobot Mark IV (FEI Company). Data collection was performed using EM‐TOOLS (TVIPS GmbH) on a Titan Krios transmission electron microscope equipped with a Falcon II direct electron detector (FEI Company) at 300 kV at a pixel size of 1.084 Å and a defocus range of 0.7–2.2 μm. Ten frames (dose per frame of 2.5 e−/Å) were aligned using Motion Correction Software (Li et al, 2013). Power‐spectra, defocus values, and astigmatism were then determined using CTFFIND4 software (Rohou & Grigorieff, 2015). Micrographs showing Thon rings beyond 3.5 Å were manually inspected for a good areas and power‐spectra quality. Automatic particle picking was then performed using SIGNATURE (Chen & Grigorieff, 2007), and single particles were windowed out in small box able to contain a 70S ribosome together with the majority of the small 30S subunit of the neighboring 70S ribosome. The particles were then further processed using FREALIGN (Grigorieff, 2007). The 253,905 particles were first subjected to an extensive 3D classification (Fig EV2A and B), and the selected 24,546 Bs100S particles of class 8 were then subjected to refinement using 30S‐70S mask resulting in a final reconstruction of 3.8 Å (0.143 FSC) average resolution (Figs EV2C and EV3). Local resolution was finally calculated using ResMap (Kucukelbir et al, 2014). For the processing of the complete Bs100S, the coordinates of the selected 24,546 particles were carefully re‐inspected in order to remove particles that were within close proximity of another particle, so as not to include particles twice in the final reconstruction; 5,511 particles were identified and removed from class 8, and the rest of particles were windowed out using a larger box size that encompassed two 70S ribosomes (Fig EV2D). The remaining 19,335 particles were then realigned and refined, resulting in a final reconstruction with an average resolution of 6.2 Å (0.143 FSC; Fig EV5A–C).
Molecular modeling, refinement, and validation
The molecular model for the ribosomal proteins and rRNA of the 70S ribosome of the Bs100S was based on the molecular model from the recent cryo‐EM reconstruction of the B. subtilis 70S ribosome (PDB ID 3JW9; Sohmen et al, 2015). The molecular model was fitted as a rigid body into the cryo‐EM density maps using UCSF Chimera (Pettersen et al, 2004). For BsHPF‐NTD domain, a homology model was generated using HHPred (Soding et al, 2005) based on the HPF protein template from E. coli (PDB ID 4V8H; Polikanov et al, 2012; Fig EV1C). Molecular models were fitted and adjusted by using COOT (Emsley & Cowtan, 2004) and refined in Phenix using phenix.real_space_refine (Adams et al, 2010). Model over‐fitting was evaluated through its refinement against one cryo‐EM half map as described previously (Brown et al, 2015). FSC curves were calculated between the resulting model and the half map used for refinement, as well as between the resulting model and the other half map for cross‐validation (Fig EV3E). The final refinement statistics were determined using MolProbity (Chen et al, 2010) and are provided in Table EV1. For BsHPF‐CTD domain, a homology model was generated using HHPred based on the template from C. acetobutylicum (PDB ID 3KA5; Fig EV1D). The molecular model was rigid body fitted using UCSF Chimera (Pettersen et al, 2004).
Figure preparation
Figures showing map densities and atomic models were generated using UCSF Chimera (Pettersen et al, 2004).
Accession numbers
The cryo‐EM map of the Bs70S‐30S subcomplex and the complete Bs100S have been deposited in the EMDB with the accession codes EMD‐3656 and EMD‐3664, respectively. Atomic coordinates have been deposited in the Protein Data Bank with accession code PDB ID 5NJT.
Author contributions
DNW, GB, and KT designed and supervised the study. MA prepared the Bs100S sample for cryo‐EM and performed all sucrose gradient analyses. OB collected the cryo‐EM data. BB, MA, and SA processed the cryo‐EM data. BB, MA, RB, and DNW interpreted the cryo‐EM data. WS cloned and purified the BsHPF protein variants and performed the SEC and SLS. HS generated all BsHPF expression strains and performed Western blotting, growth curves, and ribosome pelleting assays. DNW, GB, and KT wrote the manuscript with comments from all authors.
Conflict of interest
The authors declare that they have no conflict of interest.
Note added in proof
The recent cryo‐EM structure of the Staphylococcus aureus 100S determined by Khusainov et al (2017) reveals that the mechanism of 70S dimerization mediated by the S. aureus long‐form HPF appears to be similar to that observed here for Bacillus subtilis.
Supporting information
Expanded View Figures PDF
Table EV1
Table EV2
Table EV3
Review Process File
Source Data for Figure 5
Acknowledgements
We thank Heidimarie Sieber, Charlotte Ungewickell, and Susanne Rieder for expert technical assistance; Uwe Linne (Marburg) for mass spectrometry support; and Beckmann‐Coulter GmbH (Krefeld, Germany) for kindly providing the DelsaMax CORE. This research was supported by grants from the Deutsche Forschungsgemeinschaft (SPP‐1879 to K.T., G.B., and D.N.W.).
The EMBO Journal (2017) 36: 2061–2072
See also: I Khusainov et al (July 2017) and RL Gonzalez Jr (July 2017)
Contributor Information
Gert Bange, Email: gert.bange@synmikro.uni-marburg.de.
Kürşad Turgay, Email: turgay@ifmb.uni-hannover.de.
Daniel N Wilson, Email: Daniel.Wilson@chemie.uni-hamburg.de.
References
- Adams PD, Afonine PV, Bunkoczi G, Chen VB, Davis IW, Echols N, Headd JJ, Hung LW, Kapral GJ, Grosse‐Kunstleve RW, McCoy AJ, Moriarty NW, Oeffner R, Read RJ, Richardson DC, Richardson JS, Terwilliger TC, Zwart PH (2010) PHENIX: a comprehensive python‐based system for macromolecular structure solution. Acta Crystallogr D Biol Crystallogr 66(Pt 2): 213–221 [DOI] [PMC free article] [PubMed] [Google Scholar]
- Agafonov DE, Spirin AS (2004) The ribosome‐associated inhibitor A reduces translation errors. Biochem Biophys Res Commun 320: 354–358 [DOI] [PubMed] [Google Scholar]
- Aiso T, Yoshida H, Wada A, Ohki R (2005) Modulation of mRNA stability participates in stationary‐phase‐specific expression of ribosome modulation factor. J Bacteriol 187: 1951–1958 [DOI] [PMC free article] [PubMed] [Google Scholar]
- Akanuma G, Kazo Y, Tagami K, Hiraoka H, Yano K, Suzuki S, Hanai R, Nanamiya H, Kato‐Yamada Y, Kawamura F (2016) Ribosome dimerization is essential for the efficient regrowth of Bacillus subtilis . Microbiology 162: 448–458 [DOI] [PubMed] [Google Scholar]
- Basu A, Yap MN (2016) Ribosome hibernation factor promotes Staphylococcal survival and differentially represses translation. Nucleic Acids Res 44: 4881–4893 [DOI] [PMC free article] [PubMed] [Google Scholar]
- Ben‐Yehuda S, Rudner DZ, Losick R (2003) RacA, a bacterial protein that anchors chromosomes to the cell poles. Science 299: 532–536 [DOI] [PubMed] [Google Scholar]
- Bieri P, Leibundgut M, Saurer M, Boehringer D, Ban N (2017) The complete structure of the chloroplast 70S ribosome in complex with translation factor pY. EMBO J 36: 475–486 [DOI] [PMC free article] [PubMed] [Google Scholar]
- Brandt F, Etchells SA, Ortiz JO, Elcock AH, Hartl FU, Baumeister W (2009) The native 3D organization of bacterial polysomes. Cell 136: 261–271 [DOI] [PubMed] [Google Scholar]
- Brown A, Long F, Nicholls RA, Toots J, Emsley P, Murshudov G (2015) Tools for macromolecular model building and refinement into electron cryo‐microscopy reconstructions. Acta Crystallogr D Biol Crystallogr 71(Pt 1): 136–153 [DOI] [PMC free article] [PubMed] [Google Scholar]
- Chen JZ, Grigorieff N (2007) SIGNATURE: a single‐particle selection system for molecular electron microscopy. J Struct Biol 157: 168–173 [DOI] [PubMed] [Google Scholar]
- Chen VB, Arendall WB III, Headd JJ, Keedy DA, Immormino RM, Kapral GJ, Murray LW, Richardson JS, Richardson DC (2010) MolProbity: all‐atom structure validation for macromolecular crystallography. Acta Crystallogr D Biol Crystallogr 66(Pt 1): 12–21 [DOI] [PMC free article] [PubMed] [Google Scholar]
- Drzewiecki K, Eymann C, Mittenhuber G, Hecker M (1998) The yvyD gene of Bacillus subtilis is under dual control of sigmaB and sigmaH. J Bacteriol 180: 6674–6680 [DOI] [PMC free article] [PubMed] [Google Scholar]
- El‐Sharoud WM, Niven GW (2007) The influence of ribosome modulation factor on the survival of stationary‐phase Escherichia coli during acid stress. Microbiology 153(Pt 1): 247–253 [DOI] [PubMed] [Google Scholar]
- Emsley P, Cowtan K (2004) Coot: model‐building tools for molecular graphics. Acta Crystallogr D Biol Crystallogr 60: 2126–2132 [DOI] [PubMed] [Google Scholar]
- Eymann C, Mittenhuber G, Hecker M (2001) The stringent response, sigmaH‐dependent gene expression and sporulation in Bacillus subtilis . Mol Gen Genet 264: 913–923 [DOI] [PubMed] [Google Scholar]
- Fukuchi JI, Kashiwagi K, Yamagishi M, Ishihama A, Igarashi K (1995) Decrease in cell viability due to the accumulation of spermidine in spermidine acetyltransferase‐deficient mutant of Escherichia coli . J Biol Chem 270: 18831–18835 [DOI] [PubMed] [Google Scholar]
- Garay‐Arroyo A, Colmenero‐Flores JM, Garciarrubio A, Covarrubias AA (2000) Highly hydrophilic proteins in prokaryotes and eukaryotes are common during conditions of water deficit. J Biol Chem 275: 5668–5674 [DOI] [PubMed] [Google Scholar]
- Graf M, Arenz S, Huter P, Donhofer A, Novacek J, Wilson DN (2016) Cryo‐EM structure of the spinach chloroplast ribosome reveals the location of plastid‐specific ribosomal proteins and extensions. Nucleic Acids Res 45: 2887–2896 [DOI] [PMC free article] [PubMed] [Google Scholar]
- Grigorieff N (2007) FREALIGN: high‐resolution refinement of single particle structures. J Struct Biol 157: 117–125 [DOI] [PubMed] [Google Scholar]
- Hauryliuk V, Atkinson GC, Murakami KS, Tenson T, Gerdes K (2015) Recent functional insights into the role of (p)ppGpp in bacterial physiology. Nat Rev Microbiol 13: 298–309 [DOI] [PMC free article] [PubMed] [Google Scholar]
- Hood RD, Higgins SA, Flamholz A, Nichols RJ, Savage DF (2016) The stringent response regulates adaptation to darkness in the cyanobacterium Synechococcus elongatus . Proc Natl Acad Sci USA 113: E4867–E4876 [DOI] [PMC free article] [PubMed] [Google Scholar]
- Izutsu K, Wada A, Wada C (2001) Expression of ribosome modulation factor (RMF) in Escherichia coli requires ppGpp. Genes Cells 6: 665–676 [DOI] [PubMed] [Google Scholar]
- Jenner L, Demeshkina N, Yusupova G, Yusupov M (2011) Structural rearrangements of the ribosome at the tRNA proofreading step. Nat Struct Mol Biol 17: 1072–1078 [DOI] [PubMed] [Google Scholar]
- Kato T, Yoshida H, Miyata T, Maki Y, Wada A, Namba K (2010) Structure of the 100S ribosome in the hibernation stage revealed by electron cryomicroscopy. Structure 18: 719–724 [DOI] [PubMed] [Google Scholar]
- Khusainov I, Vicens Q, Ayupov R, Usachev K, Myasnikov A, Simonetti A, Validov S, Kieffer B, Yusupova G, Yusupov M, Hashem Y (2017) Structures and dynamics of hibernating ribosomes from Staphylococcus aureus mediated by intermolecular interactions of HPF. EMBO J 36: 2073–2087 [DOI] [PMC free article] [PubMed] [Google Scholar]
- Kline BC, McKay SL, Tang WW, Portnoy DA (2015) The listeria monocytogenes hibernation‐promoting factor is required for the formation of 100S ribosomes, optimal fitness, and pathogenesis. J Bacteriol 197: 581–591 [DOI] [PMC free article] [PubMed] [Google Scholar]
- Kucukelbir A, Sigworth FJ, Tagare HD (2014) Quantifying the local resolution of cryo‐EM density maps. Nat Methods 11: 63–65 [DOI] [PMC free article] [PubMed] [Google Scholar]
- Li X, Mooney P, Zheng S, Booth CR, Braunfeld MB, Gubbens S, Agard DA, Cheng Y (2013) Electron counting and beam‐induced motion correction enable near‐atomic‐resolution single‐particle cryo‐EM. Nat Methods 10: 584–590 [DOI] [PMC free article] [PubMed] [Google Scholar]
- Maki Y, Yoshida H, Wada A (2000) Two proteins, YfiA and YhbH, associated with resting ribosomes in stationary phase Escherichia coli . Genes Cells 5: 965–974 [DOI] [PubMed] [Google Scholar]
- McKay SL, Portnoy DA (2015) Ribosome hibernation facilitates tolerance of stationary‐phase bacteria to aminoglycosides. Antimicrob Agents Chemother 59: 6992–6999 [DOI] [PMC free article] [PubMed] [Google Scholar]
- Niven GW (2004) Ribosome modulation factor protects Escherichia coli during heat stress, but this may not be dependent on ribosome dimerization. Arch Microbiol 182: 60–66 [DOI] [PubMed] [Google Scholar]
- Ortiz JO, Brandt F, Matias VR, Sennels L, Rappsilber J, Scheres SH, Eibauer M, Hartl FU, Baumeister W (2010) Structure of hibernating ribosomes studied by cryoelectron tomography in vitro and in situ . J Cell Biol 190: 613–621 [DOI] [PMC free article] [PubMed] [Google Scholar]
- Pei J, Kim BH, Grishin NV (2008) PROMALS3D: a tool for multiple protein sequence and structure alignments. Nucleic Acids Res 36: 2295–2300 [DOI] [PMC free article] [PubMed] [Google Scholar]
- Pettersen EF, Goddard TD, Huang CC, Couch GS, Greenblatt DM, Meng EC, Ferrin TE (2004) UCSF chimera – a visualization system for exploratory research and analysis. J Comput Chem 25: 1605–1612 [DOI] [PubMed] [Google Scholar]
- Polikanov YS, Blaha GM, Steitz TA (2012) How hibernation factors RMF, HPF, and YfiA turn off protein synthesis. Science 336: 915–918 [DOI] [PMC free article] [PubMed] [Google Scholar]
- Puri P, Eckhardt TH, Franken LE, Fusetti F, Stuart MC, Boekema EJ, Kuipers OP, Kok J, Poolman B (2014) Lactococcus lactis YfiA is necessary and sufficient for ribosome dimerization. Mol Microbiol 91: 394–407 [DOI] [PubMed] [Google Scholar]
- Reiss S, Pane‐Farre J, Fuchs S, Francois P, Liebeke M, Schrenzel J, Lindequist U, Lalk M, Wolz C, Hecker M, Engelmann S (2012) Global analysis of the Staphylococcus aureus response to mupirocin. Antimicrob Agents Chemother 56: 787–804 [DOI] [PMC free article] [PubMed] [Google Scholar]
- Rohou A, Grigorieff N (2015) CTFFIND4: fast and accurate defocus estimation from electron micrographs. J Struct Biol 192: 216–221 [DOI] [PMC free article] [PubMed] [Google Scholar]
- Schmalisch M, Langbein I, Stulke J (2002) The general stress protein Ctc of Bacillus subtilis is a ribosomal protein. J Mol Microbiol Biotechnol 4: 495–501 [PubMed] [Google Scholar]
- Sharma MR, Wilson DN, Datta PP, Barat C, Schluenzen F, Fucini P, Agrawal RK (2007) Cryo‐EM study of the spinach chloroplast ribosome reveals the structural and functional roles of plastid‐specific ribosomal proteins. Proc Natl Acad Sci USA 104: 19315–19320 [DOI] [PMC free article] [PubMed] [Google Scholar]
- Sharma MR, Donhofer A, Barat C, Marquez V, Datta PP, Fucini P, Wilson DN, Agrawal RK (2010) PSRP1 is not a ribosomal protein, but a ribosome‐binding factor that is recycled by the ribosome‐recycling factor (RRF) and elongation factor G (EF‐G). J Biol Chem 285: 4006–4014 [DOI] [PMC free article] [PubMed] [Google Scholar]
- Shcherbakova K, Nakayama H, Shimamoto N (2015) Role of 100S ribosomes in bacterial decay period. Genes Cells 20: 789–801 [DOI] [PubMed] [Google Scholar]
- Shimada T, Yoshida H, Ishihama A (2013) Involvement of cyclic AMP receptor protein in regulation of the rmf gene encoding the ribosome modulation factor in Escherichia coli . J Bacteriol 195: 2212–2219 [DOI] [PMC free article] [PubMed] [Google Scholar]
- Soding J, Biegert A, Lupas AN (2005) The HHpred interactive server for protein homology detection and structure prediction. Nucleic Acids Res 33(Web Server issue): W244–W248 [DOI] [PMC free article] [PubMed] [Google Scholar]
- Sohmen D, Chiba S, Shimokawa‐Chiba N, Innis CA, Berninghausen O, Beckmann R, Ito K, Wilson DN (2015) Structure of the Bacillus subtilis 70S ribosome reveals the basis for species‐specific stalling. Nat Commun 6: 6941 [DOI] [PMC free article] [PubMed] [Google Scholar]
- Steinchen W, Bange G (2016) The magic dance of the alarmones (p)ppGpp. Mol Microbiol 101: 531–544 [DOI] [PubMed] [Google Scholar]
- Tagami K, Nanamiya H, Kazo Y, Maehashi M, Suzuki S, Namba E, Hoshiya M, Hanai R, Tozawa Y, Morimoto T, Ogasawara N, Kageyama Y, Ara K, Ozaki K, Yoshida M, Kuroiwa H, Kuroiwa T, Ohashi Y, Kawamura F (2012) Expression of a small (p)ppGpp synthetase, YwaC, in the (p)ppGpp(0) mutant of Bacillus subtilis triggers YvyD‐dependent dimerization of ribosome. Microbiologyopen 1: 115–134 [DOI] [PMC free article] [PubMed] [Google Scholar]
- Tam le T, Antelmann H, Eymann C, Albrecht D, Bernhardt J, Hecker M (2006) Proteome signatures for stress and starvation in Bacillus subtilis as revealed by a 2‐D gel image color coding approach. Proteomics 6: 4565–4585 [DOI] [PubMed] [Google Scholar]
- Ueta M, Yoshida A, Wada C, Baba T, Mori H, Wada A (2005) Ribosome binding proteins YhbH and YfiA have opposite functions during 100S formation in the stationary phase of Escherichia coli . Genes Cells 10: 1103–1112 [DOI] [PubMed] [Google Scholar]
- Ueta M, Ohniwa RL, Yoshida H, Maki Y, Wada C, Wada A (2008) Role of HPF (hibernation promoting factor) in translational activity in Escherichia coli . J Biochem 143: 425–433 [DOI] [PubMed] [Google Scholar]
- Ueta M, Wada C, Wada A (2010) Formation of 100S ribosomes in Staphylococcus aureus by the hibernation promoting factor homolog SaHPF. Genes Cells 15: 43–58 [DOI] [PubMed] [Google Scholar]
- Ueta M, Wada C, Daifuku T, Sako Y, Bessho Y, Kitamura A, Ohniwa RL, Morikawa K, Yoshida H, Kato T, Miyata T, Namba K, Wada A (2013) Conservation of two distinct types of 100S ribosome in bacteria. Genes Cells 18: 554–574 [DOI] [PubMed] [Google Scholar]
- Vila‐Sanjurjo A, Schuwirth BS, Hau CW, Cate JHD (2004) Structural basis for the control of translational initiation during stress. Nature Struct Mol Biol 11: 1054–1059 [DOI] [PubMed] [Google Scholar]
- Wada A, Yamazaki Y, Fujita N, Ishihama A (1990) Structure and probable genetic location of a ribosome modulation factor associated with 100S ribosomes in stationary‐phase Escherichia coli cells. Proc Natl Acad Sci USA 87: 2657–2661 [DOI] [PMC free article] [PubMed] [Google Scholar]
- Wada A, Igarashi K, Yoshimura S, Aimoto S, Ishihama A (1995) Ribosome modulation factor: stationary growth phase‐specific inhibitor of ribosome functions from Escherichia coli . Biochem Biophys Res Commun 214: 410–417 [DOI] [PubMed] [Google Scholar]
- Wada A (1998) Growth phase coupled modulation of Escherichia coli ribosomes. Genes Cells 3: 203–208 [DOI] [PubMed] [Google Scholar]
- Wada A, Mikkola R, Kurland CG, Ishihama A (2000) Growth‐phase coupled changes of the ribosome profile in natural isolates and laboratory strains of Escherichia coli . J Bacteriol 182: 2893–2899 [DOI] [PMC free article] [PubMed] [Google Scholar]
- Yamagishi M, Matsushima H, Wada A, Sakagami M, Fujita N, Ishihama A (1993) Regulation of the Escherichia coli rmf gene encoding the ribosome modulation factor ‐ growth phase‐dependent and growth rate‐dependent control. EMBO J 12: 625–630 [DOI] [PMC free article] [PubMed] [Google Scholar]
- Yoshida H, Maki Y, Kato H, Fujisawa H, Izutsu K, Wada C, Wada A (2002) The ribosome modulation factor (RMF) binding site on the 100S ribosome of Escherichia coli . J Biochem 132: 983–989 [DOI] [PubMed] [Google Scholar]
- Yoshida H, Wada A (2014) The 100S ribosome: ribosomal hibernation induced by stress. Wiley Interdiscip Rev RNA 5: 723–732 [DOI] [PubMed] [Google Scholar]
Associated Data
This section collects any data citations, data availability statements, or supplementary materials included in this article.
Supplementary Materials
Expanded View Figures PDF
Table EV1
Table EV2
Table EV3
Review Process File
Source Data for Figure 5


