

Abstract
Background
Chronic delta hepatitis (HDV) infection rapidly progresses to cirrhosis. Treatment with peginterferon for up to 2 years is often without durable response.
Aim
We examined the efficacy and safety of long-term peginterferon in achieving a durable response.
Methods
Treatment was initiated with 180 μg/wk of peginterferon alfa-2a with titration to a maximal tolerable dose, for up to 5 years. Liver biopsies and hepatic venous pressure gradients (HVPG) were evaluated at baseline, 1, 3, and 5 years. The primary endpoint was histological improvement or loss of serum HDV and HBsAg at 3 years.
Results
13 patients were treated for a median of 140 weeks (6–260) with an average peginterferon dose of 180 μg/wk (90–270). At baseline, most had advanced disease (median Ishak fibrosis = 3) with portal hypertension (HVPG = 10.2 +/− 6 mm Hg). 5 of 13 patients (39%) achieved the primary endpoint, with 3 seroconverting for HBsAg after 24, 37 and 202 weeks of treatment. Histologic inflammation improved after one year, (median HAI: 10 vs. 7, p=0.01) with persistence in 4/5 patients at 3 years (median HAI: 7.5). Greatest improvements occurred in the first year. Baseline bilirubin and HBsAg levels were significantly lower in virologic responders than non-responders. After 12 weeks, virologic responders had a significant decline in HBsAg (1.5 log10 IU/mL, p=0.05).
Conclusion
Despite increased doses and duration of therapy, treatment of chronic HDV with peginterferon remains unsatisfactory. Quantitative measures of HBsAg may be an important biomarker of early response to peginterferon therapy in chronic HDV infection.
Introduction
The hepatitis D (delta hepatitis) virus (HDV) is the smallest pathogenic animal virus known to infect humans with an estimated 15–20 million chronically infected worldwide.1 The virus is an incomplete RNA virus, which is composed of a 1.7 kb single-stranded circular genomic RNA, virally encoded small and large delta antigens, and a surrounding lipid envelope of hepatitis B surface antigen (HBsAg).2,3 Propagation in humans only occurs in individuals infected with hepatitis B virus (HBV), either via superinfection or coinfection.4
HDV infection has been described to be endemic in various regions throughout the world.1,5 Compared to patients monoinfected with HBV, patients co-infected with HDV suffer more severe chronic hepatitis and progress more rapidly to cirrhosis.6–8 Additionally, those with HDV are at higher risk for hepatic decompensation leading to death and the development of hepatocellular carcinoma (HCC) compared to individuals with HBV alone.9–11 Thus, HDV shares epidemiological patterns and clinical features with hepatitis B, but tends to be more severe.
Currently, no satisfactory or FDA approved therapy exists for HDV infection. The American Association for the Study of Liver Diseases (AASLD) guidelines suggest the use of alpha interferon as therapy for chronic HDV infection.12 However, alpha interferon therapy is generally unsatisfactory and poorly tolerated; serum aminotransferase levels normalize in only 40–70% of treated patients and relapse occurs in 60–97% of patients. Long-term treatment with alpha interferon has been reported to be beneficial and preliminary evidence with 96 weeks of peginterferon based therapy appears safe.13,14 Instances of a complete response to therapy, defined as a loss of HDV RNA and HBsAg and development of anti-HBs, have been reported, although rarely. Thus, standard preparations of alpha interferon are an unsatisfactory therapy for chronic hepatitis D and are limited by poor tolerance and a relatively low long-term response rate.
In this study, we examined the utility of long-term high-dose pegylated alpha interferon in patients with chronic hepatitis D and evaluated its effect on hepatic histology, safety and tolerability.
Methods
Patients
Patients with chronic delta hepatitis with anti-HDV in serum and HDV antigen in liver tissue were eligible for this prospective, open-label, non-randomized study of peginterferon treatment for up to 260 weeks. Inclusion criteria included: age ≥ 18 years, serum alanine aminotransferase (ALT) or aspartate aminotransferase (AST) above the upper limit of normal (ALT >41 or AST >31 U/L) on an average of three determinations taken within 6 months before treatment, and a liver biopsy obtained within 12 months with a necroinflammatory score of at least 5 (out of 18) and at least 1 for hepatic fibrosis (out of 6) as scored using the Ishak modification of the HAI scoring system.15 All liver biopsies were interpreted by a single hepatopathologist (DEK) who was blinded to the clinical data. All patients had to have histologic staining for HDV antigen. Hepatic venous pressure gradient (HVPG) measurements were obtained at the time of liver biopsy via the transjugular route with rigorous adherence to methodology as previously described.16 Exclusion criteria included evidence of other forms of liver disease, hepatocellular carcinoma, decompensated liver disease, human immunodefiency virus (HIV) co-infection, active drug or alcohol abuse, any contraindication to peginterferon, and pregnancy or refusal to use adequate contraception during therapy.
All patients provided written, informed consent, and the study protocol and consent forms were approved by the institutional review board of the National Institute of Diabetes and Digestive and Kidney Diseases (NIDDK) at the National Institutes of Health Clinical Center. The study was registered in ClinicalTrials.Gov (#NCT00023322).
Pegylated interferon alfa-2a (Peginterferon) was provided by Hoffman La Roche (Genentech) under a Clinical Trial Agreement with the NIDDK. Genentech did not play any role in the study design, data collection and analysis, decision to publish, or preparation of the manuscript. Administration of peginterferon was conducted under an Investigational New Drug Application (IND # BB-10101) held by JHH.
Definition of Endpoints and Response
The primary histological endpoint of the study was defined as improvement in hepatic histology after 144 weeks of peginterferon therapy. Histological response was defined as a decrease of disease activity by ≥3 points using the modified histological activity index (HAI) scale without worsening of fibrosis (Ishak).15,17,18
A virological response (VR) to peginterferon therapy was defined as the inability to detect HDV RNA in serum by quantitative measurements. The primary virological endpoint of the study was a complete virological response (CVR) was defined as the combination of HDV virological response with HBsAg seroconversion. HBsAg seroconversion was defined as loss of HBsAg (negative on qualitative test or < 1 IU/mL on quantitative test) and appearance of anti-HBs using a qualitative test.
Secondary endpoints included (1) improvement in histology after 48 weeks of peginterferon therapy, (2) loss of HDV RNA from serum (undetectable = <100 genome equivalents (GE)/mL) at weeks 48, 144 and 260 (maintained virological response), (3) loss of HBsAg from serum at weeks 48, 144 and 260, (4) loss of detectable HDV antigen staining in the liver at weeks 48, 144, and 260, (5) normalization of serum ALT (<41 U/mL) at weeks 48, 144 and 260 (maintained biochemical response), (6) changes in hepatic venous pressure gradient (HVPG) measurements and their relationship to hepatic histology.
Study Design and Dosing of PegInterferon
Patients were admitted to the NIH Clinical Center to start treatment with peginterferon 180 μg/week and had blood samples drawn at 6, 12, 18, 24, 48, 72 hours after treatment initiation, followed by weekly outpatient visits for the first month and visits every 4–8 weeks thereafter. Serum samples were stored in −80C. Transjugular liver biopsies with measurement of HVPG were performed at weeks 0, 48, 144 and 260.
During treatment, the peginterferon dose could be increased or decreased based on effect and tolerance. Following the initial 24 weeks, the dose could be escalated up to 360 μg/week if an effect was not seen at a lower dose, or decreased as needed for toxicity and tolerance. Efficacy was assessed by ALT and changes were in increments or decrements of 45 or 90 ug/week every 16–24 weeks (Supplemental Figure 1). ALT was chosen to represent response since serum HDV-RNA results were not available in real-time. At the week 48 biopsy, patients without a ≥3 point improvement in the HAI inflammatory score (without worsening of fibrosis score) or a 1-point improvement in Ishak fibrosis score were considered nonresponders. Therapy was discontinued for: (1) intolerance to peginterferon, (2) lack of histologic response at one, three and five years (a maintained histological response), or (3) a complete virological response (defined as the loss of HDV RNA and HBsAg seroconversion). Those with complete virological response or virological response were followed after therapy in a protocolized manner for a year after stopping therapy.
In patients with concurrent active HBV infection (HBV DNA >10,000 copies/mL), nucleoside analogue therapy was instituted to suppress hepatitis B.
Virological Assays
Quantitative measurement of serum HDV-RNA level was performed by qPCR on stored samples with a lower limit of detection of 100 GE/mL (National Genetics Institute, Los Angeles, CA).
Qualitative HBsAg testing was performed with the FDA approved VITROS® HBsAg assay (Ortho-Clinical Diagnostics, New Jersey) per manufacturer’s recommendations with a signal/cutoff ration of 1.0. Quantitative HBsAg (qHBsAg) levels were measured on stored serum samples in a single batch, using the Elecsys HBsAg II Quant assay (Roche Diagnostics, Indianapolis, IN) with a lower limit of detection of 0.055 IU/mL.
Genetic Analysis
Genomic DNA was extracted from whole blood using the Qiagen Flexigene DNA Kit (Qiagen, Valencia CA) for 10 patients who provided consent for DNA analysis. Allelic discrimination for the IL28B-associated rs12989760 SNP, associated with interferon-responsiveness in hepatitis B and C,19–22 was performed utilizing the Taqman Custom SNP Genotyping Assay (Applied Biosystems, Foster City, CA) on an ABI 7500 Real-Time PCR System (Applied Biosystems)
Statistical Analysis
The slope of decline of HDV and HBsAg levels was calculated by linear regression using all available log-transformed datapoints from baseline to week 4. The week 12 decline was calculated by subtracting week 12 results from baseline. When week 12 results were not available, they were estimated using data from the previous and subsequent visits. Statistical analyses were performed using SPSS Statistics v. 19 (IBM). Statistical significance was assessed using nonparametric tests.
Results
Patient population
Between October 2002 and June 2006, 13 patients were recruited with characteristics summarized in Table 1. All patients had bridging fibrosis and only one patient had HBV DNA values above 10,000 IU/mL. One patient had an untypeable genotype and HDV RNA levels, and was thus excluded from the HBsAg and HDV RNA quantitative analyses. One patient dropped out after 7 weeks of therapy due to social reasons. Two patients died while enrolled in the study. One was diagnosed with hepatocellular carcinoma (HCC) at week 81 of treatment (at which time treatment was withdrawn) and later died from HCC complications. The patient was reported to have bridging fibrosis on his baseline biopsy but had thrombocytopenia and markedly abnormal HVPG suggesting actual cirrhosis. The other patient had confirmed cirrhosis and Crohn’s disease and was off peginterferon therapy for 6 months due to a bacterial foot infection, when he developed herpes colitis which precipitated hepatic decompensation and death.23
Table 1.
Baseline Patient Characteristics
| N | 13 |
|
| |
| Age (years)* | 42 (18–58) |
|
| |
| Male Gender | 11 (85%) |
|
| |
| Race (Caucasian/African-American) | 11/2 |
|
| |
| Estimated duration of disease (years)* | 25 (7–35) |
|
| |
| Infection Source1 | |
| IV Drug Abuse | 6 (46%) |
| Sexual | 2 (15%) |
| Transfusion | 2 (15%) |
| Endemic Region | 5 (39%) |
|
| |
| ALT (U/L)* | 141 (31–506) |
|
| |
| HDV-RNA (Log10 Genome Equivalent/mL)* | 6.7±1.2 |
|
| |
| HBsAg (Log10 IU/mL)* | 3.7±0.6 |
|
| |
| HBV-DNA < 100 IU/mL | 6 (46%) |
|
| |
| HBV-DNA (Log10 IU/mL)* 2 | 2.9 (2–4.9) |
|
| |
| Fibrosis (median, range) (Ishak score) | 3 (3–6) |
|
| |
| HVPG (mmHg)* | 11 (4–25) |
More than one suspected source possible
Limited to patients with HBV-DNA > 100 IU/ml
Mean (range)
Patients were treated for a median of 140 weeks (6–260) with an average weekly peginterferon dose of 180 μg/week (excluding treatment interruptions). The overall flow of patients is described in Figure 1. Dose reductions below 180 μg/week were required in 3 patients because of bone marrow suppression. Three patients were treated with a maximal dose of 225 μg/week and another three with doses up to 270 μg/week, and were able to tolerate the high dose for prolonged durations (up to 2 years). No patient was escalated to the highest permitted dose of 360 μg/week.
Figure 1.

Patient flow throughout the study. Of the 19 patients screened, 13 were enrolled into the study. This figure shows the follow-up and responses of the patients enrolled in the study at years 1, 3 and 5.
Treatment Responses
Biochemical Response
Six of 12 patients treated for > 6 months achieved normalization of ALT (<31 U/L), on at least one occasion while on therapy. In these six patients, the median time to ALT normalization was 18 weeks (range 4–188, Figure 2). However, only 3 patients maintained a long-term biochemical response.
Figure 2.
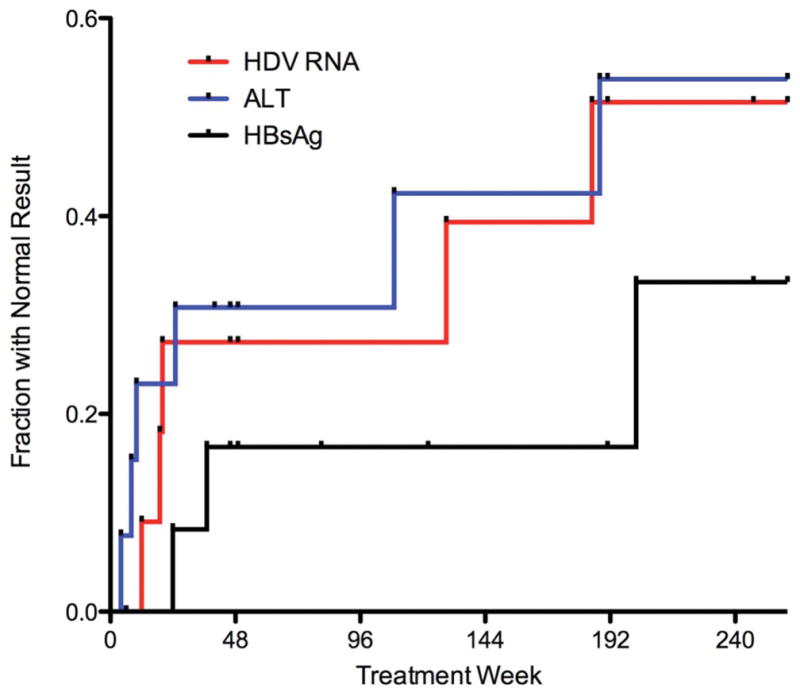
This figure shows the fraction of patients becoming HDV RNA negative (red), HBsAg negative (black) or have ALT < 31 U/L (blue) during course of treatment out to 240 weeks.
Histological Outcomes
After 1 year of therapy, histologic inflammation decreased significantly from baseline (median HAI: 10 [7–14] to 7 [5–10], p=0.01). The HAI score declined in 10 patients, and was unchanged or worsened in two (Figure 3a). After 3 years of therapy, liver biopsies were obtained in 5 patients and continued to be lower than baseline (median HAI: 7 [5–13]). At the end 5 years of therapy, liver biopsies were obtained in 4 patients and HAI scores continued to be lower than baseline (median HAI: 7.5 [4–8]). After 1, 3 and 5 years of therapy, histologic fibrosis did not change significantly (Figure 3b).
Figure 3.
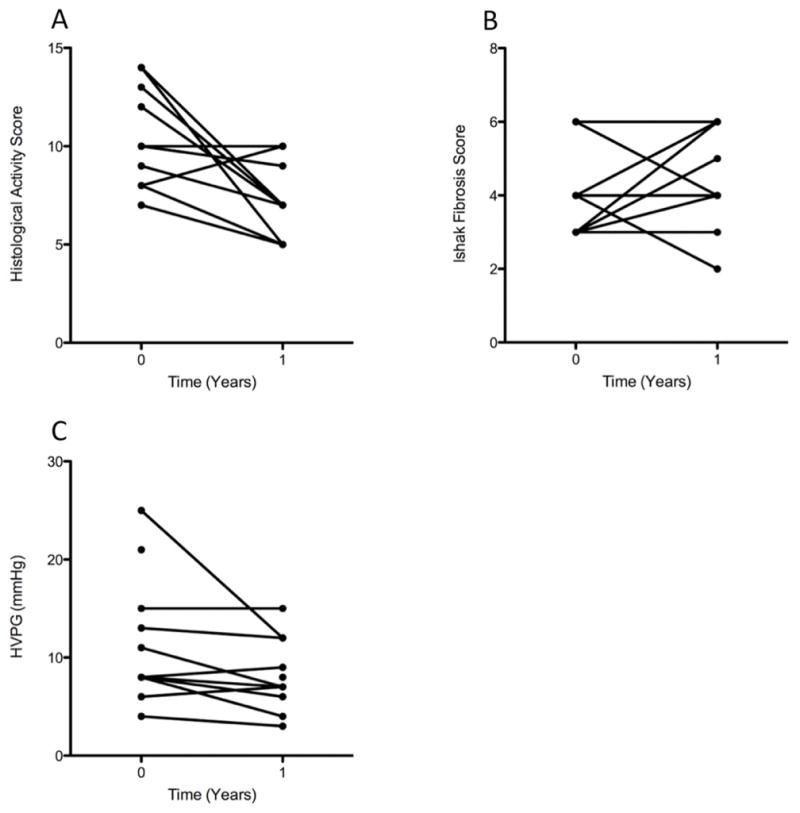
This figure shows the effect of 1 year of peginterferon treatment on histological activity (a), fibrosis (b) and HVPG (c). At 1 year, histologic inflammation significantly improved (p=0.01) but fibrosis did not, and HVPG trended towards significance (p=0.085).
Overall histological response was achieved by 6 (50%) of 12 patients at 1 year. All patients who developed histological response at year 1 continued to meet the criterion for response at years 3 and 5.
HVPG Measurements
Paired HVPG measurements were obtained in 11 patients at baseline and after the first year of therapy. After 1 year, the median HVPG decreased from 11.1±6.4 mmHg to 8.1±3.5 (p=0.085). Of these 11 patients, 7 (64%) had improved HVPG by 1–13 mmHg, three (27%) worsened by 1 mmHg and one patient had no change (figure 3c).
After 3 years of therapy, 5 patients had paired HVPG measurements, with a mean of 6.2±3.5 mmHg. When compared with their own HVPG at year 1, the 5 patients experienced a change of −1±2 mmHg. At year 5 of therapy, 4 patients had HVPG obtained and no additional improvement was seen.
Treatment Safety
Three patients required treatment interruption due to a serious adverse event, two of which were possibly related to peginterferon. One patient (mentioned previously) had a soft tissue infection of his foot requiring hospitalization and surgical debridement. Following treatment interruption his infection and resultant ulceration healed. This patient later succumbed to herpes colitis as previously described.23 Another patient developed an autoinflammatory syndrome after 192 weeks of treatment, characterized by fevers, headaches and intermittent confusion. A thorough workup was unable to identify the specific cause of the patient’s autoinflammatory syndrome. Treatment was stopped and his symptoms subsequently resolved. He was restarted on peginterferon at week 200 and did not have recurrence of symptoms and eventually achieved and maintained a VR. A third patient developed subarachnoid hemorrhage from an arteriovenous malformation at week 4 of treatment. Following successful therapy, peginterferon was resumed and she eventually achieved a CVR. Two patients required dose reduction due to cytopenias (1 anemia and 1 anemia/thrombocytopenia).
Kinetics of Response
Several distinct patterns of virological response are demonstrated in Figure 4.
Figure 4.

Examples of response patterns of individual patients. (a–c) complete responders, (d–e) response and breakthrough, (f–g) nonresponders.
Complete Virological responders
Of the 12 patients treated for at least 6 months, 3 patients achieved a CVR after 24, 37 and 202 weeks of treatment (Figure 4a–c) by demonstrating a continuous decline in HDV RNA until it was undetectable and HBsAg seroconversion. HBsAg loss and appearance of anti-HBs occurred simultaneously and only in patients with a VR. Two of these three patients also had a biochemical response. Therapy was discontinued 12–36 weeks after loss of HBsAg, and in all three patients, HBsAg and HDV RNA remained undetectable for the duration of follow-up (58–246 weeks after stopping therapy). For two subjects (Figure 4a–b), this occurred rapidly (decline slopes of 0.29 and 0.52 log10/week in the first 4 weeks), while a third subject (Figure 4c) had an initial comparable rapid decline of 0.24 log10/week during the first 4 weeks that slowed to an average overall slope of decline of 0.03 log10/week. HBsAg levels declined in all 3 patients, lagging behind the HDV RNA decline, and were <100 IU/mL at the time of HDV-RNA negativity and < 1 IU/mL subsequently. ALT decline did not correlate well with virological decline, and in one subject ALT levels did not improve despite HDV RNA and HBsAg loss (Figure 4b).
Virological Response and relapse
Two patients (Figure 4d–e) became HDV-RNA negative but subsequently had virological break-through while on treatment. One of the two (Figure 4d) had a relatively fast virological response (decline slope of 0.29 log10/week in the first 4 weeks) and became HDV-RNA negative by week 20 of treatment. However, HDV RNA levels subsequently rose and reached baseline levels despite continued peginterferon treatment. HBsAg levels also fell and were transiently undetectable, but later rose towards baseline. The other subject (Figure 4e) had a rapid decline in HDV RNA levels (0.21 log10/week in the first 4 weeks), which reached the lower limit of detection (100 GE/ml) by week 45. However, HDV RNA levels then rose despite continued treatment only to decline again to undetectable levels by week 129 of treatment, accompanied by marked decline in HBsAg titer. Shortly thereafter, the patient developed an autoimmune inflammatory syndrome that required a discontinuation of treatment on week 177. This treatment withdrawal resulted in a rise, initially in HBsAg, followed by HDV RNA and finally by ALT (35 weeks after stopping treatment); there was a rapid and synchronous response of all three markers to reinstitution of peginterferon on week 202, followed by achievement and maintenance of a virological response (supplemental figure 2). Thus, this patient exhibited a flare of disease (rise in ALT to >5 times baseline) concurrent with the virologic break-through early on treatment which was followed by loss of HDV RNA (possibly a “clearance flare”) and another flare when therapy was temporarily suspended (“withdrawal flare”).
Non-response
Other subjects (Figure 4f–g) never became HDV-RNA negative despite an initial response (4 week slope of 0.21 and 0.27 log10/week, respectively), and demonstrate plateau or rebounding of HDV levels while on prolonged therapy. Although ALT levels improved compared to baseline, they did not fall into the normal range and neither liver histology scores nor HVPG measurements improved at subsequent evaluation.
After the initial declines in HDV RNA levels during the first 24 weeks of treatment, decreases or increases in the dose of peginterferon were not clearly associated with changes in HDV RNA levels.
Predictors of response
Baseline and on-treatment features were evaluated for their ability to predict virological response to treatment in the 11 subjects who had HDV RNA measurements for at least 8 weeks (Table 2). The 3 complete responders demonstrated a trend towards lower alkaline phosphatase, bilirubin and histological fibrosis scores at baseline and numerically lower HVPG and platelet count, consistent with milder disease, though statistical significance could not be reached due to the small number. Age, ALT, HBV and HDV viral levels, HBsAg titer and histological activity did not predict complete response. When comparing patients who had any virological response on treatment to those who did not (Table 2), responders had lower bilirubin levels and HBsAg levels and a trend towards lower ALT. The IL28B-associated rs12989760 genotype frequency was similar for responders and non-responders.
Table 2.
Comparison of baseline predictors of response with patients that achieved a complete virological response or a virological response.
| Complete Virological Response^ | Virological Response° | |||||
|---|---|---|---|---|---|---|
| Yes | No | p-value | Yes | No | p-value | |
| N | 3 | 8 | 5 | 6 | ||
| Age (years)* | 49±4 | 41±14 | 0.311 | 45±15 | 42±12 | 0.271 |
| ALT (U/L)* | 98±93 | 181±155 | 0.311 | 84±70 | 221±161 | 0.071 |
| Alkaline Phosphatase (U/L)* | 62±10 | 123±60 | 0.0661 | 78±29 | 129±68 | 0.21 |
| Bilirubin (mg/dL)* | 0.6±0.2 | 1±0.4 | 0.0641 | 0.6±0.2 | 1.1±0.3 | 0.0061 |
| HBV-DNA >1000 IU/mL (%) | 1 (33%) | 1 (13%) | 0.492 | 1 (20%) | 1 (17%) | 1.02 |
| HBsAg (log10 IU/mL)* | 3.4±0.6 | 3.8±0.6 | 0.311 | 3.2±0.6 | 4.0±0.3 | 0.051 |
| HDV RNA (log10 GE/mL)* | 6.2±1.2 | 6.9±1.2 | 0.411 | 6.1±1.3 | 7.3±0.9 | 0.201 |
| HAI Inflammation (median) | 12 (7–14) | 10 (7–14) | 0.921 | 12 (7–14) | 10 (7–14) | 0.781 |
| Fibrosis (median, range) | 3 (3–3) | 4 (3–6) | 0.091 | 3 (3–4) | 4 (3–6) | 0.111 |
| Platelets (1000/uL)* | 153±71 | 138±54 | 0.841 | 142±56 | 143±60 | 1.01 |
| HVPG (mmHg)* | 8±0 | 11±7 | 0.791 | 12±89 | 9±4 | 0.521 |
| rs12979860 genotype (n=10) | 1.02 | 1.02 | ||||
| CC | 1 (50%) | 4 (50%) | 2 (50%) | 3 (50%) | ||
| CT | 1 (50%) | 4 (50% | 2 (50%) | 3 (50%) | ||
Mann-Whitney test
Fisher’s exact test
Mean (range)
Complete Virological Response = Undetectable HDV RNA in serum and seroconversion of HBsAg
Virological Response = Undetectable HDV RNA in serum
When assessing early kinetics of response as predictors of overall virological outcomes (Table 3), the slopes of decline of HDV RNA and HBsAg during the first 4 weeks were similar for responders and non-responders. In fact, all patients had an initial virological response with a 4 week decline in HDV RNA > 0.5 log10 (mean 0.97±0.35 log10), irrespective of their final outcome. By week 12 of treatment, the magnitude of decline of HBsAg was greater for patients who responded to treatment and became HDV-RNA negative. However, there was still an overlap between responders and non-responders and even more so, between complete responders and subject with virological break-through (Figure 5). Detailed modeling of the kinetics of response is reported separately.24
Table 3.
On-treatment predictors of response
| Complete Virological Response^ | Virological Response° | |||||
|---|---|---|---|---|---|---|
| Yes | No | p-value1 | Yes | No | p-value1 | |
| HDV RNA 4 week slope (GE log10/mL/week)* | −0.35±0.15 | −0.24±0.08 | 0.43 | −0.35±0.15 | −0.24±0.09 | 0.75 |
| HDV RNA week 12 decline (GE log10 /mL)* | 3.6±3.3 | 1.3±1.6 | 0.31 | 3.0±2.5 | 0.8±1.8 | 0.20 |
| HBsAg 4 week slope (IU log10/mL/week)* | −0.04±0.08 | 0.03±0.04 | 0.12 | −0.02±0.06 | 0.03±0.05 | 0.22 |
| HBsAg week 12 decline (IU log10/mL)* | 1.7±1.8 | 0.06±0.5 | 0.07 | 1.5±1.3 | −0.1±0.2 | 0.05 |
Mann-Whitney test
Mean ±SD
Complete Virological Response = Undetectable HDV RNA in serum and seroconversion of HBsAg
Virological Response = Undetectable HDV RNA in serum
Figure 5.
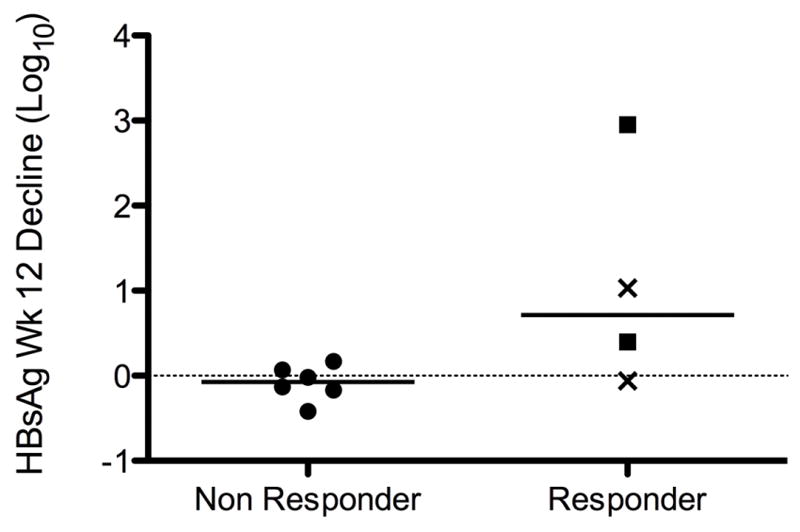
Logarithmic decline in HBsAg level from baseline to week 12 according to virological response to treatment. Squares represent complete responders, while X represents patients who became HDV-RNA negative but broke through while on treatment. Compared to nonresponders, patients with response had a significantly different decline in HBsAg (p=0.05).
Discussion
In our study, 4 of 12 patients (30%) with chronic HDV achieved and maintained a VR during long-term (5 year) peginterferon therapy. Of these 4 patients, 3 achieved a CVR. The maintained VR rate achieved in our study corresponds to other studies that have evaluated peginterferon therapy for HDV with rates ranging from 17%–43% after 24 weeks of therapy, 21%–48% with therapy ranging from 48–96 weeks.25–32 Similar to a recent publication, there has been no evidence of relapse our patients who achieved a CVR, some of which have been followed up to 246 weeks after stopping therapy.33 Interestingly, 2 of the 4 patients achieved a CVR prior to the completing 1-year of therapy (weeks 24 and 37) and the other one at week 202. Given the overall timeframe that the CVRs occurred, along with the poor CVR rates for the entire group after 5 years of therapy, this possibly suggests that extending peginterferon therapy for HDV beyond 1 year does not necessarily improve response, although there may be individual patients that may benefit. Additionally, treatment of chronic HDV with peginterferon for 5 years does not seem to improve the chances of HDV clearance.
On histologic evaluation, the greatest improvement in hepatic inflammation was seen after 1 year of peginterferon therapy. Although this improvement was maintained on years 3 and 5 of the study, as compared to baseline, statistical significance was not achieved. These results could be due to the low numbers of patients who underwent liver biopsies at years 3 and 5 (5 and 4 patients, respectively). Alternatively, these results could signify that the effects of peginterferon on HDV may peak prior to 1 year of therapy without further improvement on histologic inflammation. In a case report describing 12 years of interferon therapy in a patient with HDV, Lau et al described a greater decrease in histologic hepatic inflammation during the first 4 months of therapy as compared to three years of therapy.13
One of the strengths of this study was the availability of HVPG measurements at years 1, 3 and 5 to provide additional information on the effects of long-term peginterferon therapy for chronic HDV. In general, HVPG showed a trend towards improvement after 1 year of peginterferon therapy. 64% of patients had improvement in HVPG, while 3 had worsening of HVPG by 1 mm Hg. Other studies have reported minor variations in repeated portal pressure measurements which may be due to the heterogeneity of sinusoidal involvement for a given disease process and also reflecting that cirrhosis is not a homogenous disease.16,34–36 A more recent study comparing the use of balloon catheters and straight catheters for HVPG showed that on repeated sequential repeated measurements a difference of ± 1 mm Hg is within one standard deviation of the mean, and thus not a significant difference.37 Therefore, we feel that the lack of statistical significance may be due to the low numbers of patients evaluated. Further studies utilizing HVPG as a measurement of response with larger numbers may elaborate on HVPGs usefulness, particularly as this has been shown in chronic hepatitis B infection.38
In this study, we also evaluated quantitative HBsAg levels in HDV patients while on therapy. In patients with chronic HBV mono-infection, lower HBsAg levels have been associated with a higher rate of HBsAg clearance.39,40 In a retrospective HDV study and a case report evaluating HBsAg levels while on interferon, investigators noted a slower decline in HBsAg levels as compared to HDV RNA levels in individuals who became HDV RNA undetectable.41,42 In our study, we corroborate prior descriptions that HBsAg levels decline while on peginterferon therapy and demonstrate similar trends of decline for HBsAg and HDV RNA levels. We show a difference between responders and non-responders in early HBsAg decline, but this could driven by two early responders (Figures 4a–b) in our study. However, qualitative assessment of response patterns demonstrates that when HDV RNA becomes negative, it is accompanied by a precipitous drop in HBsAg levels, even in late response (Figures 4c, e). A sustained response was only achieved if HBsAg became undetectable (by qualitative assay). Furthermore, a well-defined case of withdrawal flare (Figure 4e, Supplemental Figure 2) clearly showed a rise in HBsAg preceding the rise in HDV RNA titers. Given the small numbers in this study, these findings should be confirmed in a larger sample of patients.
For a prolonged-therapy approach to be feasible, one would need to show a time-dependent benefit for treatment prolongation, its safety and suggest early stopping rules. Although our data did not show a clear benefit of extending treatment, it should be noted that one of the subjects (Fig. 4c) did achieve a complete virological response after nearly 4 years of treatment, suggesting some patients require prolonged treatment to respond. Despite that, we were not able to show a clear benefit from prolonging treatment, and could not identify early stopping rules; at least using fixed parameters that would be readily available to clinicians (such as week 4 and 12 declines), though mathematical modeling may suggest other stopping rules24 these reflect the obvious main limitation of the study, the small number of subjects enrolled and the small number of individuals reaching the 3 and 5-year time points for liver biopsy and HVPG evaluation. To clearly answer these questions, a larger study would be needed. Another limitation of our study was the unavailability of HDV RNA results in real-time, and stemming from that, the inability to tailor doses and treatment duration to responses. However, this may actually be viewed as a relative strength, as it permitted us to observe the various patterns of response, and especially the requirement of HBsAg loss for response durability. An advantage of the study was the measurement of HDV RNA by a single assay in a batched manner allowing comparison between values. However note should be made of the heterogeneity of HDV assays available and the difficulty in comparing HDV values between assays and thus between studies.
In general, patients tolerated therapy well with varying doses of peginterferon at doses up to 270 μg/wk. Although dose adjustment for cytopenias was needed in three patients. Only two subjects experienced a serious interferon-related adverse event (one with foot infection and another who developed an autoimmune inflammatory syndrome) that required temporary cessation of therapy. Thus, peginterferon therapy extending to 5 years appears to be safe and tolerable in most patients with chronic HDV infection.
In summary, treatment of chronic HDV with peginterferon remains unsatisfactory despite increasing of the duration of treatment out to five years and/or increasing peginterferon dosage up to 270 mg/wk. Additionally, the long-term impact of prolonged peginterferon exposure in patients with HDV has not been adequately evaluated. It may be the quantitative measures of HBsAg and HDV RNA will prove to be biomarkers of early response, however this needs to be validated with additional studies. With ongoing clinical trials evaluating prenylation inhibitors against HDV, the field is eagerly awaiting new therapeutic modalities against the most feared and rapidly progressive chronic viral hepatitis currently known.
Supplementary Material
Supplementary Figure 1 – This figure describes the peginterferon dose modification schedule while patient’s were on therapy.
Supplementary Figure 2 - Response pattern of patient described in figure 4e during the period of peginterferon withdrawal which describes a withdrawal flare with a rise in HBsAg preceding the rise in HDV RNA titers.
Acknowledgments
Funding: This research was funded by the Intramural Research Programs of the National Institute of Diabetes and Digestive and Kidney Diseases (NIDDK) and the National Cancer Institute (NCI) of the National Institutes of Health (NIH). Peginterferon alfa-2a was provided by Hoffman La Roche (Genentech) under a Clinical Trial Agreement with the NIDDK.
We thank Drs. Richard Batrla-Utermann and Michael Leuther (Roche Diagnostics) and Dr. Barbara Body (LabCorp) for qHBsAg testing; and Ms. Ronda Sapp and the staff of the NIDDK Clinical Services Core. We also thank Dr. Nigel Puck for his support.
Abbreviations
- HDV
delta hepatitis
- HVPG
hepatic venous pressure gradient
- HBsAg
hepatitis B surface antigen
- HBV
hepatitis B virus
- HCC
hepatocellular carcinoma
- AASLD
American association for the study of liver diseases
- ALT
alanine aminotransferase
- AST
aspartate aminotransferase
- HIV
human immunodeficiency
- NIDDK
National Institute of Diabetes and Digestive and Kidney Diseases
- Peginterferon
pegylated interferon alfa-2a
- HAI
histologic activity index
- VR
virologic response
- CVR
complete virologic response
- GE
genome equivalents
Footnotes
All authors approved the final version of this manuscript.
Financial Disclosures: None of the authors has any conflict of interest related to this research.
Authors’ Contributions: Study concept & design: TH, YR, CK, JHH; Acquisition of data: TH, YR, CK, VH, RM, MGG, TJL, JHH; Analysis/interpretation: TH, YR, CK, SC, VH, RM, PS, JA, DEK, MGG, TJL, JHH; Drafting: TH, YR, CK; Critical revision: SC, VH, RM, PS, JA, DEK, MGG, TJL, JHH; Statistical analysis: TH, YR, CK; Technical support: None; Supervision: JHH, TJL.
References
- 1.Hughes SA, Wedemeyer H, Harrison PM. Hepatitis delta virus. Lancet. 2011;378:73–85. doi: 10.1016/S0140-6736(10)61931-9. [DOI] [PubMed] [Google Scholar]
- 2.Gudima S, Chang J, Moraleda G, Azvolinsky A, Taylor J. Parameters of human hepatitis delta virus genome replication: the quantity, quality, and intracellular distribution of viral proteins and RNA. Journal of virology. 2002;76:3709–19. doi: 10.1128/JVI.76.8.3709-3719.2002. [DOI] [PMC free article] [PubMed] [Google Scholar]
- 3.Glenn JS, Marsters JC, Jr, Greenberg HB. Use of a prenylation inhibitor as a novel antiviral agent. Journal of virology. 1998;72:9303–6. doi: 10.1128/jvi.72.11.9303-9306.1998. [DOI] [PMC free article] [PubMed] [Google Scholar]
- 4.Rizzetto M. Hepatitis D: thirty years after. Journal of hepatology. 2009;50:1043–50. doi: 10.1016/j.jhep.2009.01.004. [DOI] [PubMed] [Google Scholar]
- 5.Rizzetto M, Ponzetto A, Forzani I. Hepatitis delta virus as a global health problem. Vaccine. 1990;8(Suppl):S10–4. doi: 10.1016/0264-410x(90)90207-3. discussion S21–3. [DOI] [PubMed] [Google Scholar]
- 6.Govindarajan S, Kanel GC, Peters RL. Prevalence of delta-antibody among chronic hepatitis B virus infected patients in the Los Angeles area: its correlation with liver biopsy diagnosis. Gastroenterology. 1983;85:160–2. [PubMed] [Google Scholar]
- 7.Colombo M, Cambieri R, Rumi MG, Ronchi G, Del Ninno E, De Franchis R. Long-term delta superinfection in hepatitis B surface antigen carriers and its relationship to the course of chronic hepatitis. Gastroenterology. 1983;85:235–9. [PubMed] [Google Scholar]
- 8.Manesis EK, Vourli G, Dalekos G, et al. Prevalence and clinical course of hepatitis delta infection in Greece: a 13-year prospective study. Journal of hepatology. 2013;59:949–56. doi: 10.1016/j.jhep.2013.07.005. [DOI] [PubMed] [Google Scholar]
- 9.Fattovich G, Giustina G, Christensen E, et al. Influence of hepatitis delta virus infection on morbidity and mortality in compensated cirrhosis type B. The European Concerted Action on Viral Hepatitis (Eurohep) Gut. 2000;46:420–6. doi: 10.1136/gut.46.3.420. [DOI] [PMC free article] [PubMed] [Google Scholar]
- 10.Ji J, Sundquist K, Sundquist J. A population-based study of hepatitis D virus as potential risk factor for hepatocellular carcinoma. J Natl Cancer Inst. 2012;104:790–2. doi: 10.1093/jnci/djs168. [DOI] [PubMed] [Google Scholar]
- 11.Romeo R, Del Ninno E, Rumi M, et al. A 28-year study of the course of hepatitis Delta infection: a risk factor for cirrhosis and hepatocellular carcinoma. Gastroenterology. 2009;136:1629–38. doi: 10.1053/j.gastro.2009.01.052. [DOI] [PubMed] [Google Scholar]
- 12.Lok AS, McMahon BJ. Chronic hepatitis B: update 2009. Hepatology (Baltimore, Md. 2009;50:661–2. doi: 10.1002/hep.23190. [DOI] [PubMed] [Google Scholar]
- 13.Lau DT, Kleiner DE, Park Y, Di Bisceglie AM, Hoofnagle JH. Resolution of chronic delta hepatitis after 12 years of interferon alfa therapy. Gastroenterology. 1999;117:1229–33. doi: 10.1016/s0016-5085(99)70409-9. [DOI] [PubMed] [Google Scholar]
- 14.Wedemeyer H, Yurdaydin C, Ernst S, et al. 96 weeks of pegylated-interferon-alpha-2a plus tenofovir or placebo for the treatment of hepatitis delta: the HIDIT-2 study. Hepatology (Baltimore, Md. 2013;58:222A–3A. [Google Scholar]
- 15.Ishak K, Baptista A, Bianchi L, et al. Histological grading and staging of chronic hepatitis. Journal of hepatology. 1995;22:696–9. doi: 10.1016/0168-8278(95)80226-6. [DOI] [PubMed] [Google Scholar]
- 16.Groszmann RJ, Wongcharatrawee S. The hepatic venous pressure gradient: anything worth doing should be done right. Hepatology (Baltimore, Md. 2004;39:280–2. doi: 10.1002/hep.20062. [DOI] [PubMed] [Google Scholar]
- 17.Desmet VJ, Gerber M, Hoofnagle JH, Manns M, Scheuer PJ. Classification of chronic hepatitis: diagnosis, grading and staging. Hepatology (Baltimore, Md. 1994;19:1513–20. [PubMed] [Google Scholar]
- 18.Shakil AO, Conry-Cantilena C, Alter HJ, et al. Volunteer blood donors with antibody to hepatitis C virus: clinical, biochemical, virologic, and histologic features. The Hepatitis C Study Group. Annals of internal medicine. 1995;123:330–7. doi: 10.7326/0003-4819-123-5-199509010-00002. [DOI] [PubMed] [Google Scholar]
- 19.Suppiah V, Moldovan M, Ahlenstiel G, et al. IL28B is associated with response to chronic hepatitis C interferon-alpha and ribavirin therapy. Nat Genet. 2009;41:1100–4. doi: 10.1038/ng.447. [DOI] [PubMed] [Google Scholar]
- 20.Ge D, Fellay J, Thompson AJ, et al. Genetic variation in IL28B predicts hepatitis C treatment-induced viral clearance. Nature. 2009;461:399–401. doi: 10.1038/nature08309. [DOI] [PubMed] [Google Scholar]
- 21.Sonneveld MJ, Wong VW, Woltman AM, et al. Polymorphisms near IL28B and serologic response to peginterferon in HBeAg-positive patients with chronic hepatitis B. Gastroenterology. 2012;142:513–20. e1. doi: 10.1053/j.gastro.2011.11.025. [DOI] [PubMed] [Google Scholar]
- 22.Lampertico P, Vigano M, Cheroni C, et al. IL28B polymorphisms predict interferon-related hepatitis B surface antigen seroclearance in genotype D hepatitis B e antigen-negative patients with chronic hepatitis B. Hepatology (Baltimore, Md. 2013;57:890–6. doi: 10.1002/hep.25749. [DOI] [PubMed] [Google Scholar]
- 23.Smith JO, Sterling RK, Mills AS, et al. Herpes simplex virus colitis in a patient with Crohn’s disease and hepatitis B and d cirrhosis. Gastroenterology & hepatology. 2010;6:120–2. [PMC free article] [PubMed] [Google Scholar]
- 24.Guedj J, Rotman Y, Cotler SJ, et al. Understanding early serum hepatitis D virus and HBsAg kinetics during pegylated interferon-alpha therapy via mathematical modeling. 2013 doi: 10.1002/hep.27357. Submitted. [DOI] [PMC free article] [PubMed] [Google Scholar]
- 25.Castelnau C, Le Gal F, Ripault MP, et al. Efficacy of peginterferon alpha-2b in chronic hepatitis delta: relevance of quantitative RT-PCR for follow-up. Hepatology (Baltimore, Md. 2006;44:728–35. doi: 10.1002/hep.21325. [DOI] [PubMed] [Google Scholar]
- 26.Erhardt A, Gerlich W, Starke C, et al. Treatment of chronic hepatitis delta with pegylated interferon-alpha2b. Liver Int. 2006;26:805–10. doi: 10.1111/j.1478-3231.2006.01279.x. [DOI] [PubMed] [Google Scholar]
- 27.Samiullah S, Bikharam D, Nasreen Treatment of chronic hepatitis delta virus with peg-interferon and factors that predict sustained viral response. World J Gastroenterol. 2012;18:5793–8. doi: 10.3748/wjg.v18.i40.5793. [DOI] [PMC free article] [PubMed] [Google Scholar]
- 28.Gulsun S, Tekin R, Bozkurt F. Treatment of chronic delta hepatitis: a nine-year retrospective analysis. Hepatitis monthly. 2011;11:731–5. doi: 10.5812/kowsar.1735143X.728. [DOI] [PMC free article] [PubMed] [Google Scholar]
- 29.Niro GA, Ciancio A, Gaeta GB, et al. Pegylated interferon alpha-2b as monotherapy or in combination with ribavirin in chronic hepatitis delta. Hepatology (Baltimore, Md. 2006;44:713–20. doi: 10.1002/hep.21296. [DOI] [PubMed] [Google Scholar]
- 30.Karaca C, Soyer OM, Baran B, et al. Efficacy of pegylated interferon-alpha treatment for 24 months in chronic delta hepatitis and predictors of response. Antivir Ther. 2012 doi: 10.3851/IMP2381. [DOI] [PubMed] [Google Scholar]
- 31.Wedemeyer H, Yurdaydin C, Dalekos GN, et al. Peginterferon plus adefovir versus either drug alone for hepatitis delta. The New England journal of medicine. 2011;364:322–31. doi: 10.1056/NEJMoa0912696. [DOI] [PubMed] [Google Scholar]
- 32.Kabacam G, Dalekos GN, Cakaloglu Y, et al. Pegylated interferon-based treatment in patients with advanced liver disease due to chronic delta hepatitis. The Turkish journal of gastroenterology : the official journal of Turkish Society of Gastroenterology. 2012;23:560–8. doi: 10.4318/tjg.2012.0538. [DOI] [PubMed] [Google Scholar]
- 33.Heidrich B, Yurdaydin C, Kabacam G, et al. Late HDV RNA relapse after peginterferon alfa-based therapy of chronic hepatitis delta. Hepatology (Baltimore, Md. 2014 doi: 10.1002/hep.27102. [DOI] [PubMed] [Google Scholar]
- 34.Keiding S, Vilstrup H. Intrahepatic heterogeneity of hepatic venous pressure gradient in human cirrhosis again. Scand J Gastroenterol. 2002;37:1344. doi: 10.1080/003655202761020669. [DOI] [PubMed] [Google Scholar]
- 35.Maharaj B, Maharaj RJ, Leary WP, et al. Sampling variability and its influence on the diagnostic yield of percutaneous needle biopsy of the liver. Lancet. 1986;1:523–5. doi: 10.1016/s0140-6736(86)90883-4. [DOI] [PubMed] [Google Scholar]
- 36.van Leeuwen DJ, Sherlock S, Scheuer PJ, Dick R. Wedged hepatic venous pressure recording and venography for the assessment of pre-cirrhotic and cirrhotic liver disease. Scand J Gastroenterol. 1989;24:65–73. doi: 10.3109/00365528909092241. [DOI] [PubMed] [Google Scholar]
- 37.Zipprich A, Winkler M, Seufferlein T, Dollinger MM. Comparison of balloon vs. straight catheter for the measurement of portal hypertension. Alimentary pharmacology & therapeutics. 2010;32:1351–6. doi: 10.1111/j.1365-2036.2010.04484.x. [DOI] [PubMed] [Google Scholar]
- 38.Manolakopoulos S, Triantos C, Theodoropoulos J, et al. Antiviral therapy reduces portal pressure in patients with cirrhosis due to HBeAg-negative chronic hepatitis B and significant portal hypertension. Journal of hepatology. 2009;51:468–74. doi: 10.1016/j.jhep.2009.05.031. [DOI] [PubMed] [Google Scholar]
- 39.Brunetto MR, Moriconi F, Bonino F, et al. Hepatitis B virus surface antigen levels: a guide to sustained response to peginterferon alfa-2a in HBeAg-negative chronic hepatitis B. Hepatology (Baltimore, Md. 2009;49:1141–50. doi: 10.1002/hep.22760. [DOI] [PubMed] [Google Scholar]
- 40.Yu ML, Lee CM, Chuang WL, et al. HBsAg profiles in patients receiving peginterferon alfa-2a plus ribavirin for the treatment of dual chronic infection with hepatitis B and C viruses. The Journal of infectious diseases. 2010;202:86–92. doi: 10.1086/653209. [DOI] [PubMed] [Google Scholar]
- 41.Zachou K, Yurdaydin C, Drebber U, et al. Quantitative HBsAg and HDV-RNA levels in chronic delta hepatitis. Liver Int. 2010;30:430–7. doi: 10.1111/j.1478-3231.2009.02140.x. [DOI] [PubMed] [Google Scholar]
- 42.Brichler S, Setshedi M, Renou C. Treatment of hepatitis delta chronic infection: HBs antigen quantification may help monitoring, and HBs antigen seroconversion could be the ideal ‘end’ point of treatment. Journal of clinical virology : the official publication of the Pan American Society for Clinical Virology. 2012;55:83–4. doi: 10.1016/j.jcv.2012.05.015. [DOI] [PubMed] [Google Scholar]
Associated Data
This section collects any data citations, data availability statements, or supplementary materials included in this article.
Supplementary Materials
Supplementary Figure 1 – This figure describes the peginterferon dose modification schedule while patient’s were on therapy.
Supplementary Figure 2 - Response pattern of patient described in figure 4e during the period of peginterferon withdrawal which describes a withdrawal flare with a rise in HBsAg preceding the rise in HDV RNA titers.