

SUMMARY
Excitation-inhibition imbalance in neural networks is widely linked to neurological and neuropsychiatric disorders. However, how genetic factors alter neuronal activity, leading to excitation-inhibition imbalance remain unclear. Here, using the C. elegans locomotor circuit, we examine how altering neuronal activity for varying times affects synaptic release and animal behavior. We show that while short-duration activation of excitatory cholinergic neurons elicits a reversible enhancement of presynaptic strength, persistent activation results to asynchronous and reduced cholinergic drive, inducing imbalance between endogenous excitation and inhibition. We find that the neuronal calcium sensor protein NCS-2 is required for asynchronous cholinergic release in an activity-dependent manner, and dampens excitability of inhibitory neurons non-cell-autonomously. The function of NCS-2 requires its Ca2+ binding and membrane association domains. These results reveal a synaptic mechanism implicating asynchronous release in regulation of excitation-inhibition balance.
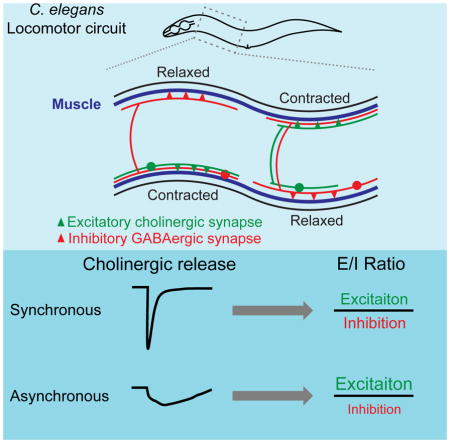
Graphical Abstract
INTRODUCTION
In the mature nervous system, changes in synaptic strength are coordinated within existing neural networks including excitatory and inhibitory neurons. Across animal species, excitatory synaptic activity propagates neural firing, and inhibitory synaptic activity shapes and refines temporal and spatial patterns of neural activity. An important principle of brain function is the dynamic balance between excitation (E) and inhibition (I) (Isaacson and Scanziani, 2011). E-I balance improves the dynamic range of neural networks, sharpens stimulus selectivity, and prevents epileptic discharge (Froemke, 2015; Haider and McCormick, 2009; Wehr and Zador, 2003). Impaired E-I balance leads to dysfunction of neural circuits and contributes to neurological and neuropsychiatric disorders, including epilepsy, autism, schizophrenia and Alzheimer’s disease (Eichler and Meier, 2008; Nelson and Valakh, 2015; Yizhar et al., 2011). While growing evidence has linked genetic factors with these diseases, our knowledge of signaling pathways leading to disruption of E-I balance remains limited.
Gain of function mutations in neuronal nicotinic acetylcholine receptors (nAChRs) have been linked to frontal lobe epilepsy (De Fusco et al., 2000; Phillips et al., 2001). However, how mutant channels alter neuronal circuit activity is not yet understood. C. elegans is a well-established genetic organism for dissecting molecular mechanisms in circuit regulation. The locomotor circuit operates through coordinated activity of cholinergic excitation and GABAergic inhibition (White et al., 1976). An ionotropic ACh receptor ACR-2 acts as a postsynaptic receptor in the cholinergic motor neurons (Jospin et al., 2009; Qi et al., 2013). We previously reported a gain of function (gf) acr-2 mutation that up-regulates channel activity in a way similar to changesimplicated in epilepsy and that acr-2(gf) mutants display epileptic-like convulsions, as the result of increased endogenous cholinergic excitation and reduced GABAergic inhibition in the locomotor circuit (Jospin et al., 2009; Stawicki et al., 2011). Here, we investigated the physiological and molecular basis of how altered cholinergic drive results in excitation and inhibition imbalance.
Activity changes in neurons directly influence cytoplasmic Ca2+ levels. Ca2+ binds to many intracellular molecules and regulates diverse signaling pathways. Neuronal calcium sensor (NCS) proteins contain four EF-hand motifs and are conserved from yeast to human (Braunewell and Gundelfinger, 1999; Burgoyne, 2007). NCS proteins can bind to numerous proteins including synaptic proteins, ion channels, membrane receptors and kinases, dependent on Ca2+-loading status (Burgoyne and Haynes, 2012; Flaherty et al., 1993). Abnormal activity and expression of NCS proteins are associated with neurological diseases, such as Alzheimer’s disease and schizophrenia (Braunewell, 2005; Seaton et al., 2011). Nonetheless, it is not known how NCS proteins are involved in regulation of E-I balance in neural circuits.
Here, we find that increasing neuronal activity for varying durations results in distinct effects on E-I balance in C. elegans locomotor circuit. A short-duration of neuronal activation causes a reversible enhancement of presynaptic strength in excitatory cholinergic neurons, and maintains E-I balance. However, persistent activation of cholinergic neurons by ACR-2(gf) leads to asynchronous presynaptic release and impaired synaptic drive, following an initial enhancement. Moreover, asynchronous and reduced cholinergic release depresses excitability of downstream inhibitory GABAergic neurons, leading to an E-I imbalance in the locomotor circuit and epileptic convulsive behavior. We further identify the NCS-2 neuronal calcium sensor protein as a contributor to E-I imbalance in an activity-dependent manner.
RESULTS
Persistent activation of cholinergic neurons causes asynchronous release following an initial enhancement of presynaptic strength
ACR-2(gf) behaves as a hyperactive channel and increases cation influx in response to ACh when reconstituted in Xenopus oocytes (Jospin et al., 2009). In acr-2(gf) mutants the cholinergic motor neurons showed increased basal Ca2+ by measurement of GCaMP6 signals, compared to wild type (Figure S1A), consistent with previous observations using Cameleon (Qi et al., 2013). ACR-2 channel is expressed in the somato-dendritic compartment of cholinergic motor neurons, beginning from their birth in embryo (Qi et al., 2013). However, the convulsive behavior of acr-2(gf) animals develops progressively in postembryonic life (Jospin et al., 2009). To determine the effects of persistent activation of cholinergic motor neurons on synaptic vesicle (SV) release, we measured evoked excitatory postsynaptic currents (eEPSCs) at neuromuscular junctions (NMJs) in adult animals. In wild type animals, evoked release is marked by a sharp onset of eEPSCs followed by a rapid decay to baseline (Figure 1A). In acr-2(gf) mutants, the amplitude of eEPSCs was greatly reduced, and SV release kinetics became asynchronous, compared to wild type (Figure 1A). Hypertonic sucrose solution induced SV release, representing the readily releasable pool (RRP), was significantly reduced in acr-2(gf) mutants (Figure 1B). However, the amplitude and kinetics of endogenous EPSCs, representing spontaneous SV release, were unaltered in acr-2(gf) animals (Figure S3B). The expression and localization of postsynaptic AChR in muscles and their response to exogenous ACh were normal (Figures S1B and S1C). Together, the pattern of eEPSCs in acr-2(gf) indicates asynchronous acetylcholine release with impaired strength.
Figure 1. ACR-2(gf) channel-induced persistent high neuronal activity causes transition from an enhancement of presynaptic strength to asynchronous SV release.

(A) Average traces (left), mean amplitude (middle) and mean decay tau (right) of eEPSCs from wild type and acr-2(gf) in 2 mM Ca2+ bath solution.
(B) Average traces (left) and mean charge transfer (right) of 0.5 M hypertonic sucrose solution induced vesicle release from wild type and acr-2(gf) in 2 mM Ca2+ bath solution.
(C) Time course of convulsion rates after induced expression of ACR-2(gf) in acr-2(0) and in wild type control with parallel heat shock treatment. n=10 for each strains. L4 stage animals were treated with heat shock.
(D) Convulsion rates in indicated genotypes and induction conditions. n >= 10 for each genotypes. L4 stage animals were treated with heat shock.
(E) Average traces (left), mean amplitude (middle) and mean decay tau (right) of eEPSCs from indicated genotypes and induction conditions in 1.2 mM Ca2+ bath solution. Data from wild type were recorded 2 hours post-induction treatment.
***, p<0.001; **, p<0.01. Sample size is shown within each bar. See also Figure S1.
Asynchronous and reduced release could arise from defects in SV docking or in synaptic morphology. However, ultrastructural analyses showed that cholinergic neuromuscular synapses in acr-2(gf) had normal active zone morphology and accumulation of SVs (Figures S1E and S1F). The number of total docked SVs was increased, more noticeably at regions distal (>165 nm) from presynaptic dense projections (Figures S1G and S1H). This broadened SV docking pattern might contribute to the slow kinetics of evoked SV release (Neher and Sakaba, 2008), but is unlikely to account for the reduced amplitude of eEPSCs. Additionally, cholinergic synapses in acr-2(gf) showed normal expression of presynaptic active zone proteins ELKS-1 and Ca2+ channels UNC-2 (Figure S1D). These data show that sustained neuronal activation in acr-2(gf) mutants profoundly alters cholinergic neuron function without morphological changes of synapses.
The reduced evoked SV release from cholinergic neurons in acr-2(gf) is in contrast to the increased frequency of endogenous EPSCs (Figures 1A and 3B) (Jospin et al., 2009; Stawicki et al., 2011). The high frequency of endogenous EPSCs implies that cholinergic neurons can respond to high basal Ca2+ levels, though dynamic Ca2+ changes responding to stimulations need to be further confirmed. As ACR-2 channels are expressed from embryos to adults, we hypothesized that chronic activation of cholinergic motor neurons could directly cause the asynchronous and reduced eEPSCs in acr-2(gf) adults. To test this idea, we induced expression of ACR-2(gf) in mature motor circuit using a heat-shock-inducible promoter driven ACR-2(gf)-GFP transgene. Following a brief pulse of heat shock we detected the appearance of ACR-2(gf)-GFP on the cell surface within half an hour (Figure S1J, designated inducible ACR-2(gf)-GFP). The intensity of ACR-2(gf)-GFP reached a maximum after 2 hours and declined afterwards to a level comparable to that expressed from a single-copy transgene of ACR-2-GFP (Figures S1J and S1K). Induced expression of ACR-2(gf) also caused an increase of basal Ca2+ (Figure S1A). With this induced ACR-2(gf) paradigm, we investigated the effects of manipulating neuronal activity for varying time on synaptic transmission. Two hours post-induction of ACR-2(gf), eEPSCs showed normal release kinetics, but the amplitude was significantly higher than that of control animals under parallel heat shock treatment (Figure 1E). However, 10 hours post-induction, the amplitude of eEPSCs was significantly reduced, and SV release became asynchronous (Figure 1E). Postsynaptic muscle receptors showed normal response to exogenous ACh application (Figure S1M), and the amplitude and kinetics of endogenous EPSCs were also normal with induced expression of ACR-2(gf) (Figure S3D). These data reveal that persistent elevating neuronal activity by ACR-2(gf) causes an initial enhancement of presynaptic strength followed by impaired and asynchronous SV release.
Figure 3. Asynchronous cholinergic inputs correlate with low excitability of downstream GABAergic neurons.

(A) Illustration of locomotor circuit in C. elegans.
(B–C) Representative traces (top) and mean frequencies (bottom) of endogenous EPSCs
(B) and IPSCs (C) from wild type and acr-2(gf) in 2 mM Ca2+ bath solutions.
(D–E) Representative traces (top) and mean frequencies (bottom) of endogenous EPSCs
(D) and IPSCs (E) from indicated genotypes and conditions in 1.2 mM Ca2+ bath solutions. Data of wild type were recorded after 2 hours post-induction.
(F–I) Representative traces (top) and mean frequencies (bottom) of endogenous EPSCs (F and H) and IPSCs (G and I) from animals under different genotypes and treatments in 2 mM Ca2+ bath solutions.
**, p<0.01; *, p<0.05. Sample size is shown within each bar. See also Figure S3.
At the behavioral level, the progression of convulsions induced by expression of ACR-2(gf) showed strong correlation to the asynchronous and reduced cholinergic release (Figures 1C and 1E). The animals first showed noticeable convulsions about 7 hours post-induction of ACR-2(gf), and the frequency of convulsion steadily increased to a level indistinguishable from acr-2(gf) mutants by 20 hours post-induction (Figures 1C and 1D). Heat shock alone had no noticeable effect on wild type or acr-2(0) null animals (Figure 1D; Figure S1I). Induced expression of ACR-2(gf) from larvae or from adults both resulted in convulsive behaviors (Figure 1D; Figure S1L). This induced behavioral abnormality suggests that changes in presynaptic strength caused by sustained expression of ACR-2(gf) correlates with convulsion.
Temporary elevation of neuronal activity by ChR2 stimulation results in a reversible enhancement of presynaptic strength
We asked if temporary presynaptic enhancement alone could be sufficient to trigger asynchronous SV release. We devised a strategy to elevate neuronal activity for a short duration using ChR2. It has been reported that following one evoked release triggered by a single pulse of ChR2 stimulation, it takes more than 10 seconds for cholinergic motor neurons to fully recover the amplitude of eEPSCs (Liewald et al., 2008; Liu et al., 2009). Under our recording conditions, the amplitude of eEPSCs recovered to about 60% after a 3-second interval of ChR2 stimulation, and to more than 90% after a 10-second interval of ChR2 stimulation (Figure S2A). We therefore designed two ChR2 stimulation schemes to treat live animals for a period of 90 minutes at a frequency of either every 15 seconds (LFS, low frequency stimulation), or every 3 seconds (HFS, high frequency stimulation) (Figure 2A; see Experimental Procedures). Stimulation using the LFS protocol did not affect eEPSCs. However, under the HFS protocol, the amplitude of eEPSCs increased significantly (Figure 2B). This effect was presynaptic as the amplitude of postsynaptic currents in response to exogenous ACh remained similar with or without HFS treatments (Figure S2B). The amplitude and kinetics of endogenous EPSCs were also unaltered under either LFS or HFS (Figure S3F). Therefore, elevating cholinergic neuron activity by 90-minute HFS of ChR2 leads to an enhancement of presynaptic release. The amplitude of eEPSCs remained high one hour after completion of HFS treatments (Figure 2C). By 5 hours the amplitude of eEPSCs was restored to levels similar to controls without ChR2 stimulation, and remained so after 24 hours. These data show that increasing neuronal activity for a short duration by ChR2 stimulation causes a lasting but reversible enhancement of SV release, which matches the levels of input activity. To address whether longer stimulation, hence sustained activation of cholinergic neurons, could cause asynchronous release, we extended the HFS for 11 hours, and found that in these animals, eEPSCs became asynchronous with reduced strength (Figure 2D).
Figure 2. ChR2 HFS induces presynaptic changes in cholinergic neurons.

(A) Illustration for ChR2 stimulation experiment.
(B) Average traces (top), mean amplitude and mean decay tau (bottom) of eEPSCs from animals under different genotypes and treatments in 2 mM Ca2+ bath solutions. Animals were recorded about half of hour after ChR2 stimulation in LFS and HFS conditions in (B) and (C).
(C) The ratio of eEPSC amplitudes from HFS and dark conditions recorded at different time points from the beginning of ChR2 activation.
(D) Average traces (left), mean amplitude and mean decay tau (right) of eEPSCs from animals with indicated genotypes and treatment conditions in 2 mM Ca2+ bath solutions.
***, p<0.01; **, p<0.01; ns, not significant. Sample size is shown within each bar. See also Figure S2.
Asynchronous and reduced cholinergic input correlated with low excitability of downstream GABAergic neurons
In the locomotor circuit, excitatory cholinergic neurons form dyadic synapses onto both body wall muscle and inhibitory GABAergic neurons that innervate muscles on the opposite side (White et al., 1976) (Figure 3A). In wild type animals, cholinergic excitation is balanced by GABAergic inhibition (Jospin et al., 2009). However, in acr-2(gf) animals, the increased frequency in endogenous cholinergic excitation is accompanied by a decrease in the frequency of endogenous GABAergic inhibition (Figures 3B and 3C) (Jospin et al., 2009; Stawicki et al., 2011). Postsynaptic GABA receptors in muscle cells showed normal responses to exogenous GABA application (Stawicki et al., 2011) and to endogenous GABA release (Figure S3C). Direct stimulation of ChR2 expressed in GABAergic neurons of acr-2(gf) also triggered normal evoked inhibitory postsynaptic currents (eIPSCs) from muscle cells (Figure S3A), indicating that these GABAergic neurons have normal SV release capacity, but reduced excitability. We asked whether the reduced excitability of GABAergic neurons in acr-2(gf) was resulted from changes in cholinergic inputs. We analyzed endogenous IPSCs under elevation of cholinergic activity using animals expressing inducible ACR-2(gf) or animals after ChR2 HFS treatment. Frequencies of endogenous EPSC and IPSC both showed a trend of increase following ACR-2(gf) expression 2 hours post-heat-shock or 90-minute treatment with ChR2 HFS, but the balance of endogenous excitation and inhibition was maintained (Figures 3D–3G). This analysis shows that transient enhancement of eEPSCs does not cause low excitability in downstream GABAergic neurons. However, in animals expressing ACR-2(gf) 10 hours post-induction or 11-hour treatment with ChR2 HFS, we observed a significant reduction in the frequency of endogenous IPSCs (Figure 3D, 3E, 3H and 3I), consistent with the idea that asynchronous and reduced cholinergic input causes low excitability of downstream GABAergic neurons, leading to imbalance of endogenous excitatory and inhibitory activities in the locomotor circuit.
Neuronal calcium sensor protein NCS-2 regulates presynaptic strength in response to activity changes in cholinergic neurons
We next asked how the altered neuronal state in acr-2(gf) animals was mediated at the molecular level. We analyzed a large set of genetic mutants isolated based on suppression of the convulsive behavior of acr-2(gf) animals (Experimental Procedures), and identified neuronal calcium sensor protein NCS-2. NCS-2 has an N-terminal myristoylation motif and four EF-hand motifs (Figure 4A). Two mutations, ju836 and ju843, changing Arg72 to a stop codon and Ser6 to Phe in the myristoylation motif, respectively (Figure 4A; Table S1), and a deletion allele, tm1943, removing most of ncs-2 (designated as ncs-2(0)) all showed suppression of acr-2(gf) to similar degree (Figure 4B; Table S1), indicating that loss of function of ncs-2 causes suppression of acr-2(gf). ncs-2 transcriptional reporters showed wide expression in the nervous system, including cholinergic and GABAergic neurons in the ventral nerve cord (Table S1). We rescued the suppression of acr-2(gf) by ncs-2(0) using a single-copy transgene expressing GFP-tagged full length NCS-2 (Figure 4B). Furthermore, pan-neural or cholinergic motor neuron specific expression of NCS-2, but not expression from GABAergic motor neurons, resulted in a similar rescue (Figure 4B), supporting a cell-autonomous role of NCS-2 in cholinergic motor neurons in mediating the effect of acr-2(gf).
Figure 4. NCS-2 regulates presynaptic strength in response to activity increase.

(A) Illustration of NCS-2 protein. EF: EF-hand motif.
(B) Convulsion rates in indicated genotypes. The promoters used were Pncs-2(endogenous ncs-2 promoter), Pn(Prgef-1), PACh(Punc-17β) and PGABA(Punc-25).
(C) Average traces (left), mean amplitude and mean decay tau (right) of eEPSC from indicated genotypes in 2 mM Ca2+ bath solutions.
(D) Average traces (top), mean amplitude and mean decay tau (bottom) of eEPSCs recorded from indicated genotypes and conditions in 1.2 mM Ca2+ bath solutions. Data of wild type were recorded after 2 hours post-induction. ***, p<0.001;
**, p<0.01; ns, not significant. Sample size is shown within each bar. See also Figure S4.
ncs-2(0) single mutants showed no discernable defects in development, movement and overall neuronal architecture. Cholinergic neurons displayed normal synapse morphology and eEPSCs (Figures S4A–S4D), suggesting NCS-2 does not affect the basal synaptic transmission. However, ncs-2(0) strongly suppressed asynchronous eEPSCs in acr-2(gf) mutants, shifting the release kinetics of eEPSCs back to that in wild type (Figure 2C). The amplitude of eEPSCs in ncs-2(0); acr-2(gf) was also increased, compared to acr-2(gf) mutants. Additionally, NCS-2 was involved in the regulation of presynaptic strength caused by induced expression of ACR-2(gf) or HFS by ChR2 (Figures 4D, S4G and S4H). Consistent with the electrophysiology analysis, the convulsions following induced expression of ACR-2(gf) were ameliorated in ncs-2(0) mutants (Figure S4F). Together, these data show that NCS-2 is required both for the activity-dependent enhancement of presynaptic strength and subsequent asynchronous SV release.
NCS-2 cell-non-autonomously affects excitability of downstream GABAergic neurons
ncs-2(0) mutants alone did not affect endogenous IPSCs and EPSCs (Figures 5A and 5B). However, ncs-2(0); acr-2(gf) double mutants showed an increased frequency of endogenous IPSCs and a decrease in the frequency of endogenous EPSCs, compared to acr-2(gf) (Figures 5C and 5D). The net effect results in a significant correction of the E-I imbalance caused by acr-2(gf), consistent with suppression of convulsion. Furthermore, specific expression of NCS-2 in cholinergic motor neurons of ncs-2(0); acr-2(gf) reduced the frequency of endogenous IPSCs to be similar to that in acr-2(gf) (Figures 5C and 5D), indicating that the restoration of NCS-2 function in cholinergic neurons exacerbates GABAergic neuron excitability. The decreased frequency of endogenous IPSC 10 hours post-induced expression of ACR-2(gf) or 11-hour HFS by ChR2 was reversed by loss of NCS-2 (Figures 5E, 5F, S5I and S5J). Together, these data indicate that NCS-2 acts cell-non-autonomously to dampen GABAergic neuron excitability.
Figure 5. NCS-2 cell-non-autonomously mediates excitability of downstream GABAergic motor neurons.

(A–B) Representative traces (top), mean frequencies and mean amplitudes (bottom) of endogenous EPSCs (A) and IPSCs (B) from indicated genotypes in 1.2 mM Ca2+ bath solutions.
(C–D) Representative traces (top), mean frequencies and mean amplitudes (bottom) of endogenous EPSCs (C) and IPSCs (D) from indicated genotypes in 2 mM Ca2+ bath solutions.
(E–F) Representative traces (top), mean frequencies and mean amplitudes of endogenous EPSCs (E) and IPSCs (F) from indicated genotypes and conditions in 1.2 mM Ca2+ bath solutions. Data from wild type were recorded 2 hours post-induction treatment.
*, p<0.05; ns, not significant. Sample size is shown within each bar. See also Figure S5.
Presynaptic suppression of asynchronous eEPSC corrects E-I imbalance
To further confirm the correlation between asynchronous eEPSCs and the low excitability of GABAergic neurons, we examined another suppressor mutation of acr-2(gf), lgc-46(ju825), which is a gain-of-function mutation in a presynaptically localized ACh-gated chloride channel in cholinergic motor neurons (Figure 6A). LGC-46 regulates ACh release via a negative feedback mechanism as an auto-receptor (Takayanagi-Kiya et al., 2016). We found that while expression of LGC-46(gf) in cholinergic motor neurons did not enhance the amplitude of eEPSCs, it strongly suppressed asynchronous release kinetics of acr-2(gf), and increased the frequency of endogenous IPSCs without changing the amplitude (Figure 6B–6D, S6A and S6B). This analysis provides additional support that asynchronous release kinetics, but not small amplitude, of eEPSC correlates with low excitability of GABAergic neurons.
Figure 6. LGC-46(gf) channels specifically suppress asynchronous cholinergic release and correct E-I imbalance.

(A) Convulsion rates in indicated genotypes.
(B) Average traces (left), mean amplitude (middle) and mean decay tau (right) of eEPSC from indicated genotypes in 2 mM Ca2+ bath solutions. The trace of wild type is not shown.
(C–D) Representative traces and mean frequencies of endogenous EPSCs (C) and IPSCs
(D) from indicated genotypes in 2 mM Ca2+ bath solutions.
***, p<0.001; **, p<0.01; *, p<0.05; ns, not significant. Sample size is shown within each bar. See also Figure S6.
Both myristoylation and Ca2+ binding are required for the function of NCS-2
NCS-2-GFP showed preferential localization at the plasma membrane, nerve processes and in the cytoplasm of soma from L1 through adult stages (Figures 7A; Figure S7B). The myristoylation motif of NCS proteins is required for their subcellular distributions (Burgoyne, 2007). Indeed, we found that mutations of key residues in the myristoylation motif NCS-2(G2A) or NCS-2(S6F) resulted in a diffused distribution, resembling free GFP (Figure 7B). Transgenic expression of NCS-2(G2A) or NCS-2(S6F) mutants also did not show rescuing activity in ncs-2(0); acr-2(gf) (Figure 7C), indicating that myristoylation of NCS-2 is required both for its localization and function.
Figure 7. The function of NCS-2 depends on myristoylation and Ca2+ binding properties.

(A) Representative images of single copy insertion of NCS-2GFP driven by its own promoter in the head (L3 stage) and ventral nerve cord (VNC, adult) of ncs-2(0), and in VNC (adult) of ncs-2(0); acr-2(gf).
(B) Subcellular localizations of GFP tagged NCS-2, NCS-2(EFmut), NCS-2(G2A) and NCS-2(S6F) in cholinergic motor neurons.
(C) Convulsion rates in indicated genotypes. The promoter used was PACh(Pacr-2).
(D) eEPSCs in indicated genotypes and conditions.
Scale bars are 10 μm in (A) and (B). ***, p<0.001; **, p<0.01; *, p<0.05. Sample size is shown within each bar. See also Figure S7.
The canonical EF-hand forms a loop made of 12 amino acid residues where positions 1 and 12 are necessary for Ca2+ binding (Gifford et al., 2007; Gomez et al., 2001; Heidarsson et al., 2013). Based on sequence conservation, EF2-4 motifs of NCS-2 have functional Ca2+-binding capacity. To test the function of Ca2+ binding in NCS-2, we mutated the amino acids in both positions 1 and 12 of EF2-4 motifs (Table S2). Transgenic expression of EF-hand mutant NCS-2(EFmut) did not rescue the suppression of acr-2(gf)-induced convulsions by ncs-2(0) (Figure 7C), nor rescued the presynaptic strength changes caused by induced expression of ACR-2(gf) or HFS by ChR2 in ncs-2(0) mutants (Figure 7D; Figure S7C). However, these mutations in EF-hand motifs did not alter the localization pattern of NCS-2-GFP (Figure 7B). The distribution pattern of wild type NCS-2-GFP was also not altered in acr-2(gf) mutants, which has increased basal Ca2+ levels (Figure 7A). Furthermore, ncs-2(0) did not change the basal Ca2+ level in wild type or in acr-2(gf) mutants (Figure S7A), suggesting that NCS-2 is unlikely to act as a Ca2+ buffering protein or to directly regulate the function of ACR-2(gf) channels, and instead may function as a Ca2+-signaling molecule. These results suggest that the localization of NCS-2 is dependent on myristoylation, but calcium binding is required for a yet to be identified signaling role.
DISCUSSION
An essential feature in the operation of neural networks is that inhibition changes proportionally in response to excitatory changes. By investigating how excitatory drive in response to activity increase over varying time durations influenced the balance of excitatory and inhibitory activities in C. elegans locomotor circuit, we discover that NCS-2 is required for regulating the activity-dependent presynaptic strength and E-I balance.
Same neural circuit produces different behavioral outcome depending on the type and duration of neuronal activity
Many studies using acute stimulation or inhibition have shown that behavioral consequences directly reflect activity changes on the manipulated neurons. However, recent observations also show that acute or chronic manipulation of neural activity in the same circuit can resulted in distinct animal behaviors, revealing unexpected off-target effects of acute manipulation (Otchy et al., 2015). Here, we show that stimulation of cholinergic neurons for a short-duration verse chronically has distinct effects on E-I balance and motor behavior. Persistent elevation of cholinergic neuronal activity in acr-2(gf) mutants or under induced expression of ACR-2(gf) over 10 hours or longer results in asynchronous SV release with greatly reduced strength. However, the increased frequency of endogenous EPSC from cholinergic neurons indicates that these neurons remain active. Intriguingly, the asynchronous cholinergic input correlates with depressed excitability in downstream GABAergic neurons. We have previously reported that a TRPM channel GTL-2 expressed in the glial-like epidermal tissue specifically affected the GABAergic transmission (Stawicki et al., 2011). We speculate that sustained excitation of cholinergic neurons might indirectly alter GABAergic neurons via cross-tissue signaling. The mechanisms underlying this dis-inhibition will need to be further examined. Nonetheless, our findings suggest the need that addressing the tuning effects of neuronal activity on circuit performance and behavioral outcomes requires careful studies using combination of both acute and chronic manipulations.
NCS-2 mediates activity-state regulation of presynaptic strength and E-I balance
NCS proteins have been implicated in multiple neuronal functions in mammals (Braunewell and Gundelfinger, 1999; McCue et al., 2010). Overexpression of NCS-1 proteins in cultured neurons affect short-term plasticity (Sippy et al., 2003) via direct regulation of presynaptic Ca2+ channels (Tsujimoto et al., 2002; Yan et al., 2014). However, our paired-pulse stimulation with ChR2 revealed no difference between wild type and ncs-2(0) mutants, suggesting that NCS-2 is not involved in short-term plasticity in cholinergic neurons. Mammalian NCS-1 and Hippocalcin have also been reported to be involved in long-term depression (Kerrigan et al., 2012) via regulating postsynaptic AMPA glutamate receptor trafficking (Jo et al., 2008; Jo et al., 2010; Palmer et al., 2005). However, in ncs-2(0) mutants, the expression of somato-dendritic ACR-2 receptor in cholinergic neurons or that of postsynaptic ACh receptor in muscles are unaltered. Moreover, direct stimulation by ChR2, which does not rely on endogenous ion channels or receptors, also induced changes in presynaptic strength dependent of NCS-2. The function of NCS-2 depends on its Ca2+ binding property, yet, loss of ncs-2 does not alter basal calcium level in neurons. NCS-2 has little effect on synaptic morphology and basal synaptic transmission in cholinergic neurons. Our data suggest that NCS-2 responds to neuronal activity changes and further regulates presynaptic strength and circuit output.
Cholinergic transmission modulates E-I balance
ACh modulates neural communication by activating diverse ACh-gated ionotropic or metabotropic receptors. The contribution of cholinergic signaling to E-I balance has long been noted, but is only beginning to be understood. In the mammalian brain, ACh is an effective neuromodulator of E-I balance (Froemke, 2015; John and Berg, 2015). For example, stimulation of the cholinergic nucleus basalis increased excitatory activities and decreased inhibitory activities in the auditory cortex via disinhibition (Froemke et al., 2007; Letzkus et al., 2011). Interestingly, multiple point mutations in nAChRs have been found in patients with frontal lobe epilepsy (Becchetti et al., 2015). One of the characteristics of epileptic seizures is the imbalance of excitation and inhibition within neural network. The molecular nature and physiological consequences of acr-2(gf) resembles those reported for gain of function mutations of nAChRs in frontal lobe epilepsy (Becchetti et al., 2015; Boillot and Baulac, 2016). Our finding that NCS-2 plays a key role in regulating excitation and inhibition balance sheds light to the understanding of epileptogenesis associated with mutations in nAChRs. Future studies will elucidate the mechanisms of neuronal Ca2+ sensor proteins dependent regulations on E-I imbalance.
EXPERIMENTAL PROCEDURES
Genetics
C. elegans strains were maintained on Nematode Growth Medium (NGM) plates at room temperature (20–22°C) as described (Brenner, 1974). Strain and allele information is summarized in Table S1, and genotypes were confirmed by allele-specific sequence polymorphism. ju836 and ju843 were isolated as suppressors of the convulsion behavior caused by acr-2(gf) in a genetic screen performed similar as previous described (Jospin et al., 2009). Whole genome sequencing analysis (Sarin et al., 2008) and SNP mapping identified causative nucleotide changes in ncs-2 (Table S1).
Molecular Biology and Transgenes
All DNA expression constructs were made using either Gateway cloning technology (Invitrogen, CA) following the manufacturer’s procedures, or Gibson assembly (Gibson et al., 2009). Point mutations are constructed by using site-directed mutagenesis. We introduced a point mutation E123T (Gunaydin et al., 2010) in ChR2(H134R) plasmid (Liewald et al., 2008) to get ChR2(E123T/H134R), designated as ChetaHR. DNA sequences were verified using restriction enzyme digestion and sequencing. Table S2 lists constructs and Table S1 lists strains carrying transgenes. Extrachromosomal array transgenes were generated following standard procedures (Mello et al., 1991). In general, plasmid DNAs of interest were used at 20–40 ng/μl together with co-injection markers Pttx-3-RFP, Pgcy-8-mCherry or Pgcy-8-GFP at 60–80 ng/μl. For each construct, multiple independent transgenic lines were analyzed. Single copy insertions were made using a Cas9-based method. NCS-2-GFP is driven by its own 4kb 5′ upstream promoter sequence, and followed by its own 3′ downstream sequence. It was integrated into ttTi4348 site of chromosome I. To test the function of Ca2+ binding in NCS-2, we mutated the key amino acids in both positions 1 and 12 of EF2-4 motifs to obtain NCS-2(EFmut) (Table S2).
Whole-mount immunocytochemistry
Immunostaining was performed on one day-old adult animals as previously described (Finney and Ruvkun, 1999) with minor modifications (Cherra and Jin, 2016). Primary antibodies used were: anti-GFP (1:500, A11122, Invitrogen, CA) or anti-UNC-17 (1:100, MAb1403, gift from J. Rand, Oklahoma Medical Research Foundation, Oklahoma City, OK); and secondary antibodies were: anti-rabbit Alexa 488 or anti-mouse Alexa 594 (1:2000, Invitrogen, CA).
Confocal image measurement and analysis
Confocal images were taken on a Zeiss LSM 710. Laser output was set to optimize detection and minimize bleed-through. Image data were saved as lsm file, and analyzed in MetaMorph (Sunnyvale, CA). To analyze the morphology of synaptic puncta in dorsal nerve cord (DNC), average fluorescence intensities in 8-pixel wide segment regions along DNC were calculated by MetaMorph and plotted against the pixel position along the scan-line in IGOR Pro (WaveMetrics, Lake Oswego, OR) (Figure S4A). To determine the threshold, average fluorescence intensity and standard deviation (SD) along the continuous 2–5 μm DNC without puncta were calculated. The threshold was initially set as the value of 8-fold of SD plus the average intensity in this region. In most cases, the automatically set threshold was above most basal axonal signals, but below peaks of all puncta. The top of each punctum was determined by the peak points above threshold. The boundaries of each punctum were determined by the valley points. The base of each punctum was defined as average intensity of both boundaries if they were below threshold, or intensity of the boundary below the threshold if another boundary is above the threshold. Amplitude was defined as peak intensity subtracted from base intensity. Size of puncta was calculated as width at 50% amplitude. Fluorescence trace was integrated to the distance between two boundaries of each punctum to calculate the synaptic weight for each punctum. Punctum density per 100 μm was defined as the total identified punctum number divided by scan-line length multiplied by 100 μm.
Electron microscopy of synaptic vesicle distribution
Young adult worms were fixed by high-pressure freezing at -176 °C in the BAL-TEC HPM 010, and freeze substituted in Leica EM AFS2 with 2% osmium tetroxide and 0.1% uranyl acetate in acetone for 4 days at −90 °C and 16 hours at −20 °C. After infiltration and embedding in Durcupan ACM resin blocks were polymerized at 60 °C for 48 hours. Serial sections of 33 nm thicknesses were collected using Leica ULTRACUT UCT and stained for 5 minutes in 2.5% uranyl acetate in 70% methanol, followed by washing 3 minutes in Reynold’s lead citrate. Images of synapses from ventral nerve cord were obtained on a JEOL-1200 EX transmission electron microscope using Gatan 4 MP digital camera and DigitalMicrograph acquisition software. Distances from the edge of the dense projection to docked vesicles were measured using ImageJ. Distance from the dense projection to each docked vesicle was sorted into 33 nm bins. Number of vesicles in each bin was divided by number of profiles to yield an average number of vesicles per profile in each bin. Only vesicles in profiles containing a dense projection were included. Each contiguous set of serial profiles containing a dense projection was considered as a single synapse. Mean and SEM of all data points was used to calculate p values in two-tailed Student’s t test.
Inducible ACR-2(gf) expression
Transgenic animals expressing Phsp-16.2-ACR-2(gf) and Phsp-16.41-ACR-2(gf) (juIs517) or their GFP versions (juEx6952) displayed normal behavior and growth when maintained at 20 °C. Test NGM plates with OP50 were pre-incubated in 34 °C incubator overnight. Worms were transferred to these plates within 2 mins, and treated at 34 °C for 7 mins or indicated periods. Treated animals were placed to 20 °C incubator for behavioral observation and electrophysiological studies.
ChR2 stimulation on animals
Animals were grown in dark overnight on 5-cm NGM plates seeded with OP50 containing 1.6 mM All Trans Retinal (ATR) without light exposure. They were then transferred onto 3-cm ATR-containing NGM plates seeded with thin OP50 lawn; a copper ring was made using 100 mM CuCl2 around the edge of plates. We used blue LED light source (460 nm, spectrum half width 27 nm, Prizmatix, Givat Shmuel, Israel) to illuminate the entire surface of plates, with the diameter of illumination area being 5.8 cm. LED light intensity was measured to be 2.36 mW/mm2 with a power sensor D10MM connected to an Optical Power Meter PM50 (Thorlabs, Newton, New Jersey, US). The Prizmatix USB-TTL interface was used to connecte LED control unit and the computer. Arduino software running in the computer controls the stimulation frequency. We thus switched on the blue LED light every 3 s (HFS) or every 15 s (LFS) to repeatedly activate ChR2. Animals showed body contraction in response to ChR2 stimulation.
Electrophysiology
Neuromuscular dissection methods were as described previously (Zhou et al., 2013). The bath solution contains (in mM): 127 NaCl, 5 KCl, 26 NaHCO3, 1.25 NaH2PO4, 4 MgCl2, 10 glucose with indicated CaCl2 concentrations, and sucrose to 340 mOsm, bubbled with 5% CO2, 95% O2 at 20ºC. The pipette solution contains (in mM): 120 CH3O3SCs, 4 CsCl, 15 CsF, 4 MgCl2, 5 EGTA, 0.25 CaCl2, 10 HEPES and 4 Na2ATP, adjusted to pH 7.2 with CsOH. Conventional whole-cell recordings from muscle cells were performed at 20°C. An EPC-10 patch-clamp amplifier was used together with the Patchmaster software package (HEKA Electronics, Lambrecht, Germany). Endogenous EPSCs were recorded at -60 mV and endogenous IPSC were recorded at 0 mV. For paired-pulse stimulation with Punc-17-ChR2 (Figure S2A) and eIPSC recordings with Punc-47-ChR2 (Figure S3A), illumination was provided with a Sutter Instrument Lambda LS fitted with a Lamda 10-2 filter wheel for shuttering (Novato, CA). Excitation light was filtered with an eGFP filter set with 480 nm excitation (Chroma N41012; Chroma, Bellows Falls, VT) and focused on the specimen with a 63× water immersion objective (Olympus). All other evoked EPSCs were triggered by electric stimulations by putting a second glass pipet filled with bath solutions on the ventral nerve cord as stimulating electrode. The stimulating electrode gently touched the anterior region of ventral nerve cord to form loose patch configuration, which is around 1 muscle distance from recording pipets. A 0.5 ms, 85 μA square current pulse was generated by the isolated stimulator (WPI A320RC) as stimulus. The resistance of recording pipet is 2.5–3.5 MΩ. Series resistance was compensated to 70% for the evoked EPSC recording. ACh evoked currents were stimulated by puffing 0.5 mM ACh on body wall muscles. For RRP depletion, the 0.5 M sucrose in bath solution was applied to ventral nerve cord near the recorded muscles by Picospritzer with 8 psi for 7 seconds. The sucrose-evoked responses have been compensated for the basal activities by subtracting basal line current level prior to sucrose application. All current traces were imported to IGOR Pro (WaveMetrics, Lake Oswego, OR) for further analysis.
Ca2+ imaging
Animals carrying Pacr-2-GCaMP6f-SL2-mKate2 were immobilized in M9 with polystyrene beads (Polysciences, Warrington, PA) on 10% agarose pads. Both GCaMP6f and mKate2 signals were taken from ventral cord neurons. The ratio of GCaMP6f to mKate2 was averaged from all ventral nerve cord neurons in the same animal, and presented as mean+SEM for all animals per each genotype.
Quantification of Convulsion
L4 larvae were placed on freshly seeded NGM plates; and the following day individual young adults were transferred to fresh plates for convulsion counting. A convulsion was defined as a visible sudden shortening in the animal’s body length (Jospin et al., 2009).
Statistical Analysis
Graphpad Prism (GraphPad Software, CA) was used for statistical analysis. For comparisons of two groups, we used a two-tailed Student’s t test. For comparisons involving multiple groups, we used one-way ANOVA or two-way ANOVA with Bonferroni’s post hoc test. Error bars indicate SEM. ***, p <0.001; **, p <0.01; *, p < 0.05; ns, not significant.
Supplementary Material
Acknowledgments
We thank A. Gottschalk, J.S. Dittman, J.-L. Bessereau, H. Bringmann and J. Rand for strains or reagents, Y. B. Qi for isolating ju836 and ju843, and Z. Wang for Cas9-mediated insertion method. We are grateful to A.D. Chisholm and our lab members for advice and comments. Some strains were provided by the Japan National BioResource Project (NBRP) and the Caenorhabditis Genetics Center (NIH P40 OD010440). This work was supported by NIH grants (R01 NS035546 to Y.J., F32 NS081945 to S.J.C). K.Z. and A.G. are associates, and Y.J. is an Investigator, of the Howard Hughes Medical Institute.
Footnotes
AUTHOR CONTRIBUTIONS
K.Z. and Y.J. conceived and designed the study. K.Z performed most experiments. S.J.C. identified ncs-2 mutants and performed immunocytochemistry. A.G. performed EM analysis. K.Z. and Y.J. wrote the manuscript and all authors edited the manuscript.
Publisher's Disclaimer: This is a PDF file of an unedited manuscript that has been accepted for publication. As a service to our customers we are providing this early version of the manuscript. The manuscript will undergo copyediting, typesetting, and review of the resulting proof before it is published in its final citable form. Please note that during the production process errors may be discovered which could affect the content, and all legal disclaimers that apply to the journal pertain.
References
- Becchetti A, Aracri P, Meneghini S, Brusco S, Amadeo A. The role of nicotinic acetylcholine receptors in autosomal dominant nocturnal frontal lobe epilepsy. Frontiers in physiology. 2015;6:22. doi: 10.3389/fphys.2015.00022. [DOI] [PMC free article] [PubMed] [Google Scholar]
- Boillot M, Baulac S. Genetic models of focal epilepsies. J Neurosci Methods. 2016;260:132–143. doi: 10.1016/j.jneumeth.2015.06.003. [DOI] [PubMed] [Google Scholar]
- Braunewell KH. The darker side of Ca2+ signaling by neuronal Ca2+-sensor proteins: from Alzheimer’s disease to cancer. Trends in pharmacological sciences. 2005;26:345–351. doi: 10.1016/j.tips.2005.04.008. [DOI] [PubMed] [Google Scholar]
- Braunewell KH, Gundelfinger ED. Intracellular neuronal calcium sensor proteins: a family of EF-hand calcium-binding proteins in search of a function. Cell Tissue Res. 1999;295:1–12. doi: 10.1007/s004410051207. [DOI] [PubMed] [Google Scholar]
- Brenner S. The genetics of Caenorhabditis elegans. Genetics. 1974;77:71–94. doi: 10.1093/genetics/77.1.71. [DOI] [PMC free article] [PubMed] [Google Scholar]
- Burgoyne RD. Neuronal calcium sensor proteins: generating diversity in neuronal Ca2+ signalling. Nat Rev Neurosci. 2007;8:182–193. doi: 10.1038/nrn2093. [DOI] [PMC free article] [PubMed] [Google Scholar]
- Burgoyne RD, Haynes LP. Understanding the physiological roles of the neuronal calcium sensor proteins. Molecular brain. 2012;5:2. doi: 10.1186/1756-6606-5-2. [DOI] [PMC free article] [PubMed] [Google Scholar]
- Cherra SJ, Jin Y., 3rd A Two-Immunoglobulin-Domain Transmembrane Protein Mediates an Epidermal-Neuronal Interaction to Maintain Synapse Density. Neuron. 2016;89:325–336. doi: 10.1016/j.neuron.2015.12.024. [DOI] [PMC free article] [PubMed] [Google Scholar]
- De Fusco M, Becchetti A, Patrignani A, Annesi G, Gambardella A, Quattrone A, Ballabio A, Wanke E, Casari G. The nicotinic receptor beta 2 subunit is mutant in nocturnal frontal lobe epilepsy. Nat Genet. 2000;26:275–276. doi: 10.1038/81566. [DOI] [PubMed] [Google Scholar]
- Eichler SA, Meier JC. E-I balance and human diseases - from molecules to networking. Frontiers in molecular neuroscience. 2008;1:2. doi: 10.3389/neuro.02.002.2008. [DOI] [PMC free article] [PubMed] [Google Scholar]
- Flaherty KM, Zozulya S, Stryer L, McKay DB. Three-dimensional structure of recoverin, a calcium sensor in vision. Cell. 1993;75:709–716. doi: 10.1016/0092-8674(93)90491-8. [DOI] [PubMed] [Google Scholar]
- Froemke RC. Plasticity of cortical excitatory-inhibitory balance. Annu Rev Neurosci. 2015;38:195–219. doi: 10.1146/annurev-neuro-071714-034002. [DOI] [PMC free article] [PubMed] [Google Scholar]
- Froemke RC, Merzenich MM, Schreiner CE. A synaptic memory trace for cortical receptive field plasticity. Nature. 2007;450:425–429. doi: 10.1038/nature06289. [DOI] [PubMed] [Google Scholar]
- Gibson DG, Young L, Chuang RY, Venter JC, Hutchison CA, 3rd, Smith HO. Enzymatic assembly of DNA molecules up to several hundred kilobases. Nat Methods. 2009;6:343–345. doi: 10.1038/nmeth.1318. [DOI] [PubMed] [Google Scholar]
- Gifford JL, Walsh MP, Vogel HJ. Structures and metal-ion-binding properties of the Ca2+-binding helix-loop-helix EF-hand motifs. Biochem J. 2007;405:199–221. doi: 10.1042/BJ20070255. [DOI] [PubMed] [Google Scholar]
- Gomez M, De Castro E, Guarin E, Sasakura H, Kuhara A, Mori I, Bartfai T, Bargmann CI, Nef P. Ca2+ signaling via the neuronal calcium sensor-1 regulates associative learning and memory in C. elegans. Neuron. 2001;30:241–248. doi: 10.1016/s0896-6273(01)00276-8. [DOI] [PubMed] [Google Scholar]
- Gunaydin LA, Yizhar O, Berndt A, Sohal VS, Deisseroth K, Hegemann P. Ultrafast optogenetic control. Nat Neurosci. 2010;13:387–392. doi: 10.1038/nn.2495. [DOI] [PubMed] [Google Scholar]
- Haider B, McCormick DA. Rapid neocortical dynamics: cellular and network mechanisms. Neuron. 2009;62:171–189. doi: 10.1016/j.neuron.2009.04.008. [DOI] [PMC free article] [PubMed] [Google Scholar]
- Heidarsson PO, Otazo MR, Bellucci L, Mossa A, Imparato A, Paci E, Corni S, Di Felice R, Kragelund BB, Cecconi C. Single-molecule folding mechanism of an EF-hand neuronal calcium sensor. Structure. 2013;21:1812–1821. doi: 10.1016/j.str.2013.07.022. [DOI] [PubMed] [Google Scholar]
- Isaacson JS, Scanziani M. How inhibition shapes cortical activity. Neuron. 2011;72:231–243. doi: 10.1016/j.neuron.2011.09.027. [DOI] [PMC free article] [PubMed] [Google Scholar]
- Jo J, Heon S, Kim MJ, Son GH, Park Y, Henley JM, Weiss JL, Sheng M, Collingridge GL, Cho K. Metabotropic glutamate receptor-mediated LTD involves two interacting Ca(2+) sensors, NCS-1 and PICK1. Neuron. 2008;60:1095–1111. doi: 10.1016/j.neuron.2008.10.050. [DOI] [PMC free article] [PubMed] [Google Scholar]
- Jo J, Son GH, Winters BL, Kim MJ, Whitcomb DJ, Dickinson BA, Lee YB, Futai K, Amici M, Sheng M, et al. Muscarinic receptors induce LTD of NMDAR EPSCs via a mechanism involving hippocalcin, AP2 and PSD-95. Nat Neurosci. 2010;13:1216–1224. doi: 10.1038/nn.2636. [DOI] [PubMed] [Google Scholar]
- John D, Berg DK. Long-lasting changes in neural networks to compensate for altered nicotinic input. Biochem Pharmacol. 2015;97:418–424. doi: 10.1016/j.bcp.2015.07.020. [DOI] [PMC free article] [PubMed] [Google Scholar]
- Jospin M, Qi YB, Stawicki TM, Boulin T, Schuske KR, Horvitz HR, Bessereau JL, Jorgensen EM, Jin Y. A neuronal acetylcholine receptor regulates the balance of muscle excitation and inhibition in Caenorhabditis elegans. PLoS Biol. 2009;7:e1000265. doi: 10.1371/journal.pbio.1000265. [DOI] [PMC free article] [PubMed] [Google Scholar]
- Kerrigan TL, Daniel JW, Regan PL, Cho K. The role of neuronal calcium sensors in balancing synaptic plasticity and synaptic dysfunction. Frontiers in molecular neuroscience. 2012;5:57. doi: 10.3389/fnmol.2012.00057. [DOI] [PMC free article] [PubMed] [Google Scholar]
- Letzkus JJ, Wolff SB, Meyer EM, Tovote P, Courtin J, Herry C, Luthi A. A disinhibitory microcircuit for associative fear learning in the auditory cortex. Nature. 2011;480:331–335. doi: 10.1038/nature10674. [DOI] [PubMed] [Google Scholar]
- Liewald JF, Brauner M, Stephens GJ, Bouhours M, Schultheis C, Zhen M, Gottschalk A. Optogenetic analysis of synaptic function. Nat Methods. 2008;5:895–902. doi: 10.1038/nmeth.1252. [DOI] [PubMed] [Google Scholar]
- Liu Q, Hollopeter G, Jorgensen EM. Graded synaptic transmission at the Caenorhabditis elegans neuromuscular junction. Proc Natl Acad Sci U S A. 2009;106:10823–10828. doi: 10.1073/pnas.0903570106. [DOI] [PMC free article] [PubMed] [Google Scholar]
- McCue HV, Haynes LP, Burgoyne RD. The diversity of calcium sensor proteins in the regulation of neuronal function. Cold Spring Harb Perspect Biol. 2010;2:a004085. doi: 10.1101/cshperspect.a004085. [DOI] [PMC free article] [PubMed] [Google Scholar]
- Mello CC, Kramer JM, Stinchcomb D, Ambros V. Efficient gene transfer in C.elegans: extrachromosomal maintenance and integration of transforming sequences. EMBO J. 1991;10:3959–3970. doi: 10.1002/j.1460-2075.1991.tb04966.x. [DOI] [PMC free article] [PubMed] [Google Scholar]
- Neher E, Sakaba T. Multiple roles of calcium ions in the regulation of neurotransmitter release. Neuron. 2008;59:861–872. doi: 10.1016/j.neuron.2008.08.019. [DOI] [PubMed] [Google Scholar]
- Nelson SB, Valakh V. Excitatory/Inhibitory Balance and Circuit Homeostasis in Autism Spectrum Disorders. Neuron. 2015;87:684–698. doi: 10.1016/j.neuron.2015.07.033. [DOI] [PMC free article] [PubMed] [Google Scholar]
- Otchy TM, Wolff SB, Rhee JY, Pehlevan C, Kawai R, Kempf A, Gobes SM, Olveczky BP. Acute off-target effects of neural circuit manipulations. Nature. 2015;528:358–363. doi: 10.1038/nature16442. [DOI] [PubMed] [Google Scholar]
- Palmer CL, Lim W, Hastie PG, Toward M, Korolchuk VI, Burbidge SA, Banting G, Collingridge GL, Isaac JT, Henley JM. Hippocalcin functions as a calcium sensor in hippocampal LTD. Neuron. 2005;47:487–494. doi: 10.1016/j.neuron.2005.06.014. [DOI] [PMC free article] [PubMed] [Google Scholar]
- Phillips HA, Favre I, Kirkpatrick M, Zuberi SM, Goudie D, Heron SE, Scheffer IE, Sutherland GR, Berkovic SF, Bertrand D, Mulley JC. CHRNB2 is the second acetylcholine receptor subunit associated with autosomal dominant nocturnal frontal lobe epilepsy. Am J Hum Genet. 2001;68:225–231. doi: 10.1086/316946. [DOI] [PMC free article] [PubMed] [Google Scholar]
- Qi YB, Po MD, Mac P, Kawano T, Jorgensen EM, Zhen M, Jin Y. Hyperactivation of B-type motor neurons results in aberrant synchrony of the Caenorhabditis elegans motor circuit. J Neurosci. 2013;33:5319–5325. doi: 10.1523/JNEUROSCI.4017-12.2013. [DOI] [PMC free article] [PubMed] [Google Scholar]
- Sarin S, Prabhu S, O’Meara MM, Pe’er I, Hobert O. Caenorhabditis elegans mutant allele identification by whole-genome sequencing. Nat Methods. 2008;5:865–867. doi: 10.1038/nmeth.1249. [DOI] [PMC free article] [PubMed] [Google Scholar]
- Seaton G, Hogg EL, Jo J, Whitcomb DJ, Cho K. Sensing change: the emerging role of calcium sensors in neuronal disease. Seminars in cell & developmental biology. 2011;22:530–535. doi: 10.1016/j.semcdb.2011.07.014. [DOI] [PubMed] [Google Scholar]
- Sippy T, Cruz-Martin A, Jeromin A, Schweizer FE. Acute changes in short-term plasticity at synapses with elevated levels of neuronal calcium sensor-1. Nat Neurosci. 2003;6:1031–1038. doi: 10.1038/nn1117. [DOI] [PMC free article] [PubMed] [Google Scholar]
- Stawicki TM, Zhou K, Yochem J, Chen L, Jin Y. TRPM channels modulate epileptic-like convulsions via systemic ion homeostasis. Curr Biol. 2011;21:883–888. doi: 10.1016/j.cub.2011.03.070. [DOI] [PMC free article] [PubMed] [Google Scholar]
- Takayanagi-Kiya S, Zhou K, Jin Y. Release-dependent feedback inhibition by a presynaptically localized ligand-gated anion channel. eLife. 2016:5. doi: 10.7554/eLife.21734. [DOI] [PMC free article] [PubMed] [Google Scholar]
- Tsujimoto T, Jeromin A, Saitoh N, Roder JC, Takahashi T. Neuronal calcium sensor 1 and activity-dependent facilitation of P/Q-type calcium currents at presynaptic nerve terminals. Science. 2002;295:2276–2279. doi: 10.1126/science.1068278. [DOI] [PubMed] [Google Scholar]
- Wehr M, Zador AM. Balanced inhibition underlies tuning and sharpens spike timing in auditory cortex. Nature. 2003;426:442–446. doi: 10.1038/nature02116. [DOI] [PubMed] [Google Scholar]
- White JG, Southgate E, Thomson JN, Brenner S. The structure of the ventral nerve cord of Caenorhabditis elegans. Philos Trans R Soc Lond B Biol Sci. 1976;275:327–348. doi: 10.1098/rstb.1976.0086. [DOI] [PubMed] [Google Scholar]
- Yan J, Leal K, Magupalli VG, Nanou E, Martinez GQ, Scheuer T, Catterall WA. Modulation of CaV2.1 channels by neuronal calcium sensor-1 induces short-term synaptic facilitation. Mol Cell Neurosci. 2014;63:124–131. doi: 10.1016/j.mcn.2014.11.001. [DOI] [PMC free article] [PubMed] [Google Scholar]
- Yizhar O, Fenno LE, Prigge M, Schneider F, Davidson TJ, O’Shea DJ, Sohal VS, Goshen I, Finkelstein J, Paz JT, et al. Neocortical excitation/inhibition balance in information processing and social dysfunction. Nature. 2011;477:171–178. doi: 10.1038/nature10360. [DOI] [PMC free article] [PubMed] [Google Scholar]
- Zhou K, Stawicki TM, Goncharov A, Jin Y. Position of UNC-13 in the active zone regulates synaptic vesicle release probability and release kinetics. eLife. 2013;2:e01180. doi: 10.7554/eLife.01180. [DOI] [PMC free article] [PubMed] [Google Scholar]
Associated Data
This section collects any data citations, data availability statements, or supplementary materials included in this article.