

SUMMARY
Innate and adaptive lymphoid development is orchestrated by the activities of E-proteins and their antagonist Id-proteins, but how these factors regulate early T cell progenitor (ETP) and innate lymphoid cell (ILC) development remains unclear. Using multiple genetic strategies we demonstrated that E-proteins E2A and HEB acted in synergy in the thymus to establish T cell identity and to suppress the aberrant development of ILCs, including ILC2s and lymphoid tissue-inducer-like cells. E2A and HEB orchestrated T cell fate and suppressed the ILC transcription signature by activating the expression of genes associated with Notch receptors, T cell receptor (TCR) assembly, and TCR-mediated signaling. E2A and HEB acted in ETPs to establish and maintain a T cell-lineage specific enhancer repertoire, including regulatory elements associated with the Notch1 and Rag1/2 gene loci. Based on these and previous observations we propose that the E-Id protein axis specifies innate versus adaptive lymphoid cell fate.
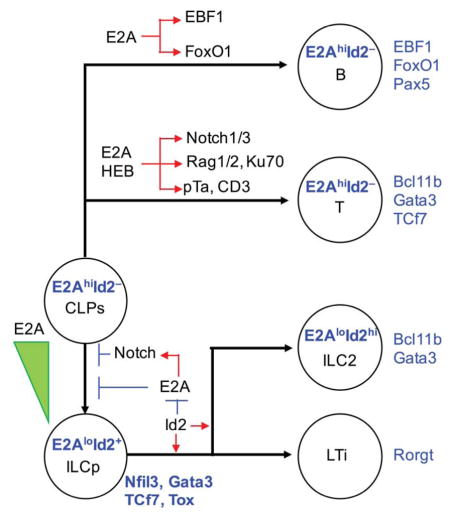
Graphical Abstract
INTRODUCTION
Immunity is maintained by cells that defend the host from invading pathogens. Two distinct types of cells, adaptive and innate lymphoid cells, have been identified that play particularly important roles in establishing and maintaining immunity. Adaptive lymphoid cells express a diverse antigen receptor repertoire that is generated by somatic recombination involving variable, diversity and joining gene segments. Innate lymphoid cells (ILCs) consist of cells that respond to infectious organisms in the absence of antigen specific receptors and produce effector cytokines to enhance inflammatory responses (Diefenbach et al., 2014; Klose and Artis, 2016). ILCs can be segregated into distinct classes based on the secretion of effector cytokines and the expression of transcription factors. Group 1 ILCs (ILC1s) include natural killer (NK) cells that are characterized by the expression of the transcription factor T-bet, which upon activation express interferon-γ (IFN-γ). Group 2 ILCs (ILC2s) express the transcription factor GATA-3 and once activated secrete T helper 2 (Th2) cytokines such as IL-4, IL-5 and IL-13. Group 3 ILCs (ILC3s) include Natural Cytotoxicity Receptor positive ILC3 (NCR+ILC3s) and Lymphoid Tissue-inducer-like (LTi-like) cells. These cells express the transcription factor ROR-γt and secrete IL-17A and IL-22 upon activation (Klose and Artis, 2016; Sawa et al., 2010).
ILCs as well as B and T cells arise from common lymphoid progenitors (CLPs) in the bone marrow (BM). The differentiation of ILCs from CLPs is characterized by the sequential expression of an ensemble of transcription factors that include Nfil3, Id2, Tox, Plzf, and Gata3 (Ishizuka et al., 2016). ILCs and T-lineage cells express a common set of transcription factors such as Gata3, Tcf7, Bcl11b, Tbx21, Eomes, Rorc, and Runx3, consistent with the similarities they display in effector cytokine expression (Serafini et al., 2015). In the bone marrow Id2, Nfil3, Gata3 and Tox are essential for the development of ILC precursors from CLPs (Hoyler et al., 2012; Klose et al., 2014; Male et al., 2014; Seehus et al., 2015; Xu et al., 2015). Tcf7 and Bcl11b also act to promote the developmental progression of ILC as well as T-lineage cells (Ikawa et al., 2010; Li et al., 2010) (Walker et al., 2015; Weber et al., 2011; Yang et al., 2015). CLPs also give rise to Early T cell Progenitor (ETP) that migrate to the thymus. Once they arrive in the thymus and upon interacting with the Notch ligand Delta-like-4 they activate the expression of Tcf7 and Bcl11b to promote the development of αβ but not γδ T cells (Hozumi et al., 2008; Miyazaki et al., 2014; Okamura et al., 1998; Wakabayashi et al., 2003; Weber et al., 2011).
Innate and adaptive lymphoid development is orchestrated by the activities of E- and Id-proteins (Bain et al., 1998). Lymphoid cells express four E-proteins including, E12, E47, HEB (Tcf12) and E2-2 (Tcf4). E12 and E47 are encoded by the E2A (Tcf3) gene locus and are generated by differential splicing (Murre, 2005). In CLPs the E2A proteins specify the B cell fate (Bain et al., 1994; Zhuang et al., 1994; Welinder et al., 2011; Lin et al., 2010). In the thymus they promote the developmental progression of T-progenitors although it remains unclear whether the E-proteins play a critical role in establishing T cell identity (Engel et al., 2001; Ikawa et al., 2006). E-protein DNA binding activity is regulated by the Id gene products, named Id1-4. Id-proteins antagonize the DNA binding activities of E-proteins (Belle and Zhuang, 2014). Id2 is particularly important for ILC, NK and LTi cell development and its level is elevated in common helper ILC precursors (CHILPs) (Moro et al., 2010; Yokota et al., 1999; Boos et al., 2007; Kloos et al., 2014; Zook and Kee, 2016). However, it remains unknown how E- and Id-proteins orchestrate ILC and ETP development.
Here we demonstrated that E2A and Id2 expression levels were inversely correlated in ILC precursors. Specifically, ILC precursors derived from CLPs display declining E2A but elevated Id2 abundance. We found that deletion of both E2A and HEB in CLPs caused a severe developmental block at the early T cell progenitor (ETP) cell stage both in fetal and adult thymi. The block at the ETP cell stage in the thymus was accompanied by aberrant development of ILCs. We found that the aberrant development of ILC2s in thymi derived from Tcf3−/−Tcf12−/− mice did not require Id2, indicating that the primary function of Id2 is to suppress the DNA binding activity of E2A and HEB. Furthermore, the transcription signatures and distal regulatory elements associated with Tcf3−/−Tcf12−/− ETPs were related to that of ILC precursors. Likewise, we found that E2A and HEB launched an accessible T-lineage specific enhancer repertoire and suppressed the regulome that was biased towards an ILC lineage signature. Collectively these data show that in the thymus, E2A and HEB establish adaptive T cell identity and suppress the development of innate lymphoid cells.
RESULTS
E2A and Id2 Abundance in Early Innate Lymphoid Precursor Cells
As a first approach to explore how Tcf3 and Id2 act in innate lymphoid cell lineage commitment, we monitored their expression patterns utilizing Id2-YFP reporter and E2A-GFP fusion protein reporter mice (Yang et al., 2011; Zhuang et al., 2004). We found that the innate lymphoid cell precursor population (Lin−Kit+IL-7R+α4β7hiCD25−CXCR6−) in the bone marrow (BM) segregated into two distinct populations with high and mid-to-low E2A abundance (Figure 1A). Likewise, the innate-lymphoid-precursor population consisted of two populations, marked by differences in Id2 mRNA expression (Figure 1A). The populations characterized by differences in E2A and Id2 expression displayed coordinate differences in IL-7R surface expression. Specifically, IL-7Rmid precursor cells expressed high abundance of E2A-GFP versus low Id2 abundance while IL-7Rhi expressing cells displayed low E2A but high Id2/YFP expression (Figure 1A right panel). We also observed low E2A versus high Id2 expression in α4β7hiCD25+ and ILC2 precursor cells (ILC2p) from bone marrow and ILC2s isolated from the lung (Figure 1A). To provide unambiguous evidence for an inverse correlation in E2A and Id2 abundance in ILC precursors, we generated Tcf3E2A−gfp/+Id2yfp/+ double reporter mice. Using these mice we confirmed the presence of two populations of E2AhiId2lo and E2AloId2hi expressors in α4β7hiCD25− cells and E2AloId2hi expressors in α4β7hiCD25+ cells (Figure 1B). Consistent with previous observations, we found that in the bone marrow, E2A-GFP abundance was high in hematopoietic stem cells (HSCs) and multipotent progenitors and were further up-regulated as these cells matured into B-cell-biased Lymphoid Progenitors (BLPs) and pro-B cells (Figure 1C and S1A–B)(Inlay et al., 2009). Higher abundance of E2A was also observed in ETPs and during the DN2 (CD44+CD25+) to DN3 (CD44−CD25+) transition (Figures 1C and S1A–B) (Miyazaki et al., 2011). In contrast, Id2-YFP levels were barely detectable in HSCs and other progenitor populations (Figures 1C and S1A–B).
Figure 1. The Developmental Progression of Innate Lymphoid Cells Defined by inversely Correlated E2A and Id2 Abundance.

(A) Flow cytometric analysis of α4β7 and CD25 expression gated on Lin−Kit+IL-7R+ derived from the bone marrow (BM) (left). GFP and YFP expression in α4β7hiCD25−CXCR6−, α4β7hiCD25+, ILC2p in the BM and ILC2 in the lung of control (red), Id2yfp/+ or Tcf3E2A-gfp/E2A-gfp mice (blue). IL-7R versus GFP or YFP expression was gated on α4β7hiCD25−CXCR6− population (right). Numbers in plots (middle) indicate mean fluorescence intensity of GFP and YFP (MFI) (representative data from two independent experiments). (B) GFP and YFP expression gated on α4β7hiCD25−CXCR6− and α4β7hiCD25+ cells. Numbers adjacent to outlined areas indicate the GFPhiYFPlo or GFPloYFPhi population (representative from two independent experiments) (C) GFP or YFP expression at various stages of development from HSC to ILC2 in the lung and to DN3 thymocytes derived from control (blank), Id2yfp/+ or Tcf3E2A-gfp/E2A-gfp mice (black), presented as MFI (representative from two independent experiments) (D) GFP and YFP expression from Zbtb16GFPcre+/−Id2yfp/+ and control mice. Expression of IL-7R in GFP−YFP−, GFP+YFPlo, and GFPhiYFPhi of α4β7hiCD25−CXCR6− cells and in α4β7hiCD25+ cells (right) (representative from two independent experiments) Definitions of cell populations were shown in Experimental procedures. See also Figure S1.
Previous studies have demonstrated that in the BM, ILC precursors transiently express the transcription factor PLZF and that PLZF-expressing precursors give rise to ILCs but not for NK or LTi-like cells (Constantinides et al., 2014). To clarify the developmental order of ILC precursors, we traced the expression of Id2 and PLZF in Zbtb16GFPcre+/−Id2yfp/+ reporter mice. We found that PLZF expression was activated prior to that of Id2 in α4β7hiCD25−CXCR6− precursors (Figure 1D, left panel). The ILC precursor population displayed high PLZF and Id2 expression (Figure 1D, left panel). However, α4β7+CD25+ cells that did not express PLZF showed high Id2/YFP abundance (Figure 1D; middle panel). Again the order of expression in cell development closely correlated with IL-7R surface expression (Figure 1D; right panel). These results suggest that the differentiation from CLPs towards the ILC lineages follows a stepwise progression of E2AhiPLZF−Id2lo, PLZF+Id2lo, E2AloPLZFhiId2hi and E2AloPLZF−Id2hi expressors and indicate that the differentiation of ILCs can be characterized as distinct developmental stages marked by inversely correlated E2A and Id2 abundance.
E2A and HEB Act in Concert to Specify T Cell Fate
Previous studies showed that E2A and HEB act at multiple developmental stages to regulate T-lineage development. However, it has remained unclear as to whether and how E2A and HEB act in early T cell progenitors since neither Tcf3−/− nor Tcf12−/− mice show a developmental arrest at the ETP cell stage (Barndt et al., 1999; Engel et al., 2001). Hence we considered the possibility that in ETPs E2A and HEB expression compensate for each other. To address this possibility, we generated Tcf3fl/flTcf12fl/flERT2Cre mice (Jones and Zhuang, 2007). We found that Tcf3fl/flERT2Cre and Tcf12fl/flERT2Cre thymi upon activation of the ERT2Cre transgene showed the presence of CD4;CD8 double positive (DP) thymocytes and displayed a normal DN compartment consistent with previous observations (Figure S2A). In contrast, thymi were virtually absent in Tcf3fl/flTcf12fl/flERT2Cre mice (data not shown). To clarify the developmental stage affected by the absence of E2A and HEB expression, Tcf3fl/flTcf12fl/flERT2Cre or ERT2Cre BM cells (CD45.2) and competitive BM cells from CD45.1 mice (1:1) were transplanted into lethally irradiated CD45.1 recipient mice followed by intraperitoneally injection of tamoxifen in order to activate gene deletion. Six weeks post tamoxifen injection hematopoietic cells were analysed (Figure S2B). Consistent with previous studies, we found that BLP, B-lineage (B220+CD19+) and myeloid (Mac1+Gr1+) cellularity was reduced in progeny derived from Tcf3fl/flTcf12fl/flERT2Cre transplanted BM cells (Figures 2A and S2C top) (Inlay et al., 2009; Semerad et al., 2009). Likewise, T-lineage development was arrested during the ETP to DN2 transition with very few CD45.2-positive cells being detected at later developmental stages (Figure 2A and S2C; bottom).
Figure 2. Thymocyte Development in Tcf3fl/flTcf12fl/flIl7rCre Mice is Severely Impaired.

(A) The ratio of %CD45.2 to that in HSC. Each dot represents the ratio of % CD45.2 (ratio in HSC defined as 1.0) from a single recipient mouse. Strategy for competitive BM transplantation and flow cytometric analysis of CD45.1 and CD45.2 expressions are shown in Figure S2B and S2C (n=3–4, two independent experiments) (B) Flow cytometric analysis of CD4 versus CD8 expression in total fetal thymocytes, and Kit versus CD25 gated on CD4−CD8−Lin− cells derived from 17.5 dpc control and Tcf3fl/flTcf12fl/flIl7rCre mice. Numbers in gates and quadrants indicate percentage of cells in each compartment. (C) Cell numbers of total thymocytes, ETPs (CD4−CD8−Lin−KithiCD25−), DN, ISP and DP cells derived from 17.5 dpc control and Tcf3fl/flTcf12fl/flIl7rCre fetal thymi (n=4, two independent experiments). (D) Cell numbers of total thymocytes and γδT cells (CD3ε+TCRγδ+) isolated from 4-week-old littermate control and Tcf3fl/flTcf12fl/flIl7rCre mice (n=9, 6 independent experiments). (E) Flow cytometric analysis of YFP expression in total thymocytes (left), CD4 and CD8 expression gated on YFP-expressing thymocytes (middle), and CD44 and CD25 expression gated on YFP+CD4−CD8−Lin− cells (right) (representative from two independent experiments). (F), (G) Sorted ETPs (CD44+CD25−Kithi) from 15.5 dpc littermate control or Tcf3fl/flTcf12fl/flIl7rCre fetus were co-cultured with Tst-4-DL1 stroma cells (300 cells/well). Representative flow cytometric analysis of CD4 and CD8 expression gated on CD45+Thy1.2+ cells after 12 days in culture is shown. Cell numbers of reconstituted cells, and ISP and DP cells, and their percentages on day 12 are indicated. Two independent experiments produced with similar results (n=8). (H) YFP-expression gated on CD4SP (CD4+CD8−TCRβhi), Mac1+Gr1hi, and Mac1+Gr1lo/− cells in thymi derived from 6–8-week-old Tcf3fl/+Tcf12fl/+Il7rCre (top) and Tcf3fl/flTcf12fl/flIl7rCre mice (bottom), as seen in Figure 2E. Numbers in plots indicate YFP-expressing cells. Data represent the mean ± SD. *, P < 0.05, **, P <0.01, ***, P <0.001, ****, P <0.0001 (Student’s t test). See also Figure S2.
To examine the roles of E2A and HEB at the CLP cell stage, we generated Tcf3fl/flTcf12fl/flIl7rCre mice (Schlenner et al., 2010). We found that Tcf3fl/flTcf12fl/flIl7rCre mice displayed a severe developmental defect at the CLP and BLP cell stage (Figures S2D and S2E). We found that 17.5 dpc Tcf3fl/flTcf12fl/flIl7rCre thymocytes were associated with a substantial decrease in total thymocyte cell numbers, increased percentages of ETPs and DN2a cells and the absence of DP as well as immature single positive (ISP) CD8 cells (Figure 2B and 2C). We observed similar defects in fetal thymi derived from 14.5 dpc Tcf3fl/flTcf12fl/flIl7rCre embryos (Figure S2F). In Tcf3fl/flTcf12fl/flROSAYFP/YFPIl7rCre fetal thymi, greater than 90% of DN1 cells, 100% of DN2 cells at 14.5 dpc and over 95% of total thymocytes at 17.5 dpc expressed YFP, indicative of active Cre recombinase (Figure S2F). Unlike in tamoxifen-treated Tcf3fl/flTcf12fl/flERT2Cre mice thymi could be isolated from adult Tcf3fl/flTcf12fl/flIl7rCre mice. However, the total number of thymocytes was substantially reduced accompanied by a drastic decline in γδT cell numbers (Figure 2D). In addition, although almost all thymocytes expressed YFP in adult control thymi, less than 10% of thymocytes derived from adult Tcf3fl/flTcf12fl/flROSAYFP/YFPIl7rCre mice expressed YFP, indicating that the majority of the thymocytes were derived from a small fraction of T-progenitor cells that escaped IL-7RCre activity (Figure 2E). We also noticed increased percentages of DN1 cells and a virtual complete absence of DN2 cells among the YFP+ population (Figure 2E). Although DN2 cells were absent, we observed DN3 cells among the YFP+ cells (Figure 2E). The discontinuity between the DN2 and DN3 stages and between the DP and CD4SP stages could be caused by the delayed activation of the Cre recombinase in cells derived from a small fraction of T progenitors, which managed to avoid IL-7RCre activity at the ETP stage. This idea is consistent with the results described above and a previous report indicating the critical roles of E2A and HEB in the development of CD4SP cells (Jones-Mason et al., 2012).
To confirm an intrinsic role of E2A and HEB, ETPs were isolated from fetal thymi and co-cultured with Notch-ligand expressing Tst-4 cells (Tst-4-DL1) (Miyazaki et al., 2005). Consistent with the in vivo analysis, we found that ETPs that lacked E2A and HEB expression lost the potential to differentiate into T lineage cells in vitro (Figure 2F and 2G). We next analysed proportions of YFP-expressing cells among T, B and myeloid compartments derived from the BM and the thymus. The percentages of YFP-expressing cells among B and T cells were substantially reduced in the Tcf3fl/flTcf12fl/flIl7rCre mice, whereas nearly all B and T cells expressed YFP in control mice (Figure 2H and S2G). On the other hand, the percentages of the YFP-expressing cells in the myeloid population in Tcf3fl/flTcf12fl/flROSAYFP/YFPIl7rCre mice were comparable to those observed in control mice arguing against lineage conversion (Figure 2H and S2G). Taken together, these data indicate that E2A and HEB act in concert in the ETP compartment to establish T cell fate.
E2A and HEB Suppress Aberrant Development of Thymic ILC2s and LTi-like Cells
Previous studies have revealed a critical role for Id2 in ILC development (Boos et al., 2007; Moro et al., 2010; Yokota et al., 1999). As Id2 acts to antagonize E-protein DNA binding activity, we hypothesized that in the thymus, the absence of E2A and HEB expression might lead to aberrant development of ILCs. ILCs were rarely detected in 4-week-old thymi derived from littermate wild-type control mice (Figure 3A; top panel). However, in thymi isolated from 4-week-old Tcf3fl/flTcf12fl/flIl7rCre mice we observed substantially increased percentages and absolute numbers of ILC2s that expressed YFP (Figures 3A bottom and 3C). In thymi derived from 4-week-old Tcf3fl/flTcf12fl/flIl7rCre mice we also observed substantial increases in the percentages and numbers of LTi-like cells (Figures 3B and 3C). However, NK, ILC1 and ILC3 numbers were not elevated in thymi isolated from 4-week-old Tcf3fl/flTcf12fl/flIl7rCre mice (Figure S3A and data not shown). Whereas thymi derived from control mice lacked detectable numbers of ILC precursors, we readily detected ILC precursors in thymi derived from Tcf3fl/flTcf12fl/flIl7rCre mice (Figures 3D and 3E). Likewise fetal ETPs derived from Tcf3fl/flTcf12fl/flIl7rCre thymi but not wild-type ETPs, when cultured Tst-4-DL1 cells (Figure 2F), gave rise to ILC2 and ILC1-like and ILC3-like cells even when cultured in the presence of Notch ligand abundance (Figures 3F and 3G) (Constantinides et al., 2014; Seehus et al., 2015). Taken together, these data indicate that in the thymus E2A and HEB act in concert to suppress aberrant development of ILC2 and LTi-like cells.
Figure 3. E2A and HEB Suppress the Development of Thymic ILC precursor, ILC2 and LTi-like Cells.

(A) Gating strategy for thymic ILC2 cells in 4-week-old littermate control and Tcf3fl/flTcf12fl/flIl7rCre mice, and YFP expression gated on ILC2s. Numbers in plots indicate percentages of cells in outlined areas. Proportions of ILC2s of CD45+ cells are shown in plot (left). (B) Gating strategy for thymic LTi-like cells in 4-week-old Tcf3fl/flTcf12fl/flIl7rCre mice. For LTi-like cell staining, we excluded CD4 as a lineage marker. (C) Frequency and cell numbers of ILC2 and LTi-like cells in thymi derived from 4-week-old littermate control and Tcf3fl/flTcf12fl/flIl7rCre mice (n=6, cumulative from 5 independent experiments). (D) Flow cytometric analysis of ILC precursor cells. Proportions of ILC precursor gated on CD45+ cells are shown in plot. (E) Frequency and cell number of ILC precursors in thymi derived from 4-week-old littermate control and Tcf3fl/flTcf12fl/flIl7rCre mice. (n=3–4, cumulative from 3 independent experiments). (F), (G) In vitro co-culture of ETPs derived from fetal thymi on Tst-4-DL1 stromal cells, as seen in Figure 2F and 2G. Flow cytometric analysis of ICOS and CD25 expression (left), and NK1.1 and Thy1.2 expression (right). Two independent experiments produced similar results. Frequency and cell number of ILC2 and ILC1/3 in reconstituted cells in vitro (n=8 per independent experiments). Data represent the mean ± SD. *, P < 0.05, **, P <0.01, ***, P <0.001 (Student’s t test).
E2A and HEB Suppress the Expansion of ILC2s in the Bone Marrow and Peripheral Lymphoid Organs
To determine whether the loss of E2A and HEB expression also affects the ILC2 population in other lymphoid organs, BM, spleen and lymph nodes (LNs) were analysed. We found a substantial increase in the numbers and percentages of ILC2s in the BM, spleen, and LNs derived from Tcf3fl/flTcf12fl/flIl7rCre mice (Figures 4A and S3B). In contrast, the number and fraction of LTi-like cells, ILC precursors, ILC1, ILC3s, and NK cells remained essential the same in the BM, spleen and LNs (Figure S3C and S3D, and data not shown).
Figure 4. Lymphoid Organs and Tissues Derived from Tcf3fl/flTcf12fl/flIl7rCre Mice show Increased ILC2 Cellularity.

(A) Cell numbers of ILC2s in the BM, lymph nodes (LNs), and spleen derived from 4-week-old littermate control and Tcf3fl/flTcf12fl/flIl7rCre mice (n=5, cumulative from 4 independent experiments). (B) Flow cytometric analysis of Gata3 expression in ILC2s in thymi, BM, LNs and spleens. Red indicates isotype control whereas blue refers to Gata3 expression (representative from two independent experiments). (C) Frequency and ILC2 numbers in lungs derived from 4-week-old littermate control and Tcf3fl/flTcf12fl/flIl7rCre mice are indicated (n=4, cumulative from two independent experiments). (D) Flow cytometric analysis of BrdU incorporation (left) gated on thymic ILC2s derived from 4-week-old Tcf3fl/flTcf12fl/flIl7rCre mice. Mice were injected intraperitoneally with 1mg of BrdU (blue) or PBS (red) twice (24 h and 2 h prior to harvesting). Flow cytometric analysis of Ki67 expression (right) gated on thymic ILC2s derived from 4-week-old Tcf3fl/flTcf12fl/flIl7rCre mice. IgG control (red), Ki67 (blue) (representative from two independent experiments). (E) Representative flow cytometric analysis of ST2 and ICOS expression gated on Lin−Thy1.2+CD25+IL-7R+Sca1+ thymocytes derived from adult E47−/−, Tcf12fl/flIl7rCre, and control mice. Numbers in plots indicate percentages ILC2s and cell numbers of ILC2s in thymi. (F) Total thymocyte number, frequency and cell numbers of ILC2s in the thymi derived from 4-week-old E47−/− and control mice are shown (n=4, from three independent experiments). (G) Frequencies and cell numbers of ILC precursors in thymi isolated from 4-week-old E47−/− and control mice are shown (n=3, from two independent experiments). (H) Gating strategy for thymic ILC2 cells in Rag2−/−, Tcf3fl/flTcf12fl/flIl7rCreRag2−/−, and Tcf3fl/flTcf12fl/flIl7rCre Rag2+/− mice. (I) Cell numbers of ILC2s, LTi-like cells, and ILC precursors in the thymi derived from Rag2−/− and Tcf3fl/flTcf12fl/flIl7rCreRag2−/− mice (n=3–5, from three independent experiments). Data represent the mean ± SD. *, P < 0.05, **, P <0.01, ***, P <0.001, ****, P <0.0001 (Student’s t test). See also Figure S3.
To further characterize these cells, the ILC2 population was examined for the expression of Gata3, a transcription factor closely associated with ILC2 function, and cytokine production. Indeed, ILC2s isolated from the thymi, BM, spleen and LNs from Tcf3fl/flTcf12fl/flIl7rCre mice showed high expression of Gata3 and produced IL-4, IL-5 and IL-13 (Figure 4B, S3E and S3F). Likewise, we found significant increased numbers of ILC2s in the lungs isolated from Tcf3fl/flTcf12fl/flIl7rCre mice (Figure 4C). To determine whether the increase in the ILC2 population was caused by cellular expansion, Tcf3fl/flTcf12fl/flIl7rCre mice were injected with bromodeoxyuridine (BrdU) and analysed using flow cytometry. We found that ILC2s from thymi isolated from Tcf3fl/flTcf12fl/flIl7rCre mice displayed significant BrdU incorporation and were associated with high Ki67 expression, a cellular marker for proliferation, suggesting that their expansion occurred in the thymus and was not caused by circulating cells migrating from other lymphoid organs (Figure 4D and S3F).
To determine whether the absence of E2A or HEB alone affects ILC2 development we examined E47−/− and Tcf12fl/flIl7rCre mice for the presence of ILCs. We found that ILC2s were not detectable in thymi derived from Tcf12fl/flIl7rCre mice. In contrast, thymi derived from 4-week-old E47−/− mice displayed increased numbers of ILC2s and LTi-like cells (Figures 4E, 4F and S3G). ILC2s were also readily detectable in the LNs and the spleen, but not in the bone marrow isolated from E47−/− mice (Figures S3H). Likewise, we found increased percentages of ILC precursors in thymi derived from 4-week-old E47−/− mice (Figure 4G).
To determine whether the ILC2s in the thymi were derived from T-progenitor cells beyond commitment into the T-lineage, we examined ILC2s isolated from Tcf3fl/flTcf12fl/flIl7rCre thymi for Dβ2-Jβ2 and Vβ5.1-DJβ2 rearrangements. We found that wild-type ILC2s, B cells and Tcf3−/−Tcf12−/− ILC2s lacked detectable amounts of Dβ2-Jβ2 and Vβ5.1-DJβ2 rearrangements (Fig. S3I). These data indicate that ILC2s that developed in Tcf3fl/flTcf12fl/flIl7rCre thymi were derived from uncommitted lymphoid progenitor cells rather than being converted from committed T-lineage cells.
Given that the absence of E2A and HEB leads to severe defects in B and T cell development, we considered the possibility that the expansion of ILC2s in thymi derived from Tcf3fl/flTcf12fl/flIl7rCre mice was caused by a lymphopenic environment. To exclude this possibility, Tcf3fl/flTcf12fl/flIl7rCre mice were crossed with Rag2-deficient mice and analysed. We found that ILC2, LTi-like and PLZF-expressing ILC precursors developed in Tcf3fl/flTcf12fl/flRag2−/−Il7rCre mice at comparable levels as observed in Tcf3fl/flTcf12fl/flIl7rCre mice but not in Rag2−/− mice (Figures 3, 4H, 4I, and S3J). Collectively these data demonstrate that in lymphoid progenitors E47 acts intrinsically to dictate adaptive versus innate lymphoid cell fate with HEB acting as a compensatory factor for E47 activity.
Forced Id2 Expression Promotes Differentiation and Expansion of Thymic ILC2s
The data described above indicates that E2A and Id2 expression in developing ILCs is inversely correlated and that the absence of E2A and HEB leads to the abnormal ILC differentiation in the thymus. To further examine how E2A and Id2 expression relate to the developmental progression of innate and adaptive immune cells we generated an Id2-inducible mouse (Id2/+TA/+), in which Id2 expression can be induced at any time in the embryo or adult mice upon treatment with doxycycline (Dox) (Figure 5A) (Beard et al., 2006). Early B cell development in the BM was severely affected after 14 days of Dox treatment (Figure 5B). Induced Id2 expression also affected adult thymocyte development, revealing higher percentages of CD8SP cells and lower proportions of DP cells with Dox treatment (Figure 5B). Thymocyte cell numbers in adult mice were significantly lower and higher percentages of the DN cells were observed upon induction of Id2 expression by Dox treatment (Figure 5B). Likewise, high expression of Id2 in fetal thymocytes resulted in an arrest at the DN1 cell stage, accompanied by a complete absence of the DP compartment (Figure 5C). ILC development was also affected upon the induction of Id2 expression. We found a substantial increase in the number of ILC2s in the thymus and spleen, but not in the BM and LNs isolated from Dox-treated Id2-inducible mice (Figures 5D, 5E and S4A).
Figure 5. Inducible Id2-expression Blocks Adaptive Lymphoid Lineage Development but Activates Abnormal ILC2 Development.

(A) Schematic construction of Trans Activator (TA) in Rosa 26 locus and inducible Id2 in Col1a1 gene locus (left). 4-week-old Id2-inducible (Id2/+TA/+) and littermate control (TA/+, or Id2/+) mice were treated by feeding doxycycline-containing water and by intraperitoneal doxycyclin-injection (day0, 5, 10). Mice were analyzed 14 days post injection (right). (B) Flow cytometric analyses of CD19 and B220 expression (left), IgM and IgD expression (middle left) gated on CD19+B220+ B cell in the BM, and CD4 and CD8 expression in thymi (middle right), derived from Id2-inducible (Id2-ind) and littermate control (Ctrl) mice. Thymocyte numbers are shown (right). Data are representative from three independent experiments (n=3, one experiment). (C) Representative flow cytometric analysis of CD4 and CD8 expression (left), and CD44 and CD25 expression gated on lineage-negative thymocytes, derived from 17.5 dpc control and Id2-ind fetus, treated with doxycyclin for 4 days (representative from three fetal thymi). (D) Gating strategy for thymic ILC2s. Numbers in plot indicate percentages of ILC2s in the CD45+ thymocyte population. (E) Frequencies and cell numbers of ILC2s in thymi isolated from doxycyclin-treated Id2-inducible and control mice (n=3–4, one experiment). (F) Flow cytometric analyses of Thy1.2 and ST2 expression, CD25 and ICOS expression, Thy1.2 and CCR6 expression, and Rorγt and IL-7R expression, derived from 4-week-old control, Tcf3fl/flTcf12fl/flIl7rCre, and Tcf3fl/flTcf12fl/flId2fl/flIl7rCre mice. Percentages of ILC2s and LTi-like cells in the CD45+ population are shown. (G) Cell numbers of ILC2, LTi-like cells, and α4β7hiPLZF+ cells in thymi derived from 4-week-old littermate control and Tcf3fl/flTcf12fl/flId2fl/flIl7rCre mice are shown (n=3, cumulative from three independent experiments). Data represent the mean ± SD. *, P < 0.05, ***, P <0.001 (Student’s t test). See also Figure S4.
Finally, to determine whether either Id2 by itself or lower activities of E-protein DNA binding regulates the development of the ILCs we generated Id2fl/flTcf3fl/flTcf12fl/flIl7rCre mice. We noted that Id2 gene deletion must have been efficient at the early stages of CLPs given that Id2fl/fIl7rCre mice failed to generate lymph nodes (data not shown). We found equivalent numbers of ILC2s, LTi-like cells and ILC precursor cells in thymi derived from Id2fl/flTcf3fl/flTcf12fl/flIl7rCre mice when compared to Tcf3fl/flTcf12fl/flIl7rCre mice (Figures 5F, 5G, S4B and S4C). Taken together, these data indicate that the magnitude of E-protein DNA binding activity determines the innate versus adaptive lineage choice whereas Id2 merely acts to antagonize the DNA binding activity of E2A-HEB heterodimers in order to suppress the development of adaptive immune cells.
E-proteins Activate a T-lineage Specific Program and Suppress an Innate Lymphoid-like Transcription Signature
To identify the mechanisms that underpin the role of E-proteins in orchestrating T-lineage development and suppressing thymic ILC differentiation, the transcription signatures in ETPs were identified using RNA-Seq. Briefly, we isolated ETPs from control and Tcf3fl/flTcf12fl/flIl7rCre fetal thymi, that lacked ILCs and were not exposed to systemic lymphopenic conditions. We found that over 1,800 genes were differentially expressed (greater than twofold, P < 0.05; 1024 up-regulated; 826 down-regulated) in fetal Tcf3−/−Tcf12−/− ETPs (Figures 6A and S5A). Prominent among the downregulated genes in the Tcf3−/−Tcf12−/− ETPs were Notch1/3, Rag1/2, CD3e, Xrcc6 (Ku70) and Ptcra (Figures 6A, 6B, S5A and S5B). Conspicuous among the genes whose transcript levels were elevated in Tcf3−/−Tcf12−/− ETPs were Id2, Gata3, Tox, Tox2, Plzf, Cxcr6 as well as Egr1, 2 and 3 (Figure 6A, 6B, S5A and S5B). These data indicate that Tcf3−/−Tcf12−/− ETPs express a subset of genes closely associated with the developmental progression of ILCs whereas transcript levels associated with genes that specify T cell fate were decreased.
Figure 6. Combined Activities of E2A and HEB Activate a T-lineage Specific Program of Gene Expression in Early T cell Progenitors.

(A) Volcano plots representing RNA-seq reads in sorted ETPs (CD4−CD8−Lin−CD44+CD25−Kit+YFP+) derived from Tcf3fl/flTcf12fl/flIl7rCre fetal thymi. Points represent genes upregulated in Tcf3fl/flTcf12fl/flIl7rCre ETPs > twofold (red; FDR < 0.05 (calculated using raw count values)), genes downregulated in Tcf3fl/flTcf12fl/flIl7rCre ETPs > twofold (blue; P < 0.05) and not significantly changed (grey) as compared to control cells. Selected genes are labelled. (n=3) (B) Expression levels associated with the Notch1, Rag1/Rag2, Ptcra, Cd3d/Cd3e, Tox, Tcf7, and Bcl11b loci, presented as RNA-seq Reads Per Million reads aligned (RPM). (C) Gene Ontology (GO) analysis of significantly elevated gene expression levels in ETPs derived from Tcf3fl/flTcf12fl/flIl7rCre mice using Metascape. Top 15 clusters of GO terms are shown. (D) Heat maps of selected genes are presented to visualize differences in gene expression patterns for control and Tcf3/Tcf12-deficient ETPs isolated from fetal thymi. The heat maps represent different ontology groups, including genes encoding for factors that regulate transcription (left), cytokine/chemokine/surface receptors, signal transduction (middle) as well as cytokines (right). See also Figure S5 and S6.
Gene Ontology (GO) analysis of the up-regulated genes using Metascape (www.metascape.org) further revealed that Tcf3−/−Tcf12−/− ETPs tend to differentiate towards immune effector cells since their expression patterns were closely associated with cell activation, cytokine production, inflammatory response and immune effector function (Figure 6C). On the other hand, GO analysis of transcripts whose abundance declined in Tcf3−/−Tcf12−/− ETPs revealed biological pathways linked with immune system development, hematopoiesis and lymphocyte differentiation (Figure S5C).
It is well established that ILCs and T-lineage cells share a common set of transcription factors. Indeed, Tcf7, Bcl11b, Gata3, and Runx3, essential for both ILC and T-lineage cell differentiation, were abundantly expressed in both control and Tcf3−/−Tcf12−/− ETPs but showed higher levels of expression in Tcf3−/−Tcf12−/− ETPs (Figure 6B and 6D left). Tcf3−/−Tcf12−/− ETPs also displayed high levels of transcription factors linked with ILC differentiation including Id2, Tox, Stat1, Ets1, Rora, and Plzf (Figure 6B and 6D). Expression levels of Rorc, Eomes, and T-bet were low and equivalent in Tcf3−/−Tcf12−/− ETPs when compared to control ETPs (Figure 6D). Notably, however, the expression of Nfil3 was barely detectable in Tcf3−/−Tcf12−/− ETPs (Figure 6D). These data suggest that while Tcf3−/−Tcf12−/− ETPs are programmed to differentiate towards the ILC lineage they remain uncommitted.
The expression of genes encoding for chemokine/cytokine receptors and signaling components was also modulated in Tcf3−/−Tcf12−/− ETPs. Specifically, we detected high levels of Il2rg, Il2rb, Icos, Cxcr6, Itgb7, Ccr8 and Socs1 expression in Tcf3−/−Tcf12−/− ETPs (Figure 6D; middle panel). Tcf3−/−Tcf12−/− ETPs also highly expressed genes closely associated with ILC maturation, including IL17rb, Pdcd1, Icos, Ccr8, Sh2d1a, Il18r1, Nt5e, Il17ra, Scos1, Zap70 and Lck but showed low or undetectable Il1rl1 (Il33r), Klrg1 Ifng, Il5, Il13, and Il17 transcript abundance (Figure 6D; right panel). Finally, we found that while Notch1 was regulated by the combined activities of E2A and HEB, Notch3 transcript levels were reduced upon depletion of E47 alone (Figure S5D). Since Notch signaling is essential to orchestrate T cell fate, we examined whether forced Notch signalling restored the lack of T cell potential of Tcf3−/−Tcf12−/− ETPs. We found that in the absence of both E2A and HEB expression forced expression of intracellular domain of Notch1 (Notch1-ICN) in vitro was insufficient to fully restore the development of T-lineage cells (Figure S5E).
To directly compare the gene expression profiles of ETPs to publically available gene expression data (Immgen Consortium), we generated a heatmap of gene expression profiles for wild-type and Tcf3−/−Tcf12−/− ETPs as well as transcription signatures derived from an ensemble of different immune cell types. We found that the transcription signatures derived from Tcf3−/−Tcf12−/− ETPs resembled ILC, LTi and NK cells whereas wild-type ETPs were more closely related to CLPs, DN, ETPs, pre-pro-B and pro-B cells (Figure S6). Taken together, these observations indicate that in ETPs E2A and HEB act in concert to promote a T-lineage specific program of gene expression and simultaneously suppress the expression of genes associated with alternative innate cell lineages.
The E2A-HEB Module Activates a T-Lineage Specific Enhancer Repertoire
To further define the roles of E2A and HEB upon T-lineage commitment, sorted ETPs were analyzed using ATAC-seq (assay for transposase-accessible chromatin) and compared to recently published ATAC-seq reads derived from murine immune subsets (GEO: GSE77695) (Shih et al., 2016). Using principal component analyses we found that the regulomes associated with wild-type ETPs resembled those of HSCs, MPPs and CLPs (Figure 7A). On the other hand, Tcf3−/−Tcf12−/− ETPs displayed an intermediate regulome resembling HSC-progenitors and mature effector cells including ILCs (Figure 7A).
Figure 7. E2A and HEB Depleted Early T Cell Progenitors display Altered Chromatin Landscapes.

(A) Principal component analysis (PCA) was performed to cluster accessible chromatin (log2-transformed ATAC-seq signals) in different immune cell types as indicated. (B) Heatmap showing correlation of ATAC-seq reads in distal peaks (top) and promoter peaks (bottom) for indicated cell types including wild-type ETPs (EHCont) and Tcf3−/−Tcf12−/− ETPs (EHdKO). (C) Heatmap showing enrichment of 331 normalized transcription factor binding motifs (log2-transformed) in open chromatin regions for different immune cell types that exclude promoter regions (±2.5kbp of TSS). (D) Heatmap showing relative enrichment of transcription factor binding motifs for indicated cell types. (E) Browser shots of normalized ATAC, E2A ChIP-seq and RNA-seq reads across the Notch1 and Rag gene loci in control ETPs as well as ETPs depleted for E2A and HEB expression. ChIP-seq: E2A, DN3; Rag2−/− thymocytes, A12; E2A−/− E47-reconstituted T cell line. See also Figure S7.
To identify similarities of regulomes linked with wild-type and Tcf3−/−Tcf12−/− ETPs versus immune cells, we examined the accessible distal regulatory repertoire (enhancers) using hierarchical clustering of Pearson correlation values associated with accessible chromatin regions as well as normalized transcription factor motif frequencies (Figures 7B and 7C). Again we found that the regulomes derived from wild-type ETPs were closely related to HSCs, MPPs and CLPs whereas distally located regulomes associated with Tcf3−/−Tcf12−/− ETPs were most closely related to wild-type ILC2 precursors in the BM (ILC2p) (Figures 7B and 7C). The transcription factor motif analysis revealed that distal regulatory elements associated with Tcf3−/−Tcf12−/− ETPs and ILC2p were depleted of RBPj, ETS:E-box, PU.1 and Spi1B but enriched for CTCF, LXRE, YY1 and GATA3 binding sites when compared to wild-type ETPs and CLPs (Figure 7D).
We next examined how the loss of E-protein activity affects the regulomes of genes associated with specifying T cell fate. We found that putative enhancer elements in Notch1, Notch3, Rag1/Rag2 and Xrcc6 loci associated with E2A occupancy in T-progenitor cells, displayed a substantial decline in ATAC-Seq reads in Tcf3−/−Tcf12−/− ETP (Figures 7E and S7A)(Miyazaki et al., 2011). On the other hand, the accessibility of promoter regions associated with these genes were not largely affected by the absence of E2A and HEB expression (Figures 7E and S7A). Finally, the regulomes associated with loci whose transcription was activated in Tcf3−/−Tcf12−/− ETPs, including Id2 and Stat1, displayed decreased accessibility in distally located enhancers but not promoter regions (Figure S7A). We also observed comparable levels of accessibilities in the TCRβ constant region as well as the TCRβ enhancer in Tcf3−/−Tcf12−/− ETPs, suggesting that E-protein deficient ETPs have retained the character of T-lineage cells and contains a mixed lineage enhancer repertoire (Figure S7B). Taken together, these data suggest that in ETPs, E2A and HEB launch an accessible enhancer repertoire associated with a T-lineage specific program of gene expression and suppress a subset of enhancers associated with an ILC specific transcription signature.
DISCUSSION
Previous studies have hinted at the possibility that E-proteins establish T cell identity but compelling evidence was lacking. Here we demonstrate that E2A and HEB act in concert to specify T cell fate. Specifically, we found that in ETPs HEB compensates for the roles in the absence of E2A expression. These findings raise the question as to how E-proteins establish T cell identity. We found that the expression of transcription factors that are essential for promoting T cell fate, including Bcl11b and Tcf7 were not affected by the absence of E-protein activity. However, Notch1 and Notch3 transcript abundance was severely decreased in the absence of E2A and HEB expression consistent with previous observations (Ikawa et al., 2006; Perreira de Sousa et al., 2012). While Rbpj expression was not affected in E-protein deficient ETPs, the enhancer repertoire was depleted for RBPj binding sites consistent with the absence of Notch1 and Notch3 expression (Chea et al., 2016). These observations directly link E2A and HEB expression and the Notch signaling cascade into a common pathway to initiate T cell fate. Future studies using mice mutated in those enhancer regions will address the necessity of the regulation of enhancer activities by E-proteins in Notch1 and other T cell specifying genes.
The activities of E-proteins in ETPs appeared not to be restricted to Notch signaling. In addition to Notch receptors, E2A and HEB activate the expression of Rag1/Rag2 and Ku70 to promote the assembly of the TCRβ loci and to activate the expression of signaling components for pre-TCR mediated signaling, including Cd3d, Cd3e and Ptcra (pTα) (Agata et al., 2007). These findings are supported by the substantial decline not only in αβ T but also in γδ T cells in Tcf3fl/flTcf12fl/flIl7rCre thymi and are consistent with the notion that the E-Id protein axis is a nodal point in adaptive lymphoid cell development. Consistent with this idea, the forced Notch signaling are not able to restore the T cell development in vitro using Tcf3−/−Tcf12−/−ETPs.
In addition to specifying T cell fate by modulating Notch signaling and orchestrating the assembly of the TCRβ locus, E2A and HEB are required to suppress the development of ILC2 and LTi-like cell in the thymi. How do these cells arise in thymi derived from Tcf3−/−Tcf12−/− mice? It was previously reported that thymic α4β7hiLin−IL-7R+ progenitors are capable of giving rise to LTi-like cells in the absence of Notch signaling (Cherrier et al., 2012). Since we found increased numbers of α4β7hiLin−IL-7R+ progenitors in Tcf3−/−Tcf12−/− thymi and downregulation of Notch1/3 in Tcf3−/−Tcf12−/− ETPs, we suggest that LTi-like cells develop because of the absence of Notch signaling. In addition, previous studies indicated that Notch-RBPj signaling at the early stage of lymphoid progenitors drives T cell development and abrogates ILC development (Chea et al., 2016). Furthermore, Tcf3−/−Tcf12−/− ETPs express abundant levels of transcription factors that are predominantly expressed in ILC progenitors and ILCs as well as factors that are expressed in both ILCs and T-lineage cells. Tcf3−/−Tcf12−/− ETPs are also similar to ILCs as it relates to the chromatin landscape. ILCs and T-lineage cells generally are considered to be close relatives since they share a spectrum of transcription factors and effector molecules. More recently, however, substantial differences were revealed between the chromatin landscapes of ILCs and T-lineage cells at enhancer repertoires but not promoter regions (Koues et al., 2016; Shih et al., 2016). Likewise, we found that wild-type and Tcf3−/−Tcf12−/− ETPs differ from each other at enhancer but not promoter regions while Tcf3−/−Tcf12−/− ETPs and ILC progenitors share a significant portion of their enhancer repertoires. Taken together, we propose that E-protein activity and Notch signalling act in a common pathway to suppress aberrant thymic ILC development by modulating an ILC lineage specific enhancer repertoire.
Previous studies have indicated that the E-proteins are essential to orchestrate the development of BLPs (Inlay et al., 2009; Welinder et al., 2011). Likewise, we found that in the BM the absence of E2A and HEB or interfering with E-protein DNA binding leads to severe defects in BLPs in vivo. In contrast, ILC development appeared to be unaffected by the absence of E2A and HEB expression in the BM. While E2A and HEB expression is not required for establishing ILC identity, previous studies have demonstrated that Id2 expression is critical to commit progenitor cells to the ILC fate (Boos et al., 2007; Klose et al., 2013). How does Id2 function to control ILC development? We find that lymphoid progenitors that lack Id2 but also are depleted for E2A and HEB expression still develop into ILCs. Thus, the key function for Id2 in committing progenitors to the ILC cell lineage is to antagonize E2A/HEB DNA binding activity. Given that in ILC precursor the downregulation of E2A expression precedes Id2 expression, we suggest that Id2 acts to enforce the ILC lineage by antagonizing E-protein activities beyond the commitment checkpoint.
Our observations indicate that the E-protein module is not only critical to establish the B cell identity but also specifies T cell fate. A clear distinction between innate and adaptive immunity involves the generation of a diverse antigen receptor repertoire. Here we demonstrate that, by induction of the Notch signaling pathway, the E-protein module primes lymphoid progenitors to the T cell fate but also at the ETP cell stage acts to establish a regulome closely associated with the generation of antigen receptor diversity. This includes modulation of the chromatin landscape associated with the Rag genes as well as regulatory regions associated with TCRβ locus. In sum, the findings described here demonstrate that the E-Id protein module acts to specify both the adaptive and innate lymphoid branches of immune cell development.
CONTACT FOR REAGENT AND RESOURCE SHARING
Further information and requests for resources and reagents should be directed to and will be fulfilled by the Lead Contact, Masaki Miyazaki (mmiyazaki@infront.kyoto-u.ac.jp).
EXPERIMENTAL MODEL AND SUBJECT DETAILS
Mice
Id2/+TA/+ mice were generated in Embryonic Stem Cell Core in University of California, San Diego and backcrossed with C57BL/6J mice more than 10 times. C57BL/6J, Tcf3fl/fl, Tcf12fl/fl, Id2/+TA/+, Id2yfp/+, Tcf3E2A-gfp/E2A-gfp, Zbtb16GFPcre+/−, E47−/−, ERT2Cre, Il7rCre, and ROSAYFP/YFP mice were bred and housed in specific pathogen-free conditions in accordance with the Institutional Animal Care and Use Guidelines of Kyoto University and the University of California, San Diego. Tcf3fl/fl and Tcf12fl/fl (Jones and Zhuang, 2007), Tcf3E2A-gfp/E2A-gfp and Id2yfp/+ (Yang et al., 2011; Zhuang et al., 2004), Id2fl/fl (Niola et al., 2012), and Il7rCre (Schlenner et al., 2010) mice were previously described. Zbtb16GFPcre+/−, ERT2Cre, and ROSAYFP/YFP mice were obtained from the Jackson Laboratory. All mice were C57BL/6 background. Since there was no difference in T cell development and ILs in the thymus between male and female Tcf3fl/flTcf12fl/flIl7rCre mice, we have not recorded the gender of all mice that were used. The age of mice; Figure 1: 6–8-week-old, Figure 2B and 2C; 17.5 dpc, 2D; 4-week-old, 2E and 2H; 6–8-week-old, 2F, 2G, 3F and 3G; 15.5 dpc. Figure 3A–3E; 4-week-old. Figure 4A, 4C, 4D, 4F–4I; 4-week-old, 4B; 8-week-old, 4E; 6–8-week-old. Figure 5B, 5D and 5E; 6-week-old, 5C; 17.5 dpc, 5F and 5G; 4-week-old.
Cell culture
Tst-4-DL1 stroma cells were cultured in 5% FBS complete RPMI medium: RPMI 1640 medium (Invitrogen Life Technologies) supplemented with 5% fetal bovine serum, 2mg/ml sodium bicarbonate (Invitrogen Life Technologies), 1 mM sodium pyruvate (Invitrogen Life Technologies), 0.1mM nonessential amino acid solution (Invitrogen Life Technologies), 5×10⁻⁵M 2-Mercaptoethanol (Nacalai Tesque), 100μg/ml streptomycine (Nacalai Tesque) and 100U/ml penicillin (Nacalai Tesque).
METHODS DETAILS
Flow cytometry
Single cell suspensions from the bone marrow, thymus, lymph nodes and spleen were stained with the following; FITC-, PE-, APC-, APC-Cy7, Pacific Blue-, BV421, BV450, Alexa Fluor 700-, Alexa Fluor 780-, PerCP-Cy5.5-, PE-Cy7-, HV500, or biotin-labeled monoclonal antibodies were purchased from BD PharMingen including CD3e (2c11), CD4 (RM4-5), CD8 (53.6.7), CD11b (M1/70), CD19 (ID3), CD25 (PC61), CD44 (IM7), CD45 (30-F11), CD45.1 (A20), CD45.2 (104), CD90.2 (53.2.1), CD117 (2B8), LPAM1 (DATK32), CD335 NKp46 (29A1.4), Sca1 (D7), IL-4 (11B11), IL-5 (TRFK5). CD4 (GK1.5), CD11c (M418), CD19 (ID3), CD49b (DX5), CD62L (MEL-14), CD117(ACK2), CD122 (TM-B1), Gr1 (RB6-8C5), IgM (11/41), Sca1 (D7), Ter119 (Ter119), ST2 (RMST2-2), Flt3 (A2F10), Rorγt (AFKJS-9), IL-13 (eBio13A), Gata3 (TWAJ) were purchased from eBioscience. CD4 (RM4-5), CD8 (53-6.7), CD25 (PC61), CD45R/B220 (RA3-6B2), CD90.2 (53.2.1), CD135 (A2F10.1), CD150 (TC15-12F12.2), ICOS (7E.17G9), IgD (11-26C.2d), Ly6D (49H4.3), NK1.1 (PK136), TCRβ (H57), TCRγδ (GL3), CD117 (2B8), CCR6 (29-2L17), were obtained from BioLegend. CD3 (145-2C11), CD19 (ID3), B220 (RA3-6B2), CD11b (M1/70), Gr1 (RB6-8C5), Ter119 (TER119), CD11c (N418), CD45.2 (104), CD127 (A7R34) were obtained from TONBO. PLZF (clone D9) was obtained from Santa Cruz Biotechnology. mCXCR6 (221002) was obtained from R&D. Biotinylated antibodies were labeled with streptavidin-conjugated BV650 (BD). Clone 2.4 G2 anti-CD32:CD16 (eBioscience) was used to block FcRs. Dead cells were removed from analysis and sorting by staining with propidium iodide (PI) (Sigma-Aldrich). Isolation of lung single cells was performed using a Lung Dissociation Kit (Miltenyi Biotec). BrdU incorporation was performed using a BD BrdU flow kit (BD Biosciences). Foxp3/Transcription Factor Staining Buffer Kit (TONBO) was used for intracellular staining of PLZF, Rorγt and Gata3. Samples were collected or sorted on a FACSAria, LSRII or FACSCanto (BD Biosciences) and were analyzed with FlowJo software (Tree Star). For intracellular staining of IL-4, IL-5, and IL-13, sorted ILC2s were cultured in the presence of phorbol 12-myristate 13-acetate (PMA) plus ionomycin (16 h) and Golgi stop (6 h) in medium containing IL-7 (10ng/ml). Intracellular staining was performed with Intracellular Fixation & Permeabilization Buffer Set (eBioscience).
Gating strategy for cell populations
HSC (Lin−Kit+Sca1+Flt3−CD150+), LMPP (Lin−Kit+Sca1+Flt3hiIL-7R−), CLP (Lin−Flt3+IL-7R+Kitmid/loSca1mid/lo), BLP (Lin−Flt3+IL-7R+Kitmid/loSca1mid/loLy6D+), pro-B (B220+CD19+IgM−IgD−CD25−Kit+), pre-B (B220+CD19+IgM−IgD−CD25+Kit−), ILC2p (Lin−IL-7R+Thy1.2+ST2+Sca1+ICOS+CD25+) in BM and ETP (Lin−CD44+CD25−Kit+) cells in the thymus, and ILC2 in the thymus, BM, LNs, spleen, and the lung (CD45+Lin−Thy1.2+ST2+IL-7R+Sca1+CD25+ICOS+). LTi-like cells in the thymus (CD45+Lin−Thy1.2+CCR6+Kit+IL-7R+Rorγt+). ILC precursor in the thymus (CD45+Lin−Kit+IL-7R+α4β7hiCD25−PLZF+). Lineage markers: CD4, CD8, CD3, TCRγδ, TCRβ, CD19, B220, Mac1, Gr1, Ter119, CD11c, and DX5. For LTi-like cell staining, we excluded CD4 as a lineage marker.
Competitive bone marrow transplantation
Tcf3fl/flTcf12fl/flERT2Cre or ERT2Cre mouse (8-week-old) (CD45.2; 5 × 10⁶) were co-transferred with CD45.1 bone marrow cells (1:1 ratio: total 1 × 10⁷ BM cells) into lethally irradiated (10 Gy) CD45.1 recipient mouse. 2-weeks after transplantation, mice were treated with Tamoxifen for 5 days (Tamoxifen 1mg/200μl sunflower oil × 5 times), and analyzed 6-weeks after treatment.
in vitro T cell differentiation culture
Sorted ETPs (CD4−CD8−Lin−CD44+CD25−Kit+) (300 cells/well; 24-well plate) from 15.5 dpc fetal thymus were co-cultured with Notch-ligand expressing stromal cell line (Tst-4-DL1) (Miyazaki et al., 2005) in 10% FBS complete RPMI medium (described in cell culture) containing SCF, IL7, and Flt3 (10ng/ml each) for 12 days, then analyzed for the development of T cell and ILCs.
RNA-seq
Total RNA was isolated using the RNeasy-Micro Kit (Qiagen) and was processed for deep sequencing using SMARTer Ultra Low Input RNA kit for Sequencing-v3 (Clontech) and Low Input Library Prep Kit (Clontech) following the manufacturer’s protocol. cDNA libraries were sequenced on a HiSeq 2500 sequencer (Illumina).
RNA-seq analysis
Paired-end RNA-Seq reads were trimmed before mapping using fastx-trimmer tool. TopHat (version 2.0.14) was used to map reads to the mouse reference genome (mm9), with parameter ‘—mate-std-dev #stdev’ and ‘-r #insert-distance’. The #stdev and #insert-distance were estimated for each sample from sub-sampled data. Array Studio software (OmicSoft Corporation) was used to calculate the FPKM (Fragments Per Kilobase of transcript per Million Mapped reads) expression values and raw read counts. Differential expression analysis was performed using DESeq (version 2) R package. MultiExperiment Viewer software was used to generate heat maps and for hierarchical clustering. Gene Ontology and gene enrichment analyses were performed using Metascape (http://metascape.org).
Heatmap of correlation values between RNA-seq reads and Immgen Consortium’s microarray data
We correlated the microarray gene expression data of various mouse immune cell types that were downloaded from the Immgen Consortium (www.immgen.org) to our wild type and Tcf3−/−Tcf12−/− ETP RNA-seq data (biological triplicates) using overlapping genes available in both platforms and annotated within the GO term GO2710 that were differentially expressed (FDR < 0.05). Spearman’s correlations were then calculated between each of the platforms samples and then hierarchically clustered. The resulting heat map illustrates that the Tcf3−/−Tcf12−/− ETP gene expression profiles have consistent and higher correlations with ILC1, ILC2, ILC3, LTI CD4 and NK populations than the controls.
ATAC-seq
ATAC-seq protocol was developed by (Buenrostro et al., 2013). In this study ATAC-seq was performed according to the published protocol with modifications described by (Lara-Astiaso et al., 2014) with a following change; the fragmented DNAs were amplified with total 11 cycles using 1× NEBnext PCR master mix (NEB). In brief, sorted cells were pelleted and washed once with 1x PBS. The cells were pelleted again and were re-suspended in 25 μl of lysis buffer and nuclei were pelleted. The nuclei were re-suspended in 25 μl reaction buffer containing 2 μl of Tn5 transposase and 12.5 μl of TD buffer in the Nextera Sample preparation kit (Illumina) and incubated at 37°C for one hour. Then 5 μl of clean up buffer (900mM NaCl, 300mM EDTA), 2 μl of 5% SDS and 2 μl of Proteinase K (NEB) were added and incubated for 30 min. Tagmentated DNA was isolated using a DNA Clean & Concentrator™-5 kit (ZYMO RESEARCH). For library amplification, two sequential PCR were preformed using 1× NEBnext PCR master mix (NEB). After the first 9-cycle PCR, the libraries were selected for small fragments (less than 600 bp) using SPRI beads. Once the libraries were purified using a DNA Clean & Concentrator™-5 kit (ZYMO RESEARCH), they were sequenced on a HiSeq 2500 sequencer (Illumina).
Processing of ATAC-seq data
The 3′ end of the ATAC-seq reads often contain adaptor sequences that affect read mapping if not trimmed. We used an iterative mapping strategy to solve this problem. In brief, reads were trimmed to a starting length (e.g. 30 bases) from the 3′ end and mapped to the mm9 reference genome using Bowtie (version 0.12.7) with the parameters –X2000 and –m1 as previously described (Buenrostro et al., 2013). Reads that were mapped to multiple locations due to the short read length were extended towards its 3′ end with a small step size (e.g. 1 base) and mapped again. The procedure was repeated until the reads could not be extended anymore. Using this mapping method, maximum mapping rate was achieved and all of the informative reads were retained. After mapping, reads originated from the mitochondria were discarded and all the reads that were mapped to the “+” strand were offset by +4 bp, and all reads that were mapped to the “−” strand were offset by −5 bp to represent the center of the transposon binding events as previously described (Buenrostro et al., 2013).
Principal component analysis for ATAC-seq data
To compare the chromatin accessibility landscape of different cell lineages with our samples, we downloaded the ATAC-Seq data (GEO:GSE77695) from the O’Shea Laboratory. Their data set contains B, T, NK, ILC and progenitor cells. Reads were mapped to the mm9 reference genome as described above. Normalized (to 10 million total reads) ATAC-seq read counts were calculated using HOMER (Heinz et al., 2010) and were log (base2)-transformed. The transposed matrix was supplied as the input for the prcomp function in R software package to perform the PCA.
Hierarchical clustering based on distal/promoter peaks and 331 TFs’ motif matrices
The ATAC-seq signals were log(base 2)-transformed and annotated. The Pearson correlation values between the different cell populations were calculated for distal and promoter peaks using the R package. Unsupervised hierarchical clustering (method: complete linkage) was performed using GENE-E (https://software.broadinstitute.org/GENE-E/). TFs’ motif frequencies of each ATAC-seq distal peak file were calculated using HOMER program with 331 customized TFs PWM (http://homer.salk.edu/homer/custom.motifs). To cluster the samples, the normalized TFs’ motif frequency values were log(base 2)-transformed, and unsupervised hierarchical clustering (method: average linkage; similarity metric: correlation, centered) was performed using Cluster 3.0 software.
QUANTIFICATION AND STATISTICAL ANALYSIS
P values were calculated with the two-tailed Student’s test for two-group comparison as applicable with Microsoft Excel Software and Prism. The statistical significance level was 0.05.
DATA AND SOFTWARE AVAILABILITY
Data Resources
The accession number for the sequencing data for RNA-seq and ATAC-seq reported in this paper is NCBI GEO: GSE95339.
KEY RESOURCES TABLE
| REAGENT or RESOURCE | SOURCE | IDENTIFIER |
|---|---|---|
| Antibodies | ||
| Anti-mouse CD3e Biotin | TONBO | 30-0031 |
| Anti-mouse CD4 Biotin | Biolegend | 100404 |
| Anti-mouse CD8 Biotin | Biolegend | 100704 |
| Anti-mouse CD19 Biotin | TONBO | 30-0193 |
| Anti-mouse B220 Biotin | TONBO | 30-0452 |
| Anti-mouse CD11b Biotin | TONBO | 30-0112 |
| Anti-mouse Gr1 Biotin | TONBO | 30-5931 |
| Anti-mouse CD11c Biotin | TONBO | 30-0114 |
| Anti-mouse Ter119 Biotin | TONBO | 30-5921 |
| Anti-mouse CD49b Biotin | eBioscience | 13-5971 |
| Anti-mouse ICOS | Biolegend | 117405 |
| Anti-mouse CD90.2 | BD | 553007 |
| Anti-mouse CD25 | BD | 557658 |
| Anti-mouse Sca1 | BD | 560653 |
| Anti-mouse CD45.2 | TONBO | 80-0454 |
| Anti-mouse ST2 | eBioscience | 46-9335 |
| Anti-mouse CD127 | TONBO | 60-1271 |
| Anti-mouse Ki67 | Biolegend | 652403 |
| Anti-mouse IL-4 | BD | 564004 |
| Anti-mouse IL-5 | BD | 562048 |
| Anti-mouse IL-13 | eBioscience | 25-7133 |
| Anti-mouse Gata3 | eBioscience | 50-9966 |
| Anti-mouse CXCR6 | R & D | FAB2145P |
| Anti-mouse LPAM-1 | BD | 562376 |
| Anti-mouse PLZF | Sant Cruz Biotechnology | Sc-28319 |
| Anti-mouse CD117 | Biolegend | 105824 |
| Anti-mouse Rorgt | eBioscience | 12-6988 |
| Anti-mouse CD117 | eBioscience | 47-1172 |
| Anti-mouse CCR6 | Biolegend | 129818 |
| Anti-mouse CD335 | BD | 560800 |
| Anti-mouse Ly6D | Biolegend | 138603 |
| Anti-mouse Flt3 | eBioscience | 17-1351 |
| Anti-mouse CD150 | Biolegend | 115925 |
| Anti-mouse Sca1 | BD | 561229 |
| Anti-mouse B220 | TONBO | 65-0452 |
| Anti-mouse CD19 | BD | 552854 |
| Anti-mouse CD4 | Biolegend | 100528 |
| Anti-mouse CD8 | BD | 553033 |
| Anti-mouse CD25 | Biolegend | 102033 |
| Anti-mouse CD44 | BD | 559250 |
| Streptavidin BV650 | BD | 563855 |
| Bacterial and Virus Strains | ||
| Biological Samples | ||
| Chemicals, Peptides, and Recombinant Proteins | ||
| Recombinant Murine SCF | PeproTech | 250-03 |
| Recombinant Murine IL-7 | PeproTech | 217-17 |
| Recombinant Murine flt3-Ligand | PeproTech | 250-31L |
| Critical Commercial Assays | ||
| Lung Dissociation Kit | Miltenyi Biotec | 130-095-927 |
| BD BrdU flow kit | BD Biosciences | 552598 |
| Foxp3/Transcription Factor Staining Buffer Kit | TONBO | TNB-0607-KIT |
| Intracellular Fixation & Permeabilization Buffer Set | eBioscience | 88-8824-00 |
| RNeasy-Micro Kit | Qiagen | 74004 |
| SMARTer Ultra Low Input RNA kit for Sequencing-v3 | Clontech | CLN 634848 |
| Low Input Library Prep Kit | Clontech | CLN634947 |
| Deposited Data | ||
| RNA-seq and ATAC-seq | This paper | GEO:GSE95339 |
| ATAC-seq | Shih et al., 2016 | GEO:GSE77695 |
| Experimental Models: Cell Lines | ||
| Mouse: Tst-4-DL1 stroma cells | Miyazaki et al., 2005 | N/A |
| Experimental Models: Organisms/Strains | ||
| Mouse: C57BL/6J | Japan SLC, Inc. | C57BL/6JJmsSlc |
| Mouse: Tcf3fl/fl | Jones and Zhuang, 2007 | N/A |
| Mouse: Tcf12fl/fl | Jones and Zhuang, 2007 | N/A |
| Mouse: Id2/+TA/+ | This paper | N/A |
| Mouse: Tcf3E2A-gfp/E2A-gfp | Zhuang et al., 2004 | N/A |
| Mouse: E47−/− | Engel et al., 2001 | N/A |
| Mouse: Id2yfp/+ | Yang et al., 2011 | N/A |
| Mouse: Id2fl/fl | Niola et al., 2012, | N/A |
| Mouse: Il7rCre | Schlenner et al., 2010 | N/A |
| Mouse: Zbtb16GFPcre+/− | The Jackson Laboratory | JAX: 024529 |
| Mouse: ERT2cre | The Jackson Laboratory | JAX: 008463 |
| Mouse: ROSAYFP/YFP | The Jackson Laboratory | JAX: 006148 |
| Oligonucleotides | ||
| Recombinant DNA | ||
| Software and Algorithms | ||
| FlowJo software | Tree Star, Inc. | N/A |
| Bowtie | Langmead et al., 2009 | http://bowtie-bio.sourceforge.net/index.shtml |
| TopHat | Trapnell et al., 2009 | https://ccb.jhu.edu/software/tophat/index.shtml |
| HOMER | Heinz et al., 2010 | http://homer.salk.edu |
| Metascape | http://metascape.org/ | |
| GraphPad Prism 6 | GraphPad Software | N/A |
| Other | ||
Supplementary Material
Acknowledgments
We thank M. Itoi and K. Hozumi for helpful discussion, T. Ikawa, K. Hozumi, S. Sawa, and Y. Motomura for technical advice, K. Masuda for mice transfer, and N. Okada for mice observation and care. We thank G. Kondoh and members of Laboratory of Animal Experiments for Regeneration in Kyoto University for their kind help with the transfer of mice and generating mutant mice. We thank A. Goldrath (University of California at San Diego) for Id2-YFP mice, Yuan Zhuang (Duke University) for Tcf3fl/fl, Tcf12fl/fl, and Tcf3E2A-gfp/E2A-gfp mice, and A. Lasorella (Columbia University) for Id2fl/fl mice. This work was partly funded by the Baylor Institute for Immunology Research and Baylor Charles A. Sammons Cancer Center to K.C., Y.J., J.T., and Y.C.L., by the NIH AI102853 to C.M., and by the KAKENHI (Grant-in-Aid for Scientific Research) from the MEXT/Japan (No. 16H05205 and No. 15H06330), the Takeda Science Foundation, the Astellas Foundation for Research on Metabolic Disorders, The Naito Foundation, the Daiichi Sankyo Foundation of Life Science, and The Uehara Memorial Foundation to M.M and K.M.
Footnotes
AUTHOR CONTRIBUTIONS
M.M. conceived the project. M.M. and K.M. performed the majority of experiments. K.M. performed RNA-seq and ATAC-seq experiments and analysis. K.M., K.C., Y.J., J.T. and Y.C.L. performed bioinformatic analysis. K.C., Y.J. and Y.C.L. designed analysis, and Y.J. and J.T. analysed microarray data. K.Y. and S.O. contributed to the DNA sequencing. H.R.R. provided mouse lines and provided critical advice. K.M. and A.M. established and maintained mice, R.S. contributed to the Metascape analysis. H.K. provided critical advice. M.M., Y.C.L., and C.M. wrote the manuscript. H.K. and C.M. supervised the study.
Publisher's Disclaimer: This is a PDF file of an unedited manuscript that has been accepted for publication. As a service to our customers we are providing this early version of the manuscript. The manuscript will undergo copyediting, typesetting, and review of the resulting proof before it is published in its final citable form. Please note that during the production process errors may be discovered which could affect the content, and all legal disclaimers that apply to the journal pertain.
References
- Agata Y, Tamaki N, Sakamoto S, Ikawa T, Masuda K, Kawamoto H, Murre C. Regulation of T cell receptor beta gene rearrangements and allelic exclusion by the helix-loop-helix protein, E47. Immunity. 2007;27:871–884. doi: 10.1016/j.immuni.2007.11.015. [DOI] [PubMed] [Google Scholar]
- Bain G, Murre C. The role of E-proteins in B and T lymphocyte developmen. Semin Immunol. 1998;10:143–153. doi: 10.1006/smim.1998.0116. [DOI] [PubMed] [Google Scholar]
- Bain G, Maandag EC, Izon DJ, Amsen D, Kruisbeek AM, Weintraub BC, Krop I, Schlissel MS, Feeney AJ, van Roon M, et al. E2A proteins are required for proper B cell development and initiation of immunoglobulin gene rearrangements. Cell. 1994;79:885–892. doi: 10.1016/0092-8674(94)90077-9. [DOI] [PubMed] [Google Scholar]
- Barndt R, Dai MF, Zhuang Y. A novel role for HEB downstream or parallel to the pre-TCR signaling pathway during alpha beta thymopoiesis. J Immunol. 1999;163:3331–3343. [PubMed] [Google Scholar]
- Beard C, Hochedlinger K, Plath K, Wutz A, Jaenisch R. Efficient method to generate single-copy transgenic mice by site-specific integration in embryonic stem cells. Genesis. 2006;44:23–28. doi: 10.1002/gene.20180. [DOI] [PubMed] [Google Scholar]
- Belle I, Zhuang Y. E proteins in lymphocyte development and lymphoid diseases. Curr Top Dev Biol. 2014;110:153–187. doi: 10.1016/B978-0-12-405943-6.00004-X. [DOI] [PMC free article] [PubMed] [Google Scholar]
- Boos MD, Yokota Y, Eberl G, Kee BL. Mature natural killer cell and lymphoid tissue-inducing cell development requires Id2-mediated suppression of E protein activity. J Exp Med. 2007;204:1119–1130. doi: 10.1084/jem.20061959. [DOI] [PMC free article] [PubMed] [Google Scholar]
- Buenrostro JD, Giresi PG, Zaba LC, Chang HY, Greenleaf WJ. Transposition of native chromatin for fast and sensitive epigenomic profiling of open chromatin, DNA-binding proteins and nucleosome position. Nat Methods. 2013;10:1213–1218. doi: 10.1038/nmeth.2688. [DOI] [PMC free article] [PubMed] [Google Scholar]
- Chea S, Schmutz S, Berthault C, Perchet T, Petit M, Burlen-Defranoux O, Goldrath AW, Rodewald HR, Cumano A, Golub R. Single-Cell Gene Expression Analyses Reveal Heterogeneous Responsiveness of Fetal Innate Lymphoid Progenitors to Notch Signaling. Cell reports. 2016;14:1500–1516. doi: 10.1016/j.celrep.2016.01.015. [DOI] [PubMed] [Google Scholar]
- Cherrier M, Sawa S, Eberl G. Notch, Id2, and RORgammat sequentially orchestrate the fetal development of lymphoid tissue inducer cells. J Exp Med. 2012;209:729–740. doi: 10.1084/jem.20111594. [DOI] [PMC free article] [PubMed] [Google Scholar]
- Constantinides MG, McDonald BD, Verhoef PA, Bendelac A. A committed precursor to innate lymphoid cells. Nature. 2014;508:397–401. doi: 10.1038/nature13047. [DOI] [PMC free article] [PubMed] [Google Scholar]
- Diefenbach A, Colonna M, Koyasu S. Development, differentiation, and diversity of innate lymphoid cells. Immunity. 2014;41:354–365. doi: 10.1016/j.immuni.2014.09.005. [DOI] [PMC free article] [PubMed] [Google Scholar]
- Engel I, Johns C, Bain G, Rivera RR, Murre C. Early thymocyte development is regulated by modulation of E2A protein activity. J Exp Med. 2001;194:733–745. doi: 10.1084/jem.194.6.733. [DOI] [PMC free article] [PubMed] [Google Scholar]
- Heinz S, Benner C, Spann N, Bertolino E, Lin YC, Laslo P, Cheng JX, Murre C, Singh H, Glass CK. Simple combinations of lineage-determining transcription factors prime cis-regulatory elements required for macrophage and B cell identities. Mol Cell. 2010;38:576–589. doi: 10.1016/j.molcel.2010.05.004. [DOI] [PMC free article] [PubMed] [Google Scholar]
- Hoyler T, Klose CS, Souabni A, Turqueti-Neves A, Pfeifer D, Rawlins EL, Voehringer D, Busslinger M, Diefenbach A. The transcription factor GATA-3 controls cell fate and maintenance of type 2 innate lymphoid cells. Immunity. 2012;37:634–648. doi: 10.1016/j.immuni.2012.06.020. [DOI] [PMC free article] [PubMed] [Google Scholar]
- Hozumi K, Mailhos C, Negishi N, Hirano K, Yahata T, Ando K, Zuklys S, Hollander GA, Shima DT, Habu S. Delta-like 4 is indispensable in thymic environment specific for T cell development. J Exp Med. 2008;205:2507–2513. doi: 10.1084/jem.20080134. [DOI] [PMC free article] [PubMed] [Google Scholar]
- Ikawa T, Hirose S, Masuda K, Kakugawa K, Satoh R, Shibano-Satoh A, Kominami R, Katsura Y, Kawamoto H. An essential developmental checkpoint for production of the T cell lineage. Science. 2010;329:93–96. doi: 10.1126/science.1188995. [DOI] [PubMed] [Google Scholar]
- Ikawa T, Kawamoto H, Goldrath AW, Murre C. E proteins and Notch signaling cooperate to promote T cell lineage specification and commitment. J Exp Med. 2006;203:1329–1342. doi: 10.1084/jem.20060268. [DOI] [PMC free article] [PubMed] [Google Scholar]
- Inlay MA, Bhattacharya D, Sahoo D, Serwold T, Seita J, Karsunky H, Plevritis SK, Dill DL, Weissman IL. Ly6d marks the earliest stage of B-cell specification and identifies the branchpoint between B-cell and T-cell development. Genes Dev. 2009;23:2376–2381. doi: 10.1101/gad.1836009. [DOI] [PMC free article] [PubMed] [Google Scholar]
- Ishizuka IE, Chea S, Gudjonson H, Constantinides MG, Dinner AR, Bendelac A, Golub R. Single-cell analysis defines the divergence between the innate lymphoid cell lineage and lymphoid tissue-inducer cell lineage. Nat Immunol. 2016;17:269–276. doi: 10.1038/ni.3344. [DOI] [PMC free article] [PubMed] [Google Scholar]
- Jones ME, Zhuang Y. Acquisition of a functional T cell receptor during T lymphocyte development is enforced by HEB and E2A transcription factors. Immunity. 2007;27:860–870. doi: 10.1016/j.immuni.2007.10.014. [DOI] [PMC free article] [PubMed] [Google Scholar]
- Jones ME, Zhao X, Kappes D, Lasorella A, Iavarone A, Zhuang Y. E protein transcription factors are required for the development of CD4(+) lineage T cells. Immnuty. 2012;36:348–361. doi: 10.1016/j.immuni.2012.02.010. [DOI] [PMC free article] [PubMed] [Google Scholar]
- Klose CS, Artis D. Innate lymphoid cells as regulators of immunity, inflammation and tissue homeostasis. Nat Immunol. 2016;17:765–774. doi: 10.1038/ni.3489. [DOI] [PubMed] [Google Scholar]
- Koues OI, Collins PL, Cella M, Robinette ML, Porter SI, Pyfrom SC, Payton JE, Colonna M, Oltz EM. Distinct Gene Regulatory Pathways for Human Innate versus Adaptive Lymphoid Cells. Cell. 2016;165:1134–1146. doi: 10.1016/j.cell.2016.04.014. [DOI] [PMC free article] [PubMed] [Google Scholar]
- Langmead B, Trapnell C, Pop M, Salzberg SL. Ultrafast and memory-efficient alignment of short DNA sequences to the human genome. Genome Biol. 2009;10:R25. doi: 10.1186/gb-2009-10-3-r25. [DOI] [PMC free article] [PubMed] [Google Scholar]
- Li L, Leid M, Rothenberg EV. An early T cell lineage commitment checkpoint dependent on the transcription factor Bcl11b. Science. 2010;329:89–93. doi: 10.1126/science.1188989. [DOI] [PMC free article] [PubMed] [Google Scholar]
- Lin YC, Jhunjhunwala S, Benner C, Heinz S, Welinder E, Mansson R, Sigvardsson M, Hagman J, Espinoza CA, Dutkowski J, et al. A global network of transcription factors, involving E2A, EBF1 and Foxo1, that orchestrates B cell fate. Nat Immunol. 2010;11:635–643. doi: 10.1038/ni.1891. [DOI] [PMC free article] [PubMed] [Google Scholar]
- Male V, Nisoli I, Kostrzewski T, Allan DS, Carlyle JR, Lord GM, Wack A, Brady HJ. The transcription factor E4bp4/Nfil3 controls commitment to the NK lineage and directly regulates Eomes and Id2 expression. J Exp Med. 2014;211:635–642. doi: 10.1084/jem.20132398. [DOI] [PMC free article] [PubMed] [Google Scholar]
- Miyazaki K, Miyazaki M, Murre C. The establishment of B versus T cell identity. Trends Immunol. 2014;35:205–210. doi: 10.1016/j.it.2014.02.009. [DOI] [PMC free article] [PubMed] [Google Scholar]
- Miyazaki M, Kawamoto H, Kato Y, Itoi M, Miyazaki K, Masuda K, Tashiro S, Ishihara H, Igarashi K, Amagai T, et al. Polycomb group gene mel-18 regulates early T progenitor expansion by maintaining the expression of Hes-1, a target of the Notch pathway. J Immunol. 2005;174:2507–2516. doi: 10.4049/jimmunol.174.5.2507. [DOI] [PubMed] [Google Scholar]
- Miyazaki M, Rivera RR, Miyazaki K, Lin YC, Agata Y, Murre C. The opposing roles of the transcription factor E2A and its antagonist Id3 that orchestrate and enforce the naive fate of T cells. Nat Immunol. 2011;12:992–1001. doi: 10.1038/ni.2086. [DOI] [PMC free article] [PubMed] [Google Scholar]
- Moro K, Yamada T, Tanabe M, Takeuchi T, Ikawa T, Kawamoto H, Furusawa J, Ohtani M, Fujii H, Koyasu S. Innate production of T(H)2 cytokines by adipose tissue-associated c-Kit(+)Sca-1(+) lymphoid cells. Nature. 2010;463:540–544. doi: 10.1038/nature08636. [DOI] [PubMed] [Google Scholar]
- Murre C. Helix-loop-helix proteins and lymphocyte development. Nat Immunol. 2005;6:1079–1086. doi: 10.1038/ni1260. [DOI] [PubMed] [Google Scholar]
- Niola F, Zhao X, Singh D, Castano A, Sullivan R, Lauria M, Nam HS, Zhuang Y, Benezra R, Di Bernardo D, Iavarone A, Lasorella A. Id proteins synchronize stemness and anchorage to the niche of neural stem cells. Nat Cell Biol. 2012;14:477–87. doi: 10.1038/ncb2490. [DOI] [PMC free article] [PubMed] [Google Scholar]
- Okamura RM, Sigvardsson M, Galceran J, Verbeek S, Clevers H, Grosschedl R. Redundant regulation of T cell differentiation and TCRalpha gene expression by the transcription factors LEF-1 and TCF-1. Immunity. 1998;8:11–20. doi: 10.1016/s1074-7613(00)80454-9. [DOI] [PubMed] [Google Scholar]
- Pereira de Sousa A, Berghault C, Granato A, Dias S, Ramond C, Kee BL, Cumano A, Vieira P. Inhibitors of DNA binding proteins restrict T cell potential by repressing Notch1 expression in Flt3-negative common lymphoid progenitors. J Immnol. 2012;15:3822–3830. doi: 10.4049/jimmunol.1103723. [DOI] [PubMed] [Google Scholar]
- Sawa S, Cherrier M, Lochner M, Satoh-Takayama N, Fehling HJ, Langa F, Di Santo JP, Eberl G. Lineage relationship analysis of RORgammat+ innate lymphoid cells. Science. 2010;330:665–669. doi: 10.1126/science.1194597. [DOI] [PubMed] [Google Scholar]
- Schlenner SM, Madan V, Busch K, Tietz A, Laufle C, Costa C, Blum C, Fehling HJ, Rodewald HR. Fate mapping reveals separate origins of T cells and myeloid lineages in the thymus. Immunity. 2010;32:426–436. doi: 10.1016/j.immuni.2010.03.005. [DOI] [PubMed] [Google Scholar]
- Seehus CR, Aliahmad P, de la Torre B, Iliev ID, Spurka L, Funari VA, Kaye J. The development of innate lymphoid cells requires TOX-dependent generation of a common innate lymphoid cell progenitor. Nat Immunol. 2015;16:599–608. doi: 10.1038/ni.3168. [DOI] [PMC free article] [PubMed] [Google Scholar]
- Semerad CL, Mercer EM, Inlay MA, Weissman IL, Murre C. E2A proteins maintain the hematopoietic stem cell pool and promote the maturation of myelolymphoid and myeloerythroid progenitors. Proc Natl Acad Sci U S A. 2009;106:1930–1935. doi: 10.1073/pnas.0808866106. [DOI] [PMC free article] [PubMed] [Google Scholar]
- Serafini N, Vosshenrich CA, Di Santo JP. Transcriptional regulation of innate lymphoid cell fate. Nat Rev Immunol. 2015;15:415–428. doi: 10.1038/nri3855. [DOI] [PubMed] [Google Scholar]
- Shih HY, Sciume G, Mikami Y, Guo L, Sun HW, Brooks SR, Urban JF, Jr, Davis FP, Kanno Y, O’Shea JJ. Developmental Acquisition of Regulomes Underlies Innate Lymphoid Cell Functionality. Cell. 2016;165:1120–1133. doi: 10.1016/j.cell.2016.04.029. [DOI] [PMC free article] [PubMed] [Google Scholar]
- Trapnell C, Pachter L, Salzberg SL. TopHat: Discovering splice junctions with RNA-Seq. Bioinformatics. 2009;25:1105–1111. doi: 10.1093/bioinformatics/btp120. [DOI] [PMC free article] [PubMed] [Google Scholar]
- Wakabayashi Y, Watanabe H, Inoue J, Takeda N, Sakata J, Mishima Y, Hitomi J, Yamamoto T, Utsuyama M, Niwa O, et al. Bcl11b is required for differentiation and survival of alphabeta T lymphocytes. Nat Immunol. 2003;4:533–539. doi: 10.1038/ni927. [DOI] [PubMed] [Google Scholar]
- Walker JA, Oliphant CJ, Englezakis A, Yu Y, Clare S, Rodewald HR, Belz G, Liu P, Fallon PG, McKenzie AN. Bcl11b is essential for group 2 innate lymphoid cell development. J Exp Med. 2015;212:875–882. doi: 10.1084/jem.20142224. [DOI] [PMC free article] [PubMed] [Google Scholar]
- Weber BN, Chi AW, Chavez A, Yashiro-Ohtani Y, Yang Q, Shestova O, Bhandoola A. A critical role for TCF-1 in T-lineage specification and differentiation. Nature. 2011;476:63–68. doi: 10.1038/nature10279. [DOI] [PMC free article] [PubMed] [Google Scholar]
- Welinder E, Mansson R, Mercer EM, Bryder D, Sigvardsson M, Murre C. The transcription factors E2A and HEB act in concert to induce the expression of FOXO1 in the common lymphoid progenitor. Proc Natl Acad Sci U S A. 2011;108:17402–17407. doi: 10.1073/pnas.1111766108. [DOI] [PMC free article] [PubMed] [Google Scholar]
- Xu W, Domingues RG, Fonseca-Pereira D, Ferreira M, Ribeiro H, Lopez-Lastra S, Motomura Y, Moreira-Santos L, Bihl F, Braud V, et al. NFIL3 orchestrates the emergence of common helper innate lymphoid cell precursors. Cell reports. 2015;10:2043–2054. doi: 10.1016/j.celrep.2015.02.057. [DOI] [PubMed] [Google Scholar]
- Yang CY, Best JA, Knell J, Yang E, Sheridan AD, Jesionek AK, Li HS, Rivera RR, Lind KC, D’Cruz LM, et al. The transcriptional regulators Id2 and Id3 control the formation of distinct memory CD8+ T cell subsets. Nat Immunol. 2011;12:1221–1229. doi: 10.1038/ni.2158. [DOI] [PMC free article] [PubMed] [Google Scholar]
- Yang Q, Li F, Harly C, Xing S, Ye L, Xia X, Wang H, Wang X, Yu S, Zhou X, et al. TC upregulation identifies early innate lymphoid progenitors in the bone marrow. Nat Immunol. 2015;16:1044–1050. doi: 10.1038/ni.3248. [DOI] [PMC free article] [PubMed] [Google Scholar]
- Yokota Y, Mansouri A, Mori S, Sugawara S, Adachi S, Nishikawa S, Gruss P. Development of peripheral lymphoid organs and natural killer cells depends on the helix-loop-helix inhibitor Id2. Nature. 1999;397:702–706. doi: 10.1038/17812. [DOI] [PubMed] [Google Scholar]
- Zhuang Y, Jackson A, Pan L, Shen K, Dai M. Regulation of E2A gene expression in B-lymphocyte development. Mol Immunol. 2004;40:1165–1177. doi: 10.1016/j.molimm.2003.11.031. [DOI] [PubMed] [Google Scholar]
- Zhuang Y, Soriano P, Weintraub H. The helix-loop-helix gene E2A is required for B cell formation. Cell. 1994;79:875–884. doi: 10.1016/0092-8674(94)90076-0. [DOI] [PubMed] [Google Scholar]
- Zook EC, Kee BL. Development of innate lymphoid cells. Nat Immunol. 2016;17:775–782. doi: 10.1038/ni.3481. [DOI] [PubMed] [Google Scholar]
Associated Data
This section collects any data citations, data availability statements, or supplementary materials included in this article.