

Abstract
Background
Intracerebral hemorrhage is associated with neurological decline and poor prognosis. While many etiologic models have been explored, secondary damage caused by continued inflammation and iron exposure from red blood cell lysis may explain poor outcomes at distant follow-up. Examining serum samples of patients with intracerebral hemorrhage for biomarkers of iron physiology may yield relationships between iron exposure and functional outcomes.
Methods
The following study retrospectively evaluated 41 patient serum samples obtained one day and seven days post-ictus for CD163, ferritin, and hepcidin concentrations. Functional outcomes, using the modified Rankin Scale, were dichotomized into good (0–3) and poor (4–6) outcomes. Correlation analysis and logistic regression were used to explore relationships between biomarker values, clinical metrics (such as ICH Score), and functional outcomes at three and twelve months.
Results
Clinical metrics (APACHE II score, ICH Score, and NIHSS) were correlated with elevated ferritin levels seven days post-ictus. Furthermore, it was found that mean CD163 levels on day one were significantly associated with functional outcomes at three and twelve months; mean serum ferritin concentrations on day one and seven were elevated in those with poor outcomes at three months, and day seven levels were independently correlated with twelve month outcomes.
Conclusion
While this study serves to contribute to a growing body of evidence that CD163 and ferritin are biomarkers of functional outcomes, prospective cohort studies may clarify the role of iron-related inflammatory biomarkers as they pertain to neurological decline in patients with intracerebral hemorrhage.
Keywords: biomarkers, intracerebral hemorrhage, functional outcome, iron regulation
Introduction
Intracerebral hemorrhage (ICH) is associated with a 1-month mortality rate of 40% and poor neurological recovery (1). For years, researchers proposed that brain injury from spontaneous hemorrhages occurred in a single phase: immediate mechanical traumatic damage to the neurons and glia (2). However, more recent reviews suggest that secondary damage caused by continued bleeding, inflammation, and cerebral edema compound brain injury as well (3). The mechanisms behind this secondary phase of stroke-induced cerebral damage are unclear, though they are postulated to pertain to hemoglobin lysis, iron exposure, and neural toxicity (3). Yet, few studies have used human subjects to examine whether mediators of hemorrhagic inflammation and edema development can predict outcomes months after discharge. Therefore, the following study seeks to clarify these mechanisms by assessing biomarkers of inflammation, iron regulation, and macrophage induction on functional outcome scores at 3 and 12 months.
Although there are many factors that affect the course and prognoses of hemorrhagic strokes, cellular and molecular markers of immune system activation have received much attention in the past few years (4). Besides acute inflammation, iron deposition and toxicity from red blood cell lysis in the hemorrhagic region can lead to post-hemorrhagic edema formation (5, 6). This iron toxicity mechanism has been demonstrated in rodent models in which intracerebral injection of lysed erythrocytes leads to brain injury that closely resembles direct infusion of iron and hemoglobin (7, 8). Furthermore, administration of iron chelators such as deferoxamine, deferiprone, clioquinol, and minocycline have been shown to have protective effects in animal models (9, 10, 11). In human subject cohorts, decreased serum iron (as a proposed result of iron efflux and deposition into cerebral tissues) has been associated with poorer functional outcomes in patients with ICH, although the impact of edema formation was not examined (12). Hepcidin, a molecule that negatively regulates serum iron concentration was accordingly increased in patients with worse outcomes at 3 months (12). However, many effects of ICH damage are not seen until after 3 months post-discharge. In addition, the serum iron result conflicts with an animal model study in which larger clots following ICH correlated with higher serum iron concentrations (11). Instead, ferritin, an iron-carrying protein that may be a more robust indicator of iron concentration and release, has been proposed as a better predictor of poor outcomes (13). Indeed, another recent study examined outcomes at 90 days, and found that increased serum ferritin levels correlated with poorer functional outcomes (14). As before, these outcomes have yet to be assessed at a more distant follow-up. Therefore, while there is general consensus that these two mechanisms are important in the pathophysiology of ICH, there is a paucity of human subject studies that examine distant effects on functional outcomes, which necessitates more further exploration.
Finally, recent reviews have determined that microglia and macrophages, specifically the M2 phenotype, assist in neural repair (15). Macrophage polarization has been observed experimentally in animal models of intraventricular hemorrhage as well (16). Interestingly the proportion of “protective” M2 macrophages has been observed to increase following ICH in accordance with erythrophagocytosis; CD163, a receptor found on M2 macrophages that facilitates haptoglobin-hemoglobin uptake and degradation, was found in increased quantities on macrophages in animals with increased hematoma clearance (17, 18). Again, however, many of these observations have utilized only animal models. There is a need for establishing these effects in human subjects as well as assessing the influence of microglial activation and proinflammatory activity on functional outcomes.
These mechanisms need further elucidation, as it may be likely that leukocyte mobilization and recruitment contributes to perihematomal edema and long-term recovery. Therefore, the present study ascertains serum concentrations of biomarkers related to iron regulation and macrophage polarization (CD163, ferritin, and hepcidin), assesses correlations with clinical metrics, and explores associations with functional outcomes at 3 and 12 months follow-up.
Methods
Participants
This is a retrospective evaluation of 41 subjects derived from a larger cohort of 575 patients presenting to Columbia University Medical Center with non-traumatic ICH who were prospectively enrolled in the Intracerebral Hemorrhage Outcomes Project (ICHOP) between 2009 and 2016 (Columbia University IRB-AAAD4775). Serum samples were collected on days 1 and 7 post-admission and stored at −40°C. Forty-one patients met the following initial inclusion criteria: 1) serum samples were collected on both day 1 and day 7, 2) serum samples were <5 years old, and 3) follow-up data at 3 and 12 months post-discharge was available (see figure 1). Clinical metrics including the Acute Physiology and Chronic Health Evaluation II (APACHE II) score (19), Glasgow Coma Scale (GCS) (20), Intracerebral Hemorrhage (ICH) Score (21), and the National Institutes of Health Stroke Scale (NIHSS) (22) were extracted from the ICHOP database in order to examine correlations between these scales and biomarkers. While the ICH Score contains GCS as one of its factors, the two are not distinguished in subsequent analyses as prior research has shown that both scales can be useful in predicting outcomes (23). ELISA assays were then conducted to assess serum concentrations of ferritin, CD163, and hepcidin. Subsequent analyses were run using data from any blood samples that were available (Figure 1). A comparison between our study subjects and the larger cohort of ICHOP participants is shown in Table 1.
Figure 1.
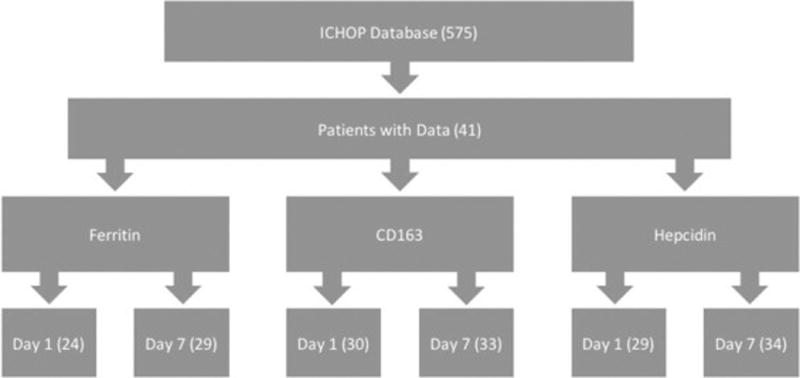
This figure illustrates the number of samples that were available and adequate for each specific biomarker assay.
Table 1.
Characteristics of present sample compared with all ICHOP subjects
| Present Sample (n = 41) |
ICHOP Subjects (n = 575) |
||
|---|---|---|---|
| Mean ± SD | Mean ± SD | p | |
| Age | 59.98 ± 18.94 (n=41) | 62.56 ± 17.69 (n=575) | 0.370 |
| Percent Female | 0.49 (n=41) | 0.46 (n=575) | 0.711 |
| History of Hypertension | 0.63 (n=41) | 0.70 (n=575) | 0.347 |
| History of Diabetes | 0.32 (n=41) | 0.32 (n=575) | 1.000 |
| History of Coronary Heart Disease | 0.22 (n=41) | 0.17 (n=575) | 0.412 |
| Smoking History | 0.26 (n=41) | 0.30 (n=575) | 0.589 |
| Vital Signs: SBP | 174.51 ± 44.21 (n=41) | 173.84 ± 41.29 (n=534) | 0.917 |
| Vital Signs: DBP | 96.56 ± 25.17 (n=41) | 94.85 ± 25.06 (n=534) | 0.662 |
| GCS | 9.37 ± 4.19 (n=41) | 10.31 ± 4.53 (n=566) | 0.198 |
| NIHSS | 16.98 ± 11.92 (n=41) | 13.79 ± 11.00 (n=539) | 0.076 |
| APACHE II | 16.88 ± 9.20 (n=41) | 14.89 ± 14.00 (n=534) | 0.371 |
| ICH Score | 2.05 ± 1.36 (n=41) | 1.92 ± 2.00 (n=536) | 0.683 |
| Hematoma Volume | 24.48 ± 24.87 (n=41) | 26.04 ± 33.85 (n=559) | 0.772 |
| LeRoux Score | 3.56 ± 4.35 (n=41) | 3.62 ± 4.63 (n=559) | 0.936 |
| Graeb Score | 2.66 ± 3.11 (n=41) | 2.65 ± 3.23 (n=559) | 0.985 |
| Percent Receiving FFP | 0.17 (n=41) | 0.15 (n=575) | 0.726 |
| Percent Receiving Intrathecal tPA | 0.09 (n=41) | 0.04 (n=575) | 0.129 |
| Percent Receiving EVD | 0.37 (n=41) | 0.27 (n=575) | 0.168 |
| Percent Receiving SurgicalEvacuation | 0.20 n=41) | 0.12 (n=575) | 0.136 |
| 3 month mRS | 4.12 ± 1.85 (n=41) | 4.0 ± 2.0 (n=458) | 0.711 |
| 12 month mRS | 4.41 ± 1.72 (n=41) | 4.2 ± 2.0 (n=406) | 0.517 |
Immunoassay Technique: Sandwich ELISA
Sample serum concentrations of CD163, ferritin, and hepcidin were measured using 4 assays: Human CD163 (M130) ELISA kit (ThermoScientific Pierce, EHCD163), Human Ferritin ELISA Kit (ThermoScientific Pierce, EHFTL), and Quantikine ELISA Human Hepcidin Immunoassay (R&D Systems, DHP250) according to the manufacturer’s instructions. Serum samples were diluted per manufacturer instructions. Absorbance measurements were recorded at 450–550 nm using a spectrophotometer. Standards curves were created for CD163, hepcidin, and ferritin using prepared standard concentrations with R software (version 3.3.0, 2016). For ferritin and CD163, one and two outliers respectively were eliminated from the standard concentration curve in order to establish a best fit. Sample concentrations were then calculated based on the standard curves.
Outcome
Participants were contacted via telephone at 3 and 12 months follow-up. After reverifying patient consent and identity, participants were asked a battery of follow-up questions, which included the modified Rankin Scale (mRS) (24). The participants were then divided into two groups based on mRS scores so as to allow for logistic regression analysis: good (0–3) and poor (4–6) functional outcomes. This technique, as well as the specific mRS cutoffs, has demonstrated efficacy in previous research (24), allows for logistic regression, and facilitates calculation of odds ratios (12).
Statistical Analysis
Data was analyzed using standard packages in R software. First, the present sample was compared to the larger ICHOP cohort in order to establish the sample as representative. Next, relationships between clinical metrics and serum biomarker concentrations were explored using Pearson’s correlation analysis. After dichotomizing the sample into good and poor functional outcomes, group differences in demographics, clinical metrics, and serum biomarker concentrations were calculated. Finally, logistic regression was used to explore significant relationships between biomarkers and functional outcomes; multivariate logistic regression assessed independence between biomarkers and clinical metrics in their relationships with functional outcomes (12).
Results
The final analysis included 41 subjects (mean age: 59.98 ± 18.94 (SD); 49% female) taken from the larger cohort (n=575). General characteristics of the present sample compared with the larger cohort are displayed in Table 1; these variables include age, relevant medical history, clinical metrics, imaging scores, various treatment modalities, and functional outcomes at 3 and 12 months. There were no statistically significant differences between sexes in any of the clinical metrics or mRS scores, nor was there a statistically significant difference in the proportion of poor functional outcomes at 3 and 12 months in the present sample (63% and 66%, respectively).
Correlation Analysis between Clinical Metrics and Serum Biomarker Concentrations
Using Pearson correlation analysis, APACHE II, GCS, NIHSS, and ICH Scores were compared, as well as correlated against serum biomarker concentrations on day 1 and day 7. The results are shown in Table 2. As expected, the correlations between clinical metrics were high and unanimously significant. Of note, as ICH Score includes GCS, these two metrics had the highest association (r = −0.84, p < 0.001). Analysis on serum biomarker concentrations showed at least trend-level correlations between CD163 levels on day 7 with APACHE II (r = 0.31, p = 0.08), GCS (r = −0.40, p = 0.02), ICH Score (r = 0.29, p = 0.10), and NIHSS (r = 0.31, 0.08). Meanwhile, ferritin levels on day 1 were only weakly associated with APACHE II scores (r = 0.38, p = 0.07) while levels on day 7 were significantly associated with clinical metrics [APACHE II: r = 0.51, p < 0.01, GCS: r = −0.40, p = 0.02, ICH Score: r = 0.52, p < 0.01, NIHSS: r = 0.37, p = 0.047].
Table 2.
Correlation analysis between clinical metrics and serum biomarker concentrations
| 1 | 2 | 3 | 4 | 5 | 6 | 7 | 8 | 9 | 10 | |
|---|---|---|---|---|---|---|---|---|---|---|
| 1.APACHE | 1 | |||||||||
| 2.GCS | −0.72*** | 1 | ||||||||
| 3.ICH Score | 0.68*** | −0.84*** | 1 | |||||||
| 4.NIHSS | 0.63*** | −0.71*** | 0.61*** | 1 | ||||||
| 5.CD163 Day 1 | 0.43* | −0.28 | 0.31 | 0.03 | 1 | |||||
| 6.CD163 Day 7 | 0.31 | −0.40* | 0.29 | 0.31 | 0.37 | 1 | ||||
| 7.Ferritin Day 1 | 0.38 | −0.05 | −0.05 | 0.06 | 0.09 | −0.08 | 1 | |||
| 8.Ferritin Day 7 | 0.51** | −0.40* | 0.52** | 0.37* | 0.20 | 0.16 | 0.71** | 1 | ||
| 9.Hepcidin Day 1 | −0.05 | −0.08 | 0.07 | −0.07 | 0.12 | 0.31 | −0.42* | −0.44* | 1 | |
| 10.Hepcidin Day 7 | 0.07 | −0.03 | −0.11 | 0.05 | −0.03 | 0.36* | −0.19 | −0.57** | 0.83*** | 1 |
- p < 0.05
- p < 0.01
- p < 0.001
Despite not being associated with clinical metrics, hepcidin was inversely correlated with ferritin; day 1 serum concentrations correlated with day 1 and day 7 ferritin levels (r = −0.42, p < 0.05 and r = −0.44, p = 0.05). Additionally, hepcidin levels on day 7 correlated with day 7 ferritin (r = −0.57, p < 0.01). Finally, hepcidin levels on day 1 had a strong positive relationship with day 7 levels (r = 0.83, p < 0.001).
Comparing Serum Biomarker Concentrations between Good and Poor Functional Outcomes
Functional outcomes on the six-point mRS scale were dichotomized based on scores 0–3 and 4–6 (25). Group differences in selected general characteristics, clinical metrics, and serum biomarkers are shown in Table 3. Consistent with previous research validating each metric, mean APACHE II, ICH Score, and NIHSS were higher in individuals with poor outcomes at 3 and 12 months, and GCS was higher in those with good outcomes at both time points.
Table 3.
Comparison of general characteristics, clinical metrics, and serum markers between good and poor functional outcomes at 3 and 12 months
| Good mRS Outcome at 3 Months |
Poor mRS Outcome at 3 Months |
Good mRS Outcome at 12 Months |
Poor mRS Outcome at 12 Months |
|||
|---|---|---|---|---|---|---|
| Mean ± SD | Mean ± SD | P | Mean ± SD | Mean ± SD | P | |
| General Characteristics | ||||||
| Age | 46.2 ± 17.6 | 67.9 ± 14.8 | <0.001*** | 44.6 ± 17.5 | 67.9 ± 14.4 | <0.001*** |
| Percent Female | 0.60 | 0.42 | 0.275 (Chi Sq) | 0.64 | 0.41 | 0.153 (Chi Sq) |
| Hematoma Volume | 18.2 ± 16.6 | 28.1 ± 28.2 | 0.162 | 17.2 ± 27.6 | 28.3 ± 27.6 | 0.121 |
| Clinical Metrics Examined in Present Study | ||||||
| APACHE | 10.1 ± 5.9 | 20.8 ± 8.5 | <0.001*** | 9.5 ± 6.0 | 20.7 ± 8.2 | <0.001*** |
| GCS | 12.3 ± 2.5 | 7.7 ± 4.1 | <0.001*** | 11.6. ± 3.5 | 8.2 ± 4.1 | 0.009** |
| ICH Score | 1.2 ± 0.9 | 2.5 ± 4.1 | <0.001*** | 1.4 ± 0.8 | 2.4 ± 4.1 | 0.005** |
| NIHSS | 9.5 ± 8.2 | 21.3 ± 11.7 | <0.001*** | 9.1 ± 8.0 | 21.1 ± 11.6 | <0.001*** |
| Serum Biomarkers | ||||||
| CD163 Day 1 | 82.8 ± 44.3 | 128.9 ± 45.6 | 0.022* | 81.8 ± 47.2 | 126.9 ± 45.2 | 0.039* |
| CD163 Day 7 | 88.5 ± 54.4 | 108.4 ± 55.8 | 0.310 | 95.5 ± 62.7 | 102.2 ± 40.6 | 0.747 |
| Ferritin Day 1 | 45.9 ± 56.3 | 126.1 ± 115.4 | 0.037* | 53.3 ± 59.5 | 119.9 ± 115.3 | 0.099 |
| Ferritin Day 7 | 59.9 ± 67.5 | 152.6 ± 110.3 | 0.011* | 70.4 ± 69.8 | 138.2 ± 115.5 | 0.063 |
| Hepcidin Day 1 | 89.0 ± 56.9 | 81.0 ± 48.4 | 0.722 | 88.8 ± 56.8 | 81.1 ± 48.8 | 0.730 |
| Hepcidin Day 7 | 93.5 ± 54.4 | 78.5 ± 47.3 | 0.405 | 84.4 ± 54.9 | 85.6 ± 48.3 | 0.949 |
CD163 and hepcidin are reported in µg/mL. Ferritin is reported in ng/mL.
- p < 0.05
- p < 0.01
- p < 0.001
Notably, mean serum CD163 levels on day 1 were different in both groups, such that those with poor functional outcomes tended to have higher concentrations. This relationship was not statistically significant for levels taken on the 7th day of hospitalization. CD163 levels, on average, tended to rise for those who had good outcomes at 3 and 12 months and fall for those who had poor outcomes, though this relationship was not statistically significant at p < 0.05. In addition, logistic regression analysis was used to show that CD163 levels on day 1 were correlated with mRS scores independent of other prognosticators such as GCS, ICH Score, and NIHSS, suggesting that serum CD163 may be an independent predictor of outcome (3 month OR: 1.017, p = 0.004, 12 month OR: 1.015, p = 0.014) (Table 4). A pseudo R2 for both 3 and 12 month models was greater than 0.60. Mean CD163 levels on day 7 were not different between good and bad outcomes and were likewise not independently associated with functional outcomes despite the trend-level correlation with clinical metrics (Table 2).
Table 4.
CD163 levels on day 1 were independently correlated with mRS scores of ICH Patients
| mRS Scores at 3 Months | ||||
| β | 95% CI for OR | OR | P | |
| CD163 | 0.017 | 1.007 to 1.028 | 1.017 | 0.004** |
| GCS | −0.075 | 0.702 to 1.226 | 0.928 | 0.604 |
| ICH Score | −0.205 | 0.385 to 1.723 | 0.815 | 0.598 |
| NIHSS | 0.074 | 1.018 to 1.138 | 1.077 | 0.016* |
| mRS Scores at 12 Months | ||||
| β | 95% CI for OR | OR | P | |
| CD163 | 0.015 | 1.004 to 1.026 | 1.015 | 0.014* |
| GCS | −0.054 | 0.715 to 1.256 | 0.948 | 0.712 |
| ICH Score | −0.288 | 0.352 to 1.599 | 0.750 | 0.462 |
| NIHSS | 0.079 | 1.023 to 1.145 | 1.082 | 0.011* |
Biomarker units are µg/mL, explaining the small β-estimates.
Dependent variable: mRS scores (range 0–6).
APACHE was excluded from this analysis as it showed high collinearity with CD163. Here it is shown that, independent of GCS, ICH Score, and NIHSS, a microgram/mL increase in serum CD163 levels correlated to a mean rise of 0.017 in mRS scores at 3 months and 0.015 at 12 months.
McFadden’s R2 = 0.663 (3-month) and 0.660 (12-month).
- p < 0.05
- p < 0.01
- p < 0.001
In contrast to CD163, mean ferritin levels tended to rise for all patients regardless of outcome between day 1 and day 7, though this relationship was not statistically significant at p < 0.05 (Table 3). However, ferritin levels and functional outcomes were correlated, though not as powerfully as CD163 levels. Among ICH patients who suffered poor outcomes at 3 months, the mean serum ferritin levels were higher on day 1 and day 7 (Table 3). Interestingly, these group differences, while retaining trend-level significance, were weakened for 12 month outcomes. Once again, logistic regression analysis was used to show that ferritin levels on day 7 were correlated with mRS scores independent of ICH Scores and NIHSS with pseudo R2 values greater than 0.60 (Table 5). However, this association was only significant at 12 months (OR: 1.006, p = 0.043) such that, on average, one ng/mL increase in ferritin correlated to a 0.005 unit rise in mRS scores. Ferritin levels on day 1 were only found to be significantly, independently associated at a significance level of 0.10.
Table 5.
Logistic regression analysis for ferritin levels on day 7 and functional outcomes; independence demonstrated for 12 month outcomes
| mRS Scores at 3 Months | ||||
| β | 95% CI for OR | OR | P | |
| Ferritin | 0.005 | 0.999 to 1.011 | 1.005 | 0.097 |
| ICH Score | −0.515 | 0.299 to 1.194 | 0.597 | 0.157 |
| NIHSS | 0.140 | 1.078 to 1.228 | 1.151 | <0.001*** |
| mRS Scores at 12 Months | ||||
| β | 95% CI for OR | OR | P | |
| Ferritin | 0.006 | 1.000 to 1.012 | 1.006 | 0.043* |
| ICH Score | −0.647 | 0.262 to 1.046 | 0.523 | 0.079 |
| NIHSS | 0.130 | 1.067 to 1.216 | 1.139 | 0.001*** |
Biomarker units are ng/mL, explaining the small β-estimates.
Dependent variable: mRS scores (range 0–6).
APACHE and GCS were excluded from this analysis as they showed high collinearity with ferritin and mRS.
Here it is shown that, independent of ICH Score and NIHSS, a nanogram/mL increase in serum ferritin levels correlated to a mean rise of 0.006 in mRS scores at 12 months.
McFadden’s R2 = 0.614 (3-month) and 0.613 (12-month).
- p < 0.05
- p < 0.01
- p < 0.001
Despite the correlation with ferritin levels, hepcidin was not shown to be significantly associated with functional outcomes. There were no group differences in mean hepcidin levels between those subjects who had good or poor outcomes (Table 3). Logistic regression conducted with hepcidin did not yield any further information.
Discussion
Pursuing hypotheses regarding iron toxicity’s association with outcomes in patients with ICH, we measured markers of red blood cell lysis and iron toxicity as contributing factors for neural damage and its functional consequences. Ferritin, hepcidin, and CD163 were molecular mediators of interest based on previous research (3, 5, 12, 14).
In our sample, ferritin levels, on average, rose from hospital admission through day 7. Higher ferritin levels on day 1 and day 7 were associated with poorer clinical outcomes at 3 months, though this was not observed to the same degree of significance for 12 months. This suggests that, while ferritin levels may associate with functional outcomes in the short-term (14), there may be other mechanisms at work that lead to long-term neurological deterioration. Interestingly, logistic regression analysis controlling for other prognosticators showed that ferritin levels were independently associated with 12 month outcomes with only trend-level significance for 3 months. While this may be a result of limited sample sizes and insufficient statistical power, it substantiates the hypothesis that iron exposure causes damage seen over longer periods of time (26) and adds further credence to the idea that iron chelation may be a useful therapy in ICH (9, 10, 11, 26).
Contrary to what has been observed in similar paradigms (12), hepcidin was not seen to correlate with functional outcomes, though it did associate with serum ferritin concentrations. There are several possible explanations for these observations. Hepcidin may act to decrease serum iron over a timespan that would not be captured in this study; in diseases characterized by inappropriately elevated hepcidin levels (e.g. anemia of chronic inflammation), the chronicity and duration of hepcidin activity exceed seven days. That being said, hepcidin has been known to increase in as few as four hours following increases in serum iron levels (27), so it may simply be true that hepcidin is not a key molecular player in ICH pathogenesis. Further research on this regulatory mediator may help elucidate its role.
Notably, each of the clinical metrics evaluated (APACHE II, GCS, ICH Score, and NIHSS) correlated with ferritin levels upon day 7. However, APACHE II was the only metric that came close to correlating with hospital admission ferritin levels (Table 2, r = 0.380, p = 0.067). This finding appears to suggest two things. First, the ICU scale of illness severity based largely on physiological measurements is associated most strongly with biomarker values (indeed, APACHE II was the only clinical metric associated with CD163 serum levels on day 1 as well). This is in agreement with recent findings that suggest that the APACHE II scale successfully predicts severity and outcome of ICH (28). Secondly, it appears that, despite not initially correlating with iron levels, each clinical metric has some capacity to predict iron levels seven days after admission. As these metrics are posited as markers of stroke severity and prognostic indicators of mortality, these findings suggest that serum ferritin relates to outcome disability as well; as a biomarker, ferritin gives a window of insight into the underlying pathophysiology by which iron exposure mediates neural damage.
Whereas ferritin levels appeared to rise uniformly from day 1 to day 7, CD163 levels subtly rose in those with good outcomes and fell in those with poor outcomes. Though the phenomenon observed here is only a trend rather than a significant relationship, it potentially illustrates a proof of concept. Prior research on human subjects using immunohistochemical staining of peri-infarcted tissue has reported that CD163 appears to rise steadily throughout the first 72 hours of stroke (29). While the same was observed in serum concentrations for subjects with good functional outcomes, mean serum CD163 levels fell from day 1 to day 7, suggesting a possible mechanism by which CD163-mediated activation of macrophages is protective. Of note, there is conflicting agreement about the role of CD163-positive macrophages in other cerebrovascular disorders; recent studies on autopsied brain arteriovenous malformations and angiogenesis found increased concentrations of these cell types in hemorrhagic regions (30), though there remains a possibility that these macrophages, rather than contributing to pathological consequences, are recruited to hemorrhagic regions to assist in reducing heme toxicity (31). The retrospective nature of our study limits our ability to conjecture on mechanistic explanations; however, it does appear that those with poorer functional outcomes had, on average, elevated levels of CD163 immediately following stroke when compared to those patients with good outcomes. While this result implies that CD163 is a marker for stroke severity, it does not contradict the hypothesis that CD163-positive macrophages function to promote clot absorption and recovery of neurological function, as has been previously proposed (32).
This study has several limitations. First of all, the serum samples, while prospectively collected, were retrospectively analyzed after follow-up data had been obtained. In order to strengthen the robustness of the patterns explained above, prospective data collection and bioassays should be conducted. Secondly, the sandwich ELISA technique, while well validated in research, is prone to error; outliers in standard lines were accounted for as appropriate, but a larger sample size would add more validity to these findings. Finally, the analysis would benefit from a larger sample size in general. While this study was restricted to fewer subjects by nature of its retrospective design, a prospective study unhampered by such constraints could greatly strengthen these preliminary findings. Nonetheless, the results here are in support of the hypothesis that iron-mediated inflammation and CD163-positive macrophages are involved in the prolonged neural damage that characterizes poor functional outcomes.
Conclusion
Despite the overwhelming morbidity and mortality associated with ICH, many multifactorial hypotheses about molecular mediators of secondary damage and impaired functional outcomes remain untested in human populations. In this study, immunoassay techniques were used on serum samples from 41 patients suffering from ICH in order to elucidate patterns in CD163, ferritin, hepcidin, and their correlations to functional outcomes. While findings on hepcidin were largely inconclusive, mean serum CD163 levels on day 1 were elevated in those with poor outcomes; mean serum ferritin levels at both time points were elevated in those with poor outcomes at 3 months, though this effect was only present at a trend-level effect at 12 months. Future prospective research examining CD163 macrophage polarization in human subjects and ferritin levels following ICH may contribute to the growing body of research exploring its role in the debilitating neurological consequences of intracerebral hemorrhage.
Aims.
Confirm the associations between functional outcomes and clinical scales used to prognosticate patients with intracerebral hemorrhage
Examine the correlations between clinical scales and serum biomarker concentrations related to iron toxicity, including ferritin, CD163, and hepcidin
Probe the relationships between serum ferritin, CD163, and hepcidin values obtained during hospitalization for intracerebral hemorrhage and functional outcomes at 3 and 12 months
Acknowledgments
Grant Support: the following NIA grant supported the first and second authors for this paper: T35AG044303
Footnotes
Publisher's Disclaimer: This is a PDF file of an unedited manuscript that has been accepted for publication. As a service to our customers we are providing this early version of the manuscript. The manuscript will undergo copyediting, typesetting, and review of the resulting proof before it is published in its final citable form. Please note that during the production process errors may be discovered which could affect the content, and all legal disclaimers that apply to the journal pertain.
References
- 1.van Asch CJ, Luitse MJ, Rinkel GJ, et al. Incidence, case fatality, and functional outcome of intracerebral haemorrhage over time, according to age, sex, and ethnic origin: a systematic review and meta-analysis. Lancet Neurol. 2010;9(2):167–176. doi: 10.1016/S1474-4422(09)70340-0. [DOI] [PubMed] [Google Scholar]
- 2.Herbstein DJ, Schaumburg HH. Hypertensive intracerebral hematoma: An investigation of the initial hemorrhage and rebleeding using chromium Cr 51-labeled erythrocytes. Arch Neurol. 1974;30:412–414. doi: 10.1001/archneur.1974.00490350070013. [DOI] [PubMed] [Google Scholar]
- 3.Keep RF, Hua Y, Xi G. Intracerebral haemorrhage: Mechanisms of injury and therapeutic targets. Lancet Neurol. 2012;11(8):720–731. doi: 10.1016/S1474-4422(12)70104-7. [DOI] [PMC free article] [PubMed] [Google Scholar]
- 4.Wang J, Doré S. Inflammation after intracerebral hemorrhage. J Cereb Blood Flow Metab. 2007;27(5):894–908. doi: 10.1038/sj.jcbfm.9600403. [DOI] [PubMed] [Google Scholar]
- 5.Gao C, Du H, Hua Y, et al. Role of red blood cell lysis and iron in hydrocephalus after intraventricular hemorrhage. J Cereb Blood Flow Metab. 2014;34(6):1070–1075. doi: 10.1038/jcbfm.2014.56. [DOI] [PMC free article] [PubMed] [Google Scholar]
- 6.Chen Z, Gao C, Hua Y, et al. Role of iron in brain injury after intraventricular hemorrhage. Stroke. 2011;42(2):465–470. doi: 10.1161/STROKEAHA.110.602755. [DOI] [PMC free article] [PubMed] [Google Scholar]
- 7.Huang FP, Xi G, Keep RF, et al. Brain edema after experimental intracerebral hemorrhage: Role of hemoglobin degradation products. J Neurosurg. 2002;96(2):287–293. doi: 10.3171/jns.2002.96.2.0287. [DOI] [PubMed] [Google Scholar]
- 8.Xi G, Keep RF, Hoff JT. Erythrocytes and delayed brain edema formation following intracerebral hemorrhage in rats. J Neurosurg. 1998;89(6):991–996. doi: 10.3171/jns.1998.89.6.0991. [DOI] [PubMed] [Google Scholar]
- 9.Gu Y, Hua Y, Keep RF, et al. Deferoxamine Reduces Intracerebral Hematoma-Induced Iron Accumulation and Neuronal Death in Piglets. Stroke. 2009;40(6):2241–2243. doi: 10.1161/STROKEAHA.108.539536. [DOI] [PMC free article] [PubMed] [Google Scholar]
- 10.Wang G, Hu W, Tang Q, et al. Effect comparison of both iron chelators on outcomes, iron deposit, and iron transporters after intracerebral hermorrhage in rats. Mol Neurobiol. 2016;53(6):3576–3585. doi: 10.1007/s12035-015-9302-3. [DOI] [PubMed] [Google Scholar]
- 11.Zhao F, Hua Y, He Y, et al. Minocycline-induced attenuation of iron overload and brain injury after experimental intracerebral hemorrhage. Stroke. 2011;42(12):3587–3593. doi: 10.1161/STROKEAHA.111.623926. [DOI] [PMC free article] [PubMed] [Google Scholar]
- 12.Xiong XY, Chen J, Zhu WY, et al. Serum hepcidin concentrations correlate with serum iron level and outcome in patients with intracerebral hemorrhage. Neurol Sci. 2015;36(10):1843–1849. doi: 10.1007/s10072-015-2266-2. [DOI] [PubMed] [Google Scholar]
- 13.de la Ossa NP, Sobrino T, Silva Y, et al. Iron-related brain damage in patients with intracerebral hemorrhage. Stroke. 2010;41(4):810–813. doi: 10.1161/STROKEAHA.109.570168. [DOI] [PubMed] [Google Scholar]
- 14.Yang G, Hu Rong, Zhang C, et al. A combination of serum iron, ferritin and transferrin predicts outcome in patients with intracerebral hemorrhage. Sci. Rep. 2016;6:21970. doi: 10.1038/srep21970. [DOI] [PMC free article] [PubMed] [Google Scholar]
- 15.Hu X, Leak RK, Shi Y, et al. Microglial and macrophage polarization – new prospects for brain repair. Nat Rev Neurol. 2015;11(1):56–64. doi: 10.1038/nrneurol.2014.207. [DOI] [PMC free article] [PubMed] [Google Scholar]
- 16.Zhao H, Garton T, Keep RF, et al. Microglia/macrophage polarization after experimental intracerebral hemorrhage. Transl Stroke Res. 2015;6(6):407–409. doi: 10.1007/s12975-015-0428-4. [DOI] [PMC free article] [PubMed] [Google Scholar]
- 17.Cao S, Zheng M, Hua Y, et al. Hematoma changes during clot resolution after experimental intracerebral hemorrhage. Stroke. 2016;47(6):1626–1631. doi: 10.1161/STROKEAHA.116.013146. [DOI] [PMC free article] [PubMed] [Google Scholar]
- 18.Dang G, Yang Y, Wu G, et al. Early erythrolysis in the hematoma after experimental intracerebral hemorrhage. Translational Stroke Res. 2016 doi: 10.1007/s12975-016-0505-3. [DOI] [PMC free article] [PubMed] [Google Scholar]
- 19.Knaus WA, Draper EA, Wagner DP, Zimmerman JE. APACHE II: a severity of disease classification system. Crit Care Med. 1985;13(10):818–829. [PubMed] [Google Scholar]
- 20.Teasdale G, Jennett B. Assessment of coma and impaired consciousness. A practical scale. Lancet. 1974;2(7872):81–84. doi: 10.1016/s0140-6736(74)91639-0. [DOI] [PubMed] [Google Scholar]
- 21.Hemphill JC, Bonovich DC, Besmertis L, et al. The ICH score: a simple, reliable grading scale for intracerebral hemorrhage. Stroke. 2001;32(4):891–897. doi: 10.1161/01.str.32.4.891. [DOI] [PubMed] [Google Scholar]
- 22.Goldstein LB, Bertels C, Davis JN. Interrater reliability of the NIH stroke scale. Arch Neurol. 1989;46(6):660–662. doi: 10.1001/archneur.1989.00520420080026. [DOI] [PubMed] [Google Scholar]
- 23.Wang C-W, Liu Y-J, Lee Y-H, et al. Hematoma shape, hematoma size, Glasgow coma scale and ICH score: Which predicts the 30-day mortality better for intracerebral hematoma? PLoS One. 2014;9(7):e102326. doi: 10.1371/journal.pone.0102326. [DOI] [PMC free article] [PubMed] [Google Scholar]
- 24.van Swieten JC, Koudstaal PJ, Visser MC, Schouten HJ, van Gijn J. Interobserver agreement for the assessment of handicap in stroke patients. Stroke. 1988;19(5):604–607. doi: 10.1161/01.str.19.5.604. [DOI] [PubMed] [Google Scholar]
- 25.Witsch J, Frey HP, Patel S, et al. Prognostication of long-term outcomes after subarachnoid hemorrhage: The FRESH score. Ann Neurol. 2016;80(1):46–58. doi: 10.1002/ana.24675. [DOI] [PubMed] [Google Scholar]
- 26.Hua Y, Nakamura T, Keep RF, et al. Long-term effects of experimental intracerebral hemorrhage: The role of iron. J Neurosurg. 2006;104(2):305–312. doi: 10.3171/jns.2006.104.2.305. [DOI] [PubMed] [Google Scholar]
- 27.Girelli D, Trombini P, Busti F, et al. A time course of hepcidin response to iron challenge in patients with HFE and TFR2 hemochromatosis. Haematologica. 2011;96(4):500–506. doi: 10.3324/haematol.2010.033449. [DOI] [PMC free article] [PubMed] [Google Scholar]
- 28.Huang Y, Chen J, Zhong S, et al. Role of APACHE II scoring system in the prediction of severity and outcome of acute intracerebral hemorrhage. Int J Neurosci. 2016;126(11):1020–1024. doi: 10.3109/00207454.2015.1099099. [DOI] [PubMed] [Google Scholar]
- 29.Liu B, Hu B, Shao S, et al. CD163/hemoglobin oxygenase-1 pathway regulates inflammation in hematoma surrounding tissues after intracerebral hemorrhage. J Stroke Cerebrovasc Dis. 2015;24(12):2800–2809. doi: 10.1016/j.jstrokecerebrovasdis.2015.08.013. [DOI] [PubMed] [Google Scholar]
- 30.Nakamura Y, Sugita Y, Nakashima S, et al. Alternatively activated macrophages play an important role in vascular remodeling and hemorrhaging in patients with brain arteriorvenous malformation. J Stroke Cerebrovasc Dis. 2016;25(3):600–609. doi: 10.1016/j.jstrokecerebrovasdis.2015.11.034. [DOI] [PubMed] [Google Scholar]
- 31.Schaer CA, Schoedon G, Imhof A, Kurrer MO, Schaer DJ. Constitutive endocytosis of CD163 mediates hemoglobin-heme uptake and determines the noninflammatory and protective transcriptional response of macrophages to hemoglobin. Circ Res. 2006;99(9):943–950. doi: 10.1161/01.RES.0000247067.34173.1b. [DOI] [PubMed] [Google Scholar]
- 32.Xie WJ, Yu HQ, Zhang Y, Liu Q, Meng HM. CD163 promotes hematoma absorption and improves neurological funcitons in patients with intracerebral hemorrhage. Neural Regen Res. 2016;11(7):1122–1127. doi: 10.4103/1673-5374.187047. doi 0.4103/1673-5374.187047. [DOI] [PMC free article] [PubMed] [Google Scholar]