

ABSTRACT
Members of the MiT transcription factor family are pivotal regulators of several lineage-selective differentiation programs. We show that two of these, Tfeb and Tfe3, control the regulator of adipogenesis, peroxisome proliferator-activated receptor γ2 (Pparγ2). Knockdown of Tfeb or Tfe3 expression during in vitro adipogenesis causes dramatic downregulation of Pparγ2 expression as well as adipogenesis. Additionally, we found that these factors regulate Pparγ2 in mature adipocytes. Next, we demonstrated that Tfeb and Tfe3 act directly by binding to consensus E-boxes within the Pparγ transcriptional regulatory region. This transcriptional control also exists in vivo, as we discovered that wild-type mice in the fed state increased their expression of Tfe3, Tf3b, and Pparγ in white adipose tissue. Furthermore, Tfe3 knockout (Tfe3KO) mice in the fed state failed to upregulate Pparγ and the adiponectin gene, a Pparγ-dependent gene, confirming the in vivo role for Tfe3. Lastly, we found that blood glucose is elevated and serum adiponectin levels are suppressed in the Tfe3KO mice, indicating that the Tfe3/Tfeb/Pparγ2 axis may contribute to whole-body energy balance. Thus, we offer new insights into the upstream regulation of Pparγ by Tfe3/Tf3b and propose that targeting these transcription factors may offer opportunities to complement existing approaches for the treatment of diseases that have dysregulated energy metabolism.
KEYWORDS: adipocyte, transcription, Tfeb, Tfe3, Pparγ, development, Tfe3KO mouse
INTRODUCTION
The microphthalmia (MiT) family of transcription factors, including Mitf, Tfe3, Tfeb, and Tfec, share a highly homologous basic helix-loop-helix-leucine zipper DNA binding and dimerization domain, reviewed in reference 1. These transcription factors homodimerize or heterodimerize in all combinations and bind to E-box motifs (2–5), suggesting that they may regulate common targets. The members of this family are implicated in essential developmental and cellular processes in a number of cell types, including melanocytes, bone marrow-derived mast cells, osteoclasts, T and B cells, macrophages, myotubes, and adipocytes (4–10). During development, Tfeb is implicated in the vascularization of placenta and Tfe3 in the exit from pluripotency (11, 12). It has been shown that expression of MiT family members is altered by translocation and amplification in various cancer cells, including those which dysregulate TFE3 or TFEB expression, particularly in renal carcinomas and sarcomas (13, 14).
Recently it was shown that Tfe3 and Tfeb transactivate E-box-containing promoters of genes implicated in metabolism (9, 10, 15–18). These findings indicate that while there may be common targets for certain MiT members, the individual factors may also regulate unique target genes or exhibit distinct expression patterns which result in lineage-specific gene expression. Genetically this is manifested by various degrees of functional compensation by family members. The most vivid example of this is the targeted disruption of Tfeb in mice, which causes embryonic lethality at 9.5 to 10.5 days and serious defects in placental vascularization, whereas Mitf and Tfe3 exhibit important, though functionally redundant, roles in osteoclast development (12). The Tfe3 knockout (Tfe3KO) mouse is viable, and Mitf mutant mice are viable, with only lineage-selective deficiencies involving melanocytes, osteoclasts, mast cells, and certain other hematopoietic lineages (19–21).
Molecular studies of adipocyte differentiation have revealed a transcription factor cascade that results in stimulation of the key regulator peroxisome proliferator-activated receptor γ2 (Pparγ2), and consequently, adipocyte-specific gene expression (22, 23). Pparγ belongs to the nuclear hormone receptor superfamily and regulates gene expression upon heterodimerization with the retinoid X receptor by binding to peroxisome proliferator response elements (PPREs) in the promoter/enhancer regions of target genes (24). The receptor family includes the isotypes Pparγ, Pparα, and Pparβ/δ, which participate in lipid and glucose metabolism in various tissues. These factors function as important sensors of fatty acids and fatty acid derivatives. Pparγ is a critical factor not only for adipogenesis and glucose metabolism but also for skeletal muscle metabolism (reviewed in reference 25). The Pparγ gene produces two isoforms, Pparγ1and Pparγ2, with Pparγ2 being selectively expressed in adipocytes (26–28). Their importance in human metabolism emerged when they were demonstrated to be the target of the thiazolidinedione (TZD) class of insulin-sensitizing drugs (reviewed in references 23, 29, and 30).
Normal metabolic balance is maintained by an intricate homeostatic system involving multiple tissues and organs. Obesity and diabetes occur when various portions of this system are dysfunctional. Adipose tissue plays an active role in metabolic regulation, secreting a variety of hormones (adipokines) that actively function to regulate appetite (leptin) in the brain and improve glucose utilization and fatty acid oxidation in liver and muscle (adiponectin [AdipoQ]) (31, 32). Despite the importance of adipose tissue as an endocrine organ, our understanding of the mechanism by which precursor cells become adipocytes remains incomplete. A crucial missing step to understanding this process is the quantitative and temporal characterization of transcriptional regulators, such as those which control Pparγ2 expression early in adipogenesis.
A previous finding showed the role of the MiT family of transcription factors in metabolism. Ectopic expression of Tfe3 in mouse liver and muscle results in upregulation of genes involved in insulin signaling and glucose metabolism, while overexpression in adipose tissue causes a decrease in expression of genes implicated in lipid metabolism (9, 15). Because white adipose tissue (WAT) plays a major role in the control of whole-body metabolism, we investigated the role of MiT transcription factors (Tfeb and Tfe3) in the regulation of this tissue. We examined how these factors transcriptionally regulate adipogenesis and maintenance. We found that Tfeb and Tfe3 play a major role in regulating Pparγ2 expression in early adipogenesis and in maintaining its level later in mature adipocytes, in vitro and in vivo. We also found that nutritional manipulations (fasting and refeeding) regulate Tfe3 and Tfeb levels. Thus, nutritional status contributes to the regulation of MiT factors and of Pparγ2, and consequently, Pparγ2 target genes, such as the AdipoQ gene in WAT, potentially instigate metabolic imbalances, including glucose homeostasis and disease.
RESULTS
Tfeb and Tfe3 transcription factors are expressed in tissues involved in whole-body energy metabolism.
Given prior evidence that Tfe3 participates in metabolic regulation of various tissues (9, 15, 16, 18) and the structural/functional overlap among members of the MiT transcription factor family (4, 14, 33), we decided to investigate their expression levels in several organs after a 16-h fasting and 12-h refeeding of C57BL/6J (B6) mice. As shown in Fig. 1A, qPCR levels of Tfeb increased significantly in heart, WAT, brown adipose tissue (BAT), and muscle tissues after refeeding and Tfe3 levels (Fig. 1B) increased significantly in liver, WAT, BAT, and muscle tissues, which is intriguing because these tissues are all involved in whole-body energy metabolism. The changes in mRNA expression levels of these transcription factor genes suggest that Tfe3 and Tfeb are responsive to nutritional conditions and that their own activities might be involved in the regulation of genes related to nutrient handling and energy metabolism in a tissue-dependent manner.
FIG 1.

Tissue distribution of Tfeb, Tfe3, Pparγ2, and the acidic ribosomal phosphoprotein P0 (36b4) in fasted (16 h) and refed (12 h) C57BL/6J mice. Total RNA was obtained from each tissue, reverse transcribed, and analyzed for gene expression by real-time RT-PCR. Data were normalized to 18S and are means ± SD, relative to spleen (n = 3). *, P < 0.05; **, P < 0.02; ***, P < 0.005 (Student's t test [two tailed]).
mRNA levels of Pparγ2 (Fig. 1C) were also examined and found to be affected by fasting and refeeding, specifically in BAT and WAT. Fasting decreases and refeeding elevates levels of Pparγ2 expression, an effect described previously (27, 34). The high expression of Tfe3 and Tfeb in WAT prompted us to investigate their role during adipocyte differentiation.
Tfeb is upregulated during adipocyte differentiation.
To evaluate the role of Tfe3 and Tfeb during adipogenesis, we used a well-characterized in vitro cellular differentiation model that strongly approximates what occurs in vivo by using the 3T3-L1 cell line (35). A time course of differentiation was carried out to characterize the temporal expression of Tfe3 and Tfeb. Protein levels of Tfeb, Tfe3, Pparγ, and C/ebpβ were measured by Western blotting (Fig. 2A). In agreement with prior studies (36, 37), Pparγ2 was robustly induced on day 2, and levels of C/ebpβ were transiently upregulated during day 1 and day 2.
FIG 2.

Tfeb expression increases, while Tfe3 levels of phosphorylation change, during adipocyte differentiation. (A) Western blot analysis of transcriptional regulators, Tfeb and Tfe3, during adipogenesis. 3T3-L1 cells at 2 days postconfluence (day 0 [d0] of differentiation) were induced to differentiate by the addition of a hormonal cocktail consisting of 5 μg/ml of insulin (INS), 0.5 mM 1-methyl-3-isobutylxanthine (IBMX), and 1 μM dexamethasone (DEX) for the initial 2 days, followed by 5 μg/ml of insulin for remaining time. Protein extracts were prepared from differentiating cells at the indicated times; the kinetics of protein expression for the indicated proteins is shown. PI-3K was used as a loading control. Upper arrow, phosphorylated Tfe3; lower arrow, unphosphorylated Tfe3. (B) Tfeb, Tfe3, Pparγ2, adiponectin, and 36b4 gene expression during differentiation of 3T3-L1 cells into adipocytes by real-time RT-PCR. Data were normalized to 18S and are means ± SD, relative to day 0 (n = 3). *, P < 0.05 (Student's t test [two tailed]).
Tfeb was induced at day 1 and continued increasing during the differentiation process. This observation suggests that Tfeb expression is regulated during adipogenesis and that its induced expression precedes that of Pparγ. While protein levels of Tfe3 did not change significantly, the phosphorylation state did. A mobility shift pattern on PAGE gels has been previously shown to arise via phosphorylation of Tfe3 by mitogen-activated protein kinase (MAPK) (19). The MAPK phospho-acceptor serine is conserved between Mitf, Tfe3, Tfeb, and Tfec (38–40) and is recognized by a previously generated phospho-specific antibody (19). To ascertain whether the Tfe3 mobility shift following addition of the differentiation cocktail in 3T3-L1 cells involves the same MAPK consensus site, immunoprecipitations with the phospho-specific antibody and with the anti-Tfe3 antibody were followed by immunoblotting with the anti-Tfe3 antibody (Fig. 3A). A strong phosphorylated band was immunoprecipitated at 5 min; this phosphorylation decreased by 60 min. The mobility shift was abrogated by pretreatment with MEK inhibitor U0126 (Fig. 3B). It has been previously reported that the MAPK/extracellular signal-regulated kinase (ERK) pathway is critical in regulating adipocyte differentiation (41). ERK phosphorylation occurs rapidly and transiently, within an hour following exposure to the differentiation cocktail during adipogenesis (41). Evidence that the phosphorylation of Tfe3 is functionally important is addressed below.
FIG 3.

Cocktail of differentiation induces MAPK/ERK signaling and mobility shift of Tfe3 during adipogenesis. 3T3-L1 cells were starved for 12 h and subsequently stimulated with cocktail of differentiation without (A) or with (B) U0126 pretreatment for 30 min. Cells were lysed and total protein was separated by 8% SDS-PAGE and probed with either anti-phosphoP73 antibody or anti-Tfe3 antibody that recognizes both phosphorylated and unphosphorylated Tfe3. The phosphorylation of Tfe3 at the MAPK consensus site (serine 119) occurs at 5 min after addition of cocktail and decreases in a period of 1 h. Phosphorylated Tfe3 is indicated with the top arrow. Abbreviations: DC, differentiation cocktail; BC, before addition of cocktail.
The mRNA levels of Pparγ2, Tfeb, Tfe3, and AdipoQ, encoded by a Pparγ target gene, were also determined during adipocyte differentiation (Fig. 2B). Tfeb mRNA levels increased significantly (P < 0.05), whereas levels of Tfe3 mRNA remained stable. Levels of Pparγ2 increased significantly at 48 h (P < 0.01), and its target gene, the AdipoQ gene, increased subsequently (at day 3 [P < 0.05]). Because of the early increase in the level of Tfeb, it appeared plausible that Tfeb may play a functional role in subsequent differentiation events.
Tfe3 and Tfeb are required for the induced expression of Pparγ and subsequently for adipogenic genes.
To evaluate the function of Tfeb and Tfe3 during adipocyte differentiation, we knocked down the two transcription factors independently. 3T3-L1 cells (preadipocytes) were stably transduced with lentiviral vectors expressing three different small hairpin RNAs (shRNA) that were targeted at the mRNA of Tfe3 or Tfeb. As a control, we used a shRNA targeting Pparγ2 (42) and an shRNA targeting luciferase mRNA (43). After confluence, the cells were treated with the standard differentiation cocktail, which consisted of insulin (INS), dexamethasone (DEX), isobutylmethylxanthine (IBMX), and fetal bovine serum (FBS) (44), and were stained at day 7 with Oil Red O. Knocking down Tfe3, Tfeb, or Pparγ2 resulted in a significant decrease in lipid accumulation compared with the control shRNA luciferase (Fig. 4A). The reduced lipid accumulation correlated with a decrease in Tfeb mRNA and protein and with a decrease in Tfe3 mRNA and protein (Fig. 4B and C), suggesting that the presence of both proteins is required during adipogenesis. We next investigated whether knocking down Tfe3 or Tfeb affected levels of the key regulators of adipogenesis: Pparγ2 and C/ebpα. As shown in Fig. 4B and C, both mRNA and protein levels of Pparγ2 and C/ebpα were diminished significantly. Since C/ebpα is known to be regulated by Pparγ (45), it is uncertain whether its downregulation in this experiment might have been due to a direct effect of Tfe3/Tfeb, or as a consequence of Pparγ downregulation. We additionally examined the level of expression of the AdipQ gene, a well-known Pparγ target gene. AdipoQ expression was compromised upon knockdown of Tfe3 or Tfeb (Fig. 4C). We confirmed the effects of knocking down Tfe3 and Tfeb during adipogenesis using another cell line: C3H10T1/2 (data not shown).
FIG 4.

Knocking down either Tfe3 or Tfeb impairs adipocyte differentiation. (A) (Left) Scanned cell culture dishes showing Oil Red O staining (day 7) of 3T3-L1 cells treated with shRNAs. Mock cells are cells from day 0 (d0); positive-control cells have shRNA targeted to luciferase (shLuciferase) and knocked down to Tfeb (shTfeb#3, shTfeb#4, and shTfeb#5) or knocked down to Tfe3 (shTfeb3#3, shTfeb3#4, and shTfeb3#5). (Right) Microscopy images of the Oil Red O staining (day 7) of 3T3-L1 cells shown on the left (magnification, ×248). (B) Western blot analysis of transcriptional regulators after knocking down either Tfeb or Tfe3. 3T3-L1 cells were stably transduced with the respective shRNAs shown in panel A, and after reaching confluence, cells were exposed to the differentiation cocktail. At day 7, protein extracts were obtained and analysis of transcription factors was carried out. Controls are mock cells at day 0, shPparγ2, and shLuciferase. (C) Gene expression analysis of transcriptional regulators after knocking down either Tfeb or Tfe3. 3T3-L1 cells were stably transduced with the respective shRNAs, and after reaching confluence, cells were exposed to the differentiation cocktail. At day 7, total RNA was harvested and reverse transcribed, and gene expression was analyzed by real-time RT-PCR. Data were normalized to 18S and are means ± SD, relative to day 0 (n = 3). *, P < 0.05 (Student's t test [two tailed]).
Knockdown of Tfe3 was seen to trigger diminished expression of Tfeb. In contrast, knockdown of Tfeb did not affect Tfe3 levels. This effect was also observed in the C3H10T1/2 cell line. To evaluate whether Tfe3 directly binds the regulatory region of the mouse Tfeb gene in 3T3L1 cells, we performed a chromatin immunoprecipitation (ChIP) experiment and examined binding on five E-box candidates located in the intron 1 region of Tfeb. We found that Tfe3 and RNA polymerase II phospho-serine 2 (PolII-S2) are recruited during adipogenesis to one of the E boxes, located at bp +6146 from the TSS (Fig. 5).
FIG 5.

Tfe3 is recruited at the Tfeb regulatory region during adipogenesis. E-box candidates are indicated in intron 1. The experimental procedure described in the legend to Fig. 11.
In order to evaluate the interaction of Tfeb and Tfe3 during adipogenesis, we performed immunoprecipitation (IP) using 3T3-L1 cells at day 0 (preadipocytes) and days 2 and 7 after the addition of the differentiation cocktail (Fig. 6). By IP/Western analysis of the endogenous proteins, Tfeb and Tfe3 appeared to interact from day 2, when Tfeb levels begin to increase; the interaction was stronger at day 7, when Tfeb levels were elevated. The interaction was not detectable on day 0, when levels of Tfeb were very low. We also evaluated interactions between Tfe3, Tfeb, and Pparγ, since Pparγ is known to occupy and regulate its own promoter (42, 46). The Tfeb antibody coprecipitated Tfe3 and Pparγ at days 2 and 7 of the differentiation process. Tfe3 seemed also to weakly coprecipitate with Pparγ, suggesting that they may reside in a common multiprotein complex. The Pparγ antibody used in this study was unable to coprecipitate Tfeb effectively, but it was able to coprecipitate Tfe3 at day 7. It is likely that the epitope of Pparγ from which the antibody was derived might not be exposed when complexed with Tfeb.
FIG 6.
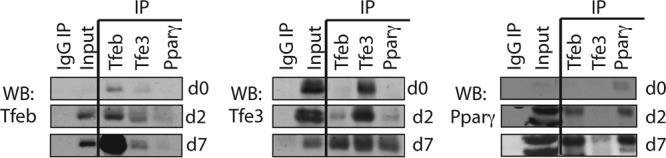
Tfe3 and Tfeb interact with each other and with Pparγ2 during adipocyte differentiation. Whole-cell protein lysates from 3T3-L1 cells at day 0, day 2, and day 7 were precleared and incubated with gel-immobilized anti-Tfeb, anti-Tfe3, anti-Pparγ, or IgG. After washes, immunoprecipitated lysates were eluted and subjected to Western blot analysis using antibodies against Tfe3, Tfeb, and Pparγ.
In summary, these observations demonstrate that Tfe3 and Tfeb are required for adipogenesis. Additionally, Tfe3 appears to be necessary for induction of Tfeb during adipogenesis, and both Tfeb and Tfe3 appear to be functionally important in the induction of Pparγ2.
Function of Tfeb is required in early and late stages of differentiation.
To investigate whether Tfe3 and/or Tfeb transcriptional activity is required early and late in the differentiation process, we separately knocked down Tfeb and Tfe3 in already differentiated cells at day 2 (when Pparγ2 begins to be expressed) and at day 5. These experiments were performed using pools of small interfering RNA (siRNA) for mouse Tfe3 and separately for pools of siRNA for mouse Tfeb. A nontargeting pool of siRNA was used as a negative control. 3T3-L1 differentiated cells at day 2 and day 5 were transfected with the corresponding siRNA pools, and after 72 h, RNA was purified to perform real-time reverse transcription-PCR (RT-PCR). Figure 7 shows that knocking down Tfe3 or Tfeb in adipocytes interfered with Pparγ, C/ebpα, and AdipoQ expression in a dose-dependent fashion. Knocking down Tfe3 by siRNA at day 2 or at day 5 caused a decrease in Tfeb mRNA levels, as previously found using shRNA for Tfe3 (Fig. 7B); however, levels of Tfe3 did not change when Tfeb was knocked down (Fig. 4 and 7A). Levels of Pparγ2 and C/ebpα were even lower when Tfe3 siRNA was transfected at day 2 (Fig. 7B), as was also observed when using shRNA (Fig. 4B and C). Since knocking down of Tfe3 downregulates Tfeb expression, this appears to be equivalent to knocking down both Tfeb and Tfe3 simultaneously. Consequently, knocking down Tfe3 produced a stronger molecular effect than knocking down Tfeb only, and this, combined with their coimmunoprecipitation, suggests that Tfeb and Tfe3 may work together to activate adipocyte regulators and target genes. However, it is not possible to exclude the possibility that Tfeb functions without Tfe3 in activating Pparγ and adipogenesis.
FIG 7.

Tfe3 and Tfeb decrease Pparγ2 expression in adipocytes. Tfeb and Tfe3 were independently knocked down with siRNAs transfected into 3T3-L1 cells at day 2 and at day 5. After 72 h, total RNA was harvested and reverse transcribed. Gene expression was analyzed by real-time RT-PCR. Data were normalized to 18S and are means ± SD, relative to siRNA control (n = 4). *, P < 0.05; **, P < 0.001; ***, P < 0.0005 (Student t test [two tailed]).
At both days 2 and 5, knockdown of Tfe3 or Tfeb downregulates expression of Pparγ2 and its target genes. At day 5, the relative change in Pparγ2 was less than at day 2, probably because at day 5 there were already higher quantities of Pparγ2 present. Note that the changes in the absolute quantity of Pparγ2 were roughly the same at day 2 and at day 5, while Pparγ2 represented a smaller proportion/fraction at day 5. In summary, the effects of knocking down Tfeb and Tfe3 were about the same, indicating that both factors are involved not only in the regulation of Pparγ2 but also in the maintenance of this key regulator at later stages of the adipocyte differentiation process.
Overexpression of TFEB or TFE3 increases Pparγ2 expression and adipocyte differentiation.
To evaluate whether TFE3 and/or TFEB is sufficient to induce Pparγ2 expression, 3T3-L1 preadipocytes were stably transduced with either human TFE3 or human TFEB cDNA expression vectors. After confluence (day 0), cells were treated with the differentiation cocktail and total RNA was harvested at day 0, day 2, and day 4. Figure 8A and B show that mRNA levels of human TFEB and TFE3 are maintained during differentiation and that the overexpression did not interfere with adipogenic conversion (Fig. 8C and D). Ectopic expression of TFE3 or TFEB enhanced the expression of Pparγ2 ∼2-fold compared with that in cells transduced with the empty vector (Fig. 8C). TFE3 and TFEB were also able to significantly increase levels of the Pparγ2 target gene fatty acid binding protein 4 (aP2) ∼4-fold (Fig. 8D) but not the housekeeping (control) gene 36b4 (Fig. 8E). To confirm that TFEB and TFE3 are able to enhance Pparγ2 expression in 3T3-L1 cells before the addition of differentiation cocktail and early in differentiation, we evaluated expression at day 0 (confluent state) and day 1 (24 h after addition of cocktail). Figure 8F shows that TFEB and TFE3 significantly increase levels of Pparγ2 at day 0 (∼10-fold) and the regulation of Pparγ2 expression is even more robust at day 1 after the addition of cocktail. This indicates that signaling pathways stimulated by the differentiation cocktail are necessary to fully activate MiT factors and therefore Pparγ2. Levels of TFEB and TFE3 ectopic mRNA are indicated in Fig. 8G and H. We also evaluated the effect of the mutant TFE3 S-A during adipogenesis of 3T3-L1 preadipocytes. We overexpressed the mutant TFE3 (TFE3 S-A) in 3T3-L1 cells and determined the effect over Pparγ2 expression at day 0 and at day 1 after addition of differentiation cocktail. We found that the mutant TFE3 substantially reduced Pparγ2 mRNA levels, by approximately 50% (Fig. 8F). The level of mutant TFE3 (S-A) ectopic mRNA is indicated in Fig. 8G. These results indicate that the TFE3 MAPK phosphorylation site is functionally relevant for activation of Pparγ2.
FIG 8.

Overexpression of human TFE3 or human TFEB in 3T3-L1 increases Pparγ2 and aP2 expression. 3T3-L1 cells were stably transduced with lentivirus vectors containing cDNA for the human TFEB or TFE3. After confluence, cells were exposed to the differentiation cocktail and total RNA was harvested and reverse transcribed. Gene expression was analyzed by real-time RT-PCR and was normalized to 18S relative to empty vector. Shown are mRNA levels of TFEB (A), TFE3 (B), Pparγ2 (C), aP2 (D), and 36b4 (E) at days 0, 2, and 4 after addition of differentiation cocktail. Panel F shows that overexpression of human TFE3 or human TFEB increases Pparγ2 mRNA levels at early stages during differentiation (day 0 and day 1). Panels G and H show levels of ectopic TFE3 and TFEB at days 0 and 1. Data are means ± SD (n = 3).
Mouse Tfeb and Tfe3 directly regulate transcription of the Pparγ2 promoter.
The DNA recognition motifs which MiT family members bind is an E-box with the consensus CA(C/T)GTG. The promoter and regulatory regions of the Pparγ2 gene were analyzed using a bioinformatics approach. We analyzed transcription factor consensus elements in mice and humans (Genomatrix). We found two E-boxes in the promoter of the human PPARγ2 and four E-boxes at the mouse Pparγ2 intron 1 region (+172, +203, +4792, and +4781).
To evaluate whether Tfe3 and/or Tfeb binds and regulates the E-boxes in the mouse Pparγ2 intronic region, luciferase reporter assays were carried out. The region containing the four E-boxes was cloned into a pGL3 reporter containing luciferase driven by the simian virus 40 (SV40) promoter and tested for responsiveness to Tfe3, Tfeb, or both (Fig. 9A). We divided the intron region into two regions, R1 and R2, each of which contains a pair of E-boxes (Fig. 9A). The vector was cotransfected into 3T3-L1 preadipocytes along with combinations of full-length coding cDNA for the murine Tfeb and/or Tfe3 with the addition of the differentiation cocktail (Fig. 9B). Cotransfection with Tfeb or Tfe3 cDNAs separately increased luciferase activity ∼2-fold. When Tfeb and Tfe3 were cotransfected, the activity of the promoter was increased ∼4-fold. Site-directed mutagenesis was performed to assess the requirement of the E-box sequences. All different mutation combinations caused a reduction of promoter/luciferase activity, with the most profound suppression occurring for the second E-box in region R2.
FIG 9.

Tfeb and Tfe3 cis-activate a regulatory region of the Pparγ2 gene, and mutations of its E-boxes cause inhibition. (A) The murine Pparγ2 regulatory region (intron 1) construct. The fragment containing bp +132 to +4781 of the murine Pparγ2 intron 1 region was subcloned in the BamHI site of the pGl3 promoter vector. The positions of the E-boxes are +172, +203, +4792, and +4781. (B) 3T3-L1 preadipocytes were cotransfected with the SV40 promoter/luciferase vector containing the Pparγ2 regulatory region, the control Renilla, and the Tfeb and/or Tfe3 expression vectors. Luciferase activity was normalized to Renilla activity to control for transfection efficiency. Mutations to each E-box motif are shown (see Materials and Methods for sequences). The level of luciferase activity of the empty vector and in the absence of Tfeb and Tfe3 was defined by “1.” Fold activation was estimated to this level of activity. Values are means ± SD (n = 3).
To test whether the above-described phosphorylation of Tfe3 is important in regulating Pparγ2 expression, we mutated the MAPK consensus site of Tfe3 from serine to alanine and tested whether the mutant Tfe3 was able to activate the Pparγ2 luciferase reporter construct described in Fig. 9. Whereas wild-type Tfe3 stimulated the luciferase reporter ∼1.7-fold, the S-to-A unphosphorylatable mutant was deficient in this activity, consistent with the possibility that Tfe3 phosphorylation at this site is important in regulating Pparγ2 expression (Fig. 10). The effect of the mutant TFE3 S-A was additionally studied during adipogenesis of 3T3-L1 preadipocytes (Fig. 8F). Taken together, these results indicate that TFE3 MAPK phosphorylation site is functionally relevant for activation of Pparγ2.
FIG 10.

Mutant Tfe3 (MAPK phospho acceptor serine to alanine) does not transcriptionally stimulate the Pparγ2 regulatory region. (A) The murine Pparγ2 regulatory region (intron 1) construct was used (see Fig. 9). 3T3-L1 preadipocytes were cotransfected with the SV40 promoter/luciferase vector containing the Pparγ2 regulatory region, the control Renilla, and the Tfe3 and/or mutant Tfe3 expression vectors or empty expression vector (control). Luciferase activity was normalized to Renilla activity to control for transfection efficiency. The level of luciferase activity of the empty vector control was defined as “1.” Fold activation was estimated to this level of activity. Values are means ± SD (n = 3). (B) Western blot showing equal levels of Tfe3 (wild type) and Tfe3 (serine-to-alanine mutant).
Tfeb and Tfe3 associate with the Pparγ2 promoter during adipogenesis.
We performed a series of ChIPs to determine whether Tfe3 and Tfeb directly bind to the Pparγ2 promoter or intron 1 during adipocyte differentiation of 3T3-L1 cells (Fig. 11). We analyzed the region of the promoter where Pparγ2 binds (PPRE) at ∼900 bp upstream of the transcription start site (TSS). This PPRE was previously demonstrated to be a Pparγ binding site in chromatin immunoprecipitation on a microarray (ChIP-chip) and ChIP sequencing (ChIP-seq) experiments (42, 46). The insulin promoter served as a control, as previously described (Fig. 11D) (42).
FIG 11.

Tfeb and Tfe3 associate with the Pparγ2 promoter and regulatory region but not to the aP2 promoter region during adipogenesis. (A) Murine Pparγ2 promoter and regulatory region indicating the PPRE site and E-boxes. Primer sets used for the PCR are indicated with arrows. (B) 3T3-L1 cells at confluence (day 0) were induced to differentiate. At the indicated times, cells were processed for ChIP assays. Soluble chromatin was immunoprecipitated with preimmune IgG, anti-Tfeb, anti-Tfe3, anti-Pparγ, and anti-RNA polymerase II (phospho S2) antibodies. Immunoprecipitates were subjected to real-time PCR using primers flanking the PPRE region. (C) Immunoprecipitates were subjected to real-time PCR using primers flanking the E-box 1 region. (D) Immunoprecipitates were subjected to real-time PCR using primers flanking the E-box 2 region. (E) Immunoprecipitates were subjected to real-time PCR using primers flanking the PPRE region of the aP2 gene (42). (F) As a negative control, the insulin promoter region was amplified (42). (G) Immunoprecipitates obtained from WAT were subjected to real-time PCR using primers flanking the PPRE region. Data are means ± SD (n = 3).
Chromatin immunoprecipitation at the regulatory regions of the Pparγ2 gene indicated evidence of transient, though significant, recruitment of Tfeb, Tfe3, Pparγ, and PolII-S2 during adipocyte differentiation. We found that at day 0, Tfe3, Tfeb, and Pparγ were not present, either at the promoter region or at the intron 1 region of the Pparγ2 gene. At day 1, Tfeb, Tfe3, and Pparγ were present at the promoter and region R2, and at day 2 they reached a maximum enrichment at the promoter region, when polII-S2 began binding. At days 4 and 7, only a small recruitment of Pparγ remained at the promoter, but it was still substantial at R2 at day 4, and there was continued binding of PolII-S2 (Fig. 11B and D). However, at region R2 recruitment of PolII-S2 decreased, supporting previous data showing a decrease in Pparγ2 in the transcription by days 5 to 7 (47).
In summary, our ChIP results indicate that Tfeb and Tfe3 bind to the endogenous Pparγ2 promoter and the intronic enhancer region (which contains the E-boxes) (Fig. 11) and that they independently and synergistically activate transcription via consensus E-boxes (Fig. 9).
We were not able to detect recruitment of Tfeb and Tfe3 to region R1 on intron 1 of the Pparγ2 gene (Fig. 11C). The fact that Pparγ2 was found on intron region R2 and Tfe3 and Tfeb were found on the PPRE at the promoter region supports the idea of a looping/complex formation, which may modulate Pparγ2 expression.
We evaluated recruitment of Tfe3 and Tfeb on the Pparγ2 promoter in mouse WAT. We found that these transcription factors occupy the promoter in vivo, consistent with potential roles for them in the maintenance of Ppparγ2 expression and the adipocyte state (Fig. 11G).
Additionally, we assessed the occupancy of Tfe3 and Tfeb on the Pparγ2 aP2 target gene at the PPRE region and found that both are not recruited on that region (Fig. 11E). This result indicates that Tfe3 and Tfeb do not coregulate the aP2 gene and that the decrease in aP2 expression is indirect.
Determinant role of Tfe3 in maintaining Pparγ2 expression in WAT.
To further assess the role of Tfe3 in the regulation of Pparγ2 expression in vivo, we characterized mice with targeted deletion of the Tfe3 gene. Phenotypically, Tfe3KO mice appeared normal, although total body weights were significantly reduced (∼20% reduction in females and males) compared to those of B6 mice independent of age (Fig. 12A and data not shown). The lower body weight in Tfe3KO mice was not due to differences in food intake monitored for 24 h (Fig. 12B). The Tfe3KO mice were healthy, and their adipocytes looked normal (Fig. 12G). An important point is that with mice maintained ad libitum, fat pads were smaller in the Tfe3KO mice and body weights were lower, but the ratio of fat pad weight to body weight was the same (Fig. 12D). This ratio was different (lower) only when the mice were fasted (Fig. 12E). The weights of liver and heart were similar in The Tfe3KO and control mice; however, we found that kidneys from Tfe3KO mice were smaller than those of control mice (Fig. 12C).
FIG 12.

Role of Tfe3 in vivo in maintaining Pparγ2 and adipoQ expression in WAT. (A) Body weights of Tfe3KO and control C57BL/6J (B6) male mice 3 and 6 months old fed chow ad libitum. Data are means ± SD (n = 5). P values were determined by the Student t test (two tailed). (B) Food intake by Tfe3KO and control B6 mice determined at 3 and 6 months of age. Data represent means ± SD (n = 5 for 3-month-old mice and n = 6 for 6-month-old mice). The Student t test (two tailed) showed no significance between groups. (C) Weights of liver, heart, and kidney from Tfe3KO and B6 mice 3 months old fed chow ad libitum. Data represent means ± SD (n = 5). (D) Inguinal, retroperitoneal, and epididymal fat pad weights from Tfe3KO and B6 mice 3 months old fed chow ad libitum. Data represent means ± SD (n = 5). (E) Inguinal, retroperitoneal, and epididymal fat pad weights from Tfe3KO and B6 mice 3 months old fasted for 16 h. Data represent means ± SD (n = 5). (F) Tissue dissection of gonadal fat, liver, and kidney from representative Tfe3KO and B6 mice fed chow ad libitum. (G) Representative H&E-stained sections of WAT from Tfe3KO and control B6 mice. (H) mRNA levels of Tfe3, Tfeb, Mitf, Pparγ2, AdipoQ, and 36b4 in the WAT of Tfe3KO and B6 mice fasted for 16 h. Total RNA was obtained from WAT, reverse transcribed, and analyzed for gene expression by real-time RT-PCR. Data were normalized to 18S and represent fold change relative to that in control B6 mice. Data are means ± SD (n = 3). *, P < 0.05 by the Student t test (two tailed). (I) mRNA levels of Tfe3, Tfeb, Mitf, Pparγ2, AdipoQ, and 36b4 in the WAT of Tfe3KO and B6 mice refed for 12 h after being fasted for 16 h. Total RNA was obtained from WAT, reverse transcribed, and analyzed for gene expression by real-time RT-PCR relative to control B6 mice. Data are means ± SD (n = 3). *, P < 0.05 (Student's t test [two tailed]). (J) mRNA levels of Tfe3, Tfeb, Mitf, Pparγ2, AdipoQ, and 36b4 in the WAT of Tfe3KO and C57BL/6J mice fed chow ad libitum. Total RNA was obtained from WAT, reverse transcribed, and analyzed for gene expression by real-time RT-PCR relative to control B6 mice. Data are means ± SD (n = 3). *, P < 0.05 by the Student t test (two tailed). (K) Circulating levels of high-molecular-weight AdipoQ in blood from Tfe3KO and B6 mice fasted for 16 h or refed for 12 h. Data are means ± SD (n = 8). P values were determined by two-way ANOVA. (L and M) Blood glucose (L) and insulin (M) levels of fasted and refed Tfe3KO and B6 mice. Data are means ± SD (n = 8). P values were determined by two-way ANOVA.
Histologically, Tfe3KO mouse fat pads looked normal compared to those of B6 mice (Fig. 9G); although a trend toward smaller adipocytes was observed, it was not statistically significant.
Pparγ2 and the adipocyte AdipoQ target gene mRNA levels were measured in WAT, and no difference was found in the level of expression in Tfe3KO versus control mice maintained ad libitum (Fig. 12J). Therefore, under normal conditions, a compensatory mechanism may be involved that maintains normal levels of Pparγ2 and normal fat pad weights in the Tfe3KO mouse (Fig. 12D).
We next investigated if physiologic stress, such as fasting, could expose the Tfe3KO phenotype in WAT. Even though fat pad weights were similar in Tfe3KO and B6 mice fed ad libitum, a significant decrease in weight and size was observed after 16 h of fasting (Fig. 12E and F). Under fasting conditions, Pparγ2 mRNA levels were decreased significantly in WAT of Tfe3KO compared with B6 mice, and consequently, white fat pads were smaller (Fig. 12E, F, and H).
It was shown previously that fasting causes a significant decline in Pparγ2 mRNA levels and protein in WAT (27) and that the transcription of genes implicated in lipid synthesis (lipogenesis) and lipid catabolism (lipolysis) are controlled by Pparγ2 and modulated by strain genetic background (48, 49). The reduction in WAT fat pads during fasting of the Tfe3KO mouse may be linked to a higher lipolysis rate than in B6 mouse but cannot be linked to strain genetic background differences. Recently, Fujimoto et al. showed that Tfe3 controls gene expression of lipid metabolism in adipose tissue and therefore inhibits lipolysis in Tfe3 transgenic (aP2-Tfe3 Tg) mice (9). They found that two main lipases, Atgl and Hsl, were significantly downregulated in the transgenic mice and that Tfe3 directly controls Atgl promoter activity and indirectly decreases Foxo1 expression (9). Based on these results, we evaluated if these lipolytic enzymes were affected in the fasted Tfe3KO mice. Figure 13 shows that levels of Atgl and Hsl were significantly upregulated in the absence of Tfe3.
FIG 13.

Gene expression analysis of lipolysis-related genes in white adipose tissue from fasted B6 and Tfe3KO mice. Total RNA was extracted from WAT, reversed transcribed, and analyzed for gene expression by real-time PCR. Data are means ± SD (n = 6). *, P < 0.05 by the Student t test (two tailed).
When Tfe3KO mice were fasted for 16 h and then refed for 12 h, we did not observe an increase in Pparγ2 expression (Fig. 12I), which demonstrates that a loss of fluctuation of Pparγ2 expression occurs in the absence of Tfe3 in response to fasting and refeeding. This was not observed in B6 control mice (Fig. 1C).
Since mRNA levels of the Pparγ2 AdipoQ target gene were significantly reduced during fasting, we predicted that levels of AdipoQ in blood might be affected in the Tfe3KO mice. Thus, we determined levels of circulating AdipQ, particularly those of high molecular weight (HMW). We found that circulating HMW AdipoQ levels were significantly lower in male Tfe3KO mice than in B6 mice (P = 0.0008) (Fig. 12K). Furthermore, circulating HMW AdipoQ levels were lower in fasted and refed Tfe3KO mice than in fasted and refed B6 mice (P < 0.05) (Fig. 12K). Circulating HMW AdipoQ levels in KO females followed the same trend as in KO males, indicating that the same effect occurs in both sexes (data not shown). AdipoQ levels differ significantly by gender and therefore are not combined (50).
AdipoQ plays a major role in glucose and lipid metabolism (51, 52); therefore, it was anticipated that glucose and insulin levels may be affected in Tfe3KO mice. During fasting, levels of glucose were significantly higher in Tfe3KO mice than in control mice, without significant changes in insulin (Fig. 12K). This suggests that the effect of the KO is likely on glucose production at the level of the liver. This hypothesis is supported by the AdipoQ data, since AdipoQ functions to lower gluconeogenesis. It is reasonable that the lower AdipoQ levels in the Tfe3KO mice contributed to higher gluconeogenesis in blood from fasted mice (53, 54).
We could not study the effects of Tfeb in mice since Tfeb homozygous knockout is embryonic lethal and causes serious defects in placenta vascularization (12). Interestingly, Pparγ2 KO mice also die because of placenta vascularization defects.
DISCUSSION
WAT plays a central role in the control of energy balance and whole-body lipid and glucose homeostasis. This role is dynamically integrated through cross talk involving other organs and tissues, including liver and skeletal muscle. Aberrations of this network are directly linked to obesity and type 2 diabetes, highlighting the importance of deciphering the mechanisms of fat development and function as well as discovering key regulators of adipogenesis. Our work further refines this intricate network by demonstrating that Tfe3 and Tfeb, critical regulators of energy metabolism, also directly control the expression of Pparγ2, a master regulator of adipogenesis.
Nutrient response mediated by fasting and refeeding plays an important role in controlling key genes involved in lipid and carbohydrate metabolism, and we found that both Tfe3 and Tfeb are nutritionally regulated. Fasting caused a substantial decrease in gene expression, and refeeding caused an increase in their expression, mainly in organs implicated in whole-body energy metabolism. In independent studies Fujimoto et al. and Nakagawa et al. found that in mice, Tfe3 mRNA levels decrease during fasting in WAT (9, 15), whereas Settembre et al. found that Tfeb mRNA levels increase during fasting particularly in muscle, liver, and kidney (10). This discrepancy in results is likely due to differences in the relative measurement of fasting or feeding response. In this study, we measured feeding response after fasting, whereas Settembre et al. measured fasting response under the ad libitum condition.
During fasting, the level of blood glucose remains stable even while it is still being consumed by organs such as the brain. Thus, fasting triggers metabolic responses that activate glucose production by the liver and decrease insulin secretion in order to maintain blood glucose levels. In contrast, during refeeding, levels of glucose and insulin are elevated; therefore, the metabolic response results in activation of fuel storage and of synthesis of proteins. The overall purpose of these responses is to maintain blood glucose levels within a narrow range. Transcription factors regulating these nutritional states may also modulate Tfe3 and Tfeb expression and/or activation during fasting and refeeding. Since the genes that are implicated in the regulation of glucose homeostasis contain in their promoters insulin response elements (IRE) and carbohydrate-response elements (ChoRE), we propose that both carbohydrate and insulin are significant mediators in the expression of Tfe3 and Tfeb. To test this, we performed an in vitro experiment using 3T3-L1 cells at day 5 during differentiation. Cells were starved for 12 h and then incubated with glucose or insulin at different concentrations (Fig. 14). Both carbohydrate and insulin are able to transcriptionally and perhaps posttranslationally regulate Tfe3 and Tfeb. Both in vivo and in vitro experiments indicate nutritional regulation. Consequently, the expression of Tfe3 and Tfeb might be modulated by alterations in nutrient signaling, as occurs in obesity. This fact may explain why levels of Tfe3 are altered in obese mice (9, 15). One important sensor of cellular metabolism is the mechanistic (or mammalian) target of rapamycin (mTOR), which integrates anabolic and catabolic processes, including insulin and growth factors, in response to nutrient, oxygen, and energy levels (55, 56). Therefore, it is not surprising that the mTOR pathway is dysregulated in diabetes, obesity, and other diseases (57). Recently, it has been found that mTOR influences gene transcription by regulating the activation of PPARα and -γ, PGC1α, TFEB, and others factors. Therefore, TFEB is an important component mediating the effects of mTOR in various cellular events, including under normal or pathological conditions (56, 58–60). Further studies are required to investigate the signaling pathways involved in the regulation of MiT factor expression as well as the physiological role of the variation of MiT expression during fasting and refeeding of normal and obese mice.
FIG 14.
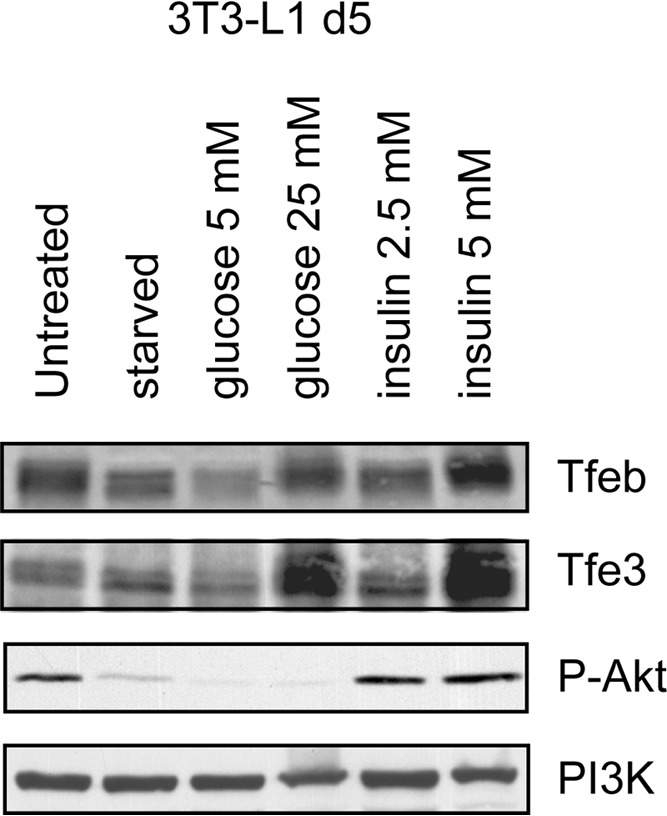
Carbohydrate and insulin are main mediators in the expression of Tfe3 and Tfeb. 3T3-L1 cells at day 5 after addition of differentiation cocktail were starved for 12 h in DMEM without glucose in the absence of FBS. Cells were then incubated for 4 h in DMEM (glucose free) supplemented with10% FBS and with glucose at two different concentrations (5 and 25 mM). Starved cells were also incubated for 4 h with DMEM (glucose free) supplemented with 10% FBS and with insulin at two different concentrations (2.5 and 5 μM). Protein extracts were prepared and analyses of Tfeb, Tfe3, and phospho-AKT were performed by Western blotting. PI-3K was used as a loading control.
Using a well-known model of adipocyte differentiation, we investigated whether levels of MiT factors change during adipogenesis. In particular, we found that Tfe3 phosphorylation state, instead of its expression level, changed during 3T3-L1 cell differentiation. We demonstrated that the phosphorylation of Tfe3 occurs through MAPK/ERK activation during the initial hour of adipogenesis (Fig. 3) and that this phosphorylation augmented the transactivation properties of Tfe3 in regulating Pparγ2 expression in vitro (Fig. 10). It is unclear how this phosphorylation may modulate Tfe3 activity during adipogenesis, although our data suggest an increase in transcriptional activity (Fig. 8F). A number of studies have linked TFEB and TFE3 phosphorylation by mTOR to sequestration into the cytoplasm of cells, thus preventing transcriptional activation under nutrient-rich conditions (18, 58–61). Nevertheless, phosphorylated TFEB on the C-terminal motif by mTOR complex 1 (mTORC1) is also localized in the nuclei of cells (62). Since TFEB is phosphorylated in numerous sites, it is likely that its translocation may involve other signaling pathways independent of mTOR. The implications of these posttranscriptional modifications for TFEB's and TFEs transcriptional activity linked to nutritional status and cell type require further investigation (62–65). Lastly, a new posttranscriptional modification was found to occur on TFEB via the osteoclast differentiation factor RANKL-dependent signaling pathway. This particular phosphorylation, on three serine residues located on the C-terminal region, induces TFEB stabilization and increases transcriptional activity (66). Knock-in mutants of Mitf at serine 73 have been reported to exhibit melanocytic phenotypic effects in certain contexts (67). Further studies are needed to establish the role phosphorylation of Tfe3 plays in vivo, specifically in tissues involved in energy metabolism.
Our results suggest that Tfe3 and Tfeb are transcription factors required for adipocyte differentiation. Knocking down either Tfe3 or Tfeb resulted in lost capacity of 3T3-L1 preadipocytes to differentiate into adipocytes, mainly due to a downregulation of Pparγ2 expression. We additionally found that Tfe3 and Tfeb function at late differentiation stages in maintaining Pparγ2 expression 5 days after addition of differentiation cocktail (Fig. 7). Overexpression of either factor enhances differentiation by increasing the expression of Pparγ2 (Fig. 8). Additionally, these transcription factors' expression and their posttranslational modifications are synchronized with the differentiation process.
There are no E-boxes in the promoter region of Pparγ2; however, Tfeb and Tfe3 chromatin immunoprecipitates were seen to contain Pparγ2 promoter sequences (Fig. 11B). One potential explanation is that Pparγ2 itself might recruit Tfeb and Tfe3 to the promoter via protein complex formation. Correspondingly, a loop could form via protein-protein interactions between region R2 on intron 1 and the PPRE region when the gene is activated.
We found that the transactivation measured by the luciferase reporter was dependent upon the E box sequences, consistent with binding by Tfe3/Tfeb. The finding that mutation of each independent E box interfered with transactivation suggests that the binding sites work in a cooperative fashion to activate expression.
Given that Tfeb and, to a lesser degree, Tfe3 are able to interact with Pparγ2 (Fig. 6) and given our demonstration of the recruitment of Tfeb and Tfe3 to the PPRE region (42, 46) of the Pparγ2 promoter (Fig. 11), an enhancer-promoter interaction may participate in the regulation of Pparγ2 expression.
It was previously shown that MiT factors are able to bring chromatin remodeler activity, including SWI/SNF and CBP/p300, on the promoter of melanocyte-specific genes (68, 69). Likewise, Tfe3 and Tfeb may also bring chromatin remodelers to the Pparγ2 promoter. Therefore, Tfe3 and Tfeb factors can function as crucial factors responsible for bringing chromatin remodelers early and late during adipogenesis.
Our finding that Pparγ2 expression is tightly controlled by MiT family factors relates Pparγ2 and Tfe3 functionally and, consequently, indicates they are both likely involved in the regulation of whole body metabolism. In support of this, we evaluated mRNA levels of Pparγ2 in Tfe3KO mice. We found that Tfe3 is pivotal in the maintenance of the adipocyte key regulator Pparγ2, even though another member of the MiT family, Mitf, seems to compensate for the absence of Tfe3, thereby increasing Tfeb mRNA levels and maintaining normal levels of Pparγ2 (Fig. 12J). However, Mitf is not able to compensate for this function with Tfeb under fasting and refeeding conditions (Fig. 9H and I). Based on our previous findings that Mitf phosphorylation via conserved MAPK consensus site increases transcriptional activity (19), it is likely that during fasting, Mitf posttranscriptional modifications decrease and there is a reduction in transcriptional activity, which is shown by a reduction in Tfeb mRNA levels decreasing the compensatory effect for Tfe3 loss. Recently, MITF ChIP-seq performed with melanocytes revealed that MITF binds the first intron of TFEB in human (chromosome 6: 41795854 to 41796487, HG18) supporting regulation via Mitf (70). Interestingly, in 3T3-L1 cells this compensatory effect does not occur, because Mitf is not expressed in this cell line. Further studies are necessary to define the Mitf compensatory mechanism that occurs in Tfe3KO mice.
Thus, our in vivo results show that WAT requires both Tfe3 and Tfeb activity to maintain levels of Pparγ2. We found that fasting decreased significantly Pparγ2 and AdipoQ mRNA levels in the WAT of Tfe3KO mice. Consequently, we found a significant increase in blood glucose levels in the fasted Tfe3KO mice that correlated with low AdipoQ production in WAT. A similar effect was found by Medina-Gomez et al. in Pparγ2 KO mice (71). Since AdipoQ suppresses hepatic gluconeogenesis, low levels caused a significant increase of glucose production in the Tfe3KO mice (53). Interestingly, in the refeeding state there was no difference in blood glucose or insulin levels, suggesting that insulin did not play a major role (Fig. 12M). Additionally, and as consequence of fasting, significant lipolysis occurs in the WAT of the KO mice, which reinforces the idea that Tfe3 plays a role (and that Tfeb and Mitf do not) in the regulation of rate-limiting enzymes for adipocyte lipolysis.
It has been reported that Tfe3 and Mitf are upregulated in the WAT of obese mice (db/db) and obese humans (72). It would be interesting to determine the role of Mitf and Tfe3 in the pathology of metabolic diseases.
Finally, clustering genes based on the recent time course expression profile during human adipocyte differentiation (73) revealed that MITF and TFE3 expression levels are tightly correlated with PPARγ, consistent with our observation that members of the MiT family of transcription factors play an essential role in regulating the expression of PPARγ. There are 480 genes in the cluster containing PPARγ, 19 of which encoded transcription factors, including MITF, TFE3, and STAT5A. Many of these transcription factors were previously reported to play important roles in adipocyte differentiation; e.g., STAT5A can induce Pparγ2 expression. This independent analysis thus further supports our finding that Tfeb and Tfe3 constitute novel regulators of adipogenesis and control the transcription of Pparγ and therefore AdipoQ, with consequences for glucose metabolism.
MATERIALS AND METHODS
Animals.
All mouse protocols were approved by the Ethics Committee for Animal Care and the Subcommittee on Research Animal Care and were carried out in accordance with the approved guidelines of the Institutional Animal Care and Use Committee (IACUC) of Massachusetts General Hospital. All C57BL/6J (B6) mice used in this study were obtained from Jackson Laboratory, ME. Tfe3 knockout (Tfe3KO) animals backcrossed to the B6 strain were provided by Nancy Jenkins, Neal Copeland, and Eirikur Steingrimsso. Tfe3KO and B6 mice were bred at our mouse facility under the same conditions and diets, with ad libitum access to food and water.
Determination of Tfe3, Tfeb, and Pparγ expression in selected organs during fasting and refeeding in control B6 mice.
A total of six B6 mice at 8 weeks old were used for determination of levels of Tfeb and Tfe3 in different organs by real-time PCR. Three mice were sacrificed after 16 h of fasting and three after 12 h of refeeding. Heart, liver, spleen, kidney, white adipose tissue (WAT), brown adipose tissue (BAT), and skeletal muscle (quadriceps) were obtained and mRNA was purified by TRIzol (Invitrogen) (74). Reverse transcription (RT) and real-time PCR were performed using Quantitect reverse transcription and QuantiFast SYBR green PCR reagent, respectively (Qiagen).
Determination of Tfe3, Tfeb, and PPARγ expression in selected organs during fasting and refeeding in control B6 versus Tfe3KO mice.
To determine levels of Tfe3, Tfeb, Mitf, Pparγ2, AdipoQ, and 36b4 in WAT, a total of six Tfe3KO mice and six B6 mice were fasted for 16 h and refed for 12 h. WAT was obtained and mRNA was purified as indicated above.
For body weights, two age groups were selected, 3 and 6 months old, with five male mice each, maintained ad libitum. After euthanasia, the total weight of each mouse was determined followed by dissection of liver, heart, kidney, and WAT pads. Individual organs and WAT pads were weighed as well. WAT pads were also dissected and weighed from Tfe3KO and B6 mice fasted for 16 h.
Histology.
Individual WAT pads were dissected and fixed in 10% formalin and sent to our histopathology core (Massachusetts General Hospital) for paraffin embedding, tissue section, and hematoxylin and eosin (H&E) staining.
Measurements of circulating biomarkers.
Serum total AdipoQ and high-molecular-weight (HMW) AdipoQ were measured by enzyme-linked immunosorbent assay (ELISA) (ALPCO Diagnostics, USA). Serum insulin was measured by ELISA (Mercodia Developing Diagnostics, Sweden) and serum glucose by the hexokinase (HK) method using a commercial kit (glucose HK assay kit; Sigma-Aldrich, USA).
Cell lines.
3T3-L1 preadipocytes were obtained from the American Type Culture Collection (ATCC) and were maintained in growth medium consisting of Dulbecco modified Eagle medium (DMEM) containing 10% calf serum and were induced to differentiate as described previously (44).
U0126 treatment.
Postconfluent 3T3-L1 preadipocytes were pretreated for 30 min with the MAPK inhibitor U0126 (at 10 μM) preceding cocktail addition. Cells were harvested at 5, 15, 30, and 60 min, and whole-cell extract was subjected to immunoprecipitations and Western blotting as indicated.
Knockdown experiments.
The lentivirus vectors (Gateway technology based) used to knock down the genes of interest by small hairpin RNA (shRNA) were previously described (43). The shRNA sequences for the mouse Tfeb and Tfe3 are found at http://www.broadinstitute.org/rnai/public, and the control Pparγ and luciferase sequences were described previously (42, 43). shRNA sequences were subcloned into a lentiviral vector. 3T3-L1 preadipocytes were infected with the corresponding lentiviral supernatants for 24 h, and then cells were selected for 2 days. Cells were split and after confluence, the differentiation cocktail was added. Cells were refed every 2 days with medium supplemented with insulin and fetal bovine serum (FBS). At day 7, cells were harvested for RNA and protein analysis.
Tfeb and Tfe3 were also knocked down by siRNA in 3T3-L1 adipocytes. We used ON-TARGETplus SMARTpool siRNAs for the mouse Tfeb and Tfe3, and as the control we used a nontargeting siRNA pool (Thermo Scientific). The siRNAs were transfected into 3T3-L1 at day 2 and day 5 of differentiation, and insulin was maintained in the medium for 72 h. RNA was harvested and analysis of gene expression was performed by RT-PCR.
Of note, Tfe3 and Tfeb knockdown vectors did not exhibit any sequence cross-reactivity.
Overexpression experiments.
We subcloned the human TFEB and TFE3 cDNAs into lentivirus vectors (43). An empty vector was used as the control. 3T3-L1 preadipocytes were infected with the corresponding lentiviral supernatants for 24 h, and then cells were selected for 2 days. Cells were split, and after confluence the differentiation cocktail was added (48 h). Cells were refed every 2 days with medium supplemented with insulin and FBS. Three time points were selected, day 0 (no cocktail) and days 2 and 4 after addition of cocktail for RNA analysis.
Oil Red O staining.
Oil Red O staining was performed as described in reference 47.
RNA analysis.
RNA from cell cultures was isolated using RNeasy (Qiagen) and analyzed after reverse transcription by real-time PCR.
For RT-PCR, a total of RNA (0.5 μg) was reverse transcribed with QuantiTect reverse transcription reagent (Qiagen). cDNA was amplified by RT-PCR with QuantiFast SYBR green PCR master mix (Qiagen). The sequences of the primers used were 5′-GCATGGTGCCTTCGCTGATGC-3′ and 5′-AGGCCTGTTGTAGAGCTGGGT-3′ for mouse Pparγ2, 5′-GAACGACGCAGGCGATTCAACATT-3′ and 5′-ATCCACAGATGC CTTCAGGATGGT-3′ for mouse Tfe3, and 5′-AGGTTCTGGCCAACGGTCTAG-3′ and 5′-CCCTCTATGGGCTCGAATTTT-3′ for mouse 18S. For the murine Tfeb and C/ebpβ, primers were obtained from the primer bank at http://pga.mgh.harvard.edu/primerbank/index.html. Mouse primers for 36b4, AdipoQ, C/ebpα, Atgl, Hsl, perilipin, and Foxo1 were previously described (9, 73).
Protein extracts and Western analysis.
Isolation of protein was performed using M-PER mammalian protein extraction reagent (Thermo Scientific) with the addition of protease inhibitor and phosphatase inhibitor cocktails (Roche). Protein content was quantified using a Coomassie Plus (Bradford) assay kit (Thermo Scientific). Sixty to 80 μg of each supernatant sample of protein was separated by electrophoresis through 8% SDS-polyacrylamide gels and transferred to a 0.2-μm Trans-Blot transfer medium nitrocellulose membrane (Bio-Rad). Following transfer, immunoblottings were performed. Nitrocellulose membranes were first blocked with 5% milk and probed with primary antibodies against the following: Pparγ, C/ebpα C/ebpβ, Tfeb, and Tfe3 (Santa Cruz Biotechnology); phospho-p44/42 MAPK (ERK1/2) (Thr202/Tyr204) (Cell Signaling); and anti-phosphatidylinositol 3-kinase (anti-PI-3K) p85 (Millipore). Individual proteins were detected by incubation of the membranes with horseradish peroxidase-conjugated secondary antibodies (GE and Thermo Scientific) followed by treatment with enhanced chemiluminescence (Thermo Scientific) according to the manufacturer's directions.
Luciferase reporter vector construction.
The murine Pparγ2 regulatory region containing the four E-boxes was cloned by PCR using murine genomic DNA as the template. Primers were designed following the instructions of the Clontech In-Fusion cloning kit. The primers included 16-bp extensions homologous to the vector ends after linearization. These are the sequences of the primers used: 5″-AAATCGATAAGGATCCGTCCATTCCTGATGTTGCTGCAAGG-3′ and 5″-ATCGGTCGACGGATCCCAAAGGAAACTTGGCATGGGCTAAGG-3′. The PCR fragment was run in an agarose gel and the band was purified with a QIAquick gel extraction kit (Qiagen). The purified PCR fragment was cloned into the BamHI-linearized vector (pGL3-SV40 promoter; Promega) by incubation with the In-Fusion enzyme (Clontech). The sequence was confirmed and mutagenesis was performed using a QuikChange site-directed mutagenesis kit (Stratagene) according to the manufacturer's instructions. Primers used were (+157)-GATGCTTCGGGCACTGAAGTGTGGGTGAAATTGCATG-(+194) and (+189)-CATGCAATTTCACCCACACTTCAGTGCCCGAAGCATC-(+222) for E-box 1 at R1, 5′-GCATGTTTGTTTTCCACTTCTATTCATATAGTC-3′ and 5′-GACTATATGAATAGAAGTGGAAAACAAACATGC-3′ for E-box 2 at R1, (+4664)-GATTAA AGTTCCGAGGTGTGGTGGAGC-(+4692) and 5′-GCTCTCACCACACCTCGGAACTTTAATC-3′ for E-box 1 at R2, and (+4683)-GGTGAGAGCGAAGTGTGATCACTATAAAG-(+4712) and 5′-CTTTATAGTGATCACACTTCGCTCTCACC-3′ for E-box 2 at R2. Mutated sites are underlined.
To generate the MAPK phosphoacceptor serine-to-alanine mutation in Tfe3 (serine 119), the following primer was used: 5′-GTGCTCCTAACGCCCCCATGGCGC-3′. Mutated sites are underlined.
The PCR fragment was run in an agarose gel and the band purified with a QIAquick gel extraction kit (Qiagen). The purified PCR fragment was cloned into the BamHI-linearized vector (pGL3-SV40 promoter; Promega) by incubation with the In-Fusion enzyme (Clontech). The sequence was confirmed and mutagenesis was performed using a QuikChange site-directed mutagenesis kit (Stratagene) according to the manufacturer's instructions. Primers used are available upon request.
Cell culture cotransfections.
Each experiment was performed in triplicate, four times. 3T3-L1 subconfluent preadipocytes were split and plated in 24-well plates at a density of 6 × 10⁴/cm2. Each well received 1 ng of the Renilla luciferase vector to follow transfection efficiency and was cotransfected with different combinations of reporter and cDNA-containing vectors. Fifty nanograms of pGl3-SV40-Pparγ2 intron (or each mutated construct), 50 ng of empty pGl3-SV40, and 240 ng of mouse Tfeb and/or mouse Tfe3 expression construct in the pcDNA3.1+ vector were used. The total amount of DNA transfected per well was 0.8 μg. To maintain this concentration per well, pcDNA3.1+ empty vector was used. The cells were transfected using TransIT-3T3 transfection reagent (Mirus) according to the manufacturer's instructions. Previous experiments showed that the activation of Tfe3 and Tfeb was pivotal for this assay; therefore, the differentiation cocktail was added in each well to guarantee binding of the transcription factors. The transfections were performed for 24 h, and then the cells were washed and lysed with passive lysis buffer (Promega). Aliquots of the supernatant were assayed for luciferase activity using a Dual-Luciferase reporter assay system (Promega). Luciferase activity was normalized relative to the Renilla activity of the control (empty vector).
Immunoprecipitation.
Ten micrograms of each antibody, for Tfeb, for Tfe3, for Pparγ, and for the IgG control, was cross-linked to protein A/G plus agarose following the manufacturer's instructions (Thermo Scientific). Pellets of 3T3-L1 at days 0, 2, and 7 (after addition of differentiation cocktail) were lysed using IP/wash buffer and incubated on ice with periodic mixing. The lysates were centrifuged at 13,000 × g for 10 min, and the supernatants were transferred to a new tube to determine the concentration. Immunoprecipitations were performed as follows. After preclearing, lysates were transferred to antibody-cross-linked resin columns and agitated for 2 h at 4°C. Resin was washed thoroughly with IP/lysis/wash buffer, and the complexes were eluted and run in an SDS-PAGE and analyzed by Western blotting.
ChIPs.
Chromatin immunoprecipitation (ChIP) analyses were performed in triplicate, four times. The procedure was adopted from the Upstate protocol. Cells at the desired time points were fixed by adding 37% formaldehyde to a final concentration of 1%. Cross-linking was stopped by adding glycine to a final concentration of 0.125 M. Cells were washed twice with cold phosphate-buffered saline (PBS) and collected in PBS containing protease and phosphatase inhibitors (Roche). After centrifugation, the pellets of cells were resuspended in SDS-lysis buffer (1% SDS, 10 mM EDTA, 50 mM Tris-HCl [pH 8.1]) containing protease and phosphatase inhibitors and incubated on ice for 10 min. Cell lysates were sheared extensively by sonication (Bioruptor UCD-200; Diagenode) at 4°C to obtain fragments of 200 to 600 bp. Samples were centrifuged to pellet debris, and an aliquot was taken for gel analysis and inputs. A total of 100 μg of soluble chromatin was diluted 10 times with IP buffer (0.01% SDS, 1.1% Triton X-100, 1.2 mM EDTA, 16.7 mM Tris [pH 8.1], 167 mM NaCl) containing protease and phosphatase inhibitors and precleared at 4°C with a 50% slurry of UltraLink immobilized protein A/G in the presence of salmon sperm DNA and bovine serum albumin (BSA). After incubation, the beads were pelleted and the supernatant was immunoprecipitated with antibodies of interest (see below) at 4°C overnight. Immune complexes were collected with a 50% slurry of UltraLink Immobilized protein A/G containing salmon sperm DNA and BSA in Tris-EDTA (TE) by incubation at 4°C for 1 h. UltraLink immobilized protein A/G beads were washed sequentially for 5 min at 4°C with wash 1 (0.1% SDS, 1% Triton X-100, 2 mM EDTA, 20 mM Tris-HCl [pH 8.1], 150 mM NaCl), wash 2 (wash 1 containing 500 mM NaCl), wash 3 (0.25 M LiCl, 1% NP-40, 1% sodium deoxycholate, 1 mM EDTA, 10 mM Tris-HCl [pH 8.1]), and, finally, twice with TE (pH 8.0). Immune complexes were eluted from the beads with 1% SDS in TE (pH 8.0), and protein-DNA cross-links were reversed by adding 200 mM NaCl and heating at 65°C overnight. After treatment with proteinase K, the samples were purified with a QIAquick PCR purification kit (Qiagen) and analyzed by real-time PCR.
Antibodies used included antibodies against Pparγ, Tfeb, and Tfe3 (Santa Cruz Biotechnology) and RNA polymerase II (phosphor-serine 2) (Abcam).
Real-time PCRs were performed with QuantiFast SYBR green PCR master mix (Qiagen). Primers used were 5′-GATGTTGCTGCAAGGGATGC-3′ and 5′-TGATCAAAGGATTAATAGACTATAT-3′ for Pparγ 2 E-box R1, 5′-GTGATTGCCAAGATTAAA-3′ and 5′-TGACAGTTTCAAGTTTACTTTATA-3′ for Pparγ 2 E-box R2, and 5′-CGTTAGCAGTTTGGCACAGC-3′ and 5′-CAGGAAAACTCTGGCTTCTTG-3′ for the Pparγ2 promoter (−900); the aP2 PPRE and insulin primers were described in reference 42. ChIP analyses were performed in triplicate, four times.
Tissue ChIP.
For tissue ChIP, we followed the protocol described in reference 75.
Statistical analysis.
Data are expressed as averages ± standard deviations (SD). Depending on the number of groups, statistical significance was determined by the two-tailed Student t test, analysis of variance (ANOVA), or two-way ANOVA followed by Bonferroni corrections for multiple-hypothesis testing. The differences were considered to be significant if the adjusted P value was <0.05.
ACKNOWLEDGMENTS
We thank Eiríkur Steingrímsson, Neal G. Copeland, and Nancy A. Jenkins for the Tfe3KO mice. We thank Eric Campeau for providing all lentivirus vectors used in this study and Carol Dacwag for technical help with tissue ChIPs. We thank members of the Fisher lab, Kyle Nitzsche, and Rajini Mudhasani for critical discussion and comments.
This work was supported by American Heart Association fellowship (AHA) number 0726015T to N.S., partially supported by the PhRMA Foundation and by grant number R01CA163336 from the National Cancer Institute to J.S.S., and supported by funds from the Melanoma Research Alliance, the Dr. Miriam and Sheldon Adelson Medical Research Foundation, the NIH (RO1-AR043369 and R01CA150226), the U.S.-Israel Binational Science Foundation, and the Doris Duke Medical Research Foundation to D.E.F.
ADDENDUM IN PROOF
While this study was in final preparation for publication, Pastore et al. published related findings that Tfe3 regulates whole-body metabolism in cooperation with Tfeb (N. Pastore et al., EMBO Mol Med 9:605–621, 2017, https://doi.org/10.15252/emmm.201607204). In agreement with the findings of Pastore et al., we found that the Tfe3KO mouse is metabolically imbalanced and that Tfeb plays a cooperative role. Nevertheless, the results of Pastore et al. relating to Tfe3KO mouse fat metabolism were not consistent with our results in many important respects. They did not find significant differences in body weight in Tfe3KO mice versus control mice; they found that Tfe3KO mouse fat mass was 50% higher than that in wild-type (WT) mice; they found a significant reduction in liver weight; they did not find significant reduction in AdipoQ levels; and they found significant decreases in blood glucose levels. Regardless, both studies showed the importance of MiT transcription factors in metabolism. In our study we demonstrated that fat metabolism is linked to the MiT factor via direct control of fat master regulator Pparγ2. We predict that a selective fat reduction of Tfeb or Mitf in the Tfe3KO mouse might clarify the individual contribution of this family of transcription factors in whole-body metabolism.
REFERENCES
- 1.Steingrimsson E, Tessarollo L, Pathak B, Hou L, Arnheiter H, Copeland NG, Jenkins NA. 2002. Mitf and Tfe3, two members of the Mitf-Tfe family of bHLH-Zip transcription factors, have important but functionally redundant roles in osteoclast development. Proc Natl Acad Sci U S A 99:4477–4482. doi: 10.1073/pnas.072071099. [DOI] [PMC free article] [PubMed] [Google Scholar]
- 2.Beckmann H, Kadesch T. 1991. The leucine zipper of TFE3 dictates helix-loop-helix dimerization specificity. Genes Dev 5:1057–1066. doi: 10.1101/gad.5.6.1057. [DOI] [PubMed] [Google Scholar]
- 3.Fisher DE, Carr CS, Parent LA, Sharp PA. 1991. TFEB has DNA-binding and oligomerization properties of a unique helix-loop-helix/leucine-zipper family. Genes Dev 5:2342–2352. doi: 10.1101/gad.5.12a.2342. [DOI] [PubMed] [Google Scholar]
- 4.Hemesath TJ, Steingrimsson E, McGill G, Hansen MJ, Vaught J, Hodgkinson CA, Arnheiter H, Copeland NG, Jenkins NA, Fisher DE. 1994. Microphthalmia, a critical factor in melanocyte development, defines a discrete transcription factor family. Genes Dev 8:2770–2780. doi: 10.1101/gad.8.22.2770. [DOI] [PubMed] [Google Scholar]
- 5.Katayama R, Yamane A, Fukui T. 2010. Changes in the expression of myosins during postnatal development of masseter muscle in the microphthalmic mouse. Open Dent J 4:1–7. doi: 10.2174/1874210601004010001. [DOI] [PMC free article] [PubMed] [Google Scholar]
- 6.Naka A, Iida KT, Nakagawa Y, Iwasaki H, Takeuchi Y, Satoh A, Matsuzaka T, Ishii KA, Kobayashi K, Yatoh S, Shimada M, Yahagi N, Suzuki H, Sone H, Yamada N, Shimano H. 2013. TFE3 inhibits myoblast differentiation in C2C12 cells via down-regulating gene expression of myogenin. Biochem Biophys Res Commun 430:664–669. doi: 10.1016/j.bbrc.2012.11.094. [DOI] [PubMed] [Google Scholar]
- 7.Ooishi R, Shirai M, Funaba M, Murakami M. 2012. Microphthalmia-associated transcription factor is required for mature myotube formation. Biochim Biophys Acta 1820:76–83. doi: 10.1016/j.bbagen.2011.11.005. [DOI] [PubMed] [Google Scholar]
- 8.Zanocco-Marani T, Vignudelli T, Parenti S, Gemelli C, Condorelli F, Martello A, Selmi T, Grande A, Ferrari S. 2009. TFE3 transcription factor regulates the expression of MAFB during macrophage differentiation. Exp Cell Res 315:1798–1808. doi: 10.1016/j.yexcr.2009.03.018. [DOI] [PubMed] [Google Scholar]
- 9.Fujimoto Y, Nakagawa Y, Satoh A, Okuda K, Shingyouchi A, Naka A, Matsuzaka T, Iwasaki H, Kobayashi K, Yahagi N, Shimada M, Yatoh S, Suzuki H, Yogosawa S, Izumi T, Sone H, Urayama O, Yamada N, Shimano H. 2013. TFE3 controls lipid metabolism in adipose tissue of male mice by suppressing lipolysis and thermogenesis. Endocrinology 154:3577–3588. doi: 10.1210/en.2013-1203. [DOI] [PubMed] [Google Scholar]
- 10.Settembre C, De Cegli R, Mansueto G, Saha PK, Vetrini F, Visvikis O, Huynh T, Carissimo A, Palmer D, Klisch TJ, Wollenberg AC, Di Bernardo D, Chan L, Irazoqui JE, Ballabio A. 2013. TFEB controls cellular lipid metabolism through a starvation-induced autoregulatory loop. Nat Cell Biol 15:647–658. doi: 10.1038/ncb2718. [DOI] [PMC free article] [PubMed] [Google Scholar]
- 11.Betschinger J, Nichols J, Dietmann S, Corrin PD, Paddison PJ, Smith A. 2013. Exit from pluripotency is gated by intracellular redistribution of the bHLH transcription factor Tfe3. Cell 153:335–347. doi: 10.1016/j.cell.2013.03.012. [DOI] [PMC free article] [PubMed] [Google Scholar]
- 12.Steingrímsson E, Tessarollo L, Reid SW, Jenkins NA, Copeland NG. 1998. The bHLH-Zip transcription factor Tfeb is essential for placental vascularization. Development 125:4607–4616. [DOI] [PubMed] [Google Scholar]
- 13.Davis IJ, Kim JJ, Ozsolak F, Widlund HR, Rozenblatt-Rosen O, Granter SR, Du J, Fletcher JA, Denny CT, Lessnick SL, Linehan WM, Kung AL, Fisher DE. 2006. Oncogenic MITF dysregulation in clear cell sarcoma: defining the MiT family of human cancers. Cancer Cell 9:473–484. doi: 10.1016/j.ccr.2006.04.021. [DOI] [PubMed] [Google Scholar]
- 14.Kauffman EC, Ricketts CJ, Rais-Bahrami S, Yang Y, Merino MJ, Bottaro DP, Srinivasan R, Linehan WM. 2014. Molecular genetics and cellular features of TFE3 and TFEB fusion kidney cancers. Nat Rev Urol 11:465–475. doi: 10.1038/nrurol.2014.162. [DOI] [PMC free article] [PubMed] [Google Scholar]
- 15.Nakagawa Y, Shimano H, Yoshikawa T, Ide T, Tamura M, Furusawa M, Yamamoto T, Inoue N, Matsuzaka T, Takahashi A, Hasty AH, Suzuki H, Sone H, Toyoshima H, Yahagi N, Yamada N. 2006. TFE3 transcriptionally activates hepatic IRS-2, participates in insulin signaling and ameliorates diabetes. Nat Med 12:107–113. doi: 10.1038/nm1334. [DOI] [PubMed] [Google Scholar]
- 16.Iwasaki H, Naka A, Iida KT, Nakagawa Y, Matsuzaka T, Ishii KA, Kobayashi K, Takahashi A, Yatoh S, Yahagi N, Sone H, Suzuki H, Yamada N, Shimano H. 2012. TFE3 regulates muscle metabolic gene expression, increases glycogen stores, and enhances insulin sensitivity in mice. Am J Physiol Endocrinol Metab 302:E896–E902. doi: 10.1152/ajpendo.00204.2011. [DOI] [PubMed] [Google Scholar]
- 17.Sardiello M, Palmieri M, di Ronza A, Medina DL, Valenza M, Gennarino VA, Di Malta C, Donaudy F, Embrione V, Polishchuk RS, Banfi S, Parenti G, Cattaneo E, Ballabio A. 2009. A gene network regulating lysosomal biogenesis and function. Science 325:473–477. [DOI] [PubMed] [Google Scholar]
- 18.Martina JA, Diab HI, Lishu L, Jeong AL, Patange S, Raben N, Puertollano R. 2014. The nutrient-responsive transcription factor TFE3 promotes autophagy, lysosomal biogenesis, and clearance of cellular debris. Sci Signal 7:ra9. doi: 10.1126/scisignal.2004754. [DOI] [PMC free article] [PubMed] [Google Scholar]
- 19.Weilbaecher KN, Motyckova G, Huber WE, Takemoto CM, Hemesath TJ, Xu Y, Hershey CL, Dowland NR, Wells AG, Fisher DE. 2001. Linkage of M-CSF signaling to Mitf, TFE3, and the osteoclast defect in Mitf(mi/mi) mice. Mol Cell 8:749–758. doi: 10.1016/S1097-2765(01)00360-4. [DOI] [PubMed] [Google Scholar]
- 20.Levy C, Khaled M, Fisher DE. 2006. MITF: master regulator of melanocyte development and melanoma oncogene. Trends Mol Med 12:406–414. doi: 10.1016/j.molmed.2006.07.008. [DOI] [PubMed] [Google Scholar]
- 21.Hodgkinson CA, Moore KJ, Nakayama A, Steingrimsson E, Copeland NG, Jenkins NA, Arnheiter H. 1993. Mutations at the mouse microphthalmia locus are associated with defects in a gene encoding a novel basic-helix-loop-helix-zipper protein. Cell 74:395–404. doi: 10.1016/0092-8674(93)90429-T. [DOI] [PubMed] [Google Scholar]
- 22.Farmer SR. 2006. Transcriptional control of adipocyte formation. Cell Metab 4:263–273. doi: 10.1016/j.cmet.2006.07.001. [DOI] [PMC free article] [PubMed] [Google Scholar]
- 23.Lee JE, Ge K. 2014. Transcriptional and epigenetic regulation of PPARgamma expression during adipogenesis. Cell Biosci 4:29. doi: 10.1186/2045-3701-4-29. [DOI] [PMC free article] [PubMed] [Google Scholar]
- 24.Rosen ED, Spiegelman BM. 2000. Molecular regulation of adipogenesis. Annu Rev Cell Dev Biol 16:145–171. doi: 10.1146/annurev.cellbio.16.1.145. [DOI] [PubMed] [Google Scholar]
- 25.Kawai M, Rosen CJ. 2010. PPARgamma: a circadian transcription factor in adipogenesis and osteogenesis. Nat Rev Endocrinol 6:629–636. doi: 10.1038/nrendo.2010.155. [DOI] [PMC free article] [PubMed] [Google Scholar]
- 26.Zhu Y, Qi C, Korenberg JR, Chen XN, Noya D, Rao MS, Reddy JK. 1995. Structural organization of mouse peroxisome proliferator-activated receptor gamma (mPPAR gamma) gene: alternative promoter use and different splicing yield two mPPAR gamma isoforms. Proc Natl Acad Sci U S A 92:7921–7925. doi: 10.1073/pnas.92.17.7921. [DOI] [PMC free article] [PubMed] [Google Scholar]
- 27.Vidal-Puig A, Jimenez-Linan M, Lowell BB, Hamann A, Hu E, Spiegelman B, Flier JS, Moller DE. 1996. Regulation of PPAR gamma gene expression by nutrition and obesity in rodents. J Clin Invest 97:2553–2561. doi: 10.1172/JCI118703. [DOI] [PMC free article] [PubMed] [Google Scholar]
- 28.Tontonoz P, Hu E, Graves RA, Budavari AI, Spiegelman BM. 1994. mPPAR gamma 2: tissue-specific regulator of an adipocyte enhancer. Genes Dev 8:1224–1234. doi: 10.1101/gad.8.10.1224. [DOI] [PubMed] [Google Scholar]
- 29.Semple RK, Chatterjee VK, O'Rahilly S. 2006. PPAR gamma and human metabolic disease. J Clin Invest 116:581–589. doi: 10.1172/JCI28003. [DOI] [PMC free article] [PubMed] [Google Scholar]
- 30.Siersbaek R, Nielsen R, Mandrup S. 2010. PPARgamma in adipocyte differentiation and metabolism—novel insights from genome-wide studies. FEBS Lett 584:3242–3249. doi: 10.1016/j.febslet.2010.06.010. [DOI] [PubMed] [Google Scholar]
- 31.Yamauchi T, Kamon J, Minokoshi Y, Ito Y, Waki H, Uchida S, Yamashita S, Noda M, Kita S, Ueki K, Eto K, Akanuma Y, Froguel P, Foufelle F, Ferre P, Carling D, Kimura S, Nagai R, Kahn BB, Kadowaki T. 2002. Adiponectin stimulates glucose utilization and fatty-acid oxidation by activating AMP-activated protein kinase. Nat Med 8:1288–1295. doi: 10.1038/nm788. [DOI] [PubMed] [Google Scholar]
- 32.Rosen ED, Spiegelman BM. 2006. Adipocytes as regulators of energy balance and glucose homeostasis. Nature 444:847–853. doi: 10.1038/nature05483. [DOI] [PMC free article] [PubMed] [Google Scholar]
- 33.Boezaart AP, Tighe P. 2010. New trends in regional anesthesia for shoulder surgery: avoiding devastating complications. Int J Shoulder Surg 4:1–7. doi: 10.4103/0973-6042.68410. [DOI] [PMC free article] [PubMed] [Google Scholar]
- 34.Gil-Dones F, Martin-Rojas T, Lopez-Almodovar LF, de la Cuesta F, Darde VM, Alvarez-Llamas G, Juarez-Tosina R, Barroso G, Vivanco F, Padial LR, Barderas MG. 2010. Valvular aortic stenosis: a proteomic insight. Clin Med Insights Cardiol 4:1–7. [DOI] [PMC free article] [PubMed] [Google Scholar]
- 35.Green H, Meuth M. 1974. An established pre-adipose cell line and its differentiation in culture. Cell 3:127–133. doi: 10.1016/0092-8674(74)90116-0. [DOI] [PubMed] [Google Scholar]
- 36.Tontonoz P, Hu E, Spiegelman B. 1994. Stimulation of adipogenesis in fibroblasts by PPARg2, a lipid activated transcription factor. Cell 79:1147–1156. doi: 10.1016/0092-8674(94)90006-X. [DOI] [PubMed] [Google Scholar]
- 37.Cao Z, Umek RM, McKnight SL. 1991. Regulated expression of three C/EBP isoforms during adipose conversion of 3T3-L1 cells. Genes Dev 5:1538–1552. doi: 10.1101/gad.5.9.1538. [DOI] [PubMed] [Google Scholar]
- 38.Hemesath TJ, Price ER, Takemoto C, Badalian T, Fisher DE. 1998. MAP kinase links the transcription factor Microphthalmia to c-Kit signalling in melanocytes. Nature 391:298–301. doi: 10.1038/34681. [DOI] [PubMed] [Google Scholar]
- 39.Rehli M, Den Elzen N, Cassady AI, Ostrowski MC, Hume DA. 1999. Cloning and characterization of the murine genes for bHLH-ZIP transcription factors TFEC and TFEB reveal a common gene organization for all MiT subfamily members. Genomics 56:111–120. doi: 10.1006/geno.1998.5588. [DOI] [PubMed] [Google Scholar]
- 40.Roman C, Matera AG, Cooper C, Artandi S, Blain S, Ward DC, Calame K. 1992. mTFE3, an X-linked transcriptional activator containing basic helix-loop-helix and zipper domains, utilizes the zipper to stabilize both DNA binding and multimerization. Mol Cell Biol 12:817–827. doi: 10.1128/MCB.12.2.817. [DOI] [PMC free article] [PubMed] [Google Scholar]
- 41.Prusty D, Park BH, Davis KE, Farmer SR. 2002. Activation of MEK/ERK signaling promotes adipogenesis by enhancing peroxisome proliferator-activated receptor gamma (PPARgamma) and C/EBPalpha gene expression during the differentiation of 3T3-L1 preadipocytes. J Biol Chem 277:46226–46232. doi: 10.1074/jbc.M207776200. [DOI] [PubMed] [Google Scholar]
- 42.Lefterova MI, Zhang Y, Steger DJ, Schupp M, Schug J, Cristancho A, Feng D, Zhuo D, Stoeckert CJ Jr, Liu XS, Lazar MA. 2008. PPARgamma and C/EBP factors orchestrate adipocyte biology via adjacent binding on a genome-wide scale. Genes Dev 22:2941–2952. doi: 10.1101/gad.1709008. [DOI] [PMC free article] [PubMed] [Google Scholar]
- 43.Campeau E, Ruhl VE, Rodier F, Smith CL, Rahmberg BL, Fuss JO, Campisi J, Yaswen P, Cooper PK, Kaufman PD. 2009. A versatile viral system for expression and depletion of proteins in mammalian cells. PLoS One 4:e6529. doi: 10.1371/journal.pone.0006529. [DOI] [PMC free article] [PubMed] [Google Scholar]
- 44.Wu Z, Xie Y, Bucher NL, Farmer SR. 1995. Conditional ectopic expression of C/EBP beta in NIH-3T3 cells induces PPAR gamma and stimulates adipogenesis. Genes Dev 9:2350–2363. doi: 10.1101/gad.9.19.2350. [DOI] [PubMed] [Google Scholar]
- 45.Rosen ED, Hsu CH, Wang X, Sakai S, Freeman MW, Gonzalez FJ, Spiegelman BM. 2002. C/EBPalpha induces adipogenesis through PPARgamma: a unified pathway. Genes Dev 16:22–26. doi: 10.1101/gad.948702. [DOI] [PMC free article] [PubMed] [Google Scholar]
- 46.Nielsen R, Pedersen TA, Hagenbeek D, Moulos P, Siersbaek R, Megens E, Denissov S, Borgesen M, Francoijs KJ, Mandrup S, Stunnenberg HG. 2008. Genome-wide profiling of PPARgamma:RXR and RNA polymerase II occupancy reveals temporal activation of distinct metabolic pathways and changes in RXR dimer composition during adipogenesis. Genes Dev 22:2953–2967. doi: 10.1101/gad.501108. [DOI] [PMC free article] [PubMed] [Google Scholar]
- 47.Salma N, Xiao H, Mueller E, Imbalzano AN. 2004. Temporal recruitment of transcription factors and SWI/SNF chromatin-remodeling enzymes during adipogenic induction of the peroxisome proliferator-activated receptor gamma nuclear hormone receptor. Mol Cell Biol 24:4651–4663. doi: 10.1128/MCB.24.11.4651-4663.2004. [DOI] [PMC free article] [PubMed] [Google Scholar]
- 48.Walczak R, Tontonoz P. 2002. PPARadigms and PPARadoxes: expanding roles for PPARgamma in the control of lipid metabolism. J Lipid Res 43:177–186. [PubMed] [Google Scholar]
- 49.Rodriguez-Cuenca S, Carobbio S, Velagapudi VR, Barbarroja N, Moreno-Navarrete JM, Tinahones FJ, Fernandez-Real JM, Oresic M, Vidal-Puig A. 2012. Peroxisome proliferator-activated receptor gamma-dependent regulation of lipolytic nodes and metabolic flexibility. Mol Cell Biol 32:1555–1565. doi: 10.1128/MCB.06154-11. [DOI] [PMC free article] [PubMed] [Google Scholar]
- 50.Hotta K, Funahashi T, Arita Y, Takahashi M, Matsuda M, Okamoto Y, Iwahashi H, Kuriyama H, Ouchi N, Maeda K, Nishida M, Kihara S, Sakai N, Nakajima T, Hasegawa K, Muraguchi M, Ohmoto Y, Nakamura T, Yamashita S, Hanafusa T, Matsuzawa Y. 2000. Plasma concentrations of a novel, adipose-specific protein, adiponectin, in type 2 diabetic patients. Arterioscler Thromb Vasc Biol 20:1595–1599. doi: 10.1161/01.ATV.20.6.1595. [DOI] [PubMed] [Google Scholar]
- 51.Liu Q, Yuan B, Lo KA, Patterson HC, Sun Y, Lodish HF. 2012. Adiponectin regulates expression of hepatic genes critical for glucose and lipid metabolism. Proc Natl Acad Sci U S A 109:14568–14573. doi: 10.1073/pnas.1211611109. [DOI] [PMC free article] [PubMed] [Google Scholar]
- 52.Ghoshal K, Bhattacharyya M. 2015. Adiponectin: probe of the molecular paradigm associating diabetes and obesity. World J Diabetes 6:151–166. doi: 10.4239/wjd.v6.i1.151. [DOI] [PMC free article] [PubMed] [Google Scholar]
- 53.Combs TP, Berg AH, Obici S, Scherer PE, Rossetti L. 2001. Endogenous glucose production is inhibited by the adipose-derived protein Acrp30. J Clin Invest 108:1875–1881. doi: 10.1172/JCI14120. [DOI] [PMC free article] [PubMed] [Google Scholar]
- 54.Lihn AS, Pedersen SB, Richelsen B. 2005. Adiponectin: action, regulation and association to insulin sensitivity. Obes Rev 6:13–21. doi: 10.1111/j.1467-789X.2005.00159.x. [DOI] [PubMed] [Google Scholar]
- 55.Tokunaga C, Yoshino K, Yonezawa K. 2004. mTOR integrates amino acid- and energy-sensing pathways. Biochem Biophys Res Commun 313:443–446. doi: 10.1016/j.bbrc.2003.07.019. [DOI] [PubMed] [Google Scholar]
- 56.Laplante M, Sabatini DM. 2013. Regulation of mTORC1 and its impact on gene expression at a glance. J Cell Sci 126:1713–1719. doi: 10.1242/jcs.125773. [DOI] [PMC free article] [PubMed] [Google Scholar]
- 57.Laplante M, Sabatini DM. 2012. mTOR signaling in growth control and disease. Cell 149:274–293. doi: 10.1016/j.cell.2012.03.017. [DOI] [PMC free article] [PubMed] [Google Scholar]
- 58.Martina JA, Chen Y, Gucek M, Puertollano R. 2012. MTORC1 functions as a transcriptional regulator of autophagy by preventing nuclear transport of TFEB. Autophagy 8:903–914. doi: 10.4161/auto.19653. [DOI] [PMC free article] [PubMed] [Google Scholar]
- 59.Roczniak-Ferguson A, Petit CS, Froehlich F, Qian S, Ky J, Angarola B, Walther TC, Ferguson SM. 2012. The transcription factor TFEB links mTORC1 signaling to transcriptional control of lysosome homeostasis. Sci Signal 5:ra42. doi: 10.1126/scisignal.2002790. [DOI] [PMC free article] [PubMed] [Google Scholar]
- 60.Settembre C, Zoncu R, Medina DL, Vetrini F, Erdin S, Erdin S, Huynh T, Ferron M, Karsenty G, Vellard MC, Facchinetti V, Sabatini DM, Ballabio A. 2012. A lysosome-to-nucleus signalling mechanism senses and regulates the lysosome via mTOR and TFEB. EMBO J 31:1095–1108. doi: 10.1038/emboj.2012.32. [DOI] [PMC free article] [PubMed] [Google Scholar]
- 61.Settembre C, Di Malta C, Polito VA, Garcia Arencibia M, Vetrini F, Erdin S, Erdin SU, Huynh T, Medina D, Colella P, Sardiello M, Rubinsztein DC, Ballabio A. 2011. TFEB links autophagy to lysosomal biogenesis. Science 332:1429–1433. doi: 10.1126/science.1204592. [DOI] [PMC free article] [PubMed] [Google Scholar]
- 62.Peña-Llopis S, Vega-Rubin-de-Celis S, Schwartz JC, Wolff NC, Tran TA, Zou L, Xie XJ, Corey DR, Brugarolas J. 2011. Regulation of TFEB and V-ATPases by mTORC1. EMBO J 30:3242–3258. doi: 10.1038/emboj.2011.257. [DOI] [PMC free article] [PubMed] [Google Scholar]
- 63.Dephoure N, Zhou C, Villen J, Beausoleil SA, Bakalarski CE, Elledge SJ, Gygi SP. 2008. A quantitative atlas of mitotic phosphorylation. Proc Natl Acad Sci U S A 105:10762–10767. doi: 10.1073/pnas.0805139105. [DOI] [PMC free article] [PubMed] [Google Scholar]
- 64.Mayya V, Lundgren DH, Hwang SI, Rezaul K, Wu L, Eng JK, Rodionov V, Han DK. 2009. Quantitative phosphoproteomic analysis of T cell receptor signaling reveals system-wide modulation of protein-protein interactions. Sci Signal 2:ra46. doi: 10.1126/scisignal.2000007. [DOI] [PubMed] [Google Scholar]
- 65.Yu Y, Yoon SO, Poulogiannis G, Yang Q, Ma XM, Villen J, Kubica N, Hoffman GR, Cantley LC, Gygi SP, Blenis J. 2011. Phosphoproteomic analysis identifies Grb10 as an mTORC1 substrate that negatively regulates insulin signaling. Science 332:1322–1326. doi: 10.1126/science.1199484. [DOI] [PMC free article] [PubMed] [Google Scholar]
- 66.Ferron M, Settembre C, Shimazu J, Lacombe J, Kato S, Rawlings DJ, Ballabio A, Karsenty G. 2013. A RANKL-PKCbeta-TFEB signaling cascade is necessary for lysosomal biogenesis in osteoclasts. Genes Dev 27:955–969. doi: 10.1101/gad.213827.113. [DOI] [PMC free article] [PubMed] [Google Scholar]
- 67.Debbache J, Zaidi MR, Davis S, Guo T, Bismuth K, Wang X, Skuntz S, Maric D, Pickel J, Meltzer P, Merlino G, Arnheiter H. 2012. In vivo role of alternative splicing and serine phosphorylation of the microphthalmia-associated transcription factor. Genetics 191:133–144. doi: 10.1534/genetics.111.135996. [DOI] [PMC free article] [PubMed] [Google Scholar]
- 68.Sato S, Roberts K, Gambino G, Cook A, Kouzarides T, Goding CR. 1997. CBP/p300 as a co-factor for the Microphthalmia transcription factor. Oncogene 14:3083–3092. doi: 10.1038/sj.onc.1201298. [DOI] [PubMed] [Google Scholar]
- 69.de la Serna IL, Ohkawa Y, Higashi C, Dutta C, Osias J, Kommajosyula N, Tachibana T, Imbalzano AN. 2006. The microphthalmia-associated transcription factor requires SWI/SNF enzymes to activate melanocyte-specific genes. J Biol Chem 281:20233–20241. doi: 10.1074/jbc.M512052200. [DOI] [PubMed] [Google Scholar]
- 70.Strub T, Giuliano S, Ye T, Bonet C, Keime C, Kobi D, Le Gras S, Cormont M, Ballotti R, Bertolotto C, Davidson I. 2011. Essential role of microphthalmia transcription factor for DNA replication, mitosis and genomic stability in melanoma. Oncogene 30:2319–2332. doi: 10.1038/onc.2010.612. [DOI] [PubMed] [Google Scholar]
- 71.Medina-Gomez G, Virtue S, Lelliott C, Boiani R, Campbell M, Christodoulides C, Perrin C, Jimenez-Linan M, Blount M, Dixon J, Zahn D, Thresher RR, Aparicio S, Carlton M, Colledge WH, Kettunen MI, Seppanen-Laakso T, Sethi JK, O'Rahilly S, Brindle K, Cinti S, Oresic M, Burcelin R, Vidal-Puig A. 2005. The link between nutritional status and insulin sensitivity is dependent on the adipocyte-specific peroxisome proliferator-activated receptor-gamma2 isoform. Diabetes 54:1706–1716. doi: 10.2337/diabetes.54.6.1706. [DOI] [PMC free article] [PubMed] [Google Scholar]
- 72.Chiellini C, Costa M, Novelli SE, Amri EZ, Benzi L, Bertacca A, Cohen P, Del Prato S, Friedman JM, Maffei M. 2003. Identification of cathepsin K as a novel marker of adiposity in white adipose tissue. J Cell Physiol 195:309–321. doi: 10.1002/jcp.10253. [DOI] [PubMed] [Google Scholar]
- 73.Mikkelsen TS, Xu Z, Zhang X, Wang L, Gimble JM, Lander ES, Rosen ED. 2010. Comparative epigenomic analysis of murine and human adipogenesis. Cell 143:156–169. doi: 10.1016/j.cell.2010.09.006. [DOI] [PMC free article] [PubMed] [Google Scholar]
- 74.Chomczynski P, Mackey K. 1995. Short technical reports. Modification of the TRI reagent procedure for isolation of RNA from polysaccharide- and proteoglycan-rich sources. Biotechniques 19:942–945. [PubMed] [Google Scholar]
- 75.Dacwag CS, Ohkawa Y, Pal S, Sif S, Imbalzano AN. 2007. The protein arginine methyltransferase Prmt5 is required for myogenesis because it facilitates ATP-dependent chromatin remodeling. Mol Cell Biol 27:384–394. doi: 10.1128/MCB.01528-06. [DOI] [PMC free article] [PubMed] [Google Scholar]