Abstract
Identification and annotation of the mutations involved in oncogenesis and tumor progression are crucial for both cancer biology and clinical applications. Previously, we developed a public resource CanProVar, a human cancer proteome variation database for storing and querying single amino acid alterations in the human cancers. Since the publication of CanProVar, extensive cancer genomics efforts have revealed the enormous genomic complexity of various types of human cancers. Thus, there is an overwhelming need for comprehensive annotation of the genomic alterations at the protein level and making such knowledge easily accessible. Here, we describe CanProVar 2.0, a significantly expanded version of CanProVar, in which the amount of cancer-related variations and non-cancer specific variations was increased by about ten folds as compared to the previous version. To facilitate the interpretation of the variations, we added to the database functional data on potential impact of the crVARs on 3D protein interaction and on the differential expression of the variant-bearing proteins between cancer and normal samples. The web interface allows for flexible queries based on gene or protein IDs, cancer types, chromosome locations, or pathways. An integrated protein sequence databases containing variations that can be directly used for proteomics database searching can be downloaded.
Keywords: Proteome, Variation, Database, Cancer
Introduction
With the advent of the powerful DNA-sequencing technologies, the sequencing and subsequent public release of cancer genomes has occurred on an unprecedented scale during the past few years 1. To date, thousands of genomes from dozens of cancer types have been sequenced by individual research groups or research networks, such as the Cancer Genome Project (CGP) at the Sanger Institute and The Cancer Genome Atlas project (TCGA) at the National Cancer Institute (NCI)2. Furthermore, TCGA launched the Pan-Cancer analysis project in 2012 to assemble coherent, consistent data sets across tumor types or platforms to gain analytical breadth 3. At the same time, in an effort to characterize the geographic and functional spectrum of genetic variation among humans, projects such as the HapMap and the 1000 Genomes Project have provided maps of millions of single nucleotide polymorphisms from thousands of individuals, which are critical for better understanding the role of genetics in human diseases 4,5.
A new, emerging challenge in cancer research is to characterize the proteomes translated from cancer genomes in order to link genotype to proteotype and ultimately to phenotype6. The Clinical Proteomic Tumor Analysis Consortium (CPTAC) of the NCI has performed proteomic analysis of the tumors that have been genomically characterized by TCGA for three cancer types 7,8. In order to provide a bridge between genomic data and proteomic studies in different types of cancer, we reported in 2009 an integrated and well-annotated resource, CanProVar (Human Cancer Proteome Variation Database), with a focus on the protein sequence altering variations in human cancers. CanProVar assembles and comprehensively annotates missense and nonsense cancer-related variations (crVARs) as well as deletion and insertion of a single amino acid 9. It provides access to known crVARs in protein sequences along with information on related tumor samples, relevant publications, data sources, as well as potential functional effect of amino acid substitutions, protein domains in which the variations occur, and protein interaction partners of the crVAR-containing proteins 9. Based on the CanProVar database, we subsequently developed a bioinformatics workflow to detect the variant proteins/peptides expressed in cancer samples through the shotgun proteomics technology10.
Here we report CanProVar2.0, in which both unique crVARs and non-cancer-related variations (ncsVARs) have been increased by several folds by incorporating recently released data from the genome sequencing projects on cancer and non-cancer samples. The new version also contains new functional data on the impact of crVARs on 3D protein interaction and the differential expression of crVAR-bearing proteins between cancer and normal samples. In addition to queries based on a single protein name/ID or cancer sample, the revamped web interface further enables protein list-, chromosome location-, and pathway-based queries. CanProVar 2.0 is freely available to the public at two sites: http://lilab.life.sjtu.edu.cn:8080/canprovar2(China) and http://canprovar2.zhang-lab.org/.(USA).
Methods
System Configuration
In CanProVar 2.0, all data were stored and managed by the MySQL database. A web interface for data browsing, searching and displaying was implemented in PHP. Sequence alterations and related functional annotations of crVARs and ncsVAR were downloaded from public sources (see below). Through the web interface, users may query the variation(s) by a protein/gene name, a protein list, cancer type, chromosome location, or pathway, and corresponding search results will be summarized and displayed in a user-friendly format. A schematic overview of CanProVar 2.0 is shown in Figure 1.
Figure 1. The system architecture of CanProVar 2.0.
Five query methods are provided, and the output information is shown through different background colors.
Data Collection and Processing
crVAR data
crVAR data in CanProVar 2.0 were collected and complied from the following resources, the public databases of COSMIC2, TCGA11, HPI12, OMIM 13 and BIOMART14 and three previously published studies 15-17 (Table 1).
Table 1.
Data sources of CanProVar 2.0 database.
| Data sources | Web link | crVARs (V1) | crVARs (V2) | Type |
|---|---|---|---|---|
| COSMIC | http://www.sanger.ac.uk/genetics/CGP/cosmic/ | 4,989 | 42,467 | Somatic |
| HPI | http://www.uniprot.org/docs/humsavar.txt | 3,852 | 3,968 | Somatic and germline |
| TCGA | http://cancergenome.nih.gov/ | 329 | 5,793 | Somatic |
| OMIM | http://bioinf.org.uk/omim/ | 264 | 408 | Mainly germline |
| BIOMART | http://www.biomart.org/ | none | 16,838 | Somatic |
| Sjoblom et al. [2006] | http://www.ncbi.nlm.nih.gov/pubmed/16959974 | 1,562 | 1,364 | Somatic |
| Greenman et al. [2007] | http://www.ncbi.nlm.nih.gov/pubmed/17344846 | 606 | 535 | Somatic |
| Ding et al. [2008] | http://www.ncbi.nlm.nih.gov/pubmed/18948947 | 912 | 912 | Somatic |
The COSMIC (ftp://ftp.sanger.ac.uk/pub/CGP/cosmic/) (v58) database contains somatic mutation information in human cancers 2, and we only included the data on gene point mutations, including missense substitution, nonstop extension, frame-shift insertion, frame-shift deletion and in-frame selection. We downloaded the TCGA variation data from https://tcga-data.nci.nih.gov/tcgafiles/ftp_auth/distro_ftpusers/anonymous/tumor. OMIM mutation data were acquired from http://bioinf.org.uk/omim/ (04/2012)13. Additionally, we downloaded single amino acid alterations from HPI (http://www.uniprot.org/docs/humsavar.txt) (03/2012) and variations from BioMart (ftp://data.dcc.icgc.org/version_8/) (version 8)12,14. Data from three previous published papers were retained from CanProVar version 1.0 9.
Some of the mutations in TCGA and BioMart are annotated at the DNA sequence level only. We downloaded genomic sequences for individual human chromosomes from UCSC (http://hgdownload.soe.ucsc.edu/goldenPath/hg19/bigZips/) 18 and mapped these mutations to corresponding protein sequences. Accordingly, 5793 crVARs from TCGA and 2287 crVARs from BioMart were added to CanProVar 2.0.
Similar to CanProVar 1.0, CanProVar 2.0 uses Ensembl protein ID as the major identifier because it allows comprehensive mapping to IDs in other major databases 19. Each crVAR ID is prefixed with “cs” and represents a unique sequence change. Since cancer samples from different or even from the same data source often have different names, we standardized cancer names in CanProVar2.0 using the nomenclature in the NCBI Mesh database (http://www.ncbi.nlm.nih.gov/mesh).
ncrVAR data
Validated human common variations in BioMart were downloaded from the Ensembl database (http://www.ensembl.org/biomart/) (03/2012) 14. We selected “Ensembl Variation 69” and “Homo sapiens Variation (GRCh37.p8)”, and then limited the data to “non_synonymous_coding”,”stop_gained”, and “splice_site”. Only variations with a validation status (e.g. cluster, freq, hapmap, 1000Genome) were kept in our database. Variations that were found in both crVARs and ncrVARs were excluded from the final crVAR data set.
Other data
Gene and protein attributes including product description, gene name, chromosome location, Gene Ontology (GO) annotations, Pfam domains, and identifiers in external databases, were downloaded from the Ensembl database (release 53) through BioMart 14. A total of 65,531 binary interactions of the human structural interaction network (hSIN) with three-dimensional interaction interface were collected from Wang et al. (2012) 20.
The protein differential expression profiles in human cancers were collected from our previously published dbDEPC 2.0 (http://lifecenter.sgst.cn/dbdepc/index.do) 21. In dbDEPC 2.0, data collection underwent the following processes: first, an automated text mining of PubMed abstracts was applied using the names of cancer types in MeSH, MS-related words (MS, quantitative proteomic) and keywords describing expression changes (upregulated, downregulated and fold change); second, to control data quality, each deposited data set went through a rigorous manual review process. Data from Mus musculus and Rattus norvegicus were excluded.
A literature-supported human protein-protein interaction network was downloaded and integrated from five resources including DIP22, MINT23, HPRD 24, IntAct 25 and BioGRID26. The integrated network contains 99,701 protein interaction relationships. Pathway information was downloaded from the KEGG database27 (08/2012).
Results
Description of CanProVar 2.0
CanProVar 2.0 is designed for the storage and retrieval of single amino acid alterations in protein sequences in both cancer and normal samples. It aims to provide a bridge between genomic data and proteomic studies, allowing users to explore molecular functional characteristics of crVARs and proteins bearing these variations, i.e., cancer-related proteins (crPROs).
Variation Content
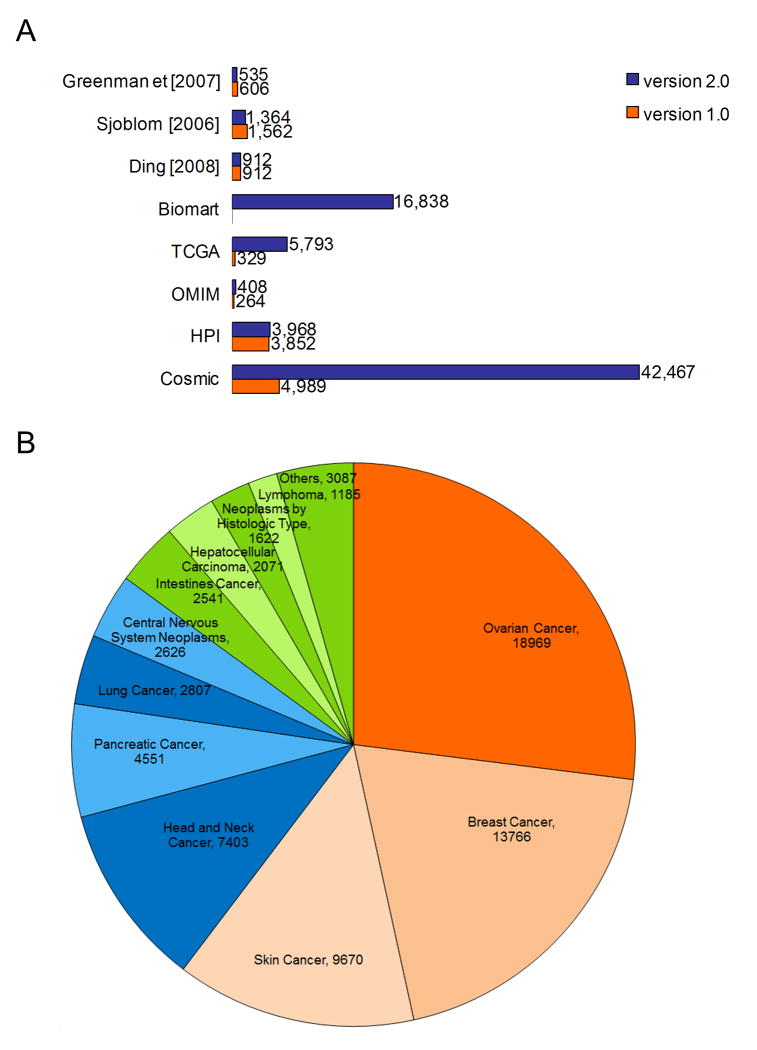
CanProVar 2.0 contains 958,974 ncsVARs in 78,438 proteins and 131,226 crVARs in 22,592 proteins. On average, there are 5.81 crVARs per protein. Table 1 summarizes the frequency distribution of crVARs among different data sources. The majority of crVARs came from BioMart, TCGA and COSMIC. Only less than one-fourth of the crVARs were reported in two or more data sources listed in Table 1, and none of them were common in the all. We manually checked the most frequent mutations, including BRAF V600E, KRAS G12D found that they were included in most of the resources, except for two previous studies respectively 15,16. In CanProVar 2.0, more than half of the unique crVARs were reported in ovarian, breast and skin cancers (Figure 2) while the top three cancer types in CanProVar 1.0 were lung, breast and colorectal cancers 9.
Figure 2. Variation content.
(A) Comparison of crVARs among different data sources between CanProVar version 1.0 and 2.0. (B) The frequency statistics for cancer types in CanProVar 2.0 show that much more crVARs have been identified in ovarian, breast, skin, and head and neck cancers than other cancer types.
The protein FASTA sequences with variation information in the description line can be downloaded in CanProVar 2.0. FASTA sequences are available for individual cancer types as well as the combined data across all cancer types. In order to provide a variation-containing protein database named MS-CanProVar for a database search in MS/MS data analysis, each peptide bearing a single crVAR or ncsVAR, together with two flanking tryptic peptides, was taken as an independent entry in MS-CanProVar, as we previously described 9. A total of 882,308 variant peptide entries were included in MS-CanProVar 2.0.
Functional Data on crVARs and crPROs
(i) Differential expression of crPROs and their interaction partners
Cancer phenotypes result from altered gene expression, but typically, only mutated genes are considered as candidate cancer genes28. Many cancer genes such as transcription factors MYC, p53, and WT-1 regulate the expression of multiple downstream genes29. Previously, we have developed dbDEPC, a database of differentially expressed proteins in human cancers. dbDEPC provides information on protein-level differentially expressed changes in cancers, curated from published mass spectrometry (MS) experiments21.
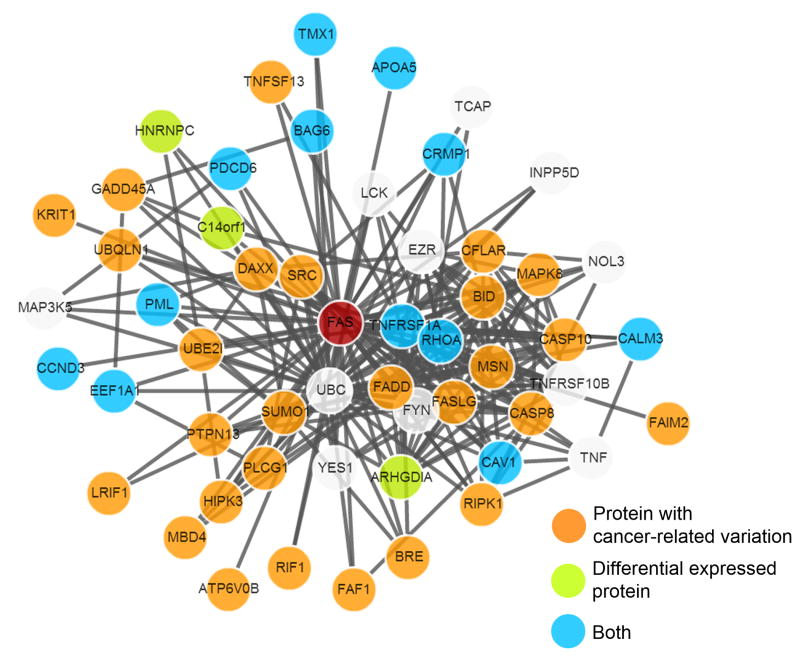
In CanProVar 2.0, we introduced a new feature that enables retrieving expression profiles of crPROs from the dbDEPC and then visualizing protein differential expression of the crPROs and their interaction partners (Figure 3). This feature allows users to gain insights into the biological mechanisms in cancers by effectively integrating mutation, differential expression, and network information. For example, we found that crPROs and crDEPs are significantly enriched among the interaction partners of MYC in the human protein interaction network (p-value =8.2e-14 and p-value=0 respectively, Benjamini and Hochberg corrected hypergeometric test).
Figure 3. Example of differential expression of a crPRO and its partners.
Protein with differential expression, cancer-related variation, and its interaction partners are displayed in graph.
(ii) 3D interaction altered by crVARs
By generating a three-dimensional structurally resolved human interaction network, Wang et al. recently reported that in-frame mutations are enriched on the interaction interfaces of proteins associated with the corresponding disorders, and the disease specificity for different mutations is related to their location within an interaction interface20. The atomic-resolution interaction interface(s) in which crVARs located are given in CanProVar 2.0, allowing users to identify crVARs that may structurally disturb protein interactions. For example, the mutation I1017S in the interface of BRCA2 protein might result in the loss of interaction between BRCA2 and RAD15.
New Search Features
In CanProVar 1.0, users could query the variations by only protein name/ID or cancer name. In CanProVar 2.0, since the NCBI Mesh's standard cancer names were integrated, users can select the cancer type they are interested in from a menu. As a result, a list of all known crPROs and DEPs in the queried cancer type will be returned together with detailed information of the variations and up/down regulation.
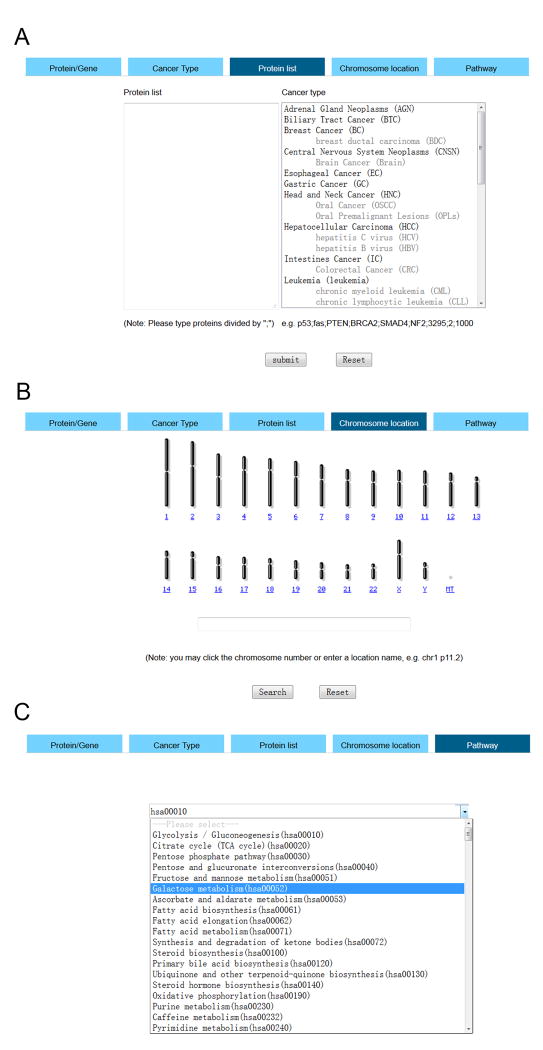
CanProVar 2.0 also introduced three additional searching methods based on protein sets defined by protein list, chromosome location, or biological pathway (Figure 4).
Figure 4. New searching methods.
CanProVar 2.0 introduced three additional searching methods based on protein sets defined by protein lists (A), chromosome locations (B) and biological pathways (C).
(i) Protein List
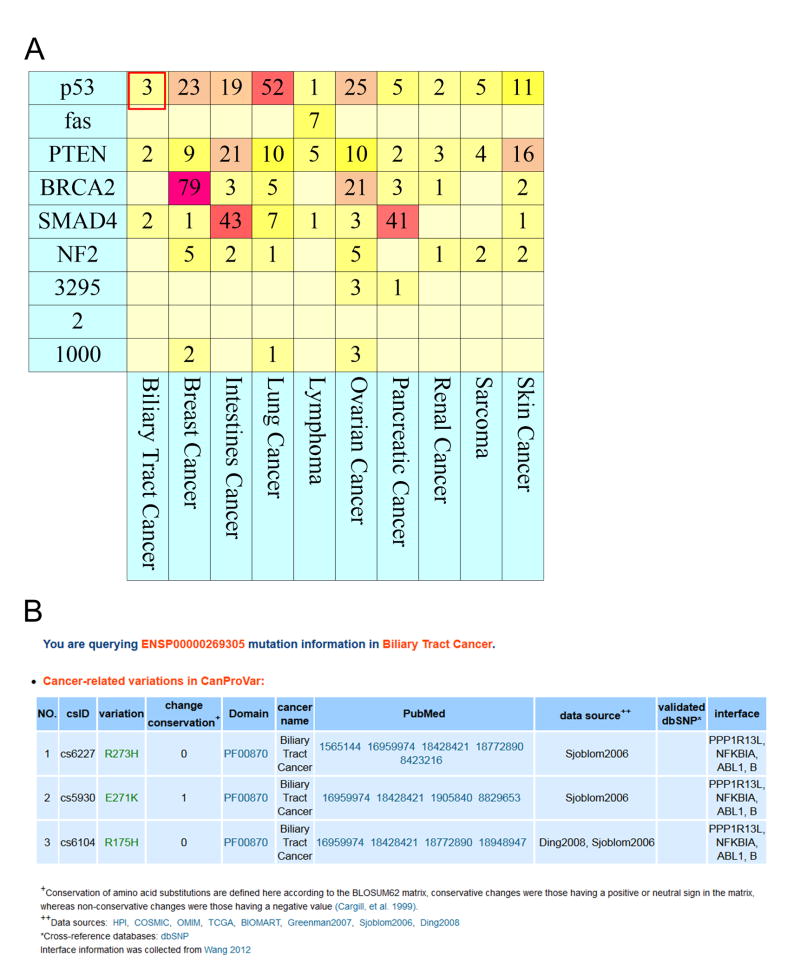
A list of candidate proteins, such as those produced by GWAS or differential protein expression analysis in cancer studies, can be submitted to CanProVar 2.0. Protein identifiers in a variety of databases, including Ensembl, IPI, RefSeq, UniProt/SwissProt, Entrez, as well as protein/gene name, are supported. The total numbers of crVARs in these proteins across different cancer types are displayed in a heatmap, in which darker colors correspond to more variations (Figure 5A). The detailed information about these variations can be displayed when the number of variations in a specific cancer type is selected (Figure 5B).
Figure 5. Example results of a protein list-based query.
(A) The amounts of crVARs in the query proteins in different cancer types are displayed in a heatmap, in which darker colors correspond to more variations. (B) The detailed information about these variations can be found when the user selects the number of variations in a specific cancer type.
(ii) Chromosome Location
Another new query option in CanProVar 2.0 is based on chromosome location, e.g. “chr1 p11.2”, or directly clicking on a chromosome in the ideogram graph. In the search results, the total mutation numbers (crVARs) are plotted by chromosome position and the data across different cancer types are illustrated in different colors. Therefore, the “hot” chromosome bands with a significantly higher number of crVARs can be easily and clearly spotlighted. For example, we found a peak of crVARs in the chromosome band chr17 p13.1′ as shown in Figure 6. A closer look at this band revealed that this band contains tumor suppressor TP53 and other crPROs. This query method provides a quick and easy means to study the relationship between mutation distribution and chromosomal location. Sometimes, it may even help identify hot chromosome bands related to cancer.
Figure 6. Example of a chromosome location-based query.
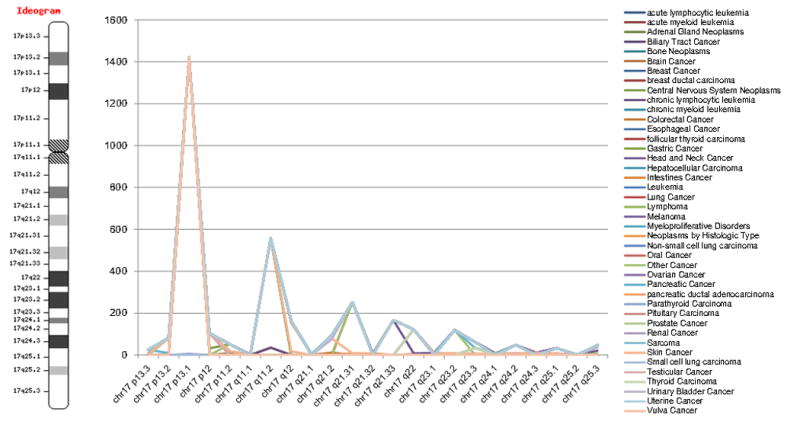
In the searching results, the accumulated mutation numbers (crVARs) are plotted by the chromosome position and the data cross cancer types are illustrated in different colors. Therefore, a hot chromosome band with a significantly higher number of crVARs can be spotted easily and clearly. For example, we found a peak of crVARs in chromosome band ‘chr17 p13.1’.
(iii) Biological Pathways
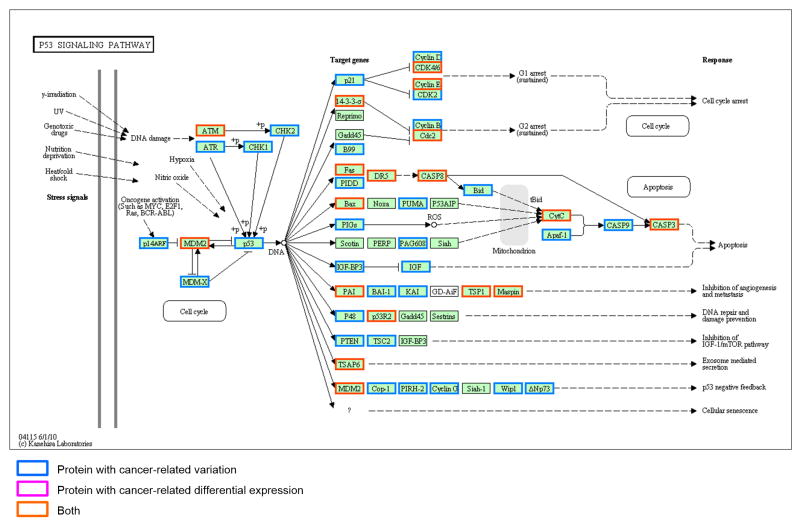
A biological pathway is composed of a series of actions among molecules in a cell that lead to a certain product or change within a cell, which if often involved in metabolism, gene expression regulation, and signal transmission 27. In CanProVar2.0, by entering a KEGG pathway ID, e.g. has00010, or selecting a name from the menu of pathways, the crPROs and crDEPs can be highlighted in different colors in the graph of the given pathway. For instance, in the p53 signaling pathway, most of the members have crVARs and half of these crPROs also show differential expression between cancer and normal samples (Figure 7).
Figure 7. Example of results of a biological pathway-based query.
By entering a KEGG pathway ID, e.g. has00010, or selecting a name from the menu of pathways implemented in CanProVar 2.0, the user can see the crPROs and crDEPs as highlighted in different colors on the graph of the given pathway. For instance, in the p53 signaling pathway, most of members have crVARs and half of these crPROs also showed differential expression between cancer and normal samples.
Data Analysis
(i) Significantly Mutated Proteins in Cancers
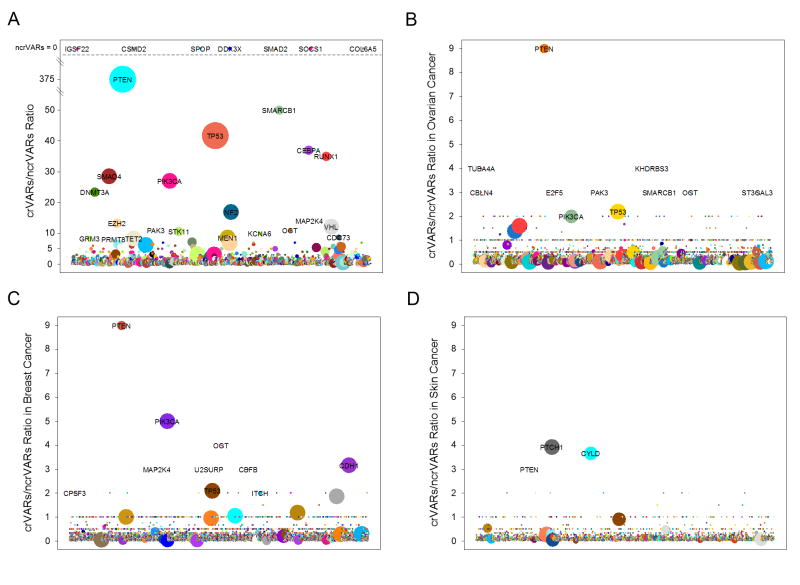
CanProVar 2.0 contains 70,262 crVARs and 825,106 ncrVARs. The average ratio between crVARs and ncrVARs is less than 1/10. However, we found that some proteins had significantly higher ‘crVARs : ncrVARs’ ratio. High prevalence of crVARs in these proteins may indicate their potential involvement in cancer development. As shown in Figure 8 and Table S1, 167 proteins had a ‘crVARs : ncrVARs’ ratio greater than 3. Many of these proteins are well-known cancer driver genes, e.g., PTEN, TP53, PIK3CA and NF2. Twenty-four of these genes are also in the list of the 127 significantly mutated genes identified in a Pan-Cancer study 30. We also calculated the ‘crVARs : ncrVARs’ ratios for individual proteins in ovarian, breast and skin cancers, respectively. We observed cancer-type specificity for crVAR-enrichment(Figure 8B-D), such as PTEN in ovarian cancer and PIK3CA in breast cancer.
Figure 8. Significantly mutated proteins in cancers.
(A) The crVARs: ncrVARs ratio analysis revealed 167 significantly mutated proteins across all cancer types, of which the ratios are higher than 3.0. (B) The crVARs: ncrVARs ratios in ovarian cancer. (C) The crVARs: ncrVARs ratios in breast cancer. (D) The crVARs: ncrVARs ratios in skin cancer.
(ii) Hot Chromosome Locations
Mutation and loss of heterozygosity from chromosomes and chromosome arms occur frequently during tumorigenesis31. We investigated the distribution of mutations across human chromosomal bands. A few “hot” chromosome locations containing one or more significant peaks of variations were identified. On chromosome 17, a significantly dominant peak was found in q13.1, which contains the well-known tumor suppressor gene TP53. The relationship between chromosomal region 7p13 with oral carcinoma and head and neck squamous cell carcinoma has been reported in a previous study32.
Another dominant peak in chr10 q23.31 covered 757 variations. A closer look of the crPROs and crVARs in this band revealed 687 mutations that were located in the protein PTEN. We also observed variation peaks in bands 13q13.1, 17p13.1, 18q21.2, and 22q12.2. Similar to our observation in band 10q23.31, more than half of the variations contained in each peak could be explained by very few well-known cancer genes (Figure S1). For instance, BRCA2 in chr13 q13.1 had 469 mutations and SMAD4 in chr18 q21.2 had 321 mutations. The close relationships between these super-mutated genes/proteins and human cancer have been well studied33-36.
(iii) Association Network of Cancers
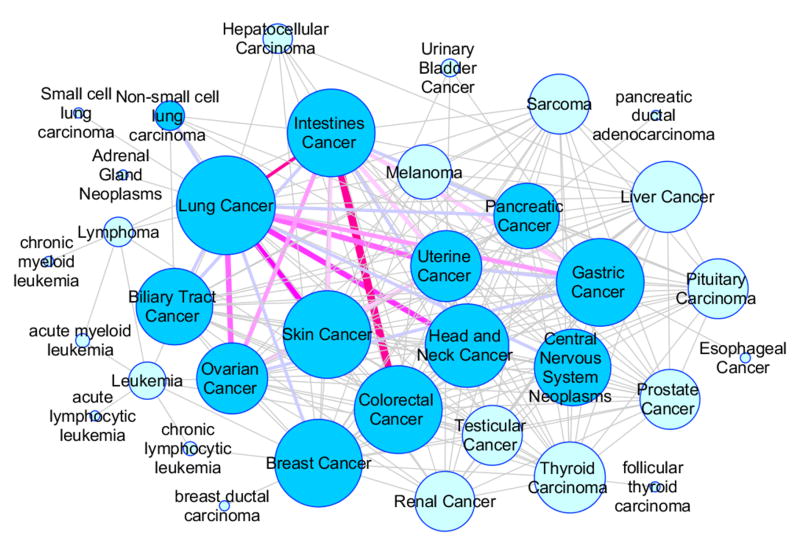
Thousands of crVARs have been reported and many of them are shared by multiple cancer types. Previous studies have reported mutation similarities among cancer types. For example, ERBB2/HER2 is a driver in subsets of glioblastoma, gastric, serous endometrial, bladder and lung cancers37.Figure 9 shows an association network of cancers, in which two cancer types were linked if they share a common crVAR. There are 217 edges and 35 nodes in the network. The crVAR V600E in BRAF protein (ENSP00000288602), which is a therapeutic target of metastatic melanoma, is shared by 17 cancer types. Similarly, mutation G12* in KRAS, S37* in CTNNB1 and R248* in TP53 were found in multiple cancer types. The average node degree of the network is six, and about two-thirds of the cancer types have 18 or more links. With an degree of 25, lung cancer has the most connections with other cancer types. In contrast, leukemia has very few connections. These results can be partially explained by mutation frequency difference in different tumor types. Lung cancers from smokers may have four folds more mutations than the average, whereas leukemia has far fewer mutations38.
Figure 9. Association network of cancers.
This network was constructed based on shared crVARs. Two cancer types were linked if they had common crVARs. The network has 217 edges, and the edge width represents the number of shared crVARs between the two connected cancer types. The node size corresponds to the degree in the network.
Discussion
We updated and expanded CanProVar as a public resource to store and characterize cancer-related alterations of single amino acid in the human proteome as well as variations detected in normal samples. CanProVar 2.0 allows users to retrieve protein-level annotations about a variation, such as the corresponding cancer samples, publications, and potential functional impact as suggested by analyses based on evolution conservation, protein expression, protein domains, and protein 3D interaction. CanProVar 2.0 not only includes increased numbers of crVARs and ncsVARs but also provides more flexible query methods, such as queries based on chromosome locations or KEGG pathways.
We analyzed the ratios of ‘crVARs: ncsVARs’ in proteins collected in CanProVar 2.0 and found several significantly over-mutated proteins. Interestingly, 35 of the 167 significantly mutated genes in CanProVar 2.0 are in common with genes in the driver gene list described by Vogelstein et al.38. Although the ‘crVARs: ncsVARs’ ratio provides a simple means to identify some of the driver genes, the data should be interpreted carefully. More sophisticated statistical analyses are required for the accurate identification of driver genes.
In the human structural interaction network (hSIN), Wang et al. reported that disease-associated mutations are significantly enriched on interaction interfaces with respect to the relative length of interfaces of the whole proteins (odds ratio = 2.1, P < 10-20 with a Z-test)20. We investigated the position of the crVARs in regard to the interaction interfaces on corresponding proteins. Among the 15,039 crVARs, we found that 8,039 are located on interaction interfaces, and are significantly enriched (odds ratio = 2.3).
Tremendous amount of variations have been detected and publically released, and much remains to be done 39,40. A challenge we are facing in the next step is to develop powerful methods or tools to identify patterns or key characteristics of driver mutations for the identification of new driver mutations. The Pan-Cancer project launched by TCGA in 2012 has begun to provide novel insights into this37. One major challenge in future studies is to integrate proteomics into cancer studies. We believe the development of the CanProVar database can help accelerate the integration between genomic and proteomic studies.
Supplementary Material
Figure S1. Hot chromosome locations containing one or more significant peaks of variations.
Table S1. 167 mutated proteins with higher ‘crVARs : ncrVARs’ ratios in cancers.
Acknowledgments
We acknowledge Page Hoskins from Vanderbilt Center for Quantitative Sciences for her great editing work. This work was supported by the National Natural Science Foundation of China (31271416), the National Key Basic Research Program (2011CB910204, 2012CB910102),and National Key Research and Development Plan (2016YFC0902403). BZ is supported by National Cancer Institute (NCI) CPTAC award U24CA210954.
References
- 1.Garraway LA, Lander ES. Lessons from the cancer genome. Cell. 2013;153(1):17–37. doi: 10.1016/j.cell.2013.03.002. [DOI] [PubMed] [Google Scholar]
- 2.Forbes SA, Bindal N, Bamford S, Cole C, Kok CY, Beare D, Jia M, Shepherd R, Leung K, Menzies A. COSMIC: mining complete cancer genomes in the Catalogue of Somatic Mutations in Cancer. Nucleic acids research. 2011;39(suppl 1):D945–D950. doi: 10.1093/nar/gkq929. [DOI] [PMC free article] [PubMed] [Google Scholar]
- 3.Weinstein JN, Collisson EA, Mills GB, Shaw KRM, Ozenberger BA, Ellrott K, Shmulevich I, Sander C, Stuart JM, Network CGAR. The cancer genome atlas pan-cancer analysis project. Nature genetics. 2013;45(10):1113–1120. doi: 10.1038/ng.2764. [DOI] [PMC free article] [PubMed] [Google Scholar]
- 4.Altshuler DM, Gibbs RA, Peltonen L, Dermitzakis E, Schaffner SF, Yu F, Bonnen PE, De Bakker P, Deloukas P, Gabriel SB. Integrating common and rare genetic variation in diverse human populations. Nature. 2010;467(7311):52–58. doi: 10.1038/nature09298. [DOI] [PMC free article] [PubMed] [Google Scholar]
- 5.Clarke L, Zheng-Bradley X, Smith R, Kulesha E, Xiao C, Toneva I, Vaughan B, Preuss D, Leinonen R, Shumway M. The 1000 Genomes Project: data management and community access. Nature methods. 2012;9(5):459–462. doi: 10.1038/nmeth.1974. [DOI] [PMC free article] [PubMed] [Google Scholar]
- 6.Ellis MJ, Gillette M, Carr SA, Paulovich AG, Smith RD, Rodland KK, Townsend RR, Kinsinger C, Mesri M, Rodriguez H. Connecting Genomic Alterations to Cancer Biology with Proteomics: The NCI Clinical Proteomic Tumor Analysis Consortium. Cancer discovery. 2013;3(10):1108–1112. doi: 10.1158/2159-8290.CD-13-0219. [DOI] [PMC free article] [PubMed] [Google Scholar]
- 7.Zhang B, Wang J, Wang X, Zhu J, Liu Q, Shi Z, Chambers MC, Zimmerman LJ, Shaddox KF, Kim S, Davies SR, Wang S, Wang P, Kinsinger CR, Rivers RC, Rodriguez H, Townsend RR, Ellis MJ, Carr SA, Tabb DL, Coffey RJ, Slebos RJ, Liebler DC. Proteogenomic characterization of human colon and rectal cancer. Nature. 2014;513(7518):382–7. doi: 10.1038/nature13438. [DOI] [PMC free article] [PubMed] [Google Scholar]
- 8.Mertins P, Mani DR, Ruggles KV, Gillette MA, Clauser KR, Wang P, Wang X, Qiao JW, Cao S, Petralia F, Kawaler E, Mundt F, Krug K, Tu Z, Lei JT, Gatza ML, Wilkerson M, Perou CM, Yellapantula V, Huang KL, Lin C, McLellan MD, Yan P, Davies SR, Townsend RR, Skates SJ, Wang J, Zhang B, Kinsinger CR, Mesri M, Rodriguez H, Ding L, Paulovich AG, Fenyo D, Ellis MJ, Carr SA. Proteogenomics connects somatic mutations to signalling in breast cancer. Nature. 2016;534(7605):55–62. doi: 10.1038/nature18003. [DOI] [PMC free article] [PubMed] [Google Scholar]
- 9.Li J, Duncan DT, Zhang B. CanProVar: a human cancer proteome variation database. Human mutation. 2010;31(3):219–228. doi: 10.1002/humu.21176. [DOI] [PMC free article] [PubMed] [Google Scholar]
- 10.Li J, Su Z, Ma ZQ, Slebos RJ, Halvey P, Tabb DL, Liebler DC, Pao W, Zhang B. A bioinformatics workflow for variant peptide detection in shotgun proteomics. Molecular & Cellular Proteomics. 2011;10(5) doi: 10.1074/mcp.M110.006536. [DOI] [PMC free article] [PubMed] [Google Scholar]
- 11.McLendon R, Friedman A, Bigner D, Van Meir EG, Brat DJ, Mastrogianakis GM, Olson JJ, Mikkelsen T, Lehman N, Aldape K. Comprehensive genomic characterization defines human glioblastoma genes and core pathways. Nature. 2008;455(7216):1061–1068. doi: 10.1038/nature07385. [DOI] [PMC free article] [PubMed] [Google Scholar]
- 12.O'Donovan C, Apweiler R, Bairoch A. The human proteomics initiative (HPI) TRENDS in Biotechnology. 2001;19(5):178–180. doi: 10.1016/s0167-7799(01)01598-0. [DOI] [PubMed] [Google Scholar]
- 13.Hamosh A, Scott AF, Amberger JS, Bocchini CA, McKusick VA. Online Mendelian Inheritance in Man (OMIM), a knowledgebase of human genes and genetic disorders. Nucleic acids research. 2005;33(suppl 1):D514–D517. doi: 10.1093/nar/gki033. [DOI] [PMC free article] [PubMed] [Google Scholar]
- 14.Kasprzyk A. BioMart: driving a paradigm change in biological data management. Database: The Journal of Biological Databases and Curation. 2011:2011. doi: 10.1093/database/bar049. [DOI] [PMC free article] [PubMed] [Google Scholar]
- 15.Ding L, Getz G, Wheeler DA, Mardis ER, McLellan MD, Cibulskis K, Sougnez C, Greulich H, Muzny DM, Morgan MB. Somatic mutations affect key pathways in lung adenocarcinoma. Nature. 2008;455(7216):1069–1075. doi: 10.1038/nature07423. [DOI] [PMC free article] [PubMed] [Google Scholar]
- 16.Greenman C, Stephens P, Smith R, Dalgliesh GL, Hunter C, Bignell G, Davies H, Teague J, Butler A, Stevens C. Patterns of somatic mutation in human cancer genomes. Nature. 2007;446(7132):153–158. doi: 10.1038/nature05610. [DOI] [PMC free article] [PubMed] [Google Scholar]
- 17.Sjöblom T, Jones S, Wood LD, Parsons DW, Lin J, Barber TD, Mandelker D, Leary RJ, Ptak J, Silliman N. The consensus coding sequences of human breast and colorectal cancers. science. 2006;314(5797):268–274. doi: 10.1126/science.1133427. [DOI] [PubMed] [Google Scholar]
- 18.Dreszer TR, Karolchik D, Zweig AS, Hinrichs AS, Raney BJ, Kuhn RM, Meyer LR, Wong M, Sloan CA, Rosenbloom KR. The UCSC Genome Browser database: extensions and updates 2011. Nucleic acids research. 2012;40(D1):D918–D923. doi: 10.1093/nar/gkr1055. [DOI] [PMC free article] [PubMed] [Google Scholar]
- 19.Cimino JJ, Hayamizu TF, Bodenreider O, Davis B, Stafford GA, Ringwald M. The caBIG terminology review process. Journal of biomedical informatics. 2009;42(3):571–580. doi: 10.1016/j.jbi.2008.12.003. [DOI] [PMC free article] [PubMed] [Google Scholar]
- 20.Wang X, Wei X, Thijssen B, Das J, Lipkin SM, Yu H. Three-dimensional reconstruction of protein networks provides insight into human genetic disease. Nature biotechnology. 2012 doi: 10.1038/nbt.2106. [DOI] [PMC free article] [PubMed] [Google Scholar]
- 21.He Y, Zhang M, Ju Y, Yu Z, Lv D, Sun H, Yuan W, He F, Zhang J, Li H. dbDEPC 2.0: updated database of differentially expressed proteins in human cancers. Nucleic acids research. 2012;40(D1):D964–D971. doi: 10.1093/nar/gkr936. [DOI] [PMC free article] [PubMed] [Google Scholar]
- 22.Salwinski L, Miller CS, Smith AJ, Pettit FK, Bowie JU, Eisenberg D. The database of interacting proteins: 2004 update. Nucleic acids research. 2004;32(suppl 1):D449–D451. doi: 10.1093/nar/gkh086. [DOI] [PMC free article] [PubMed] [Google Scholar]
- 23.Ceol A, Aryamontri AC, Licata L, Peluso D, Briganti L, Perfetto L, Castagnoli L, Cesareni G. MINT, the molecular interaction database: 2009 update. Nucleic acids research. 2010;38(suppl 1):D532–D539. doi: 10.1093/nar/gkp983. [DOI] [PMC free article] [PubMed] [Google Scholar]
- 24.Prasad TK, Goel R, Kandasamy K, Keerthikumar S, Kumar S, Mathivanan S, Telikicherla D, Raju R, Shafreen B, Venugopal A. Human protein reference database—2009 update. Nucleic acids research. 2009;37(suppl 1):D767–D772. doi: 10.1093/nar/gkn892. [DOI] [PMC free article] [PubMed] [Google Scholar]
- 25.Kerrien S, Aranda B, Breuza L, Bridge A, Broackes-Carter F, Chen C, Duesbury M, Dumousseau M, Feuermann M, Hinz U. The IntAct molecular interaction database in 2012. Nucleic acids research. 2012;40(D1):D841–D846. doi: 10.1093/nar/gkr1088. [DOI] [PMC free article] [PubMed] [Google Scholar]
- 26.Stark C, Breitkreutz BJ, Chatr-Aryamontri A, Boucher L, Oughtred R, Livstone MS, Nixon J, Van Auken K, Wang X, Shi X. The BioGRID interaction database: 2011 update. Nucleic acids research. 2011;39(suppl 1):D698–D704. doi: 10.1093/nar/gkq1116. [DOI] [PMC free article] [PubMed] [Google Scholar]
- 27.Ogata H, Goto S, Sato K, Fujibuchi W, Bono H, Kanehisa M. KEGG: Kyoto encyclopedia of genes and genomes. Nucleic acids research. 1999;27(1):29–34. doi: 10.1093/nar/27.1.29. [DOI] [PMC free article] [PubMed] [Google Scholar]
- 28.Sager R. Expression genetics in cancer: shifting the focus from DNA to RNA. Proc Natl Acad Sci U S A. 1997;94(3):952–5. doi: 10.1073/pnas.94.3.952. [DOI] [PMC free article] [PubMed] [Google Scholar]
- 29.Zhao H, Zhang J, Lu J, He X, Chen C, Li X, Gong L, Bao G, Fu Q, Chen S, Lin W, Shi H, Ma J, Liu X, Ma Q, Yao L. Reduced expression of N-Myc downstream-regulated gene 2 in human thyroid cancer. BMC Cancer. 2008;8:303. doi: 10.1186/1471-2407-8-303. [DOI] [PMC free article] [PubMed] [Google Scholar]
- 30.Kandoth C, McLellan MD, Vandin F, Ye K, Niu B, Lu C, Xie M, Zhang Q, McMichael JF, Wyczalkowski MA, Leiserson MD, Miller CA, Welch JS, Walter MJ, Wendl MC, Ley TJ, Wilson RK, Raphael BJ, Ding L. Mutational landscape and significance across 12 major cancer types. Nature. 2013;502(7471):333–9. doi: 10.1038/nature12634. [DOI] [PMC free article] [PubMed] [Google Scholar]
- 31.Bieche I, Lidereau R. Genetic alterations in breast cancer. Genes Chromosomes Cancer. 1995;14(4):227–51. doi: 10.1002/gcc.2870140402. [DOI] [PubMed] [Google Scholar]
- 32.Scully C, Field JK, Tanzawa H. Genetic aberrations in oral or head and neck squamous cell carcinoma 2: chromosomal aberrations. Oral Oncol. 2000;36(4):311–27. doi: 10.1016/s1368-8375(00)00021-x. [DOI] [PubMed] [Google Scholar]
- 33.Song MS, Salmena L, Pandolfi PP. The functions and regulation of the PTEN tumour suppressor. Nature Reviews Molecular Cell Biology. 2012 doi: 10.1038/nrm3330. [DOI] [PubMed] [Google Scholar]
- 34.Wooster R, Neuhausen SL, Mangion J, Quirk Y, Ford D, Collins N, Nguyen K, Seal S, Tran T, Averill D. Localization of a breast cancer susceptibility gene, BRCA2, to chromosome 13q12-13. Science (New York, NY) 1994;265(5181):2088. doi: 10.1126/science.8091231. [DOI] [PubMed] [Google Scholar]
- 35.Wooster R, Bignell G, Lancaster J, Swift S, Seal S, Mangion J, Collins N, Gregory S, Gumbs C, Micklem G. Identification of the breast cancer susceptibility gene BRCA2. Nature. 1995;378(6559):789–792. doi: 10.1038/378789a0. [DOI] [PubMed] [Google Scholar]
- 36.Tavtigian S, Simard J, Rommens J, Couch F, Shattuck-Eidens D, Neuhausen S, Merajver S, Thorlacius S, Offit K, Stoppa-Lyonnet D. The complete BRCA2 gene and mutations in chromosome 13q-linked kindreds. Nature genetics. 1996;12(3):333–337. doi: 10.1038/ng0396-333. [DOI] [PubMed] [Google Scholar]
- 37.Weinstein JN, Collisson EA, Mills GB, Shaw KR, Ozenberger BA, Ellrott K, Shmulevich I, Sander C, Stuart JM. The Cancer Genome Atlas Pan-Cancer analysis project. Nat Genet. 2013;45(10):1113–20. doi: 10.1038/ng.2764. [DOI] [PMC free article] [PubMed] [Google Scholar]
- 38.Vogelstein B, Papadopoulos N, Velculescu VE, Zhou S, Diaz LA, Jr, Kinzler KW. Cancer genome landscapes. Science. 2013;339(6127):1546–58. doi: 10.1126/science.1235122. [DOI] [PMC free article] [PubMed] [Google Scholar]
- 39.Hoadley KA, Yau C, Wolf DM, Cherniack AD, Tamborero D, Ng S, Leiserson MD, Niu B, McLellan MD, Uzunangelov V, Zhang J, Kandoth C, Akbani R, Shen H, Omberg L, Chu A, Margolin AA, Van't Veer LJ, Lopez-Bigas N, Laird PW, Raphael BJ, Ding L, Robertson AG, Byers LA, Mills GB, Weinstein JN, Van Waes C, Chen Z, Collisson EA, Benz CC, Perou CM, Stuart JM. Multiplatform analysis of 12 cancer types reveals molecular classification within and across tissues of origin. Cell. 2014;158(4):929–44. doi: 10.1016/j.cell.2014.06.049. [DOI] [PMC free article] [PubMed] [Google Scholar]
- 40.Zheng S, Cherniack AD, Dewal N, Moffitt RA, Danilova L, Murray BA, Lerario AM, Else T, Knijnenburg TA, Ciriello G, Kim S, Assie G, Morozova O, Akbani R, Shih J, Hoadley KA, Choueiri TK, Waldmann J, Mete O, Robertson AG, Wu HT, Raphael BJ, Shao L, Meyerson M, Demeure MJ, Beuschlein F, Gill AJ, Sidhu SB, Almeida MQ, Fragoso MC, Cope LM, Kebebew E, Habra MA, Whitsett TG, Bussey KJ, Rainey WE, Asa SL, Bertherat J, Fassnacht M, Wheeler DA, Hammer GD, Giordano TJ, Verhaak RG. Comprehensive Pan-Genomic Characterization of Adrenocortical Carcinoma. Cancer Cell. 2016;29(5):723–36. doi: 10.1016/j.ccell.2016.04.002. [DOI] [PMC free article] [PubMed] [Google Scholar]
Associated Data
This section collects any data citations, data availability statements, or supplementary materials included in this article.
Supplementary Materials
Figure S1. Hot chromosome locations containing one or more significant peaks of variations.
Table S1. 167 mutated proteins with higher ‘crVARs : ncrVARs’ ratios in cancers.


