

Abstract
The concentrations of fourteen neurochemicals associated with metabolism, neurotransmission, antioxidant capacity, and cellular structure were measured noninvasively from two distinct brain regions using 1H magnetic resonance spectroscopy. Seventeen young adults (age 19 – 22 years) and sixteen cognitively normal older adults (age 70 – 88 years) were scanned. To increase sensitivity and specificity, 1H magnetic resonance spectra were obtained at the ultra-high field of 7 T and at ultra-short echo time. The concentrations of neurochemicals were determined using water as an internal reference and accounting for gray matter, white matter, and cerebrospinal fluid content of the volume of interest. In the posterior cingulate cortex (PCC), the concentrations of neurochemicals associated with energy (i.e., creatine plus phosphocreatine), membrane turnover (i.e., choline containing compounds), and gliosis (i.e., myo-inositol) were higher in the older adults while the concentrations of N-acetylaspartylglutamate (NAAG) and phosphorylethanolamine (PE) were lower. In the occipital cortex (OCC), the concentration of N-acetylaspartate (NAA), a marker of neuronal viability, concentrations of the neurotransmitters Glu and NAAG, antioxidant ascorbate (Asc), and PE were lower in the older adults while the concentration of choline containing compounds was higher. Altogether, these findings shed light on how the human brain ages differently depending on region.
Keywords: magnetic resonance spectroscopy, human brain, aging, neurochemicals, noninvasive, cellular
Introduction
Proton magnetic resonance spectroscopy (1H MRS) can be used to noninvasively investigate age-associated neurochemical concentrations in vivo in the human brain. Each observable neurochemical can provide distinctive information because neurochemical levels are sensitive to different in vivo processes. In particular, N-acetylaspartate (NAA) is a putative marker of neuronal viability (Brand et al., 1993, Urenjak et al., 1993, Mountford et al., 2010, Duarte et al., 2012, Rae, 2014), creatine (Cr) and phosphocreatine (PCr) are neuronal energy substrates, glycerophosphorylcholine (GPC), phosphorylcholine (PCho), phosphorylethanolamine (PE), and myo-inositol (mIns) are associated with membrane turnover (Michaelis et al., 1993, Boulanger et al., 2000, Duarte et al., 2012, Rae, 2014), PE is also associated with myelination (Rao et al., 2013), N-acetylaspartylglutamate (NAAG) is a neuromodulatory peptide (Moffett et al., 2007, Duarte et al., 2012), ascorbate (Asc) is an antioxidant (Rice and Russo-Menna, 1998), and glutamate (Glu) is a neurotransmitter. Also, some neurochemicals are preferentially concentrated in certain cell types. For example, NAA, NAAG, Asc, and Glu are primarily neuronal (Rice and Russo-Menna, 1998, Moffett et al., 2007, Duarte et al., 2012, Rae, 2014). mIns is predominantly concentrated in glia (Brand et al., 1993, Duarte et al., 2012, Rae, 2014), and may be a glial marker (Brand et al., 1993, Moffett et al., 2007, Duarte et al., 2012, Rae, 2014).
Approaches other than MRS have shown that blood flow, metabolism, and connectivity in the human brain are impacted by aging and disease in a region-specific fashion. In the posterior cingulate cortex (PCC), age-associated differences in cerebral blood flow (CBF) (Martin et al., 1991) and glucose uptake (Zuendorf et al., 2003) have been documented. The PCC is the hub of the default mode network (DMN) (Leech and Sharp, 2014). The DMN is known to deteriorate during both aging (Sambataro et al., 2010, Sala-Llonch et al., 2015, Joo et al., 2016) and Alzheimer’s disease (AD) (Lustig et al., 2003, Dennis and Thompson, 2014). Metabolism and blood flow in the PCC are also impacted by AD (Boulanger et al., 2000, Kantarci et al., 2007, Hof, 2009, Leech and Sharp, 2014, Iizuka and Kameyama, 2016), possibly because of the many types of connections that the PCC has to the hippocampus. Thus, the PCC is relevant to the neurobiology of healthy and aberrant aging. Advancing knowledge about this region and developing technology for future studies are valuable to ongoing investigation of cognitive decline.
In contrast, aging does not tend to affect the human occipital cortex (OCC). The OCC is consistently noted among regions with the least age-associated glucose uptake difference (Zuendorf et al., 2003, Kalpouzos et al., 2009). The OCC is not part of the DMN. Changes in CBF are rarely reported in this region. However, the OCC tends to be included in multi-region investigations of brain aging (Christiansen et al., 1993, Saunders et al., 1999, Eylers et al., 2016). Additionally, scanning both the PCC and the OCC improved specificity for detecting AD with 1H MRS (Kantarci, 2007). Age-associated differences in neurochemical concentrations have been shown to be specific to brain region (Kaiser et al., 2005). Thus the OCC is a suitable control region to the PCC for studying aging and working toward mitigating cognitive decline.
In the PCC, NAA, total Cr (tCr = Cr + PCr), and choline containing compounds (tCho = GPC + PCho) have been measured in the context of aging using 1H MRS in several studies (Robertson et al., 2001, Chang et al., 2009, Reyngoudt et al., 2012, Chiu et al., 2014, Fayed et al., 2014). Three studies reported higher tCho concentration in older adults (Robertson et al., 2001, Chiu et al., 2014, Fayed et al., 2014), while two did not find a significant difference (Chang et al., 2009, Reyngoudt et al., 2012). For tCr, two studies reported higher concentration in older adults (Reyngoudt et al., 2012, Chiu et al., 2014), while two did not find a difference (Robertson et al., 2001, Chang et al., 2009). For NAA, conflicting results have been reported. One study reported higher (Chiu et al., 2014) and one study lower (Fayed et al., 2014) age-associated NAA, and three other studies (Robertson et al., 2001, Chang et al., 2009, Reyngoudt et al., 2012) did not find a significant difference. Higher mIns (Reyngoudt et al., 2012, Fayed et al., 2014) and lower Glu (Chang et al., 2009, Fayed et al., 2014) have also been reported in the PCC in older adults. In summary, age-associated differences in NAA concentration in the PCC are controversial, and only a few studies have reported differences in tCr, tCho, mIns, and Glu.
NAA, tCr, and tCho concentrations have also been measured on several occasions in the OCC in the context of aging (Christiansen et al., 1993, Saunders et al., 1999, Eylers et al., 2016). For tCho and tCr, the absence of significant age-associated difference has been consistently observed (Christiansen et al., 1993, Saunders et al., 1999, Eylers et al., 2016). The absence of significant difference has also been reported for mIns (Saunders et al., 1999) and for NAA on one occasion (Saunders et al., 1999). Lower NAA in older adults has been reported on a few occasions (Christiansen et al., 1993, Eylers et al., 2016), although under circumstances that could have been impacted by age-associated differences in the transverse relaxation time constant (T2) of NAA. The T2s of NAA, tCr and tCho have been shown to be shorter in older adults (Marjanska et al., 2013). Therefore, further investigation is warranted of whether there are age-associated differences in neurochemical concentrations in this region that appears to be minimally impacted by aging.
The goal of this project was to quantify brain region specific neurochemical concentrations in the context of human aging with greater sensitivity and accuracy than has been achieved in the past. Sensitivity and specificity gains that can be achieved using ultra-high field, 7 T, 1H MRS were expected to: increase power for measuring age-associated differences, add perspective to the small number of studies that have reported such differences, and detect differences in additional neurochemicals. Scanning was implemented at ultra-short echo time to resolve the ambiguity that arises from age-associated differences in T2 of neurochemicals.
Experimental Procedures
Subjects
Seventeen young adults (7 males, 10 females; age: 21 ± 1 (mean ± standard deviation) years; age range 19 to 22 years) and 16 older adults (9 males, 7 females; age: 78 ± 5 years; age range 70 to 88 years) provided informed consent according to procedures approved by the Human Subjects’ Protection Committee at the University of Minnesota, Institutional Review Board. All participants underwent an MRI exam at 7 T, and 5 young and 6 older participants underwent two additional retest scans (for a total of 3 scans at approximately weekly intervals). Dietary influence was controlled by recruiting participants who consumed fewer than 5 fruits and vegetables per day and no more than the recommended daily allowance of supplements. Circadian variance (O’Neill et al., 1983) was controlled by scanning all participants between 9 AM and 12 PM. Exclusion criteria for all participants were claustrophobia, non-removable metallic objects of concern for MRI, weight > 113 kg accompanied by BMI > 35, pregnancy, smoking, score < 24 on the Montreal Cognitive Assessment (MoCA (Nasreddine et al., 2005)), and score ≥ 20 on the Beck Depression Inventory 2nd Revision (BDI-II (Beck et al., 1996)).
Young adults self-reported health conditions and medication usage. The study neurologist, JRM, reviewed all older adults to exclude those with extant or suspected incipient neurological disease. He reviewed with each participant their medical history and performed a neurological examination on the day of the MRI exam. Exclusion criteria for older adults were: self-reported memory or cognitive concerns, unstable medication regimens or use of medications that, in the opinion of the neurologist, were likely to adversely affect brain function, current symptoms of a major psychiatric disorder, history of alcohol or substance abuse or dependence within the past two years, history of significant cerebrovascular disease, seizure, traumatic brain injury, untreated or poorly controlled sleep disorder (e.g., sleep apnea), or other neurological or medical conditions, that potentially could affect cognition including creatinine clearance < 45 mL/min (Cockcroft and Gault, 1976), and/or use of any investigational drugs within the last 30 days or longer, depending on the drug in question.
MR acquisition
In vivo data were obtained on a 7-T, 90-cm horizontal bore magnet (Magnex Scientific Inc., Oxford, UK) interfaced with a Siemens console running syngo VB17 (Siemens, Erlangen, Germany). The magnet was equipped with a body gradient coil (maximum amplitude: 70 mT/m, slew rate: 200 mT/m/ms). A 16-channel transmission line head array radiofrequency (RF) coil (Adriany et al., 2008) was used to transmit and receive the signal. The transmit phase of each coil channel was controlled with an independent 1-kW RF amplifier (CPC, Brentwood, NY, USA). An RF power monitoring system measured the forward and reflected power for each channel to ensure that the local specific absorption rate did not exceed 3 W/kg.
Magnetization-prepared rapid gradient-echo (MPRAGE) images (Brant-Zawadzki et al., 1992) (TR = 3 s; TE = 3.27 ms; field of view: 256 × 256 mm2; matrix: 256 × 256; slice thickness = 1 mm, 176 slices, acceleration factor = 3, acquisition time: 4 min 17 s) were acquired to position 8 mL volumes-of-interest (VOIs) in the PCC and the OCC. VOIs were positioned symmetrically in both hemispheres. The PCC VOI was rotated to align with the corpus callosum and placed in the parietal lobe, 2 mm posterior to the marginal sulcus, and 2 mm superior of the corpus callosum. The OCC VOI was rotated to align with the boundaries of the occipital lobe and placed in the center of the occipital lobe vertically while the back corner was placed 4 mm anterior to the back of the occipital lobe. Proton-density (PD) images (TR = 1.41 s; TE = 3.27 ms; field of view: 256 × 256 mm2; matrix: 256 × 256; slice thickness = 1 mm, 176 slices, acceleration factor = 3, acquisition time: 2 min) were also acquired to correct for the intensity field bias in T1-weighted MPRAGE images (Van de Moortele et al., 2009). To maximize the transmit B1 in the VOIs, fast local shimming of the phase of B1+ for each coil channel was employed (Van de Moortele et al., 2005, Metzger et al., 2008). B0 shimming of first- and second-order terms was achieved using the fast automatic shimming technique by mapping along projections with echo planar imaging readout (FAST(EST)MAP, (Gruetter, 1993, Gruetter and Tkac, 2000)). MR spectra were measured using a stimulated echo acquisition mode (STEAM) sequence with ultra-short echo time (TR = 5 s; TE = 8 ms; mixing time (TM) = 32 ms; 128 averages in PCC and 64 averages in OCC) and with 3D outer volume suppression interleaved with variable power and optimized relaxation delay (VAPOR) water suppression (Tkac et al., 2001). The chemical shift displacement of the VOI was 4% per ppm. Each free induction decay was acquired with 2048 complex data points using a spectral width of 6 kHz. A non-suppressed water spectrum was acquired for eddy current correction and absolute quantification (TR = 5 s; TE = 8 ms; TM = 32 ms; 1 average). Multi-slice gradient echo images (TR = 177 ms; TE = 8.23 ms; field of view: 192 × 192 mm2; matrix: 128 × 128; slice thickness = 3 mm, 16 slices, acquisition time: 24 s) were acquired in sagittal, coronal and transversal orientation before and after acquisition of MR spectra to monitor head motion. Each subject spent about 1 hour in the magnet.
Image processing and analysis
MPRAGE images were pre-flattened by dividing by the PD images (Van de Moortele et al., 2009) using FSL, a comprehensive library of analysis tools for fMRI, MRI, and DTI brain imaging data (Jenkinson et al., 2012). Images were further flattened using statistical parametric mapping (SPM) (Friston et al., 1995) and segmented into GM, WM, and CSF content using Freesurfer (Fischl et al., 2002). The tissue composition was extracted for each VOI using analysis of functional neuro images (AFNI) (Cox, 1996). For retest studies, the images from the three scanning sessions were aligned using AFNI. The number of pixels that were common to the VOI was counted. Fractional VOI overlap was calculated by dividing the number of common pixels for the three scanning sessions by the total number of pixels. The coefficient of variation in the measurement of CSF content was computed by placing VOI on all of the images measured from a given test-retest study participant.
Multi-slice gradient echo images were used to measure translational head motion in three orthogonal directions based on landmarks such as large blood vessels and sulci in or between VOI. This translational head motion was measured over acquisition of the spectrum from each brain VOI as well as over the entire length of spectral acquisition.
Spectral processing and quantification
The acquired spectra were processed in Matlab (MathWorks Inc., Natick, MA). Eddy-current effects were corrected using the non-suppressed water spectrum. Single-shot spectra were frequency and phase aligned using a cross-correlation algorithm.
All spectra were analyzed using LCModel (Provencher, 1993, 2001) 6.3-1J (Stephen Provencher, Inc., Oakville, ON, Canada) with the basis set simulated using the density matrix formalism (Henry et al., 2006) with ideal pulses and actual echo time and mixing time and previously published chemical shifts and J-couplings (Govindaraju et al., 2000, Kaiser et al., 2010, Govind et al., 2015). The following metabolites were included in the basis set: ascorbate (Asc), aspartate (Asp), Cr, GABA, glucose (Glc), glutamine (Gln), Glu, glutathione (GSH), GPC, lactate (Lac), mIns, NAA, NAAG, PCr, PCho, PE, scyllo-inositol (sIns), and taurine (Tau). Age-specific macromolecule spectra were also included in the basis set. They were experimentally measured using the inversion-recovery technique (Behar et al., 1994) (TR = 2 s, TE = 8 ms, inversion time (TI) = 0.68 s) from the OCC of 4 young (total of 1532 averages) and 3 older (total of 960 averages) individuals. These age-specific macromolecule spectra were used for both brain regions since it has not been demonstrated that the macromolecular pattern is brain region dependent to the extent that it impacts metabolite quantification (Schaller et al., 2014, Snoussi et al., 2015). In addition, five standard lipid resonances provided by LCModel were included in the analysis at the following positions: 0.89, 1.26, 1.28, 1.28 (different linewidth), and 1.30 ppm. Two additional lipid resonances were simulated using LCModel to accommodate minor lipid contamination for the analysis of the OCC data at 1.12 and 1.44 ppm with the resonance at 1.12 ppm having negative amplitude. For the analysis of the PCC data, a single additional resonance was simulated using LCModel at 1.44 ppm to fit falx cerebri lipids (McIntyre et al., 2007), which have been observed previously in some older adults (Sijens et al., 2001). No baseline correction, zero-filling, or line broadening were applied to the in vivo data prior to the analysis. Spectra were fitted between 0.5 and 4.1 ppm using a knot spacing (DKNTMN) of 5 (Deelchand et al., 2016) to impose a flat spline baseline.
Quantification was performed using the unsuppressed water signal obtained from the same VOI as the neurochemical signals for normalization (Gussew et al., 2012). This water signal was corrected for GM, WM, and CSF content. The water content for CSF and WM were assumed to be 0.97 (Ernst et al., 1993) and 0.71 (Neeb et al., 2006, Abbas et al., 2014, Reetz et al., 2015), respectively for both age groups since water content has been reported to be constant with age in WM (Neeb et al., 2006). For GM, the water content was assumed to be 0.80 for young adults (Neeb et al., 2006, Abbas et al., 2014, Reetz et al., 2015), 0.79 for older women (Neeb et al., 2006) and 0.76 for older men (Neeb et al., 2006). T1 and T2 relaxation time constants of water used in the calculation of the attenuation factors were taken from published reports [T1(GM) = 2130 ms, T1(WM) = 1220 ms, T1(CSF) = 4425 (Rooney et al., 2007); T2(GM) = 50 ms, T2(WM) = 55 ms, T2(CSF) = 141 ms (Bartha et al., 2002)] and included a 10% reduction in T2 of tissue water in older adults (Marjanska et al., 2013) [T2(GM) = 45 ms, T2(WM) = 49.5 ms]. The T1 and T2 relaxation time constants of neurochemicals were not taken into consideration as attenuation factors since their T1 are shorter and their T2 are longer than water, thus the effect would be very small given the use of repetition time of 5 s and echo time of 8 ms.
All neurochemical concentrations were retained for statistical analysis, i.e., no data points were removed on the basis of their Cramér-Rao lower bounds (CRLB, an estimate of the lower limit of the variance) (Brooks et al., 2001, Kreis, 2016). If the spectral overlap caused the covariance between two neurochemicals to be high (correlation coefficient < −0.7) for all of the participants in both age groups and regions, the sum of the neurochemical concentrations was reported, specifically tCr = Cr + PCr, and tCho = PCho + GPC. Glc and Lac were not quantified because they are present in CSF (Oz et al., 2010).
Statistical analysis
The cohorts and brain regions were compared using a mixed linear model, which generalizes repeated-measures ANOVA to allow more general experimental designs. In the current study, there were test-retest data on subsets of both groups. Fixed effects were group (young vs. older), region (PCC vs. OCC), and their interaction, with group being a between-subject effect and the latter two within-subject effects. The interaction of age group with region tests whether the difference between young vs. older depends on region. Random effects were participant and replication within participant (i.e., retest). All analyses were done with JMP v. 12 Pro software (SAS Institute, Cary NC) using the restricted-likelihood method. This produced, among other results, an estimate of the standard deviation describing variation between retests in the same person. Mixed linear models implicitly account correctly for the different components of variation, which in this case include variation between persons, variation between retests for a given person, and error variation in an individual measurement (scan). The analysis also produced the region-specific age-associated concentration difference for each neurochemical and the associated p-value. The effect of sex was tested by adding the following effects to the mixed linear model: the sex main effect (are males systematically higher or lower than females?), the interaction of sex with group (does age effect depend on sex?), and the interaction of sex with region (does the difference between OCC and PCC depend on sex?). The effect of weight was analogously tested by adding the weight main effect, and the interaction of weight with group and region to the mixed linear model. CRLB were not used in this calculation, though the variation described by the CRLB was represented implicitly as part of the mixed linear model’s error (residual) term. To control for multiple testing (14 neurochemicals and 2 brain regions), the threshold of significance was 0.0018 = 0.05/28.
Results
High quality spectra were consistently measured (Figure 1). Extraneous coherences occurred rarely and were limited to the OCC of 4 participants (3 older and 1 young) for whom the added lipid resonance at 1.12 ppm was appreciable (i.e., with signal strength two to four times greater than in the spectra of the other participants). Falx cerebri lipids in the PCC were clearly visible at 1.44 ppm and fitted with substantial intensity (i.e., with signal strength approximately two times greater than in the spectra of the other participants) in 2 older participants. One of those participants took part in the test-retest aspect of the study, and the falx cerebri peak was present in the PCC spectra from all occasions. The tCr linewidths measured as the full width at half maximum of the resonance at 3.03 ppm were all ≤ 15.9 Hz. The signal-to-noise ratios of spectra reported by LCModel were all ≥ 23.
Figure 1. Data quality and voxel placement.

Representative 1H MR spectra from one young adult (top) and one older adult (bottom) acquired from volumes of interest (VOIs) positioned in the PCC and the OCC as shown on T1-weighted images. Spectra were acquired from 8 mL VOIs using a STEAM sequence (7 T, TR = 5 s, TE = 8 ms, number of averages = 128 for the PCC and 64 for the OCC). Spectra are shown with no line broadening applied and with vertical scaling reflecting measured NAA concentration.
Table in the Appendix lists the 14 neurochemicals that were quantified, and significance levels for the concentrations differences in each brain region. CRLB exceeded 35% in few instances, i.e., two for sIns and one for Asp. Figure 2 summarizes the significant age-associated differences in neurochemical concentrations. Compared to younger participants, the older adults showed lower concentrations of NAAG and PE, and a higher concentration of tCho in both brain regions. Of these, the difference between the age-associated effect on tCho concentration in the PCC and the age-associated effect on tCho concentration in the OCC was significant (p = 0.005). The older adults had lower NAA, Glu, and Asc in the OCC, and higher tCr and mIns in the PCC. Gln differed between sexes when ages and regions were pooled (p = 0.0015). There were no other noteworthy interactions of sex with neurochemical concentrations. While there were no noteworthy interactions of weight with neurochemical concentrations, an interaction of weight with region was observed for Asp (p = 0.003).
Appendix. Neurochemical concentrations and CRLB measured in young and older cohorts, summary statistics.
Concentrations and tissue properties are expressed as mean and standard error of the mean, and mean CRLB. The p-values for significantly different neurochemical concentrations for a given region are bolded. To account for the 14 neurochemicals and 2 brain regions being analyzed, the threshold of significance was 0.0018 = 0.05/28.
| PCC | OCC | |||||||||
|---|---|---|---|---|---|---|---|---|---|---|
| Neurochem ical |
Young Adults | Older Adults |
p- value |
Young Adults | Older Adults |
p- value |
||||
| Concentrat ion (mM) |
CRL B (mM ) |
Concentrat ion (mM) |
CRL B (mM ) |
Concentrat ion (mM) |
CRL B (mM ) |
Concentrat ion (mM) |
CRL B (mM ) |
|||
| Asc | 1.41 ± 0.04 | 0.19 | 1.26 ± 0.04 | 0.21 | 0.01 75 | 1.66 ± 0.04 | 0.19 | 1.42 ± 0.04 | 0.19 | 0.0002 |
| Asp | 1.86 ± 0.07 | 0.25 | 1.92 ± 0.07 | 0.30 | 0.53 | 1.74 ± 0.07 | 0.25 | 1.74 ± 0.07 | 0.26 | 0.97 |
| GABA | 0.78 ± 0.06 | 0.13 | 0.85 ± 0.06 | 0.15 | 0.45 | 0.89 ±0.06 | 0.13 | 1.03 ± 0.06 | 0.14 | 0.098 |
| Gln | 3.18 ± 0.08 | 0.16 | 3.36 ± 0.08 | 0.17 | 0.15 | 2.90 ± 0.08 | 0.15 | 2.99 ± 0.08 | 0.16 | 0.45 |
| Glu | 10.74 ± 0.15 | 0.21 | 10.09 ± 0.15 | 0.21 | 0.0036 | 9.99 ± 0.15 | 0.20 | 8.94 ± 0.15 | 0.18 | 1.2 × 10⁻⁵ |
| GSH | 1.07 ± 0.02 | 0.09 | 1.12 ± 0.02 | 0.10 | 0.16 | 1.00 ± 0.02 | 0.08 | 1.00 ± 0.02 | 0.09 | 0.90 |
| mIns | 7.12 ± 0.14 | 0.14 | 7.80 ± 0.15 | 0.17 | 0.0018 | 7.33 ± 0.14 | 0.15 | 7.80 ± 0.15 | 0.15 | 0.33 |
| NAA | 10.82 ± 0.15 | 0.13 | 10.72 ± 0.15 | 0.19 | 0.67 | 12.90 ± 0.15 | 0.13 | 11.57 ± 0.15 | 0.19 | 1.2 × 10⁻⁷ |
| NAAG | 1.17 ± 0.03 | 0.09 | 0.96 ± 0.03 | 0.11 | 1.5 × 10⁻⁵ | 1.38 ± 0.03 | 0.10 | 1.10 ± 0.03 | 0.11 | 2.9 × 10⁻⁸ |
| PE | 2.12 ± 0.05 | 0.19 | 1.21 ± 0.05 | 0.22 | 3 × 10⁻¹⁶ | 1.66 ± 0.05 | 0.19 | 0.82 ± 0.05 | 0.21 | 4 × 10⁻¹⁵ |
| sIns | 0.26 ± 0.05 | 0.04 | 0.47 ± 0.05 | 0.05 | 0.0091 | 0.28 ± 0.05 | 0.04 | 0.47 ± 0.05 | 0.04 | 0.02 |
| Tau | 1.86 ± 0.06 | 0.16 | 1.85 ± 0.06 | 0.18 | 0.90 | 1.75 ± 0.06 | 0.16 | 1.85 ± 0.06 | 0.16 | 0.28 |
| tCho | 1.21 ± 0.03 | 0.04 | 1.47 ± 0.03 | 0.05 | 1.8 × 10⁻⁷ | 0.96 ± 0.03 | 0.04 | 1.14 ± 0.03 | 0.05 | 0.0001 |
| tCr | 8.89 ± 0.14 | 0.09 | 9.63 ± 0.14 | 0.12 | 0.0005 | 9.26 ± 0.14 | 0.09 | 9.39 ± 0.14 | 0.10 | 0.53 |
| Tissue properties | ||||||||||
| GM (%) | 61 ± 1 | 46 ± 1 | 3 × 10⁻¹² | 50 ± 1 | 37 ± 1 | 2 × 10⁻¹⁰ | ||||
| WM (%) | 22.8 ± 0.9 | 23.9 ± 0.09 | 0.38 | 29.9 ± 0.9 | 36.3 ± 0.9 | 3.3 × 10⁻⁶ | ||||
| CSF (%) | 16 ± 1 | 30 ± 1 | 3 × 10⁻⁸ | 20 ± 1 | 27 ± 1 | 0.0034 | ||||
| tCr (3.03 ppm) linewidth (Hz) | 9.7 ± 0.2 | 11.6 ± 0.2 | 6.9 × 10⁻⁷ | 11.9 ± 0.2 | 13.3 ± 0.2 | 0.0001 | ||||
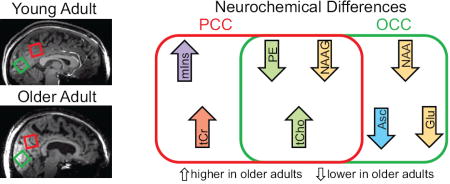
Figure 2. Age-associated concentration differences.

The neurochemicals for which differences were detected in one or both brain regions are symbolized by presence in one or both ovals: up arrows reflect higher concentration in older compared to young, down arrows reflect lower concentration in older compared to young. The neurochemicals can be divided into the following categories based on their function: glial marker (mIns = myo-inositol), membrane turnover (tCho = choline containing compounds, PE = phosphorylethanolamine), energy status (tCr = total creatine), neuronal marker (NAA = N-acetylaspartate), neurotransmitter (Glu = glutamate, NAAG = N-acetylaspartylglutamate), and antioxidant (Asc = ascorbate). PE may also be associated with myelination (not illustrated).
The CSF content was higher in the older adults in both brain regions. Using test-retest studies, the coefficient of variation in the measurement of the CSF content was 8% (range: 6 to 10%). Age groups or regions did not differ in the coefficient of variation. The GM content was lower in the older adults in both brain regions. The WM content was higher in the older adults in the OCC. The tCr linewidth was higher in the older adults in both brain regions.
Head motion during spectral acquisition was less than 4 mm for all except 4 studies. For all directions and timing subclasses, there were no head motion differences (p > 0.25) between the cohorts. Three dimensional pixel overlap for test-retest sessions was 82 ± 4% in the PCC (mean ± standard deviation) and 81 ± 5% in the OCC. There were no significant differences (p ≥ 0.5) in pixel overlap percentages between any of the age-region combinations. The consistency with which the VOIs were placed in the intended anatomical location is evidenced by the composition of the VOIs. In the PCC, most of the VOIs were composed of at least 81% precuneus and isthmus. For two older adults, the PCC VOI extended more posterior than for most of the participants and contained 22–23% of cuneus. For four older adults, the VOI extended more anterior than for most of the participants and contained 34–56% of posterior cingulate. Most of the OCC VOIs were composed of at least 93% cuneus, pericalcarine, lingual and latero-occipital regions except for one participant in whom 88% of the VOI was composed of these regions and also included fusiform.
On average the older adults were 14 kg heavier than the young. While no health conditions were noted among the young, 7 older adults reported hypertension and 1 older adult reported diet-controlled diabetes. The number of young adults reporting medication usage for anxiety, depression, allergies, or hyperparathyroidism was the same or smaller than the number of the older adults reporting the respective usage.
Discussion
Outcomes
Using ultra-high field, ultra-short echo time, 7 T 1H MRS offered new capabilities that contributed novel information. Increased spectral dispersion allowed first-time separation of NAA from NAAG in the context of aging, which increased the specificity of findings on NAA. This is the first study to report lower PE and NAAG in the PCC of older adults. This is also the first report of age-associated neurochemical concentration differences in the OCC that cannot be attributed to age-associated differences in T2, i.e., lower concentrations of NAA, NAAG, Glu, Asc, and PE, and higher concentration of tCho in older adults. For commonly detected compounds, i.e., tNAA, tCr, and tCho, the outcomes of this study agreed with majority of the literature for both brain regions.
The observed region-specific age-associated differences in neurochemical concentrations are not readily attributable to differences in VOI composition between young and older adults. Although the CSF content increased in both voxels in older adults, the effect of the CSF content on metabolite concentration was taken into account during quantification. In both voxels, the percentage of GM decreased and the percentage of WM increased with age. If known concentrations of the five commonly observed neurochemicals in GM and WM (Adany et al., 2016) are consulted, the changes in concentrations due only to difference in VOI composition would be relatively small (1 to 4%) for all except Glu, which has been reported to have 2 times higher concentration in GM than WM (Srinivasan et al., 2006). Except tCho, the expected outcome would be decrease in the metabolite concentration. However, an age-associated 10% decrease in NAA and Glu were observed in this study in the OCC, as was a 20% increase in tCho. In the PCC, age-associated increases in the concentrations of mIns, tCr, and tCho ranged from 8.3% to 21.5%.
The steady-state concentrations measured noninvasively in this study were sensitive to biochemical, structural, and microstructural processes, often through cellular and subcellular localization. Gyral atrophy and sulcal widening, common accompaniments of aging (Hof, 2009), were reflected by higher CSF content in the VOIs. The high metabolic demand of glial cells and neurons makes them particularly susceptible to oxidative stress via insufficient antioxidant potential (Manoharan et al., 2016) and microglial activation (Nakajima and Kohsaka, 2001). The age and brain region specific neurochemical profile signatures that were measured in this study reflect the cumulative influences of underlying processes including oxidative stress, reactive astrogliosis, neuronal functionality, membrane turnover, and myelination. For example, lower concentrations of the neuromodulatory peptide NAAG and PE, which is associated with membrane turnover and possibly myelination, and a higher concentration of tCho, which is associated with membrane turnover, were measured in older adults in both brain regions. This suggests that age-associated differences in neurotransmission, membrane turnover and possibly myelination occur not only in brain regions that are impacted by healthy and aberrant aging, such as the PCC, but also in regions that do not tend to be affected by aging, such as the OCC.
Additional age-associated differences in neurochemical concentrations were measured in the PCC in this study, i.e., higher concentrations of tCho, mIns, and tCr in older adults. These particular differences suggest that underlying microstructural processes such as increased membrane turnover (tCho), and reactive astrogliosis (mIns) strongly influence the neurochemical profile of the PCC (de Vellis, 2002, Hof, 2009). This appears to be accompanied by a higher concentration of the neuronal energy substrate, tCr, which is an important buffer, particularly for cells such as neurons, which have high and fluctuating energy requirements (Andres, et al., 2008, Beard and Braissant, 2010). Alongside the lower CBF and glucose uptake reported in the PCC of older adults (Martin et al., 1991, Zuendorf et al., 2003), the higher tCr concentration suggests lower utilization of energy, particularly by neurons.
In this study, the neurochemical profile of the OCC was found to be more impacted by aging than has previously been described. In the OCC, the concentrations of NAA, a marker of neuronal viability, the neurotransmitter Glu, and the antioxidant Asc were lower in the older adults. All of these neurochemicals are primarily neuronal. The absence of a concomitant difference in tCr, a substrate for neuronal energy metabolism, is consistent with the stage of excitotoxicity during which a harmful energy pathway that causes oxidative stress and damage to neurons is being used even though plenty of energy substrate is available (Sapolsky, 1992). Unaltered availability of energy substrate is also consistent with the minimal extent to which age-associated decreases in CBF and glucose uptake have been reported in the OCC. Since the existing literature does not tend to report on aging effects in the OCC, the age-associated differences in the neurochemical concentrations measured in this study can be thought of as modeling early stage changes.
While further investigation using more sensitive and specific approaches is needed, these findings suggest that 1H MRS is capable of detecting region-specific aspects of cellular aging. The findings in the PCC point towards reactive astrogliosis and deterioration of metabolic vigor, while the findings in the OCC are more consistent with strained neurons. To the extent that reactive astrogliosis is a response to excitotoxic strain (de Vellis, 2002), it may be possible for 1H MRS to detect an early and perhaps transient stage in the trajectory toward cognitive impairment, possibly while rescue of neuronal viability is still feasible.
Limitations
While state-of-the-art scanning, analysis, and quality control were applied in this study, persistent limitations in the fields of MRI and MRS may have impacted the measured outcomes. It is not feasible to predict the cumulative impact of all possible influences. While its noninvasive nature is a key advantage, 1H MRS is a relatively insensitive approach. Because scan duration is limited by human tolerance, underlying influences on signal strength cannot all be measured along with also acquiring a high signal-to-noise neurochemical spectrum. For example, the tissue water content may be a function of age and region. Furthermore, the ability of image-based segmentation methods to quantify GM, WM, and CSF content in the VOIs is limited (Bansal et al., 2013). Most notably, the T2 of each neurochemical, including water, is rarely measured and can be influenced by field strength, age, and region of interest. If tissue water had a 10% faster T2 in older adults, the effect on apparent neurochemical concentrations would be an artefactual lowering by 1.8%. In the current study, the age-associated differences in tissue water T2 were corrected for. For neurochemicals such as NAA, which relax more slowly than tissue water (Marjanska et al., 2012), the expected shortening of T2 (Marjanska et al., 2013) would lower the apparent concentration by only 0.9%. All of these effects are small (i.e., within 2%) at the ultra-short echo time of 8 ms used in the current study. Since age-specific T2s have not been measured for all neurochemicals at 7 T in the OCC and PCC, correction for the small effect of age-associated differences in T2 of neurochemicals was not feasible.
The number of subjects studied was small. On one hand, significant effects were detected, which is evidence that the sample size provided sufficient statistical power. This illustrates the utility of the technique for procuring useful information in a practical study design. On the other hand, replication of these findings in a larger cohort would be needed to address biological variation.
The number of regions from which this sensitive and extensive neurochemical profile can be measured is currently limited by the length of time that a person is willing and able to lie still in the magnet. Also, matching the size and shape of the VOI to the particular geometry of age-associated atrophy might be more appropriate.
Conclusion
Ultra-high field scanning technology yielded the most comprehensive in situ 1H MRS examination of the neurochemistry of human brain aging that has been reported. Beyond the 3 to 5 neurochemicals that are typically studied, age-associated differences in 8 compounds were detected among the 14 neurochemicals that were quantified. Lower age-associated NAA was affirmed in the OCC. This study contributes new knowledge on age-associated differences in neurochemical concentrations that previously have not been detected in the context of aging, i.e., NAAG and PE in both brain regions, and Glu and Asc in the OCC.
The distinctive scenario of age-associated neurochemical concentration differences observed in each region may reflect how the brain ages differently depending on region, or possibly that aging progresses at a different rate depending on region. These possibilities suggest that 1H MRS may have potential to substantiate a neurochemical basis for symptoms at an early stage of cognitive impairment when rescue of neuronal viability is still possible.
Age-associated neurochemical concentration differences were measured non-invasively.
Differences in 8 out of 14 neurochemicals were observed.
Several differences reflect known region-specific differences in blood flow, metabolism and connectivity.
Others reveal new aspects of neurochemistry and microstructure associated with oxidative stress and myelination.
The human brain ages differently depending on region.
Acknowledgments
The authors would like to thank: Edward J. Auerbach, Ph.D. for implementing the FAST(EST)MAP and STEAM sequences on the Siemens platform, Pierre-Francois Van de Moortele, M.D., Ph.D. and Julien Sein, Ph.D. for the T1-flattening script, and Si l via Mangia, Ph.D. and Angèle Viola, Ph.D. for scientific input on the importance of the findings.
Funding: This work was supported by the National Institutes of Health [grant numbers R01AG039396, P41 EB015894, P30 NS076408] and the W.M. Keck Foundation.
Abbreviations
- AD
Alzheimer’s disease
- AFNI
analysis of functional neuro images
- Asc
ascorbate
- Asp
aspartate
- CBF
cerebral blood flow
- Cr
creatine
- CRLB
Cramér-Rao lower bounds
- CSF
cerebrospinal fluid
- DMN
default mode network
- FAST(EST)MAP
fast automatic mapping along projections with echo planar imaging readout
- FSL
a comprehensive library of analysis tools for fMRI, MRI and DTI brain imaging data
- GABA
γ-aminobutyric acid
- Glc
glucose
- Gln
glutamine
- GM
gray matter
- Glu
glutamate
- GPC
glycerophosphorylcholine
- GSH
glutathione
- 1H MRS
proton magnetic resonance spectroscopy
- Lac
lactate
- mIns
myo-inositol
- MPRAGE
magnetization-prepared rapid gradient-echo
- NAA
N-acetylaspartate
- NAAG
N-acetylaspartylglutamate
- OCC
occipital cortex
- PCr
phosphocreatine
- PCho
phosphorylcholine
- PCC
posterior cingulate cortex
- PD
proton density
- PE
phosphorylethanolamine
- RF
radiofrequency
- sIns
scyllo-inositol
- SPM
statistical parametric mapping
- STEAM
stimulated echo acquisition mode
- Tau
taurine
- tCr
total creatine, creatine + phosphocreatine
- tCho
choline containing compounds, glycerophosphorylcholine + phosphorylcholine
- VAPOR
variable power and optimized relaxation delay
- VOI
volume-of-interest
- WM
white matter
Footnotes
Publisher's Disclaimer: This is a PDF file of an unedited manuscript that has been accepted for publication. As a service to our customers we are providing this early version of the manuscript. The manuscript will undergo copyediting, typesetting, and review of the resulting proof before it is published in its final citable form. Please note that during the production process errors may be discovered which could affect the content, and all legal disclaimers that apply to the journal pertain.
The authors disclose no conflicts of interest.
All authors have approved the final article.
Author contributions:
Malgorzata Marjanska: conceptualization, data acquisition, processing and analysis, writing and revising the manuscript
J. Riley McCarten: conceptualization, clinical evaluation of older adults, revising the manuscript
James Hodges: statistical analysis of the data, writing and revising the manuscript
Laura S. Hemmy: conceptualization, revising the manuscript
Andrea Grant: data analysis, revising the manuscript
Dinesh K. Deelchand: development of processing tools, revising the manuscript
Melissa Terpstra: conceptualization, data analysis, writing and revising the manuscript
References
- Abbas Z, Gras V, Mollenhoff K, Keil F, Oros-Peusquens AM, Shah NJ. Analysis of proton-density bias corrections based on T1 measurement for robust quantification of water content in the brain at 3 Tesla. Magn Reson Med. 2014;72:1735–1745. doi: 10.1002/mrm.25086. [DOI] [PubMed] [Google Scholar]
- Adany P, Choi IY, Lee P. B0-adjusted and sensitivity-encoded spectral localization by imaging (BASE-SLIM) in the human brain in vivo. Neuroimage. 2016;134:355–364. doi: 10.1016/j.neuroimage.2016.04.016. [DOI] [PMC free article] [PubMed] [Google Scholar]
- Adriany G, De Moortele PFV, Ritter J, Moeller S, Auerbach EJ, Akgun C, Snyder CJ, Vaughan T, Ugurbill K. A geometrically adjustable 16-channel transmit/receive transmission line array for improved RF efficiency and parallel imaging performance at 7 Tesla. Magn Reson Med. 2008;59:590–597. doi: 10.1002/mrm.21488. [DOI] [PubMed] [Google Scholar]
- Bansal R, Hao X, Liu F, Xu D, Liu J, Peterson BS. The effects of changing water content, relaxation times, and tissue contrast on tissue segmentation and measures of cortical anatomy in MR images. Magn Reson Imaging. 2013;31:1709–1730. doi: 10.1016/j.mri.2013.07.017. [DOI] [PMC free article] [PubMed] [Google Scholar]
- Bartha R, Michaeli S, Merkle H, Adriany G, Andersen P, Chen W, Ugurbil K, Garwood M. In vivo 1H2O T2(dagger) measurement in the human occipital lobe at 4T and 7T by Carr-Purcell MRI: Detection of microscopic susceptibility contrast. Magn Reson Med. 2002;47:742–750. doi: 10.1002/mrm.10112. [DOI] [PubMed] [Google Scholar]
- Beck AT, Steer RA, Ball R, Ranieri W. Comparison of Beck Depression Inventories -IA and -II in psychiatric outpatients. J Pers Assess. 1996;67:588–597. doi: 10.1207/s15327752jpa6703_13. [DOI] [PubMed] [Google Scholar]
- Behar KL, Rothman DL, Spencer DD, Petroff OA. Analysis of macromolecule resonances in 1H NMR spectra of human brain. Magn Reson Med. 1994;32:294–302. doi: 10.1002/mrm.1910320304. [DOI] [PubMed] [Google Scholar]
- Boulanger Y, Labelle M, Khiat A. Role of phospholipase A2 on the variations of the choline signal intensity observed by 1H magnetic resonance spectroscopy in brain diseases. Brain Res Brain Res Rev. 2000;33:380–389. doi: 10.1016/s0165-0173(00)00037-0. [DOI] [PubMed] [Google Scholar]
- Brand A, Richter-Landsberg C, Leibfritz D. Multinuclear NMR studies on the energy metabolism of glial and neuronal cells. Dev Neurosci. 1993;15:289–298. doi: 10.1159/000111347. [DOI] [PubMed] [Google Scholar]
- Brant-Zawadzki M, Gillan GD, Nitz WR. MP RAGE: a three-dimensional, T1-weighted, gradient-echo sequence--initial experience in the brain. Radiology. 1992;182:769–775. doi: 10.1148/radiology.182.3.1535892. [DOI] [PubMed] [Google Scholar]
- Brooks JC, Roberts N, Kemp GJ, Gosney MA, Lye M, Whitehouse GH. A proton magnetic resonance spectroscopy study of age-related changes in frontal lobe metabolite concentrations. Cereb Cortex. 2001;11:598–605. doi: 10.1093/cercor/11.7.598. [DOI] [PubMed] [Google Scholar]
- Chang L, Jiang CS, Ernst T. Effects of age and sex on brain glutamate and other metabolites. Magn Reson Imaging. 2009;27:142–145. doi: 10.1016/j.mri.2008.06.002. [DOI] [PMC free article] [PubMed] [Google Scholar]
- Chiu PW, Mak HK, Yau KK, Chan Q, Chang RC, Chu LW. Metabolic changes in the anterior and posterior cingulate cortices of the normal aging brain: proton magnetic resonance spectroscopy study at 3 T. Age (Dordr) 2014;36:251–264. doi: 10.1007/s11357-013-9545-8. [DOI] [PMC free article] [PubMed] [Google Scholar]
- Christiansen P, Toft P, Larsson HB, Stubgaard M, Henriksen O. The concentration of N-acetyl aspartate, creatine + phosphocreatine, and choline in different parts of the brain in adulthood and senium. Magn Reson Imaging. 1993;11:799–806. doi: 10.1016/0730-725x(93)90197-l. [DOI] [PubMed] [Google Scholar]
- Cockcroft DW, Gault MH. Prediction of creatinine clearance from serum creatinine. Nephron. 1976;16:31–41. doi: 10.1159/000180580. [DOI] [PubMed] [Google Scholar]
- Cox RW. AFNI: software for analysis and visualization of functional magnetic resonance neuroimages. Comput Biomed Res. 1996;29:162–173. doi: 10.1006/cbmr.1996.0014. [DOI] [PubMed] [Google Scholar]
- de Vellis J, editor. Neuroglia in the Aging Brain. Humana Press; 2002. [Google Scholar]
- Deelchand DK, Marjanska M, Hodges JS, Terpstra M. Sensitivity and specificity of human brain glutathione concentrations measured using short-TE 1H MRS at 7 T. NMR Biomed. 2016;29:600–606. doi: 10.1002/nbm.3507. [DOI] [PMC free article] [PubMed] [Google Scholar]
- Dennis EL, Thompson PM. Functional brain connectivity using fMRI in aging and Alzheimer’s disease. Neuropsychol Rev. 2014;24:49–62. doi: 10.1007/s11065-014-9249-6. [DOI] [PMC free article] [PubMed] [Google Scholar]
- Duarte JM, Lei H, Mlynarik V, Gruetter R. The neurochemical profile quantified by in vivo1H NMR spectroscopy. Neuroimage. 2012;61:342–362. doi: 10.1016/j.neuroimage.2011.12.038. [DOI] [PubMed] [Google Scholar]
- Ernst T, Kreis R, Ross BD. Absolute Quantitation of Water and Metabolites in the Human Brain .1. Compartments and Water. J Magn Reson B. 1993;102:1–8. [Google Scholar]
- Eylers VV, Maudsley AA, Bronzlik P, Dellani PR, Lanfermann H, Ding XQ. Detection of Normal Aging Effects on Human Brain Metabolite Concentrations and Microstructure with Whole-Brain MR Spectroscopic Imaging and Quantitative MR Imaging. AJNR Am J Neuroradiol. 2016;37:447–454. doi: 10.3174/ajnr.A4557. [DOI] [PMC free article] [PubMed] [Google Scholar]
- Fayed N, Andres E, Viguera L, Modrego PJ, Garcia-Campayo J. Higher glutamate+glutamine and reduction of N-acetylaspartate in posterior cingulate according to age range in patients with cognitive impairment and/or pain. Acad Radiol. 2014;21:1211–1217. doi: 10.1016/j.acra.2014.04.009. [DOI] [PubMed] [Google Scholar]
- Fischl B, Salat DH, Busa E, Albert M, Dieterich M, Haselgrove C, van der Kouwe A, Killiany R, Kennedy D, Klaveness S, Montillo A, Makris N, Rosen B, Dale AM. Whole brain segmentation: automated labeling of neuroanatomical structures in the human brain. Neuron. 2002;33:341–355. doi: 10.1016/s0896-6273(02)00569-x. [DOI] [PubMed] [Google Scholar]
- Friston KJ, Holmes AP, Worsley KJ, Poline J-P, Frith CD, Frackowiak RSJ. Statistical parameteric maps in functional imaging: A general linear approach. Hum Brain Mapp. 1995;2:189–210. [Google Scholar]
- Govind V, Young K, Maudsley AA. Corrigendum: proton NMR chemical shifts and coupling constants for brain metabolites. Govindaraju V, Young K, Maudsley AA, NMR Biomed. 2000; 13: 129-153. NMR Biomed. 2015;28:923–924. doi: 10.1002/nbm.3336. [DOI] [PubMed] [Google Scholar]
- Govindaraju V, Young K, Maudsley AA. Proton NMR chemical shifts and coupling constants for brain metabolites. NMR Biomed. 2000;13:129–153. doi: 10.1002/1099-1492(200005)13:3<129::aid-nbm619>3.0.co;2-v. [DOI] [PubMed] [Google Scholar]
- Gruetter R. Automatic, localized in vivo adjustment of all first- and second-order shim coils. Magn Reson Med. 1993;29:804–811. doi: 10.1002/mrm.1910290613. [DOI] [PubMed] [Google Scholar]
- Gruetter R, Tkac I. Field mapping without reference scan using asymmetric echo-planar techniques. Magn Reson Med. 2000;43:319–323. doi: 10.1002/(sici)1522-2594(200002)43:2<319::aid-mrm22>3.0.co;2-1. [DOI] [PubMed] [Google Scholar]
- Gussew A, Erdtel M, Hiepe P, Rzanny R, Reichenbach JR. Absolute quantitation of brain metabolites with respect to heterogeneous tissue compositions in 1H-MR spectroscopic volumes. Magn Reson Mater Phy. 2012;25:321–333. doi: 10.1007/s10334-012-0305-z. [DOI] [PubMed] [Google Scholar]
- Henry PG, Marjanska M, Walls JD, Valette J, Gruetter R, Ugurbil K. Proton-observed carbon-edited NMR spectroscopy in strongly coupled second-order spin systems. Magn Reson Med. 2006;55:250–257. doi: 10.1002/mrm.20764. [DOI] [PubMed] [Google Scholar]
- Hof P, Mobbs CV, editors. Handbook of the Neuroscience of Aging. London: Academic Press; 2009. [Google Scholar]
- Iizuka T, Kameyama M. Cholinergic enhancement increases regional cerebral blood flow to the posterior cingulate cortex in mild Alzheimer’s disease. Geriatr Gerontol Int. 2016 doi: 10.1111/ggi.12818. in press. [DOI] [PubMed] [Google Scholar]
- Jenkinson M, Beckmann CF, Behrens TE, Woolrich MW, Smith SM. FSL. Neuroimage. 2012;62:782–790. doi: 10.1016/j.neuroimage.2011.09.015. [DOI] [PubMed] [Google Scholar]
- Joo SH, Lim HK, Lee CU. Three Large-Scale Functional Brain Networks from Resting-State Functional MRI in Subjects with Different Levels of Cognitive Impairment. Psychiatry Investig. 2016;13:1–7. doi: 10.4306/pi.2016.13.1.1. [DOI] [PMC free article] [PubMed] [Google Scholar]
- Kaiser LG, Marjanska M, Matson GB, Iltis I, Bush SD, Soher BJ, Mueller S, Young K. 1H MRS detection of glycine residue of reduced glutathione in vivo. J Magn Reson. 2010;202:259–266. doi: 10.1016/j.jmr.2009.11.013. [DOI] [PMC free article] [PubMed] [Google Scholar]
- Kaiser LG, Schuff N, Cashdollar N, Weiner MW. Age-related glutamate and glutamine concentration changes in normal human brain: 1H MR spectroscopy study at 4 T. Neurobiol Aging. 2005;26:665–672. doi: 10.1016/j.neurobiolaging.2004.07.001. [DOI] [PMC free article] [PubMed] [Google Scholar]
- Kalpouzos G, Chetelat G, Baron JC, Landeau B, Mevel K, Godeau C, Barre L, Constans JM, Viader F, Eustache F, Desgranges B. Voxel-based mapping of brain gray matter volume and glucose metabolism profiles in normal aging. Neurobiol Aging. 2009;30:112–124. doi: 10.1016/j.neurobiolaging.2007.05.019. [DOI] [PubMed] [Google Scholar]
- Kantarci K. 1H magnetic resonance spectroscopy in dementia. Br J Radiol 80 Spec No. 2007;2:S146–S152. doi: 10.1259/bjr/60346217. [DOI] [PubMed] [Google Scholar]
- Kantarci K, Weigand SD, Petersen RC, Boeve BF, Knopman DS, Gunter J, Reyes D, Shiung M, O’Brien PC, Smith GE, Ivnik RJ, Tangalos EG, Jack CR., Jr Longitudinal 1H MRS changes in mild cognitive impairment and Alzheimer’s disease. Neurobiol Aging. 2007;28:1330–1339. doi: 10.1016/j.neurobiolaging.2006.06.018. [DOI] [PMC free article] [PubMed] [Google Scholar]
- Kreis R. The trouble with quality filtering based on relative Cramer-Rao lower bounds. Magn Reson Med. 2016;75:15–18. doi: 10.1002/mrm.25568. [DOI] [PubMed] [Google Scholar]
- Leech R, Sharp DJ. The role of the posterior cingulate cortex in cognition and disease. Brain. 2014;137:12–32. doi: 10.1093/brain/awt162. [DOI] [PMC free article] [PubMed] [Google Scholar]
- Lustig C, Snyder AZ, Bhakta M, O’Brien KC, McAvoy M, Raichle ME, Morris JC, Buckner RL. Functional deactivations: change with age and dementia of the Alzheimer type. Proc Natl Acad Sci U S A. 2003;100:14504–14509. doi: 10.1073/pnas.2235925100. [DOI] [PMC free article] [PubMed] [Google Scholar]
- Manoharan S, Guillemin GJ, Abiramasundari RS, Essa MM, Akbar M, Akbar MD. The Role of Reactive Oxygen Species in the Pathogenesis of Alzheimer’s Disease, Parkinson’s Disease, and Huntington’s Disease: A Mini Review. Oxid Med Cell Longev. 2016;2016:8590578. doi: 10.1155/2016/8590578. [DOI] [PMC free article] [PubMed] [Google Scholar]
- Marjanska M, Auerbach EJ, Valabregue R, Van de Moortele PF, Adriany G, Garwood M. Localized 1H NMR spectroscopy in different regions of human brain in vivo at 7 T: T2 relaxation times and concentrations of cerebral metabolites. NMR Biomed. 2012;25:332–339. doi: 10.1002/nbm.1754. [DOI] [PMC free article] [PubMed] [Google Scholar]
- Marjanska M, Emir UE, Deelchand DK, Terpstra M. Faster metabolite 1H transverse relaxation in the elder human brain. PLoS One. 2013;8:e77572. doi: 10.1371/journal.pone.0077572. [DOI] [PMC free article] [PubMed] [Google Scholar]
- Martin AJ, Friston KJ, Colebatch JG, Frackowiak RS. Decreases in regional cerebral blood flow with normal aging. J Cereb Blood Flow Metab. 1991;11:684–689. doi: 10.1038/jcbfm.1991.121. [DOI] [PubMed] [Google Scholar]
- McIntyre DJ, Charlton RA, Markus HS, Howe FA. Long and short echo time proton magnetic resonance spectroscopic imaging of the healthy aging brain. J Magn Reson Imaging. 2007;26:1596–1606. doi: 10.1002/jmri.21198. [DOI] [PubMed] [Google Scholar]
- Metzger GJ, Snyder C, Akgun C, Vaughan T, Ugurbil K, Van de Moortele PF. Local B1+ shimming for prostate imaging with transceiver arrays at 7T based on subject-dependent transmit phase measurements. Magn Reson Med. 2008;59:396–409. doi: 10.1002/mrm.21476. [DOI] [PMC free article] [PubMed] [Google Scholar]
- Michaelis T, Helms G, Merboldt KD, Hanicke W, Bruhn H, Frahm J. Identification of scyllo-inositol in proton NMR spectra of human brain in vivo. NMR Biomed. 1993;6:105–109. doi: 10.1002/nbm.1940060116. [DOI] [PubMed] [Google Scholar]
- Moffett JR, Ross B, Arun P, Madhavarao CN, Namboodiri AM. N-Acetylaspartate in the CNS: from neurodiagnostics to neurobiology. Prog Neurobiol. 2007;81:89–131. doi: 10.1016/j.pneurobio.2006.12.003. [DOI] [PMC free article] [PubMed] [Google Scholar]
- Mountford CE, Stanwell P, Lin A, Ramadan S, Ross B. Neurospectroscopy: the past, present and future. Chem Rev. 2010;110:3060–3086. doi: 10.1021/cr900250y. [DOI] [PubMed] [Google Scholar]
- Nakajima K, Kohsaka S. Microglia: activation and their significance in the central nervous system. J Biochem. 2001;130:169–175. doi: 10.1093/oxfordjournals.jbchem.a002969. [DOI] [PubMed] [Google Scholar]
- Nasreddine ZS, Phillips NA, Bedirian V, Charbonneau S, Whitehead V, Collin I, Cummings JL, Chertkow H. The Montreal Cognitive Assessment, MoCA: a brief screening tool for mild cognitive impairment. J Am Geriatr Soc. 2005;53:695–699. doi: 10.1111/j.1532-5415.2005.53221.x. [DOI] [PubMed] [Google Scholar]
- Neeb H, Zilles K, Shah NJ. Fully-automated detection of cerebral water content changes: study of age- and gender-related H2O patterns with quantitative MRI. Neuroimage. 2006;29:910–922. doi: 10.1016/j.neuroimage.2005.08.062. [DOI] [PubMed] [Google Scholar]
- O’Neill RD, Grunewald RA, Fillenz M, Albery WJ. The effect of unilateral cortical lesions on the circadian changes in rat striatal ascorbate and homovanillic acid levels measured in vivo using voltammetry. Neurosci Lett. 1983;42:105–110. doi: 10.1016/0304-3940(83)90430-5. [DOI] [PubMed] [Google Scholar]
- Oz G, Hutter D, Tkac I, Clark HB, Gross MD, Jiang H, Eberly LE, Bushara KO, Gomez CM. Neurochemical alterations in spinocerebellar ataxia type 1 and their correlations with clinical status. Mov Disord. 2010;25:1253–1261. doi: 10.1002/mds.23067. [DOI] [PMC free article] [PubMed] [Google Scholar]
- Provencher SW. Estimation of metabolite concentrations from localized in vivo proton NMR spectra. Magn Reson Med. 1993;30:672–679. doi: 10.1002/mrm.1910300604. [DOI] [PubMed] [Google Scholar]
- Provencher SW. Automatic quantitation of localized in vivo 1H spectra with LCModel. NMR Biomed. 2001;14:260–264. doi: 10.1002/nbm.698. [DOI] [PubMed] [Google Scholar]
- Rae CD. A guide to the metabolic pathways and function of metabolites observed in human brain 1H magnetic resonance spectra. Neurochem Res. 2014;39:1–36. doi: 10.1007/s11064-013-1199-5. [DOI] [PubMed] [Google Scholar]
- Rao R, Tkac I, Unger EL, Ennis K, Hurst A, Schallert T, Connor J, Felt B, Georgieff MK. Iron supplementation dose for perinatal iron deficiency differentially alters the neurochemistry of the frontal cortex and hippocampus in adult rats. Pediatr Res. 2013;73:31–37. doi: 10.1038/pr.2012.143. [DOI] [PMC free article] [PubMed] [Google Scholar]
- Reetz K, Abbas Z, Costa AS, Gras V, Tiffin-Richards F, Mirzazade S, Holschbach B, Frank RD, Vassiliadou A, Kruger T, Eitner F, Gross T, Schulz JB, Floege J, Shah NJ. Increased cerebral water content in hemodialysis patients. PLoS One. 2015;10:e0122188. doi: 10.1371/journal.pone.0122188. [DOI] [PMC free article] [PubMed] [Google Scholar]
- Reyngoudt H, Claeys T, Vlerick L, Verleden S, Acou M, Deblaere K, De Deene Y, Audenaert K, Goethals I, Achten E. Age-related differences in metabolites in the posterior cingulate cortex and hippocampus of normal ageing brain: a 1H-MRS study. Eur J Radiol. 2012;81:e223–e231. doi: 10.1016/j.ejrad.2011.01.106. [DOI] [PubMed] [Google Scholar]
- Rice ME, Russo-Menna I. Differential compartmentalization of brain ascorbate and glutathione between neurons and glia. Neuroscience. 1998;82:1213–1223. doi: 10.1016/s0306-4522(97)00347-3. [DOI] [PubMed] [Google Scholar]
- Robertson DM, van Amelsvoort T, Daly E, Simmons A, Whitehead M, Morris RG, Murphy KC, Murphy DG. Effects of estrogen replacement therapy on human brain aging: an in vivo 1H MRS study. Neurology. 2001;57:2114–2117. doi: 10.1212/wnl.57.11.2114. [DOI] [PubMed] [Google Scholar]
- Rooney WD, Johnson G, Li X, Cohen ER, Kim SG, Ugurbil K, Springer CS. Magnetic field and tissue dependencies of human brain longitudinal 1H2O relaxation in vivo. Magn Reson Med. 2007;57:308–318. doi: 10.1002/mrm.21122. [DOI] [PubMed] [Google Scholar]
- Sala-Llonch R, Bartres-Faz D, Junque C. Reorganization of brain networks in aging: a review of functional connectivity studies. Front Psychol. 2015;6:663. doi: 10.3389/fpsyg.2015.00663. [DOI] [PMC free article] [PubMed] [Google Scholar]
- Sambataro F, Murty VP, Callicott JH, Tan HY, Das S, Weinberger DR, Mattay VS. Age-related alterations in default mode network: impact on working memory performance. Neurobiol Aging. 2010;31:839–852. doi: 10.1016/j.neurobiolaging.2008.05.022. [DOI] [PMC free article] [PubMed] [Google Scholar]
- Sapolsky R. Stress, the Aging Brain, and the Mechanisms of Neuron Death. Cambridge: The MIT Press; 1992. [Google Scholar]
- Saunders DE, Howe FA, van den Boogaart A, Griffiths JR, Brown MM. Aging of the adult human brain: in vivo quantitation of metabolite content with proton magnetic resonance spectroscopy. J Magn Reson Imaging. 1999;9:711–716. doi: 10.1002/(sici)1522-2586(199905)9:5<711::aid-jmri14>3.0.co;2-3. [DOI] [PubMed] [Google Scholar]
- Schaller B, Xin L, Gruetter R. Is the macromolecule signal tissue-specific in healthy human brain? A 1H MRS study at 7 Tesla in the occipital lobe. Magn Reson Med. 2014;72:934–940. doi: 10.1002/mrm.24995. [DOI] [PubMed] [Google Scholar]
- Sijens PE, den Heijer T, de Leeuw FE, de Groot JC, Achten E, Heijboer RJ, Hofman A, Breteler MM, Oudkerk M. MR spectroscopy detection of lactate and lipid signals in the brains of healthy elderly people. Eur Radiol. 2001;11:1495–1501. doi: 10.1007/s003300100824. [DOI] [PubMed] [Google Scholar]
- Snoussi K, Gillen JS, Horska A, Puts NA, Pradhan S, Edden RA, Barker PB. Comparison of brain gray and white matter macromolecule resonances at 3 and 7 Tesla. Magn Reson Med. 2015;74:607–613. doi: 10.1002/mrm.25468. [DOI] [PMC free article] [PubMed] [Google Scholar]
- Srinivasan R, Cunningham C, Chen A, Vigneron D, Hurd R, Nelson S, Pelletier D. TE-averaged two-dimensional proton spectroscopic imaging of glutamate at 3 T. Neuroimage. 2006;30:1171–1178. doi: 10.1016/j.neuroimage.2005.10.048. [DOI] [PubMed] [Google Scholar]
- Tkac I, Andersen P, Adriany G, Merkle H, Ugurbil K, Gruetter R. In vivo 1H NMR spectroscopy of the human brain at 7 T. Magn Reson Med. 2001;46:451–456. doi: 10.1002/mrm.1213. [DOI] [PubMed] [Google Scholar]
- Urenjak J, Williams SR, Gadian DG, Noble M. Proton nuclear magnetic resonance spectroscopy unambiguously identifies different neural cell types. J Neurosci. 1993;13:981–989. doi: 10.1523/JNEUROSCI.13-03-00981.1993. [DOI] [PMC free article] [PubMed] [Google Scholar]
- Van de Moortele PF, Akgun C, Adriany G, Moeller S, Ritter J, Collins CM, Smith MB, Vaughan JT, Ugurbil K. B1 destructive interferences and spatial phase patterns at 7 T with a head transceiver array coil. Magn Reson Med. 2005;54:1503–1518. doi: 10.1002/mrm.20708. [DOI] [PubMed] [Google Scholar]
- Van de Moortele PF, Auerbach EJ, Olman C, Yacoub E, Ugurbil K, Moeller S. T1 weighted brain images at 7 Tesla unbiased for Proton Density, T2* contrast and RF coil receive B1 sensitivity with simultaneous vessel visualization. Neuroimage. 2009;46:432–446. doi: 10.1016/j.neuroimage.2009.02.009. [DOI] [PMC free article] [PubMed] [Google Scholar]
- Zuendorf G, Kerrouche N, Herholz K, Baron JC. Efficient principal component analysis for multivariate 3D voxel-based mapping of brain functional imaging data sets as applied to FDG-PET and normal aging. Hum Brain Mapp. 2003;18:13–21. doi: 10.1002/hbm.10069. [DOI] [PMC free article] [PubMed] [Google Scholar]