

Abstract
BACKGROUND
The relationship between body mass index (BMI) and mortality remains controversial.
OBJECTIVE
To investigate the relationship between maximum BMI over 16 years and subsequent mortality.
DESIGN
Three prospective cohort studies.
SETTING
Nurses’ Health Study I and II, Health Professionals Follow-up Study.
PARTICIPANTS
225,072 men and women accruing 32,571 deaths over a mean of 12.3 years of follow-up.
MEASUREMENTS
Maximum BMI over 16 years of weight history and all-cause and cause-specific mortality.
RESULTS
Maximum BMIs in the overweight (25.0 to 29.9 kg/m2) (multivariate hazard ratio (HR), 1.06; 95% confidence interval (CI), 1.03 – 1.08), obese I (30.0 to 34.9 kg/m2), (HR, 1.24; 95% CI, 1.20 – 1.29), and obese II (≥ 35.0 kg/m2) (HR, 1.73; 95% CI, 1.66 – 1.80) categories were associated with increases in risk of all-cause mortality. The pattern of excess risk with a maximum BMI above normal weight was maintained across strata defined by smoking status, sex, and age, but the excess was greatest among those <70 years old and never smokers. In contrast, a significant inverse association between overweight and mortality (HR, 0.96; 95% CI, 0.94 – 0.99) was observed when BMI was defined using a single baseline measurement. Maximum overweight was also associated with increased cause-specific mortality, including deaths from cardiovascular diseases and coronary heart disease.
LIMITATIONS
Residual confounding and misclassification.
CONCLUSIONS
The paradoxical association between overweight and mortality is reversed in analyses incorporating weight history. Maximum BMI may be a useful metric to minimize reverse causation bias associated with a single baseline BMI assessment.
INTRODUCTION
There is an ongoing debate about the optimal body mass index (BMI) in relation to all-cause mortality. A previous meta-analysis of 97 studies of body mass index and mortality identified an inverse association for those who were overweight (25.0 – 29.9 kg/m2) and a null association for those with grade 1 obesity (30.0 – 34.9 kg/m2) compared to normal weight (18.5 – 24.9 kg/m2) (1). One explanation is that individuals often lose weight due to illness before death, leading to reverse causation bias (conditions leading to imminent mortality causing lower BMI rather than lower BMI causing mortality) and underestimation of the risks of the overweight and obese categories (2, 3). Confounding by smoking may also attenuate risks above a normal BMI since smokers tend be leaner (4–6). Techniques such as the exclusion of individuals with disease at baseline, exclusion of early follow-up (7) and restriction to never-smokers have been proposed (8–10), but these strategies reduce sample size, cannot account for participants with diseases of longer latency periods (up to a decade or more (11)) or with undiagnosed illnesses, and might reduce generalizability (12, 13).
Several prior studies have investigated mortality risks by using recalled maximum lifetime BMI and the results were suggestive of an increased risk with overweight (25.0 – 29.9 kg/m2) and a significant positive association with obesity (≥ 30.0 kg/m2) (12, 14). This method is advantageous because it identifies individuals who maintained a normal BMI over time as opposed to entering the normal BMI category due to illness-induced weight loss. However, analyses were limited to never-smokers and information on cause-specific mortality was not reported. Furthermore, recalled maximum weight has not yet been validated against a gold standard.
To address these limitations, we examined all-cause and cause-specific mortality risks of overweight and obesity in three large cohorts of health professionals in the United States. Our aim was to generate estimates that minimized reverse causality without imposing the severe exclusion criteria applied in the prior literature. The availability of longitudinal data enabled us to define maximum BMI using contemporaneous rather than recalled data on weight status. Furthermore, we included all individuals in the analysis, regardless of smoking status, baseline illness and other characteristics.
METHODS
Study Population
The NHS was initiated in 1976 with 121,700 female nurses 30 to 55 years of age. The Nurses’ Health Study II (NHS II) began in 1989 with 116,686 younger female registered nurses 25 to 42 years of age. The HPFS began in 1986 with 51,529 male health professionals 40 to 75 years of age. Questionnaires were administered biennially to update diet, lifestyle, and other health-related information.
Our primary analysis included women and men who returned at least two questionnaires during the weight history periods for each cohort (NHS – 1976 to 1992, NHS II – 1989 to 2005, HPFS – 1986 to 2002). We excluded individuals if they were missing data on weight or age at baseline, died before baseline, or had a BMI less than 12.5 or greater than 60.0 kg/m2 at baseline. We did not exclude individuals according to baseline illness. The study protocol was approved by the institutional review boards of Brigham and Women’s Hospital and the Harvard T.H. Chan School of Public Health, with participants’ consent implied by the return of the questionnaires.
Assessment of Body Mass Index
Height in inches and body weight in pounds were reported at cohort inception, and body weight every 2 years thereafter by self-report. Self-reported weight has been previously validated against measured weight in the NHS and HPFS and reported to be highly correlated (r = 0.97) (15). BMI was calculated as (703*Weight/Height2). Women who reported being pregnant were coded as missing BMI information for that questionnaire wave. BMI was categorized into pre-defined categories for analysis: underweight (<18.5 kg/m2), normal weight (18.5 – 24.9 kg/m2), overweight (25.0 – 29.9 kg/m2), obese I (30.0 – 34.9 kg/m2), and obese II (≥35.0 kg/m2)(16). Normal weight was used as the reference category for both baseline BMI and maximum BMI.
Establishment of Maximum Body Mass Index and Weight History
We define cohort inception in the year that each cohort was founded (NHS – 1976, NHS II – 1989, HPFS – 1986) and baseline as an arbitrary year after cohort inception at which we began to count events and person-time. The weight history period was defined as the period between cohort inception and baseline (inclusive of both dates). The main exposure of interest, maximum BMI, was defined as the highest reported BMI from any single questionnaire returned during the weight history period. For example, the maximum BMI for an individual in the NHS using a weight history of 16 years would be equal to the highest reported BMI from questionnaires returned in 1976, 1978, 1980, 1982, 1984, 1986, 1988, 1990, and 1992. The exposure for the same individual using a weight history of 0 years would be the BMI reported in 1992 only (equivalent to baseline BMI). The purpose of establishing a weight history was to reduce reverse causation owing to individuals losing weight due to illness prior to baseline.
To determine the optimal length of weight history, preliminary analyses were first conducted with varying lengths of histories (0, 2, 4, 6, 8, 10, 12, 14, and 16 years) from the same baseline year (NHS – 1992, NHS II – 2005, HPFS – 2002), and a period was selected where the hazard ratios for the overweight, obese I and obese II categories appeared to stabilize. We also considered improvements in model fit according to AIC (Akaike information criterion) in our selection (Table S1) (17). For these analyses, we did not stratify by time since maximum BMI so that models were comparable. We did not assess model performance for weight history lengths exceeding 16 years in the full sample given that this would lead to an excessively short follow-up duration in the NHS II. However, weight loss typically accelerates 9-10 years before mortality (11), so establishing a weight history length of 16 years is expected to capture the maximum BMI of the vast majority of individuals who underwent a negative weight trajectory in later life. We began counting events and person-time after the end of the weight history period until death or the end of follow-up (NHS – 1992 to 2012, NHS II – 2005 to 2013, HPFS – 2002 to 2012). Individuals who died or were lost to follow-up before baseline were not included in the analysis.
Ascertainment of Deaths
The primary outcome was death from any cause through the end of follow-up. Most deaths (>98%) were identified from reports by next of kin or postal authorities or from searches of the National Death Index. The cause of death was determined by physician review of medical records and death certificates. The diagnostic codes of the International Classification of Diseases, 8th Revision (ICD-8), were used to classify deaths as due to cardiovascular disease (which include heart failure, coronary heart disease, stroke, and any other vascular causes) (ICD-8 codes 390 to 459 and 795), coronary heart disease (mainly ischemic heart disease) (ICD-8 codes 410 to 414), stroke (ICD-8 codes 430 to 438), cancer (ICD-8 codes 140 to 239), respiratory diseases (ICD-8 codes 460 to 519), and other causes (such as Alzheimer’s disease, infectious diseases, and accidents).
Assessment of Covariates
Baseline covariates included race (white, non-white), family history of CVD (yes, no), and family history of cancer (yes, no). Data on age, cigarette smoking (never, ever, 1–14, 15–24, more than 24 cigarettes/day currently), and alcohol intake (0, 0.1–4.9, 5.0–9.9, 10.0–14.9, more than 14.9 g/d) were collected and updated from biennial survey data. For the NHS and NHS II cohorts only, menopausal status (pre, post, unsure/dubious), hormone therapy use (never, ever, current, unsure/dubious) and parity (0, 1, 2, 3, 4 or more) were recorded and updated biennially. In the NHS II only, information on oral contraceptive use (never, ever, current) was recorded and updated biennially. Dietary information was collected from validated food-frequency questionnaires approximately every 4 years for all cohorts and updated biennially (18). Covariates with missing values were assigned the last known reported value since cohort inception. Otherwise, missing values were set to a separate missing data category for that particular covariate and included as an indicator variable in the analysis.
Statistical Analysis
Hazard ratios and 95% confidence intervals were estimated from Cox proportional-hazards models, with age as the time scale and stratified by questionnaire cycle and years between baseline and maximum BMI. Likelihood ratio tests comparing a nested model with each interaction term for maximum BMI category and age category and the full model without the interaction terms was not significant for any cohort, signifying that the proportional hazards assumption is reasonable for our data. Quintiles for calorie intake were calculated from FFQ data. Baseline BMI and maximum BMI throughout weight history were used as the primary exposures and were not updated during follow-up in order to emulate extant studies and minimize reverse causality. The hazard-ratio estimates for all cohorts were combined via fixed effects meta-analysis (19). Sensitivity analyses were conducted stratifying by baseline disease exclusions, baseline physical activity, and different inclusion criteria for number of surveys returned with BMI data during the weight history period. Data were analyzed with the use of SAS software, version 9.4 (SAS Institute), at a two-tailed alpha level of 0.05.
RESULTS
Study Participants in Primary Analysis
Baseline characteristics of the three cohorts are presented in Table 1. The follow-up times were 1992 to 2012 for the NHS, 2005 to 2013 for the NHS II, and 2002 to 2012 for the HPFS (Figure S1). 19.5% of individuals in the NHS, 29.0% of individuals in the NHS II, and 20.4% of individuals in the HPFS died before baseline or did not valid weight data at baseline and were excluded from the main analysis. A total of 225,072 individuals were included in the primary analysis, representing 78.5% of the original study population at cohort inception. The mean ages at the start of follow-up were 58, 50, and 68 for the NHS, NHS II, and HPFS, respectively. The distributions of maximum BMI for women were wider and contained a higher proportion of individuals who were both underweight and obese at their heaviest compared to men. Using maximum values, the percentage of individuals overweight or obese at baseline was 59% in the NHS, 63% in the NHS 2 and 74% in the HPFS. The corresponding values for single baseline BMI were 52%, 57% and 61%. Participants in the NHS tended to have higher parity and lower alcohol consumption compared to those in the NHS II.
TABLE 1.
Characteristics of all individuals under study at baseline in the NHS – 1992/NHS II – 2005/HPFS – 2002.
| NHS (n=97,158) |
NHS II (n=92,545) |
HPFS (n=35,369) |
|
|---|---|---|---|
| Age (y) | 58.4 ± 7.2 | 50.4 ± 4.6 | 68.3 ± 8.9 |
| Smoking status (%) | |||
| Never | 43.7 | 64.9 | 46.5 |
| Ever | 40.9 | 27.0 | 45.8 |
| Current | 14.4 | 7.9 | 3.1 |
| Maximum BMI (%) | |||
| Under (<18.5 kg/m2) | 0.4 | 0.3 | 0.1 |
| Normal (18.5–24.9 kg/m2) | 40.8 | 36.1 | 27.4 |
| Over (25.0–29.9 kg/m2) | 35.0 | 30.5 | 53.5 |
| Obese I (30.0–34.9 kg/m2) | 15.3 | 16.9 | 15.2 |
| Obese II (>34.9 kg/m2) | 8.5 | 16.0 | 3.8 |
| Baseline BMI (%) | |||
| Under (<18.5 kg/m2) | 1.4 | 1.1 | 0.5 |
| Normal (18.5–24.9 kg/m2) | 46.7 | 42.3 | 38.6 |
| Over (25.0–29.9 kg/m2) | 32.5 | 29.0 | 47.1 |
| Obese I (30.0–34.9 kg/m2) | 13.1 | 15.3 | 11.2 |
| Obese II (>34.9 kg/m2) | 6.3 | 12.3 | 2.5 |
| White (%) | 93.7 | 96.1 | 91.4 |
| Family history CVD (%) | 15.8 | 21.8 | 33.1 |
| Family history Cancer (%) | 14.8 | 9.9 | 16.6 |
| Menopause (%) | |||
| Pre | 15.5 | 45.0 | |
| Post | 75.7 | 46.3 | |
| Unsure/Dubious | 8.7 | 7.2 | |
| Oral contraceptive use (%) | |||
| Never | 11.0 | ||
| Ever | 83.1 | ||
| Current | 4.4 | ||
| Hormone replacement therapy (%) | |||
| Never | 39.8 | 38.0 | |
| Ever | 28.2 | 31.0 | |
| Current | 16.2 | 16.9 | |
| Unsure/Dubious | 9.4 | 14.1 | |
| Parity (%) | |||
| Nulliparous | 5.6 | 16.0 | |
| One | 7.1 | 12.7 | |
| Two | 27.7 | 36.6 | |
| Three | 27.3 | 19.4 | |
| Four+ | 30.3 | 7.1 | |
| Alcohol at baseline (%) | |||
| Never (0 g/d) | 45.5 | 42.0 | 15.3 |
| Very Light (0.1 – 4.9 g/d) | 29.8 | 33.8 | 28.2 |
| Light (5.0 – 9.9 g/d) | 9.6 | 11.5 | 17.2 |
| Moderate (10.0 – 14.9 g/d) | 6.4 | 6.6 | 13.0 |
| Heavy (>14.9 g/d) | 8.8 | 6.2 | 26.4 |
| Total energy intake at baseline (kcal/d) | 1758 ± 491 | 1832 ± 534 | 1986 ± 538 |
Weight History
The distributions of years from baseline since maximum BMI are depicted in Figures S2 – S4. The majority of individuals experienced their maximum BMI during the weight history period at the most recent questionnaire (i.e. baseline). Results of the analysis for maximum BMI categories according to weight history length are detailed in Table S1. The hazard ratios for the maximum overweight and obese categories increased whereas the maximum underweight category decreased with longer weight history length. Cohort-specific AIC values also decreased with lengthening weight history, signifying better model fit. We proceeded with a weight history of 16 years in the primary analysis (1976 to 1992 in the NHS, 1989 to 2005 in the NHS II, and 1986 to 2002 in the HPFS) in order to minimize reverse causation bias while maximizing follow-up time. The weight history and follow-up periods are depicted in Figure S1.
All-Cause Mortality
Among 35,369 males, a total of 7,817 deaths were observed over an accrued 315,205 person-years of follow-up (mean follow-up time was 8.9 years). We observed significant associations of maximum BMI and mortality in the overweight (HR, 1.08; 95% CI, 1.03 – 1.14), obese I (HR, 1.39; 95% CI, 1.29 – 1.50), and obese II (HR, 1.88; 95% CI, 1.67 – 2.11) categories) (Table 2). Compared to those older than age 70, risks of mortality for overweight and obesity were higher in adults younger than age 70.
TABLE 2.
Hazard ratios for all-cause mortality in the NHS/NHS II/HPFS for maximum BMI with 16 years of weight history, stratified by smoking status, baseline age, and sex.
| Strata | Underweight (<18.5 kg/m2) |
Normal (18.5–24.9 kg/m2) |
Overweight (25.0–29.9 kg/m2) |
Obese I (30.0–34.9 kg/m2) |
Obese II (≥35.0 kg/m2) |
|---|---|---|---|---|---|
| All Individuals | |||||
| Males (HPFS) | |||||
| All Ages | |||||
| Events (n)/1,000 p-yrs | 5/0.2 | 2229/86.0 | 4103/169.2 | 1150/48.0 | 330/11.8 |
| Age adjusted HR | 1.03 (0.42, 2.49) | 1 (Reference) | 1.11 (1.05, 1.17) | 1.45 (1.34, 1.56) | 1.96 (1.74, 2.20) |
| Multivariate HR | 1.10 (0.45, 2.67) | 1 (Reference) | 1.08 (1.03, 1.14) | 1.39 (1.29, 1.50) | 1.88 (1.67, 2.11) |
| Age <70 | |||||
| Events (n)/1,000 p-yrs | 1/0.1 | 290/48.7 | 720/101.3 | 319/32.0 | 133/8.3 |
| Multivariate HR | 1.63 (0.23, 11.80) | 1 (Reference) | 1.17 (1.02, 1.35) | 1.64 (1.40, 1.93) | 2.62 (2.12, 3.23) |
| Age 70 – 79 | |||||
| Events (n)/1,000 p-yrs | 2/0.1 | 825/25.9 | 1738/50.9 | 518/13.2 | 150/3.0 |
| Multivariate HR | 0.77 (0.19, 3.11) | 1 (Reference) | 1.10 (1.01, 1.19) | 1.38 (1.23, 1.55) | 1.77 (1.48, 2.11) |
| Age ≥80 | |||||
| Events (n)/1,000 p-yrs | 2/0.01 | 1114/11.3 | 1645/17.0 | 313/2.9 | 47/0.5 |
| Multivariate HR | 1.30 (0.31, 5.40) | 1 (Reference) | 1.05 (0.97, 1.14) | 1.28 (1.12, 1.46) | 1.24 (0.92, 1.67) |
| Females (NHS, NHS II) | |||||
| All Ages | |||||
| Events (n)/1,000 p-yrs | 143/9.5 | 8954/974.9 | 8417/825.9 | 4212/381.8 | 3028/251.9 |
| Age adjusted HR | 1.57 (1.33, 1.85) | 1 (Reference) | 1.07 (1.04, 1.10) | 1.26 (1.22, 1.31) | 1.86 (1.79, 1.94) |
| Multivariate HR | 1.49 (1.26, 1.76) | 1 (Reference) | 1.05 (1.01, 1.08) | 1.21 (1.16, 1.26) | 1.71 (1.64, 1.78) |
| Age <60 | |||||
| Events (n)/1,000 p-yrs | 42/6.6 | 2481/683.8 | 2152/550.1 | 1208/264.9 | 1193/199.3 |
| Multivariate HR | 1.67 (1.22, 2.27) | 1 (Reference) | 1.04 (0.98, 1.10) | 1.24 (1.16, 1.33) | 1.74 (1.62, 1.87) |
| Age 60 – 64 | |||||
| Events (n)/1,000 p-yrs | 25/1.2 | 1952/131.8 | 1821/123.0 | 977/54.8 | 723/27.2 |
| Multivariate HR | 1.66 (1.11, 2.47) | 1 (Reference) | 1.01 (0.95, 1.08) | 1.22 (1.13, 1.32) | 1.72 (1.57, 1.88) |
| Age ≥65 | |||||
| Events (n)/1,000 p-yrs | 76/1.7 | 4521/159.2 | 4444/152.8 | 2027/62.1 | 1112/25.4 |
| Multivariate HR | 1.39 (1.11, 1.75) | 1 (Reference) | 1.06 (1.02, 1.10) | 1.18 (1.12, 1.25) | 1.65 (1.54, 1.76) |
| Never-Smokers Only | |||||
| Males (HPFS) | |||||
| All Ages | |||||
| Events (n)/1,000 p-yrs | 3/0.1 | 1015/49.7 | 1544/83.6 | 412/22.0 | 121/5.2 |
| Age adjusted HR | 0.94 (0.30, 2.99) | 1 (Reference) | 1.09 (1.00, 1.18) | 1.50 (1.33, 1.69) | 2.21 (1.82, 2.69) |
| Multivariate HR | 0.92 (0.29, 2.93) | 1 (Reference) | 1.09 (1.00, 1.18) | 1.48 (1.31, 1.67) | 2.20 (1.80, 2.67) |
| Age <70 | |||||
| Events (n)/1,000 p-yrs | 1/0.1 | 132/30.3 | 289/53.5 | 122/15.5 | 52/3.9 |
| Multivariate HR | 2.89 (0.39, 21.34) | 1 (Reference) | 1.27 (1.03, 1.57) | 1.78 (1.39, 2.29) | 3.19 (2.29, 4.44) |
| Age 70 – 79 | |||||
| Events (n)/1,000 p-yrs | 1/0.05 | 339/13.4 | 604/22.4 | 170/5.3 | 47/1.1 |
| Multivariate HR | 0.66 (0.09, 4.84) | 1 (Reference) | 1.12 (0.97, 1.28) | 1.45 (1.20, 1.75) | 1.95 (1.42, 2.66) |
| Age ≥80 | |||||
| Events (n)/1,000 p-yrs | 1/0.01 | 544/6.0 | 651/7.7 | 120/1.2 | 22/0.2 |
| Multivariate HR | 0.70 (0.09, 5.32) | 1 (Reference) | 1.02 (0.90, 1.15) | 1.41 (1.14, 1.75) | 1.66 (1.06, 2.60) |
| Females (NHS, NHS II) | |||||
| All Ages | |||||
| Events (n)/1,000 p-yrs | 52/4.9 | 3165/493.6 | 3257/413.6 | 1773/198.9 | 1424/140.3 |
| Age adjusted HR | 1.55 (1.18, 2.05) | 1 (Reference) | 1.15 (1.09, 1.21) | 1.43 (1.35, 1.51) | 2.26 (2.12, 2.40) |
| Multivariate HR | 1.50 (1.14, 1.98) | 1 (Reference) | 1.10 (1.05, 1.16) | 1.30 (1.23, 1.38) | 1.96 (1.83, 2.09) |
| Age <60 | |||||
| Events (n)/1,000 p-yrs | 17/3.6 | 829/363.1 | 764/285.1 | 477/142.6 | 553/113.5 |
| Multivariate HR | 1.90 (1.16, 3.09) | 1 (Reference) | 1.09 (0.99, 1.20) | 1.36 (1.21, 1.53) | 2.13 (1.90, 2.39) |
| Age 60 – 64 | |||||
| Events (n)/1,000 p-yrs | 6/0.4 | 619/55.3 | 615/54.2 | 380/24.9 | 311/12.9 |
| Multivariate HR | 1.72 (0.76, 3.90) | 1 (Reference) | 1.01 (0.90, 1.13) | 1.29 (1.13, 1.47) | 1.92 (1.67, 2.22) |
| Age ≥65 | |||||
| Events (n)/1,000 p-yrs | 29/0.8 | 1717/75.2 | 1878/74.4 | 916/31.4 | 560/13.8 |
| Multivariate HR | 1.31 (0.90, 1.90) | 1 (Reference) | 1.13 (1.06, 1.21) | 1.27 (1.17, 1.38) | 1.85 (1.67, 2.04) |
Multivariate adjusts for race (white/non-white), family history of CVD (yes/no), family history of cancer (yes/no), alcohol (categories), and total daily energy intake (quintiles). NHS/NHSII additionally adjust for menopause (pre/post/unsure), post-menopausal hormone use (current/ever/never), and parity (0/1/2/3/4+). NHS II also adjusts for oral contraceptive use (ever/never). Follow-up duration is (NHS – 1992– 2012/NHS II – 2005 – 2013/HPFS – 2002 – 2012).
Among 189,703 females, a total of 24,754 deaths accrued over 2.4 million person-years of follow-up (mean follow-up time was 12.9 years). We observed a J-shaped relationship for maximum BMI and mortality in the underweight (HR, 1.49; 95% CI, 1.26 – 1.76), overweight (HR, 1.05; 95% CI, 1.01 – 1.08), obese I (HR, 1.21; 95% CI, 1.16 – 1.26), and obese II (HR, 1.71; 95% CI, 1.64 – 1.78) categories (Table 2). HRs for all categories strengthened in adults younger than age 60. The hazard ratios for mortality among never-smokers were generally higher and also followed a J-shaped curve with normal BMI conferring the lowest risk (Table 2). Analyses with fine BMI categories revealed that the 22.5 – 24.9 kg/m2 and 20.0 – 24.9 kg/m2 categories contained the nadir for all-cause mortality risk among all individuals and never smokers, respectively (Tables S2 and S8).
Participants who lost a significant amount of weight after attaining their maximum BMI showed the highest risk of mortality compared to those who were currently at their maximum BMI (Table S6). Those who were < 25.0 kg/m2 at baseline, but were once ≥ 35.0 kg/m2 during weight history had a HR of 2.60 (95% CI, 2.00 – 3.40). Individuals who were <25.0 kg/m2 at baseline but were overweight (25.0–29.9 kg/m2) at their maximum also had elevated risks of mortality (HR 1.24; 95% CI, 1.19 – 1.29).
The risks associated with a maximum BMI in the overweight and obese categories remained elevated in sensitivity analyses for exclusions for baseline illness (Table S13), exclusions for missing BMI data during weight history (Table S14), physical activity levels (Table S15), and missing covariate data (Table S16).
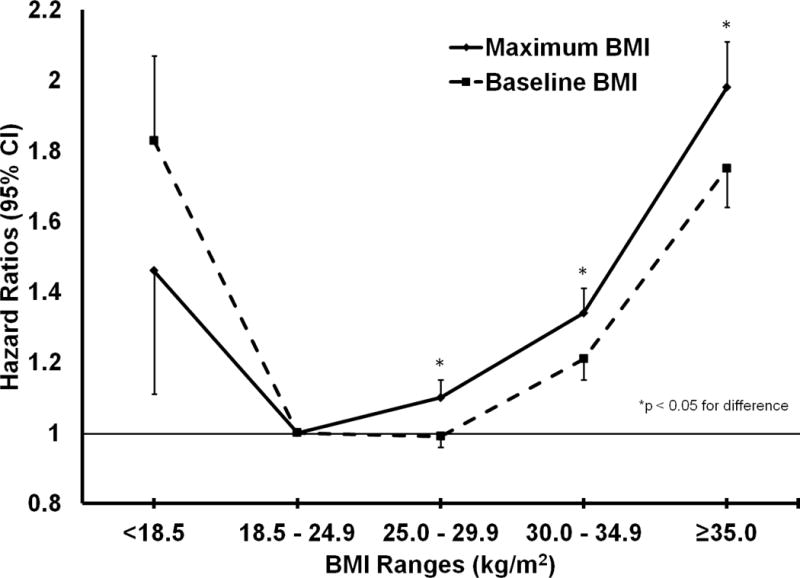
Compared to results for maximum BMI in the overweight (HR, 1.06; 95% CI, 1.03, 1.08) and obese I (HR, 1.24; 95%, 1.20, 1.29) ranges, the results for baseline BMI were weakened for overweight (HR, 0.96; 95% CI, 0.94 – 0.99) and obese I (HR, 1.14; 95% CI, 1.10, 1.18) (Figure 1) especially when considering former and current smokers in addition to never smokers (Figure 2). Risk of mortality in the underweight BMI group was decreased when considering maximum BMI (HR, 1.47; 95% CI, 1.25 – 1.74) instead of baseline BMI only (HR, 1.88; 95% CI, 1.75 – 2.01), but still significantly elevated.
FIGURE 1.

Graph comparing hazard ratios for maximum BMI with 16 years of weight history and baseline BMI among all individuals.
FIGURE 2.
Graph comparing hazard ratios for maximum BMI with 16 years of weight history and baseline BMI among never-smokers.
Cause-Specific Mortality
We examined the relationship between categories of maximum BMI and mortality due to cardiovascular disease (8,017 events), coronary heart disease (3,410 events), stroke (1,998 events), cancer (11,135 events), respiratory disease (2,607 events), and other causes (10,790 events) (Table S2). The NHS II was excluded from analyses for respiratory disease, stroke, and coronary heart disease due to sparse number of events. The strongest association was observed for cardiovascular disease mortality (overweight HR, 1.212 (95% CI, 1.15 – 1.28), obese I HR, 1.63 (95% CI, 1.52 – 1.74), obese II HR, 2.74 (95% CI, 2.53 – 2.97), particularly death due to coronary heart disease (overweight HR, 1.32 (95% CI, 1.21 – 1.44), obese I HR, 1.97 (95% CI, 1.78 – 2.19), obese II HR, 3.34 (95% CI, 2.95 – 3.79)). The association of maximum overweight and mortality from other causes (not CVD, cancer, or respiratory diseases) was also significantly elevated (HR, 1.07 (95% CI, 1.02 – 1.12)). Compared to the analysis of all individuals, the HRs among never-smokers were generally strengthened (Table S8).
DISCUSSION
In our primary analysis of three large cohorts of health professionals using a weight history of 16 years, we found that compared to having a maximum BMI of 18.5 – 24.9 kg/m2, those with a maximum BMI in the overweight or obese categories were at an elevated incidence of mortality from all causes, CVD, and non-CVD/cancer/respiratory causes of death. Our findings corroborate previous pooled analyses by the Global BMI Mortality Collaboration (7), Prospective Studies Collaboration (20) and Berrington de Gonzalez et al. (6), and a recent dose-response meta-analysis (21) suggesting an optimal BMI range of 18.5 to 24.9 kg/m2 for both never-smokers and all individuals.
Compared to using BMI data from one questionnaire at baseline, use of extended weight histories revealed stronger associations with mortality risk, and reversed the paradoxical association between overweight and mortality that has been reported in previous analyses (1). Although the magnitude of association for a maximum BMI in the overweight category was relatively small, this association was robust in sensitivity analyses. The complete reversal of the hazard ratio associated with being overweight from significantly protective to significantly harmful is also noteworthy, suggesting that reverse causation plays a vital role in creating the purported obesity paradox. Furthermore, use of fine BMI categories revealed significant increases in risk for individuals who were in the 25.0 to 27.4, as well as the 27.5 to 29.9 kg/m2 ranges when using the 22.5 – 24.9 kg/m2 category as the reference. These significant positive elevations in risk are important from a public health point of view, since about a third of adults in the United States and more than a quarter of the world population is overweight (22, 23).
Analyses stratified by both maximum BMI and baseline BMI revealed that the highest risks of death occurred among those who had experienced substantial decreases in weight, which is most likely reflective of unintentional weight loss caused by apparent or preclinical disease. Consistent with our findings, weight loss without regard to intent has been identified as a significant predictor of mortality (24–27) as the majority of permanent weight loss tends to be unintentional (28–30). However, successful intentional weight loss has been associated with decreased risk of early mortality (24, 30, 31). By using maximum BMI with an extended weight history, we were able to address the problem of reverse causation associated with illness-induced weight loss (12, 14). Since weight loss can initiate a decade or more prior to death (11), use of an extended weight history is important to minimize bias in studies of BMI and mortality. We chose a weight history of 16 years to strike a trade-off between minimal reverse causation and maximum follow-up time, but we note that in an extended analysis in the NHS only, estimates did not completely stabilize even after 24 years of weight history (Table S17 and S18). Thus, our HRs are likely overestimated for underweight and underestimated for overweight and obese maximum BMI.
Our study has several strengths. We analyzed three large cohorts of men and women of various ages with long follow-up periods. Enrollment of health professionals allowed for high response rates, increased validity of exposure and outcome data, and minimization of confounding due to educational and socioeconomic homogeneity. In contrast to using retrospective data (12), the prospective nature of our cohorts reduces recall bias and selection bias. The establishment of an extended weight history period also diminishes reverse causation by capturing BMI data before disease development, even if the disease had not been diagnosed, allowing us to retain the vast majority of individuals in our study (11). Our analyses that included only never-smokers showed a similar J-shaped association with greater magnitude of excess risk in all BMI categories exceeding the normal weight category, enhancing the generalizability of our results.
Limitations include the use of data originating from predominately white participants mostly of high socioeconomic status. Future research may benefit from incorporation of maximum BMI with weight history to study mortality in other diverse cohorts. We also cannot rule out residual confounding and confounding by unmeasured variables. Although the use of BMI as a measure for adiposity is imperfect, as it does not differentiate between fat and lean body mass, the majority of population variance in adiposity is explained by BMI (2, 32). Since BMI was self-reported, there may be systematic underestimation of true BMI, although the correlation between self-reported and measured weight was generally high in the NHS (r2 = 0.97) (15). Recalled maximum BMI should also be validated against longitudinal data, since such a measure would capture lifetime maximum BMI. A prior study investigating the validity of recalled maximum BMI found a strong correlation with contemporaneous data, however, in this study the gold standard was based on self-reported data and validity was only evaluated over a twelve-year period (33). Finally, there were a substantial number of individuals who had missing BMI values from at least one survey cycle, which may introduce bias if survey cycles with missing weight data were more likely to have been that individual’s maximum weight.
Our findings suggest that minimum risk of mortality occurs among those with a maximum BMI in the range of 18.5 – 24.9 kg/m2 at all ages, regardless of sex and smoking status. Maximum BMIs in the overweight and obese categories were associated with elevated risks of all-cause mortality and deaths due to CVD, cancer, and other causes. In contrast to baseline BMI, use of maximum BMI with an extended weight history period appears to minimize reverse causation due to illness-induced weight loss.
Supplementary Material
Acknowledgments
This work was supported by the NIH (Bethesda, Maryland) UM1 CA186107, R01 HL034594, R01 HL088521, UM1 CA176726, UM1 CA167552, R01 HL35464, R01 AG040212, and R03 SH000037. We would like to thank the participants and staff of the NHS, NHS II, and HPFS for their valuable contributions as well as the following state cancer registries for their help: AL, AZ, AR, CA, CO, CT, DE, FL, GA, ID, IL, IN, IA, KY, LA, ME, MD, MA, MI, NE, NH, NJ, NY, NC, ND, OH, OK, OR, PA, RI, SC, TN, TX, VA, WA, WY. The authors assume full responsibility for analyses and interpretation of these data.
Footnotes
Protocol: Not available
Statistical Code: Available to interested readers by contacting Dr. Frank B. Hu (nhbfh@channing.harvard.edu)
Data: Not available
References
- 1.Flegal KM, Kit BK, Orpana H, Graubard BI. Association of all-cause mortality with overweight and obesity using standard body mass index categories: a systematic review and meta-analysis. Jama. 2013;309(1):71–82. doi: 10.1001/jama.2012.113905. [DOI] [PMC free article] [PubMed] [Google Scholar]
- 2.FB Hu. Obesity Epidemiology. USA: Oxford University Press; 2008. [Google Scholar]
- 3.Lawlor DA, Hart CL, Hole DJ, Davey Smith G. Reverse causality and confounding and the associations of overweight and obesity with mortality. Obesity (Silver Spring) 2006;14(12):2294–304. doi: 10.1038/oby.2006.269. [DOI] [PubMed] [Google Scholar]
- 4.Flegal KM, Kalantar-Zadeh K. Perspective: Overweight, mortality and survival. Obesity (Silver Spring, Md) 2013;21(9):1744–5. doi: 10.1002/oby.20588. [DOI] [PMC free article] [PubMed] [Google Scholar]
- 5.Pischon T, Boeing H, Hoffmann K, Bergmann M, Schulze MB, Overvad K, et al. General and Abdominal Adiposity and Risk of Death in Europe. New England Journal of Medicine. 2008;359(20):2105–20. doi: 10.1056/NEJMoa0801891. [DOI] [PubMed] [Google Scholar]
- 6.Berrington de Gonzalez A, Hartge P, Cerhan JR, Flint AJ, Hannan L, MacInnis RJ, et al. Body-Mass Index and Mortality among 1.46 Million White Adults. New England Journal of Medicine. 2010;363(23):2211–9. doi: 10.1056/NEJMoa1000367. [DOI] [PMC free article] [PubMed] [Google Scholar]
- 7.Collaboration GBM. Body-mass index and all-cause mortality: individual-participant-data meta-analysis of 239 prospective studies in four continents. The Lancet. 2016;388(10046):776–86. doi: 10.1016/S0140-6736(16)30175-1. [DOI] [PMC free article] [PubMed] [Google Scholar]
- 8.Sun Q, Townsend MK, Okereke OI, Franco OH, Hu FB, Grodstein F. Adiposity and weight change in mid-life in relation to healthy survival after age 70 in women: prospective cohort study. BMJ. 2009;339 doi: 10.1136/bmj.b3796. [DOI] [PMC free article] [PubMed] [Google Scholar]
- 9.Tobias DK, Hu FB. Does Being Overweight Really Reduce Mortality? Obesity(Silver Spring, Md) 2013;21(9) doi: 10.1002/oby.20602. [DOI] [PMC free article] [PubMed] [Google Scholar]
- 10.Adams KF, Schatzkin A, Harris TB, Kipnis V, Mouw T, Ballard-Barbash R, et al. Overweight, Obesity, and Mortality in a Large Prospective Cohort of Persons 50 to 71 Years Old. New England Journal of Medicine. 2006;355(8):763–78. doi: 10.1056/NEJMoa055643. [DOI] [PubMed] [Google Scholar]
- 11.Alley DE, Metter EJ, Griswold ME, Harris TB, Simonsick EM, Longo DL, et al. Changes in Weight at the End of Life: Characterizing Weight Loss by Time to Death in a Cohort Study of Older Men. American Journal of Epidemiology. 2010;172(5):558–65. doi: 10.1093/aje/kwq168. [DOI] [PMC free article] [PubMed] [Google Scholar]
- 12.Stokes A. Using maximum weight to redefine body mass index categories in studies of the mortality risks of obesity. Population Health Metrics. 2014;12:6. doi: 10.1186/1478-7954-12-6. [DOI] [PMC free article] [PubMed] [Google Scholar]
- 13.Flegal KM, Graubard BI, Williamson DF, Gail MH. Impact of smoking and preexisting illness on estimates of the fractions of deaths associated with underweight, overweight, and obesity in the US population. Am J Epidemiol. 2007;166(8):975–82. doi: 10.1093/aje/kwm152. [DOI] [PubMed] [Google Scholar]
- 14.Stokes A, Preston SH. Revealing the burden of obesity using weight histories. Proceedings of the National Academy of Sciences. 2016 doi: 10.1073/pnas.1515472113. [DOI] [PMC free article] [PubMed] [Google Scholar]
- 15.Rimm EB, Stampfer MJ, Colditz GA, Chute CG, Litin LB, Willett WC. Validity of self-reported waist and hip circumferences in men and women. Epidemiology. 1990;1(6):466–73. doi: 10.1097/00001648-199011000-00009. [DOI] [PubMed] [Google Scholar]
- 16.Panel NOEIE. Clinical guidelines on the identification, evaluation, and treatment of overweight and obesity in adults. 1998 [PubMed] [Google Scholar]
- 17.Akaike H. Information Theory and an Extension of the Maximum Likelihood Principle. In: Parzen E, Tanabe K, Kitagawa G, editors. Selected Papers of Hirotugu Akaike. Vol. 1998. New York, NY: Springer New York; pp. 199–213. [Google Scholar]
- 18.Willett WC, Sampson L, Stampfer MJ, Rosner B, Bain C, Witschi J, et al. Reproducibility and validity of a semiquantitative food frequency questionnaire. Am J Epidemiol. 1985;122(1):51–65. doi: 10.1093/oxfordjournals.aje.a114086. [DOI] [PubMed] [Google Scholar]
- 19.Cornell JE, Mulrow CD, Localio R, Stack CB, Meibohm AR, Guallar E, et al. Random-effects meta-analysis of inconsistent effects: a time for change. Ann Intern Med. 2014;160(4):267–70. doi: 10.7326/M13-2886. [DOI] [PubMed] [Google Scholar]
- 20.Collaboration PS. Body-mass index and cause-specific mortality in 900,000 adults: collaborative analyses of 57 prospective studies. The Lancet. 2009;373(9669):1083–96. doi: 10.1016/S0140-6736(09)60318-4. [DOI] [PMC free article] [PubMed] [Google Scholar]
- 21.Aune D, Sen A, Prasad M, Norat T, Janszky I, Tonstad S, et al. BMI and all cause mortality: systematic review and non-linear dose-response meta-analysis of 230 cohort studies with 3.74 million deaths among 30.3 million participants. Bmj. 2016;353:i2156. doi: 10.1136/bmj.i2156. [DOI] [PMC free article] [PubMed] [Google Scholar]
- 22.Ng M, Fleming T, Robinson M, Thomson B, Graetz N, Margono C, et al. Global, regional and national prevalence of overweight and obesity in children and adults 1980-2013: A systematic analysis. Lancet (London, England) 2014;384(9945):766–81. doi: 10.1016/S0140-6736(14)60460-8. [DOI] [PMC free article] [PubMed] [Google Scholar]
- 23.Ogden CL, Carroll MD, Kit BK, Flegal KM. Prevalence of childhood and adult obesity in the united states, 2011-2012. JAMA. 2014;311(8):806–14. doi: 10.1001/jama.2014.732. [DOI] [PMC free article] [PubMed] [Google Scholar]
- 24.Gregg EW, Gerzoff RB, Thompson TJ, Williamson DF. Trying to Lose Weight, Losing Weight, and 9-Year Mortality in Overweight U.S. Adults With Diabetes. Diabetes Care. 2004;27(3):657–62. doi: 10.2337/diacare.27.3.657. [DOI] [PubMed] [Google Scholar]
- 25.Myrskyla M, Chang VW. Weight change, initial BMI, and mortality among middle- and older-aged adults. Epidemiology. 2009;20(6):840–8. doi: 10.1097/EDE.0b013e3181b5f520. [DOI] [PMC free article] [PubMed] [Google Scholar]
- 26.Wannamethee SG, Shaper AG, Walker M. Weight change, body weight and mortality: the impact of smoking and ill health. Int J Epidemiol. 2001;30(4):777–86. doi: 10.1093/ije/30.4.777. [DOI] [PubMed] [Google Scholar]
- 27.Zheng H, Tumin D, Qian Z. Obesity and mortality risk: new findings from body mass index trajectories. Am J Epidemiol. 2013;178(11):1591–9. doi: 10.1093/aje/kwt179. [DOI] [PMC free article] [PubMed] [Google Scholar]
- 28.Wannamethee SG, Shaper AG, Lennon L. Reasons for intentional weight loss, unintentional weight loss, and mortality in older men. Arch Intern Med. 2005;165(9):1035–40. doi: 10.1001/archinte.165.9.1035. [DOI] [PubMed] [Google Scholar]
- 29.Wannamethee SG, Shaper AG, Whincup PH, Walker M. Characteristics of older men who lose weight intentionally or unintentionally. Am J Epidemiol. 2000;151(7):667–75. doi: 10.1093/oxfordjournals.aje.a010261. [DOI] [PubMed] [Google Scholar]
- 30.Williamson DF, Thompson TJ, Thun M, Flanders D, Pamuk E, Byers T. Intentional weight loss and mortality among overweight individuals with diabetes. Diabetes Care. 2000;23(10):1499–504. doi: 10.2337/diacare.23.10.1499. [DOI] [PubMed] [Google Scholar]
- 31.Harrington M, Gibson S, Cottrell RC. A review and meta-analysis of the effect of weight loss on all-cause mortality risk. Nutr Res Rev. 2009;22(1):93–108. doi: 10.1017/S0954422409990035. [DOI] [PubMed] [Google Scholar]
- 32.Janssen I, Heymsfield SB, Allison DB, Kotler DP, Ross R. Body mass index and waist circumference independently contribute to the prediction of nonabdominal, abdominal subcutaneous, and visceral fat. The American Journal of Clinical Nutrition. 2002;75(4):683–8. doi: 10.1093/ajcn/75.4.683. [DOI] [PubMed] [Google Scholar]
- 33.Stokes A, Ni Y. Validating a summary measure of weight history for modeling the health consequences of obesity. Annals of Epidemiology. 26(12):821–6.e2. doi: 10.1016/j.annepidem.2016.10.005. [DOI] [PMC free article] [PubMed] [Google Scholar]
Associated Data
This section collects any data citations, data availability statements, or supplementary materials included in this article.