

Abstract
Bardet-Biedl Syndrome (BBS) is an autosomal recessive disorder and is classified as one of the ciliopathy. The patients manifest a characteristic craniofacial dysmorphology but the effects of Bbs3 deficiency in the developmental process during the craniofacial pathogenesis are still incompletely understood. Here, we analyzed a cranial development of a BBS model Bbs3-/- mouse. It was previously reported that these mutant mice exhibit a dome-shape cranium. We show that Bbs3-/- mouse embryos present mid-facial hypoplasia and solitary central upper incisor. Morphologically, these mutant mice show synchondrosis of the cranial base midline due to the failure to fuse in association with loss of intrasphenoidal synchondrosis. The cranial base was laterally expanded and longitudinally shortened. In the developing cartilaginous primordium of cranial base, cells present in the midline were less in Bbs3-/- embryos. Expression of BBS3 was observed specifically in a cell population lying between condensed ectomesenchyme in the midline and the ventral midbrain at this stage. Finally, siRNA-based knockdown of Bbs3 in ATDC5 cells impaired migration in culture. Our data suggest that BBS3 is required for the development of cranial base via regulation of cell migration toward the midline where they promote the condensation of ectomesenchyme and form the future cartilaginous templates of cranial base.
Keywords: Primary cilia, craniofacial development, sonic hedgehog (SHH), cell migration, Bardet-Biedl Syndrome
1. Introduction
Craniofacial abnormalities are often manifested as birth defects and these could be a key for diagnosing the disease. Bardet-Biedl syndrome (BBS) is a rare autosomal recessive disorder caused by homozygous mutation in a set of genes related to cilia (BBS1-19) [1-6]. The clinical symptoms of BBS are characterized by six major features; retinal degeneration, obesity, post-axial polydactyly, renal dysfunction, hypogenitalism and cognitive impairment [7]. In addition to these hallmarks of the disorder, BBS patients manifest a facial dysmorphism characterized by mid-facial hypoplasia, great width of face, prominent forehead and dental anomalies [8, 9].
Functionally, BBS proteins are thought to work collectively at primary cilia as transport proteins to carry several membranous receptors into and out of primary cilia [10-13]. Primary cilium is essential for the transduction of Sonic Hedgehog (Shh) signaling [14, 15], and the involvement of BBS proteins in Hh signaling has been implicated [13, 16]. While Shh signaling is a well known factor indispensable for the patterning and growth of facial primordia [17], how BBS proteins contribute to the craniofacial development regulated by Shh signaling is yet to be addressed.
Up to date, several BBS model mice have been generated. In these mice, major clinical symptoms of BBS were mostly observed, but the craniofacial symptoms of BBS were described only in a subset of BBS model mice [18-23]. For instance, Tobin et al reported that there were significant similarities between BBS model mice (Bbs4-/- and Bbs6-/-) and BBS patients in craniofacial dysmorphology including a larger mid-face width to height and a shorter snout [22]. Ift27 is the most recently identified BBS causative gene (BBS19) and knockout mice manifest various craniofacial defects [6, 23]. However, the underlying developmental process contributing to the resultant craniofacial dysmorphology in BBS model mice is, for the most part, unknown.
Craniofacial abnormalities observed in the recently generated Bbs3-/- mice were characterized as dome-shaped cranium after birth [24], which has not been described in other BBS models. Understanding the pathogenesis of a unique craniofacial phenotype in Bbs3-/-mice is of great importance owing to the vast genetic heterogeneity of BBS and the undetermined genotype-phenotype correlation. To gain insight into the function of BBS3 in the pathogenesis of craniofacial abnormalities in Bbs3-/- mice, we investigated the developmental craniofacial skeletogenesis in the Bbs3-/- embryos.
2. Materials and methods
2.1. Bbs3 knockout mice
We backcrossed previously reported Bbs3+/- mice in C57BL/6J; 129/SvJ mixed background [24] with C57BL/6 inbred strain for 5 generations to unify the genetic background. For genotype, sample DNA was prepared from tail and PCR was performed using the following primers. Bbs3-KO-Fr, 5′-GCTACCCGTGATATTGCTGAA-3′, Bbs3-KO-Rv, 5′-AAAAGGGCATAAA AGCACCTC-3′, Bbs3-WT-Fr, 5′-TTTGGAGATTTGTCTCCCTCTG-3′.
All animal experiments were approved by the institutional animal care and use committee of Tokyo Medical and Dental University.
2.2. Micro-CT (μCT) images and analysis
Heads of embryos at E18.5 were prepared for μCT scanning. Briefly, the scalp was peeled off and fixed with 4% paraformaldehyde (PFA) overnight at 4°C. After the fixation, samples were substituted with 70% ethanol. For μCT analysis, an entire head was scanned at 30μm/pixel using MX90.3D μCT, reconstructed and analyzed by TriBON software (RATOC, Tokyo, Japan).
2.3. Skeletal preparation
Embryos at E18.5 were incubated in water at 75°C water for 30 seconds to remove the epidermal tissues and fixed with 95% ethanol for three days. Embryos at E14.5 were directly fixed with 95% ethanol. After fixation, embryos were stained with Alcian Blue staining solution (0.015% Alcian Blue 8GX [#05500, Sigma-Aldrich, St. Louis, MO], 20% acetic acid, 80% ethanol) overnight, and rinsed with 95% ethanol twice. Embryos were then substituted with 1% KOH for 2-6 hours at room temperature and stained with Alizarin Red staining solution (50mg Alizarin Red S [#011-01192, Wako Pure Chemical Industries, Osaka, Japan] in one liter of 2% KOH), for 2 hours. After decolorized with 2% KOH shortly, embryos were gradually substituted with glycerol and eventually with 100% glycerol for permanent preparation.
2.4. Histology, Immunohistochemistry and Immunofluorescence
Tissues from embryos at indicated stages were fixed with 4% PFA for 24 hours and embedded in paraffin after dehydration and substitution. Tissues were sectioned at a thickness of 5μm and then stained with haematoxylin and eosin (H&E), or Toluidine Blue (pH4.1). For immunohistochemistry, paraffin sections at 5μm thickness were prepared as described above. Tissue sections were first deparaffinized and rehydrated, and then blocked with 1% BSA. BBS3 polyclonal antibody was purchased from Proteintech (#12676-1-AP, Proteintech Group, Chicago, IL) and used at 1:50 dilution. As a second antibody, Biotinylated Goat Anti-Rabbit IgG antibody (#BA-1000, Vector Laboratories Inc., Burlingame, CA) was used at 1:500 dilution. Biotinylated second antibody was detected using Vectastain Elite ABS kit (#PK-6100, Vector Laboratories Inc., Burlingame, CA). For immunocytochemistry, primary chondrocytes were fixed with 4% PFA for 15 minutes at room temperature and subsequently permeabilized with 0.3% Triton X-100 (#T8787, Sigma-Aldrich Co, St. Louis, MO). Cells are then blocked with 5% normal goat serum (#143-06561, Wako Pure Chemical Industries, Osaka, Japan) in 0.3% Triton X-100 for 1h. To stain primary cilia, primary antibody against acetylated α-tubulin [6-11B-1] (#ab24610, Abcam Inc., Cambridge, MA) was diluted at 1:1000 and reacted overnight at 4°C. As a second antibody, Goat anti-mouse IgG Alexa 488 (ThermoFisher Scientific, San Jose, CA, USA) was used at 1:500 dilution. All the images were taken by Olympus optical microscope BX51 with the corresponding acquisition software DP Manager.
2.5. In situ hybridization
To amplify the DNA template for the DIG-labeled RNA probe of Bbs3, the following Bbs3-specific primer pair was used [25]. Bbs3, forward primer: 5′-CCTTTGGATTGGCGTCAA AGATCAG-3′, reverse primer: 5′-CACTGAGGTCTCCAGGGACTATCTC-3′. DIG-labeled RNA probe of Bbs3 was synthesized using DIG RNA Labeling kit (SP6/T7) (#11175025910, Roche Diagnostics, Mannheim, Germany). For the whole mount in situ hybridization, whole embryos were harvested at E10.5 - E13.5 and fixed with 4% PFA overnight at 4°C. After pretreating with 1% Tween-20 in PBS and l0 μ/ml proteinase K for appropriate time, embryos were hybridized with antisense or sense RNA probe of Bbs3 overnight at 70°C. For the signal detection, alkaline phosphatase-conjugated antibody to Digoxigenin (#11093274910, Roche Diagnostics, Mannheim, Germany) diluted at 1:3,300, and BM purple (#11442074001, Roche Diagnostics, Mannheim, Germany) were used.
2.6. Wound healing assay
ATDC5 cells were cultured in DMEM:F12=1:1 supplemented with 5% FBS, 1% Antibiotic Antimycotic (#15240-062, GIBCO BRL) and 1% ITS-A (#51300-044, GIBCO BRL). For wound healing assay, ATDC5 cells were seeded at density of 1.0×10⁴ cells/cm2 and transfected with siControl (#4390843, Abmbion, Austin, TX) or siBbs3 (#s80290, Ambion, Austin, TX) using Lipofectamine RNAiMax (#137780, ThermoFisher Scientific, San Jose, CA, USA) in OptiMEM (#31985062, GIBCO BRL). After transfection, cells were cultured in medium supplemented with 0.5% FBS without ITS-A for 24 hours. After wound was made, cells were cultured another 24 hours. Finally cells were stained with 1% Toluidin Blue O (#T-3260, Sigma-Aldrich Co, St. Louis, MO) in 1% tetraborate decahydrate to visualize the migrated cells. The migrated cells were counted by ImageJ software.
2.7. Isolation of primary chondrocytes
Rib cages from wild type (Bbs3+/+) and Bbs3-/- embryos at E18.5 were dissected and trimmed to remove bony and soft tissues. Rib cartilages were then digested in 3mg/ml collagenase (#140821, Nitta gelatin, Osaka, Japan) DMEM serum free medium at 37°C in a shaking water bath. The first fraction after 5 minutes of digestion was discarded. The second, third and fourth fractions digested for 30 minutes were collected as primary rib chondrocytes. The isolated primary rib chondrocytes were cultured in DMEM:F12=1:1 supplemented with 5% FBS, 1% ABS and 1% ITS-A for one week to make the cells expand, and then used for experiment.
2.8. Real-time PCR
Cells were cultured in the presence of 0.5μg/ml recombinant mouse Shh (#464-SH, R&D systems, Minneapolis, MN) or 100nM Smoothened Agonist (SAG) (#566661, EMD Millipore, Billerica, MA) for 24 hours. Total RNA from each sample was extracted using TriReagent (#TR118, Molecular Research Center, Cincinnati, OH) and purified by subsequent isopropanol/ethanol precipitation. cDNA was synthesized from 1ug total RNA using MultiscribeTM Reverse Transcriptase (#4368814, Applied Biosystems, Foster City, CA). Real-Time PCR was performed using StepOne Real-Time PCR systems (Applied Biosystems) and the samples were amplified using Fast SYBR Green Master Mix (#4385614, Applied Biosystems). The amplification curves of samples were converted to relative expression values according to the standard controls, and all the values were normalized by β-actin expression. Primers for the target genes are listed as follows. Gli1, forward primer: 5′-CTGCGAAGATGAT TCGGGTCT-3′, reverse primer: 5′-GGAGACAGCATGGCTCACTAT-3′ (junction between exons 2 and 3). β-actin, forward primer: 5′-CTTCTTGGGTATGGAATCCTGTGG-3′, reverse primer: 5′-TGTGTTGGCATAGAGGTCTTTACG-3′ (junction between exons 4 and 5).
2.9. Statistical Analysis
All the values were expressed as means ±SD. Statistical analysis was conducted based on Student's t test and p-values less than 0.05 or 0.01 were regarded as significantly different.
3. Results
3.1. P0 Bbs3-/- mice exhibit cleft lip/palate and congenital heart defect resulting in immediate postnatal lethality
Bardet-Biedl Syndrome patients show a wide range of clinical variability within and between families [7, 8]. Biological phenotypes of the mutant mice are also variable which often hinders the underlying phenotypes. Therefore, we first backcrossed the Bbs3+/- mice originally generated in the mixed background with C57BL/6J more than 5 times. Bbs3-/- mice were born following Mendel's law of segregation (Bbs3+/+; 24%, Bbs3+/-; 51.2%, Bbs3-/-; 24.8%, n=125) and their body weight at embryonic day (E) 18.5 was comparable to the littermates (Fig. 1A). Consistent with the previous report [24], Bbs3-/- mice presented a dome-shape cranium (Fig. 1, B-D, arrow). Interestingly, approximately one third of Bbs3-/- mice showed cleft lip (Fig. 1, E and F) and/or cleft palate (Fig. 1, G and H), which haven't been reported in any BBS model mouse before. However, Bbs3-/- mice died within 2-3 hours after birth, panting and exhibiting cyanosis (Fig. 1, B-D). The cause of the immediate postnatal death of Bbs3-/- mice appeared to be due to the heart defects because we observed that all Bbs3-/- mice exhibited complete atrioventricular septum defect in serial sections (Table, Fig. 1, I and J).
Fig. 1.
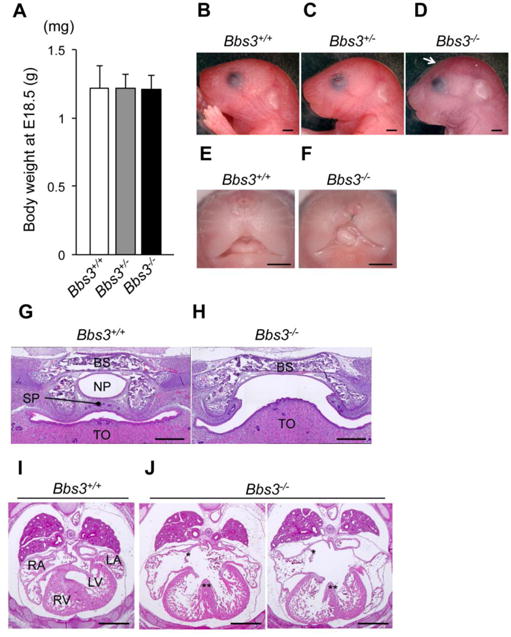
Bbs3-/- mice show a dome-shaped cranium, cleft lip/palate and die immediately after birth due to congenital heart defects. (A) Body weight of embryos at E18.5. Values are shown as means ±SD. Wild type (Bbs3+/+); n=14, Bbs3+/; n=43, Bbs3-/-; n=14. (B-D) Images of mice at postpartum. The arrow in (D) points the dome-shaped cranium in Bbs3-/- mice. Bars, 1mm. (E, F) Cleft lip observed in a Bbs3 -/- embryo at E18.5. Bars, 1mm. (G, H) Coronal-sections of cranial base at E18.5 embryos stained with H&E. The arrows in (H) indicate the un-fused secondary palate in Bbs3-/-embryo. BS; basisphenoid, NP; nasopharynx, SP; secondary palate, TO; tongue. Bars, 250μm. (I, J) Cross-sections of heart at E14.5 embryos following H&E staining. The hearts of Bbs3-/- embryos show both atrial (asterisks) and ventricular (double asterisks) septum defect. LA; left atrium, LV; left ventricle, RA; right atrium, RV; right ventricle. Bars, 500μm.
Table.
Frequency of craniofacial and other defects in Bbs3-/- mice.
| Craniofacial defects | Bbs3+/+ | Bbs3+A | Bbs3v- |
|---|---|---|---|
| # of affected / total (penetrance %) | |||
| Cleft palate (PO) | 0/5 (0%) | 0/9 (%) | 3/10 (33%) |
| Atrioventricular septum defect† | 0/5 (0%) | - | 7/7(100%) |
| Presphenoid bone defect† | 0/17 (0%) | 0/21 (0%) | 21/21 (100%) |
| Basisphenoid bone defect† | 0/17 (0%) | 0/21 (0%) | 21/21 (100%) |
| Fused central upper incisor (E18.5) | 0/2 (0%) | - | 2/2(100%) |
| Fused premaxillary bones † | 0/17(0%) | 0/21 (0%) | 20/21 (95%) |
| Fused vomer wings † | 0/17(0%) | 0/21 (0%) | 21/21 (100%) |
| Hypomorphic premaxillary shelves † | 0/17 (0%) | 0/21 (0%) | 21/21 (100%) |
| Asymmetric fusion of sternum (El8.5) | 1/6(17%) | 1/10(10%) | 5/8 (63%) |
The penetrance is calculated from both E14.5 and E18.5.
3.2. Bbs3-/- embryos demonstrate hypomorphic sphenoidal bones and dysmorphic premaxillary bones
To investigate the alterations in skeletal patterning of the craniofacial region in Bbs3-/- mice, 3D-μCT imaging was performed on E18.5 skull, revealing the prominent defects in sphenoidal bones in Bbs3 -/- embryos (Fig. 2, A and B). The sphenoidal bone consists of the presphenoid and the basisphenoid. Specifically, we observed that the presphenoid was severely hypomorphic and sometimes were totally absent (Fig. 2B, single asterisk). In addition, we observed a round defect foramen in the midline of basisphenoid in Bbs3-/- embryos (Fig. 2B, double asterisk). In wild type (Bbs3+/+) embryos, the presphenoid and the basisphenoid were connected by intrasphenoidal synchondrosis (Fig. 2A, double side arrow). However in Bbs3-/- embryos, no defined intrasphenoidal synchondrosis was detected (Fig. 2B). Compared to those phenotypes in sphenoid bones, basioccipital bones appeared unaffected in Bbs3-/- embryos (Fig. 2, A and B). The frontal part of the cranial base also demonstrated dysmorphic phenotypes in Bbs3 -/- embryos (Fig. 2, C and D). Namely, the premaxillary bones at both sides were fused in the midline completely or incompletely at times exhibiting a single hall at the center (Fig. 2D, arrows). Premaxillary shelves were hypomorphic or missing in Bbs3-/- embryos (Fig. 2D, asterisks). In addition, the bilateral vomer wings were already fused at this stage, and were filled with bone in Bbs3-/- embryos (Fig. 2D, arrowheads). These phenotypes both in sphenoidal and maxillo-nasal region of cranial base were observed in almost all Bbs3-/- embryos [Table, presphenoid bone defects; 100% (21/21), basisphenoid bone defect; 100% (21/21), fused premaxillary bones; 95% (20/21), fused vomer wings; 100% (21/21), hypomorphic premaxillary shelves; 100% (21/21)]. Quantitative comparison of the longitudinal length of the cranial base by measuring the distance from the anterior border of maxilla (a) to anterior edge of basioccipital bone (b) (Fig. 2, E and F, both sided arrows) indicated that Bbs3-/- embryos had significantly shorter cranial base than that of wild type embryos (Fig. 2G). These results indicate that cranial dysmorphology reported on the Bbs3 -/- mice was evident, mainly by representative mid-sagittal cranial base defects.
Fig. 2.
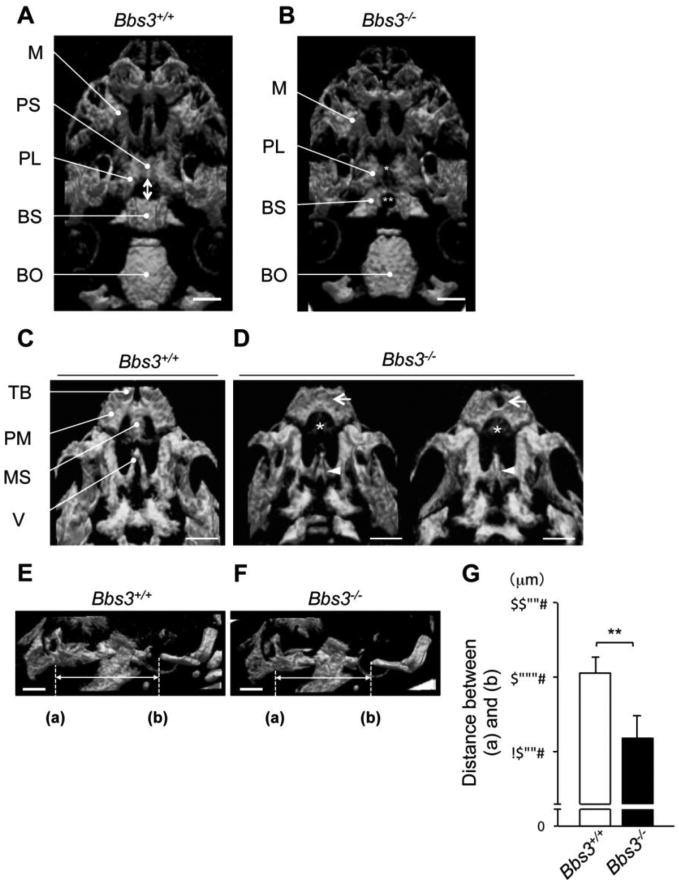
3D-μCT images of the cranial base demonstrate hypomorphic sphenoidal bones and dysmorphic premaxillary bones in Bbs3-/- embryos at E18.5. (A, B) Ventral views of cranial base at E18.5 scanned by 3D-μCT. Mandibles are removed for visualization. The double side arrow in (A) shows the provisional intrasphenoidal synchondrosis. Single asterisk and double asterisk in (B) indicate the lack of presphenoid and a foramen of basisphenoid in Bbs3 -/- embryo, respectively. (C, D) Ventral views of the premaxilla and maxilla of wild type and Bbs3-/- embryo at E18.5. Arrows in (D) indicate the fused premaxilla (right) with a central hall of premaxilla (left) in Bbs3-/- embryo. Asterisk in (D) shows the lack of premaxillary shelves. Arrowheads in (D) point fused vomer wings. (E, F) Lateral views of head at E18.5. (a) points the anterior border of maxilla and (b) points anterior edge of basioccipital bone. (G) The distance between (a) and (b). Values are shown as means ±SD. **p<0.01, Student's t-test (wild type; n=8, Bbs3-/-; n=5). BO; basioccipital bone, BS; basisphenoid, M; maxilla, PL; palatine, PM; premaxilla, PS; presphenoid, MS; premaxillary shelves, TB; tooth buds, V; vomer. Bars, 1mm.
3.3. The spheno-ethmoidal and intrasphenoidal synchondroses are cleaved in the midline of the cranial base in Bbs3-/- embryos
To visualize the skeletal patterning including cartilaginous tissues, we analyzed skeletal preparation at E18.5. In the lateral views of the head, we observed that the contour of the frontal bone to the nasal bone was steeper in Bbs3-/- embryos (Fig. 3, A and B, arrow). However, no obvious changes in the morphology or the length were evident in the calvarium of Bbs3 -/- embryos (Fig. 3, C and D), suggesting that the dome-shaped cranium observed in Bbs3 -/- embryos is due to the shorter cranial base against the normal growing calvarium. In addition, we found that the cranial base in Bbs3 -/- embryos was not only shorter as indicated by 3D-μCT images, but also was laterally expanded [the width of basioccipital bone, wild type; 2270±44μm, Bbs3-/-; 2620±196μm, **p<0.01] (Fig.3, G) with a big gap in the midline cartilaginous structures including the synchondrosis (Fig. 3, E and F, asterisks in inset). As suggested by the 3D-μCT images, we observed the formation of the spheno-ethmoidal and intrasphenoidal synchondrosis was severely affected, represented by shorter distances (Fig. 3, E and F, arrows in inset). Shorter cranial base may be due to the affected longitudinal growth in the mid-sagittal cartilaginous structure. Importantly, no cartilaginous tissues, which could be stained with Alcian Blue, were present in those unmineralized areas in the midline of the cranial base (Fig. 3F, asterisks in inset). We assume the dysmorphology in Bbs3-/- embryos is caused by the affected movements of the cells responsible for forming the cartilaginous tissues rather than the defect in mineralization. Interestingly, we observed that the spheno-occipital synchondrosis was partially cleaved and longitudinally elongated compared to the other synchondroses (Fig. 3, E and F, arrowhead in inset). The premaxillary bones completely fused in the midline in Bbs3-/- embryos (Fig. 3, H and I). Interestingly there were no tooth buds observed or a single hall was occasionally observed at the center (Fig. 3I, arrowhead).
Fig. 3.
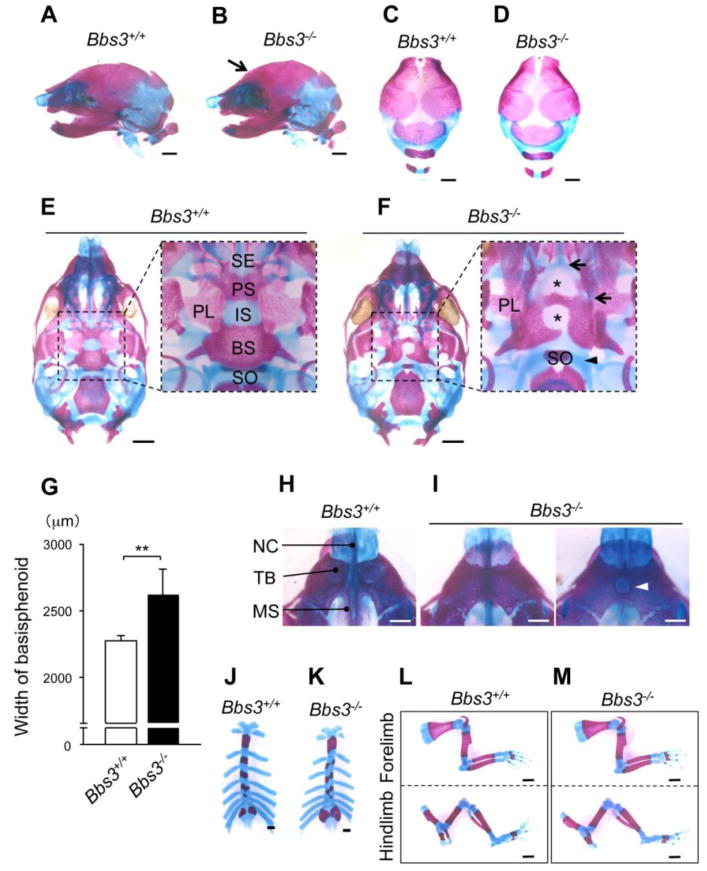
The cranial base of Bbs3 -/- embryos displays cleaved synchondrosis. (A, B) Lateral views of the head at E18.5 following Alizarin red and Alcian Blue staining. Arrow in (B) indicates the curved frontal bones in Bbs3-/- embryo. (C, D) Upper views of cranium at E18.5. (E, F) Ventral views of the cranial base at E18.5. The dotted squares enclosing the area from spheno-ethmoidal synchondrosis till sphenooccipital synchondrosis are enlarged at the right side. Asterisks in (F) show gaps in the cranial base of Bbs3-/- embryo. (G) The width of basisphenoid Values are shown as means ±SD. **p<0.01, Student's t-test (wild type; n=7, Bbs3-/-; n=8). (H, I) Ventral views of premaxilla at E18.5. Arrowhead in (I) indicates a hall in the center of premaxilla in Bbs3 -/- embryo. (J, K) Asymmetric fusion of sternum at E18.5 in Bbs3-/- embryo. (K, M) Forelimb and hind limb at E18.5. BS; basisphenoid, IS; intrasphenoidal synchondrosis, MS; premaxillary shelves, NC; nasal capsule, PL; palatine, PS; presphenoid, SE; spheno-ethmoidal synchondrosis, SO; sphenooccipital synchondrosis, TB; tooth buds. Bars in A-F and I-L, 1mm. Bars in G and H, 0.5mm.
Other than the craniofacial abnormalities, approximately 60% of Bbs3-/- embryos demonstrated asymmetric fusion of sternum (Table, Fig. 3, J and K). No morphological abnormalities were observed in the appendicular long bones (Fig. 3, L and M) in Bbs3-/- embryos.
3.4. The gap at the center of the cranial base in Bbs3-/- embryo is filled with non-cartilaginousfibrous connective tissues including fibroblastic-like cells
To obtain more detailed morphological insights at cellular level, we analyzed histological sections of E18.5 embryos. We first focused on the area of intrasphenoidal synchondrosis, basisphenoid and spheno-occipital synchondrosis (Fig. 4A). In the region of intrasphenoidal synchondrosis in Bbs3-/- embryos, we detected a bilateral pair of rod-like trabecular cartilages that were not fused in the midline and instead filled with fibrous connective tissues (Fig. 4, B and C, asterisk). Similarly in basioccipital bone, we occasionally observed a gap filled with fibroblastic-like cells in the mid-sagittal portion of the calcified tissues surrounded by well-defined periosteum at both ends (Fig. 4, D and E, asterisk). The cartilage tissues of spheno-occipital synchondrosis appeared to expand laterally and thickened dorso-ventrally, but again they failed to fuse in the midline (Fig. 4, F and G, asterisk).
Fig. 4.
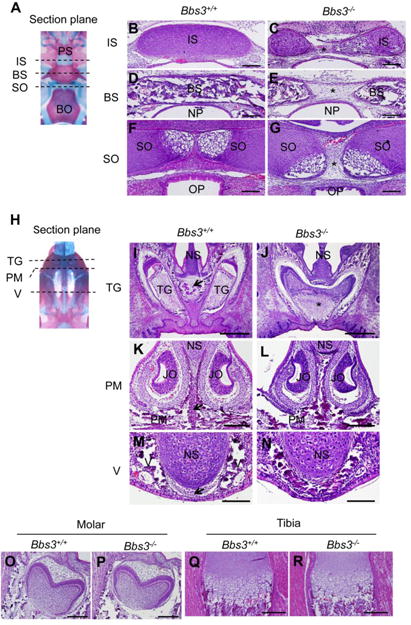
Cranial base of Bbs3-/- embryo shows defects in midline structure. H&E stained coronal sections of cranial base at E18.5 are shown. (A) Each position of the following section planes. (B-G) Sections at intrasphenoidal synchondrosis (B, C), basisphenoid (D, E), and sphenooccipital synchondrosis (F, G). Asterisks in (C), (E) and (G) indicate a gap in the cranial base of Bbs3-/-embryo. Bars, 100um. (H) Each position of the following section planes. (I, J) Sections at tooth germs. Arrow in (I) points the construct which is not observed in Bbs3-/- embryo. Asterisk in (J) shows a huge solitary upper incisor in Bbs3 -/- embryo. Bars, 500um. (K, L) Sections at premaxilla. Arrow in (K) points unmineralized mesenchymal cells dividing premaxiila at the center in wild type embryo. Bars, 200μm. (M, N) Sections at vomer. Arrow in (M) indicate a cell population which divide the bilateral vomer wings. Bars, 100um. BS; basisphenoid, BO; basioccipital bone, IS; intrasphenoidal synchondrosis, JO; Jacobson organ, NP; nasopharynx, NS; nasal septum, OP; oesophagus, PM; premaxilla, PS; presphenoid, SO; sphenooccipital synchondrosis, TG; tooth germs, V; vomer.
3.5. Mid-sagittal fusion of the upper incisor and vomer was observed in Bbs3-/- embryos
Next we looked at the anterior mid-cranium (Fig. 4H). In wild type embryos at E18.5, bilateral tooth germs of upper incisors were detected in the premaxilla (Fig. 4I). However, in Bbs3-/-embryos, we found huge solitary incisor in the premaxilla (Fig. 4J, asterisk). The midline structure between the tooth germs (Fig. 4I, arrow) was not seen in Bbs3-/- embryos (Fig. 4J). We observed no gross abnormalities on other parts of tooth germs including molars (Fig. 4, O and P), indicating that the defects in tooth development per se are unlikely, but rather the causative contribution of the adjacent mesenchymal structures. The unmineralized mid-sagittal mesenchymal structures were also found in the premaxilla and vomer levels in wild type (Fig. 4, K and M, arrows). However, this population of the cells was hardly detectable in Bbs3-/- embryos (Fig. 4, L and N), possibly contributing to the generation of the fused premaxilla and vomer. In contrast to these remarkable alterations in cranial parts of the skeletal tissues, we observed no gross abnormalities in the growth plate chondrocytes of long bones (Fig. 4, Q and R).
3.6. The abnormal formation of cranial base in Bbs3-/- mice is evident at E14.5
To investigate how the abnormal patterning occurred in cartilaginous tissues in cranial base in Bbs3-/- embryos, we examined further the embryos at E14.5, where the cartilaginous templates are mostly formed and the mineralization is about to occur in multiple sites. The skeletal preparation of embryos demonstrated the cranial base abnormality already exists in Bbs3-/-embryos. Namely, their cranial base was partially fused at intrasphenoidal and spheno-occipital synchondroses, while the abnormal gap in the midline of the overall cranial base was evident in Bbs3-/- embryos (Fig. 5, A and B). In particular, the cartilaginous primordium of presphenoid was absent (Fig. 5B, asterisk), and the future basisphenoid was not properly shaped, presenting a hall in the middle (Fig. 5B, double asterisk). These alterations properly corresponded to the lack of presphenoid and hypomorphic basisphenoid harboring a round hall observed at E18.5. The fused premaxilla was occasionally observed in Bbs3-/- embryos at E14.5 (Fig. 5, C and D).
Fig. 5.
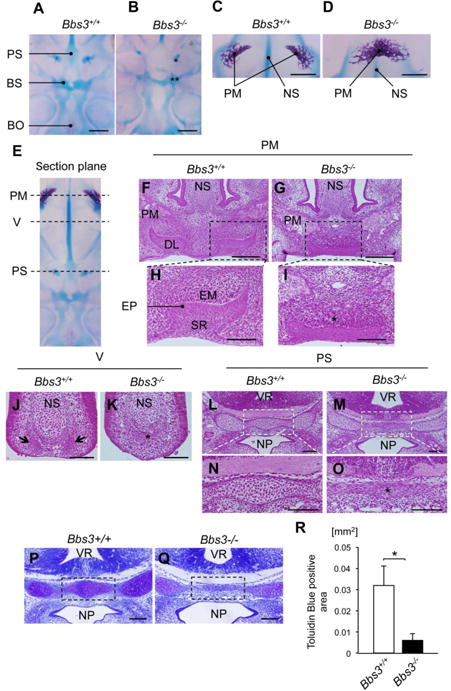
The abnormal patterning of cranial base in Bbs3 -/- embryos is already evident at E14.5. (A, B) Ventral views of cranial base at E14.5 following Alizarin red and Alcian Blue staining. Asterisk and double asterisk in (B) show the lack of cartilaginous primordium of preshenoid and abnormally huge hall in the primordium of basisphenoid, respectively Bars, 2mm. (C, D) Ventral views of mineralized premaxilla. Bars, 0.5mm. (E) Each position of the following section planes. (F-I) Sections at the formation site of dental laminae. The enclosed areas with dotted lines in (F) and (G) are enlarged in (H) and (I), respectively. Asterisk in (I) show the excessive condensation of ectomesenchyme in Bbs3-/- embryo. Bars in (F) and (G), 200μm. Bars in (H) and (I), 100um. (J, K) Condensations of ectomesenchyme in vomer. Arrows in (J) show the bilaterally formed condensations of ectomesenchyme in wild type embryo. Asterisk in (K) shows a single condensation of ectomesenchyme at the tip of nasal septum in Bbs3 -/- embryo. Bars, 100um. (L-O) The cartilaginous primordium of presphenoid. The enclosed areas with white dotted lines in (L) and (M) are enlarged in (N) and (O), respectively Asterisk in (O) indicates the cells with flat shape in the presphenoid primordium in Bbs3-/- embryo. Bars, 100um. (P, Q) Toluidine Blue staining of the cartilaginous primordium of presphenoid. (R) Within the dotted squares in (P) and (Q), the areas showing metachromasy were manually selected and quantified as Toludin Blue positive area by ImageJ software. *p<0.05, Student's t-test (wild type; n=3, Bbs3-/-; n=3). BO; basioccipital bone, BS; basisphenoid, DL; dental lamina, EM; ectomesenchyme, EP; oral epithelium, NP; nasopharynx, NS; nasal septum, PM; premaxilla, PS; presphenoid, SR; stellate reticulum, V; vomer, VR; ventricle.
In histology at this stage, three well-defined layers of the dental laminae; the condensation of ectomesenchyme (EM), oral epithelium (EP) and stellate reticulum (SR) are observed in wild type embryos (Fig. 5, F and H). However, in Bbs3-/- embryos, bilateral dental laminae were formed in close proximity and fused to form single and a shallow invagination in the midline (Fig. 5, G and I) with excess condensation of ectomesenchymal cells (Fig. 5I, asterisk). These changes in early tooth development may contribute to generating the fused central upper incisor in Bbs3-/- embryos (Fig. 4J). The vomer is formed through intramembranous ossification via ectomesenchymal cell condensation at first. At this stage, the ectomesenchymal cells are condensed at bilateral sides of nasal septum (Fig. 5J, arrows). However in Bbs3-/- embryos, the ectomesenchymal cells condensed only at the tip of the nasal septum (Fig. 5K, asterisk), which may correspond to the midline fusion of the vomer wings observed at E18.5 (Fig. 2D). Importantly we noticed that this observation was associated with the reduced size of the growing nasal septum toward ventral side (Fig. 5, J and K), potentially correspond to the failure to divide the condensation bilaterally. In the tissue section of presphenoid template, a cluster of chondrocytes was formed at the center in wild type embryos (Fig. 5, L and N). But in Bbs3-/- embryos, the midline cells were flat in shape and were not like chondrocytes (Fig. 5, M and O, asterisk). Indeed, the Toluidine Blue staining showed much less metachromasy on these cells (Fig. 5, P and Q), resulting in a decrease in the Toluidine Blue positive area (Fig. 5R). The observed premaxillary phenotypes may be paradoxical to the ones observed in sphenoidal region. However, the consistent observation among these findings was that insufficient cell population appeared developmentally in the midline structures in the cranium.
3.7. Bbs3 are strongly expressed oral region, limb buds, and brain at E12.5
To understand which cell population requires Bbs3 in the craniofacial region, whole body in situ hybridization was performed. Since the anatomical phenotypes were already evident in Bbs3-/-cranium at E14.5, we analyzed the expression of Bbs3 from E10.5 to E13.5. Although the Bbs3 was ubiquitously expressed in whole embryo at E10.5 and E11.5 (Fig. 6, A, B and E), the expression became gradually restricted in telencephalon, midbrain, oral region, limb buds, and spinal cord at E12.5 (Fig. 6, C and F). At E13.5 its expression became hardly detectable at oral region and spinal cord (Fig. 6, D and G). Immunohistochemistry indicated that BBS3 was strongly expressed in the cell population lying just under the ventral side of brain in the sections of future spheno-ethmoidal synchondrosis at E12.5 (Fig. 6, H and J). Under the layer of BBS3 expressing cells, the ectomensenchymal cells were condensed (Fig, 6J, the cells enclosed with dotted lines). Note that this condensation does not occur at this point in the cranial base where the BBS3 expressing cells are missing (Fig. 6, I and K).
Fig. 6.
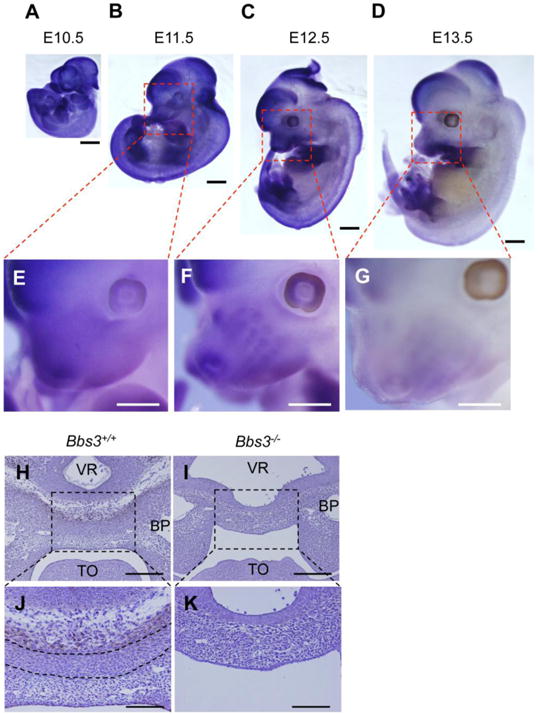
Bbs3 is strongly expressed in oral region during embryonic development and in a certain cell population lying under the brain. In situ hybridization of wild type embryos at indicated stages following the staining with antisense probe of Bbs3. (A-D) The expression pattern of Bbs3 in whole embryo through E10.5-E13.5. The oral regions enclosed with red dotted lines in (B), (C) and (D) are magnified in (E), (F) and (G), respectively. Bars, 1mm. (H-K) Immunostaining of BBS3 in the developing cranial base at E12.5. Nuclei are stained with Haematoxylin. The areas enclosed with dotted lines in (H) and (I) are magnified in (J) and (K), respectively. The dotted lines in (J) enclose the condensation of ectomesenchymal cells, which is not detectable in the cranial base of Bbs3 -/-embryo in (K). Bars in (H) and (I), 200μm. Bars in (J) and (K), 100μm. BP; Brachial pouch, TO; tongue, VR; ventricle.
3.8. The transcriptional response to hedgehog signaling does not appear to be disturbed in Bbs3-/-primary rib chondrocytes but the migratory ability is affected in Bbs3-silenced ATDC5 cells
We examined whether or not Bbs3-/- cells can transduce Shh signaling. Primary rib chondrocytes were isolated from wild type or Bbs3-/- embryos at E18.5. The formation of primary cilia in Bbs3-/- rib chondrocytes was not affected and this is consistent with the previous report [24] (Fig. 7, A and B). Rib chondrocytes were then treated with smoothened agonist (SAG) [26] to examine the expression of Gli1, a target of Hh signal. Bbs3-/- rib chondrocytes showed comparable increase of Gli1 expression induced by SAG treatment (Fig. 6C). This chondrogenic observation was supported by the experiment using ATDC5 cells [27] treated with SAG. Since SAG treatment equally induced a robust increase of Gli1 expression in control and in Bbs3-silenced ATDC5 cells (Fig. 7, D), and the recombinant mouse Shh also induced Gli1 expression in Bbs3-silenced cells at the same level as control, we concluded that the knockdown of Bbs3 interfere Shh signaling neither at patched1 level nor smoothened level. However, when we examined the migratory ability of Bbs3-silenced ATDC5 cells by scratch wound healing assay, Bbs3-silenced ATDC5 showed significantly fewer migrating cells toward the wound compared to the control cells (Fig. 7, E-G). These data suggest that even though the Bbs3 deficient cells could still transduce Shh signaling, the knockdown of Bbs3 affect the migratory ability of the chondrocytes, which may be causative to the insufficient migrating of ectomesenchymal cells in cranial base in Bbs3-/- mice.
Fig. 7.
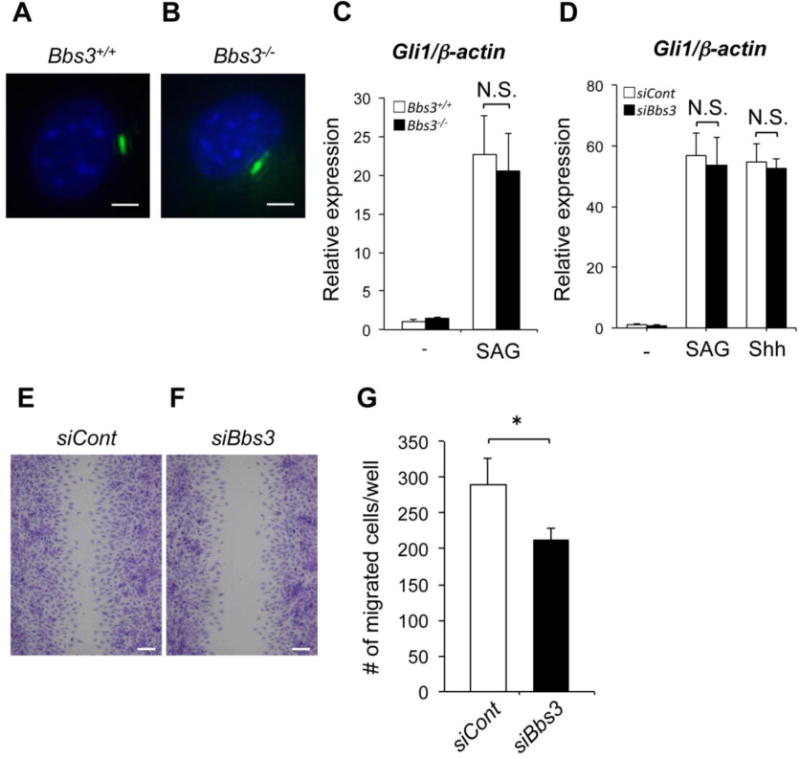
Lack of Bbs3 doesn't block the signal transduction of Shh, but hinder the cell migratory ability. (A, B) The rib chondrocytes from wild type and Bbs3-/- embryos at E18.5, stained with anti-acetylated α-tubulin (primary cilia, Green) and DAPI (nuclei, Blue). Bars, 10μm. (C) Gli1 expression in wild type and Bbs3 -/- rib chondrocytes after treated with or without 100nM SAG for 24 hours. N.S., not significant (p>0.5, wild type embryos; n=3, Bbs3-/- embryos; n=3). (D) Gli1 expression in Bbs3-silenced ATDC5 cells after treated with 100nM SAG, 0.5μg/ml Shh or none for 24 hours. N.S., not significant (p>0.5, n=4). (E, F) Wound healing assay of ATDC5 cells following Toluidin blue staining for visualization. Bars, 50μm. (G) The number of migrated cells to the wound counted by ImagJ software. All values are shown as means ±SD. *p<0.05 (Student's t test, n=3).
4. Discussion
Here we demonstrated that Bbs3 is required for the patterning and development of cranial base, and this requirement could be the cause of the cranial dysmorphology observed in BBS patients. We showed that the cleaved and severely defected spheno-ethmoidal and intrasphenoidal synchondroses generated longitudinally shorter and bilaterally expanded cranial base in Bbs3-/-embryos. These alterations in the cranial base may mainly contribute to the mid-facial hypoplasia and great width of face presented in BBS patients. In contrast to the defected cranial base, no alteration in size and morphology was evident in the calvarium of Bbs3-/- embryos, suggesting that the shorter cranial base against the normal growing calvarium may cause the dome-shaped cranium. Many BBS patients actually manifest a prominent forehead [8] and it could be explained by the relatively shorter cranial base.
We found the sphenoidal region including spheno-ethmoidal and intrasphenoidal synchondroses was cleaved, while the premaxillary region including vomer and upper incisors was fused in Bbs3-/- embryos. We noted that these seemingly contradictory alterations shared the similar defects; the lack or insufficient component cells in the midline structures. In sphenoidal region, skeletal elements are formed via endochondral ossification and thus, the lack or insufficient component chondrocytes in the midline lead to loss of presphenoid and misshapen basisphenoid with foramen. In premaxillary region, the skeletal elements including premaxilla, teeth and vomer are formed via intramembranous ossification. Normally, symmetric skeletal elements are bilaterally formed and they are divided by a certain mesenchymal cell population in the midline. However, in Bbs3-/- embryos such cell population was lost. Therefore, the skeletal elements were likely formed in close proximity and subsequently fused because of the absence of midline obstacles. We assume that BBS3 is required for a certain group of the cells to migrate toward the midline, where they form a cartilaginous template, or they divide the skeletal elements in need. Our in vitro experiments also support the requirement of BBS3 for appropriate cell migration.
We noted that the craniofacial phenotypes in Bbs3-/- embryos are restricted in the midline structures and they were mostly shared with those of Shh mutant mice including solitary median maxillary incisor [28]. Considering the function of BBS proteins in primary cilia and their involvement in Shh signaling [13, 16], the craniofacial abnormalities in Bbs3-/- embryos may be largely due to the disturbance of Shh signaling. However, neither Bbs3-/- rib chondrocytes nor Bbs3-silenced ATDC5 cells showed impairment induction of Gli1 expression in response to SAG (100nM) in our study. This may suggest that BBS3 may not play a crucial work in Shh signaling to the transcriptional response. In fact the extent of the reduction reported in the studies of Bbs3-/- and Bbs7-/- MEFs in SAG-induced Gli1 expression was small (20-30%) [16, 24]. Although, a recent study demonstrated that Bbs19-/- MEFs (Ift27 deficient) show a significant suppression of Gli1 expression in response to SAG (400nM) treatment [23]. These observations might suggest that the BBS proteins may collectively function as a fine-tuner to increase the sensitivity to higher concentration of Shh. In fact, BBS3 expressing cells lie just below the ventral midbrain which is reported to be a significant Shh source for promoting condensation of ectomesenchymal cells in the midline in zebrafish [29]. BBS3 was also strongly expressed at the ventral side of spinal cord including floor plate (data not shown). These observations also support the notion that BBS proteins function as a fine-tuner of Shh signaling. Currently we do not know how those BBS3 expressing cells function in craniofacial development and whether or not they influence the migration and condensation of ectomesenchymal cells. Recently, Bijlsma et al., reported an important cytophysiological response of MEF to Shh through the intracellular localization of Smoothened. Briefly, the chemotaxis is induced by Smoothened that is located outside the primary cilium and the cells without primary cilia show an exceeded chemotactic response to Shh [30]. Considering that the cells lacking BBS protein such as BBS3, BBS7 and BBS19 show aberrant accumulation of Smoothened in primary cilia even in the absence of Shh ligand [16, 23, 24], it is intriguing to speculate that BBS3 in response to high concentration of Shh may promote the clearance of Smoothened from primary cilia, and those Smoothened in turn may promote the chemotaxis toward Shh source. Further experiments of ligand dose-dependent analysis and chemotaxis analysis will be needed.
In conclusion, we demonstrated that BBS3 is required for the normal patterning and formation of the midline structures in craniofacial skeletogenesis. Our data suggest that the reduced migrating cells in mid-sagittal cranium may be in part the cause of the craniofacial dysmorphology in BBS.
Highlights.
Craniofacial dysmorphology in BBS3 deficient mice was characterized here.
Mid-sagittal regions of the cranial base were hypomorphic in Bbs3-/- embryos, with fewer cells.
Pathogenic involvement of the impaired migration of Bbs3-/- cells toward cranial midline was suggested.
These findings contribute to the better understandings and treatment of craniofacial symptoms of BBS.
Acknowledgments
This work has been supported by Grant-in-Aid for JSPS Fellows 13J09828, Grant-in-Aid for Scientific Research (A) 26253085, TBRF, and Abnormal Metabolism Research Foundation.
Footnotes
Conflict of interest: The authors declare that they have no conflicts of interest with the contents of this article.
Publisher's Disclaimer: This is a PDF file of an unedited manuscript that has been accepted for publication. As a service to our customers we are providing this early version of the manuscript. The manuscript will undergo copyediting, typesetting, and review of the resulting proof before it is published in its final form. Please note that during the production process errors may be discovered which could affect the content, and all legal disclaimers that apply to the journal pertain.
References
- 1.Zaghloul NA, Katsanis N. Mechanistic insights into Bardet-Biedl syndrome, a model ciliopathy. J Clin Invest. 2009;119:428–37. doi: 10.1172/JCI37041. [DOI] [PMC free article] [PubMed] [Google Scholar]
- 2.Kim SK, Shindo A, Park TJ, Oh EC, Ghosh S, Gray RS, Lewis RA, Johnson CA, Attie-Bittach T, Katsanis N, Wallingford JB. Planar cell polarity acts through septins to control collective cell movement and ciliogenesis. Science. 2010;329:1337–40. doi: 10.1126/science.1191184. [DOI] [PMC free article] [PubMed] [Google Scholar]
- 3.Otto EA, Hurd TW, Airik R, Chaki M, Zhou W, Stoetzel C, Patil SB, Levy S, Ghosh AK, Murga-Zamalloa CA, van Reeuwijk J, Letteboer SJ, Sang L, Giles RH, Liu Q, Coene KL, Estrada-Cuzcano A, Collin RW, McLaughlin HM, Held S, Kasanuki JM, Ramaswami G, Conte J, Lopez I, Washburn J, Macdonald J, Hu J, Yamashita Y, Maher ER, Guay-Woodford LM, Neumann HP, Obermüller N, Koenekoop RK, Bergmann C, Bei X, Lewis RA, Katsanis N, Lopes V, Williams DS, Lyons RH, Dang CV, Brito DA, Dias MB, Zhang X, Cavalcoli JD, Nürnberg G, Nürnberg P, Pierce EA, Jackson PK, Antignac C, Saunier S, Roepman R, Dollfus H, Khanna H, Hildebrandt F. Candidate exome capture identifies mutation of SDCCAG8 as the cause of a retinal-renal ciliopathy. Nat Genet. 2010;42:840–50. doi: 10.1038/ng.662. [DOI] [PMC free article] [PubMed] [Google Scholar]
- 4.Marion V, Stutzmann F, Gérard M, De Melo C, Schaefer E, Claussmann A, Hellé S, Delague V, Souied E, Barrey C, Verloes A, Stoetzel C, Dollfus H. Exome sequencing identifies mutations in LZTFL1, a BBSome and smoothened trafficking regulator, in a family with Bardet--Biedl syndrome with situs inversus and insertional polydactyly. J Med Genet. 2012;49:317–21. doi: 10.1136/jmedgenet-2012-100737. [DOI] [PubMed] [Google Scholar]
- 5.Scheidecker S, Etard C, Pierce NW, Geoffroy V, Schaefer E, Muller J, Chennen K, Flori E, Pelletier V, Poch O, Marion V, Stoetzel C, Strähle U, Nachury MV, Dollfus H. Exome sequencing of Bardet-Biedl syndrome patient identifies a null mutation in the BBSome subunit BBIP1 (BBS18) J Med Genet. 2014;51:132–6. doi: 10.1136/jmedgenet-2013-101785. [DOI] [PMC free article] [PubMed] [Google Scholar]
- 6.Aldahmesh MA, Li Y, Alhashem A, Anazi S, Alkuraya H, Hashem M, Awaji AA, Sogaty S, Alkharashi A, Alzahrani S, Al Hazzaa SA, Xiong Y, Kong S, Sun Z, Alkuraya FS. IFT27, encoding a small GTPase component of IFT particles, is mutated in a consanguineous family with Bardet-Biedl syndrome. Hum Mol Genet. 2014;23:3307–15. doi: 10.1093/hmg/ddu044. [DOI] [PMC free article] [PubMed] [Google Scholar]
- 7.Beales PL, Warner AM, Hitman GA, Thakker R, Flinter FA. Bardet-Biedl syndrome: a molecular and phenotypic study of 18 families. J Med Genet. 1997;34:92–8. doi: 10.1136/jmg.34.2.92. [DOI] [PMC free article] [PubMed] [Google Scholar]
- 8.Beales PL, Elcioglu N, Woolf AS, Parker D, Flinter FA. New criteria for improved diagnosis of Bardet-Biedl syndrome: results of a population survey. J Med Genet. 1999;36:437–46. [PMC free article] [PubMed] [Google Scholar]
- 9.Lorda-Sanchez I, Ayuso C, Sanz R, Ibañez A. Does Bardet-Biedl syndrome have a characteristic face? J Med Genet. 2001;38:E14. doi: 10.1136/jmg.38.5.e14. [DOI] [PMC free article] [PubMed] [Google Scholar]
- 10.Nachury MV, Loktev AV, Zhang Q, Westlake CJ, Peränen J, Merdes A, Slusarski DC, Scheller RH, Bazan JF, Sheffield VC, Jackson PK. A core complex of BBS proteins cooperates with the GTPase Rab8 to promote ciliary membrane biogenesis. Cell. 2007;129:1201–13. doi: 10.1016/j.cell.2007.03.053. [DOI] [PubMed] [Google Scholar]
- 11.Jin H, White SR, Shida T, Schulz S, Aguiar M, Gygi SP, Bazan JF, Nachury MV. The conserved Bardet-Biedl syndrome proteins assemble a coat that traffics membrane proteins to cilia. Cell. 2010;141:1208–19. doi: 10.1016/j.cell.2010.05.015. [DOI] [PMC free article] [PubMed] [Google Scholar]
- 12.Lechtreck KF, Brown JM, Sampaio JL, Craft JM, Shevchenko A, Evans JE, Witman GB. Cycling of the signaling protein phospholipase D through cilia requires the BBSome only for the export phase. J Cell Biol. 2013;201:249–61. doi: 10.1083/jcb.201207139. [DOI] [PMC free article] [PubMed] [Google Scholar]
- 13.Seo S, Zhang Q, Bugge K, Breslow DK, Searby CC, Nachury MV, Sheffield VC. A novel protein LZTFL1 regulates ciliary trafficking of the BBSome and Smoothened. PLoS Genet. 2011;7:e1002358. doi: 10.1371/journal.pgen.1002358. [DOI] [PMC free article] [PubMed] [Google Scholar]
- 14.Huangfu D, Liu A, Rakeman AS, Murcia NS, Niswander L, Anderson KV. Hedgehog signalling in the mouse requires intraflagellar transport proteins. Nature. 2003;426:83–7. doi: 10.1038/nature02061. [DOI] [PubMed] [Google Scholar]
- 15.Nozawa YI, Lin C, Chuang PT. Hedgehog signaling from the primary cilium to the nucleus: an emerging picture of ciliary localization, trafficking and transduction. Curr Opin Genet Dev. 2013;23:429–37. doi: 10.1016/j.gde.2013.04.008. [DOI] [PMC free article] [PubMed] [Google Scholar]
- 16.Zhang Q, Seo S, Bugge K, Stone EM, Sheffield VC. BBS proteins interact genetically with the IFT pathway to influence SHH-related phenotypes. Hum Mol Genet. 2012;21:1945–53. doi: 10.1093/hmg/dds004. [DOI] [PMC free article] [PubMed] [Google Scholar]
- 17.Jeong J, Mao J, Tenzen T, Kottmann AH, McMahon AP. Hedgehog signaling in the neural crest cells regulates the patterning and growth of facial primordia. Genes Dev. 2004;18:937–51. doi: 10.1101/gad.1190304. [DOI] [PMC free article] [PubMed] [Google Scholar]
- 18.Nishimura DY, Fath M, Mullins RF, Searby C, Andrews M, Davis R, Andorf JL, Mykytyn K, Swiderski RE, Yang B, Carmi R, Stone EM, Sheffield VC. Bbs2-null mice have neurosensory deficits, a defect in social dominance, and retinopathy associated with mislocalization of rhodopsin. Proc Natl Acad Sci U S A. 2004;101:16588–93. doi: 10.1073/pnas.0405496101. [DOI] [PMC free article] [PubMed] [Google Scholar]
- 19.Mykytyn K, Mullins RF, Andrews M, Chiang AP, Swiderski RE, Yang B, Braun T, Casavant T, Stone EM, Sheffield VC. Bardet-Biedl syndrome type 4 (BBS4)-null mice implicate Bbs4 in flagella formation but not global cilia assembly. Proc Natl Acad Sci U S A. 2004;101:8664–9. doi: 10.1073/pnas.0402354101. [DOI] [PMC free article] [PubMed] [Google Scholar]
- 20.Tadenev AL, Kulaga HM, May-Simera HL, Kelley MW, Katsanis N, Reed RR. Loss of Bardet-Biedl syndrome protein-8 (BBS8) perturbs olfactory function, protein localization, and axon targeting. Proc Natl Acad Sci U S A. 2011;108:10320–5. doi: 10.1073/pnas.1016531108. [DOI] [PMC free article] [PubMed] [Google Scholar]
- 21.Davis RE, Swiderski RE, Rahmouni K, Nishimura DY, Mullins RF, Agassandian K, Philp AR, Searby CC, Andrews MP, Thompson S, Berry CJ, Thedens DR, Yang B, Weiss RM, Cassell MD, Stone EM, Sheffield VC. A knockin mouse model of the Bardet-Biedl syndrome 1 M390R mutation has cilia defects, ventriculomegaly, retinopathy, and obesity. Proc Natl Acad Sci U S A. 2007;104:19422–7. doi: 10.1073/pnas.0708571104. [DOI] [PMC free article] [PubMed] [Google Scholar]
- 22.Tobin JL, Di Franco M, Eichers E, May-Simera H, Garcia M, Yan J, Quinlan R, Justice MJ, Hennekam RC, Briscoe J, Tada M, Mayor R, Burns AJ, Lupski JR, Hammond P, Beales PL. Inhibition of neural crest migration underlies craniofacial dysmorphology and Hirschsprung's disease in Bardet-Biedl syndrome. Proc Natl Acad Sci U S A. 2008;105:6714–9. doi: 10.1073/pnas.0707057105. [DOI] [PMC free article] [PubMed] [Google Scholar]
- 23.Eguether T, San Agustin JT, Keady BT, Jonassen JA, Liang Y, Francis R, Tobita K, Johnson CA, Abdelhamed ZA, Lo CW, Pazour GJ. IFT27 links the BBSome to IFT for maintenance of the ciliary signaling compartment. Dev Cell. 2014;31:279–90. doi: 10.1016/j.devcel.2014.09.011. [DOI] [PMC free article] [PubMed] [Google Scholar]
- 24.Zhang Q, Nishimura D, Seo S, Vogel T, Morgan DA, Searby C, Bugge K, Stone EM, Rahmouni K, Sheffield VC. Bardet-Biedl syndrome 3 (Bbs3) knockout mouse model reveals common BBS-associated phenotypes and Bbs3 unique phenotypes. Proc Natl Acad Sci U S A. 2011;108:20678–83. doi: 10.1073/pnas.1113220108. [DOI] [PMC free article] [PubMed] [Google Scholar]
- 25.Takada T, Iida K, Sasaki H, Taira M, Kimura H. Expression of ADP-ribosylation factor (ARF)-like protein 6 during mouse embryonic development. Int J Dev Biol. 2005;49:891–4. doi: 10.1387/ijdb.052031tt. [DOI] [PubMed] [Google Scholar]
- 26.Chen JK, Taipale J, Young KE, Maiti T, Beachy PA. Small molecule modulation of Smoothened activity. Proc Natl Acad Sci U S A. 2002;99:14071–6. doi: 10.1073/pnas.182542899. [DOI] [PMC free article] [PubMed] [Google Scholar]
- 27.Atsumi T, Miwa Y, Kimata K, Ikawa Y. A chondrogenic cell line derived from a differentiating culture of AT805 teratocarcinoma cells. Cell Differ Dev. 1990;30:109–16. doi: 10.1016/0922-3371(90)90079-c. [DOI] [PubMed] [Google Scholar]
- 28.Nanni L, Ming JE, Du Y, Hall RK, Aldred M, Bankier A, Muenke M. SHH mutation is associated with solitary median maxillary central incisor: a study of 13 patients and review of the literature. Am J Med Genet. 2001;102:1–10. doi: 10.1002/1096-8628(20010722)102:1<1::aid-ajmg1336>3.0.co;2-u. [DOI] [PubMed] [Google Scholar]
- 29.Eberhart JK, Swartz ME, Crump JG, Kimmel CB. Early Hedgehog signaling from neural to oral epithelium organizes anterior craniofacial development. Development. 2006;133:1069–77. doi: 10.1242/dev.02281. [DOI] [PubMed] [Google Scholar]
- 30.Bijlsma MF, Damhofer H, Roelink H. Hedgehog-stimulated chemotaxis is mediated by smoothened located outside the primary cilium. Sci Signal. 2012;5 doi: 10.1126/scisignal.2002798. ra60. [DOI] [PMC free article] [PubMed] [Google Scholar]