Abstract
Significant heterogeneities in gene expression among individual cells are typically interrogated using single whole cell approaches. However, tissues that have highly interconnected processes, such as in the brain, present unique challenges. Single-nucleus RNA sequencing (SNS) has emerged as an alternative method of assessing a cell’s transcriptome through the use of isolated nuclei. However, studies directly comparing expression data between nuclei and whole cells are lacking. Here, we have characterized nuclear and whole cell transcriptomes in mouse single neurons and provided a normalization strategy to reduce method-specific differences related to the length of genic regions. We confirmed a high concordance between nuclear and whole cell transcriptomes in the expression of cell type and metabolic modeling markers, but less so for a subset of genes associated with mitochondrial respiration. Therefore, our results indicate that single-nucleus transcriptome sequencing provides an effective means to profile cell type expression dynamics in previously inaccessible tissues.
Introduction
Single-cell gene expression profiling can reveal unique cell types and states co-existing within a tissue1–3, where individual transcriptomes may be influenced not only by their cellular identity, but also their intercellular connectivity4 and possibly unique genomic content5–8. However, the need for viable intact single cells can pose a major hurdle for solid tissues and organs, and will preclude the use of postmortem human repositories. Genomic studies have circumvented this issue through use of isolated nuclei5, 7–9, thereby opening the door for development of a highly scalable SNS pipeline10. However, while nuclear transcriptomes can be representative of the whole cell10–14, differences in type and proportion of RNA between the cytosol and nucleus do exist15, 16, and have not been thoroughly examined. To address the potential differences in transcriptomic profiles from nuclear and matched whole cell RNA, we have generated RNA sequencing data from single neuronal nuclei isolated from the adult mouse somatosensory (S1) cortex for a direct comparison with data sets previously generated on S1 whole cells2, and provided a foundation for analyzing and interpreting SNS data.
Results
Single nuclei from frozen S1 cortex were isolated, flow sorted for neuronal nuclear antigen (NeuN) and processed for RNA-sequencing using a modified smart-seq protocol on the Fluidigm C1 system10 (Fig. 1a). Overall, nuclear and cellular data (Supplementary Table S1) showed similar numbers and types of genes detected (S1 nuclei - mean 5619 genes; S1 cells - mean 4797 genes; hippocampal CA1 cells - mean 6402 genes; Fig. 1b, Supplementary Fig. S1). ERCC spike-in RNA transcripts17 further confirmed high technical consistency (S1 nuclei - mean Pearson r = 0.86; S1 cells – mean r = 0.84; CA1 cells – mean r – 0.87; Fig. 1b, Supplementary Fig. S1). However, nuclear data sets showed a high proportion of reads mapping to intron regions (Fig. 1b), consistent with expected nascent transcripts present in the nucleus18. To ensure consistency between the different methodologies used to generate nuclear and cellular data, gene expression estimates were based on all genomic reads, including reads mapping to introns which have been found to accurately predict gene expression levels10, 19. Furthermore, inclusion of intronic reads ensured comparable read depth for nuclear data having low exon coverage (Fig. 1b).
Figure 1.
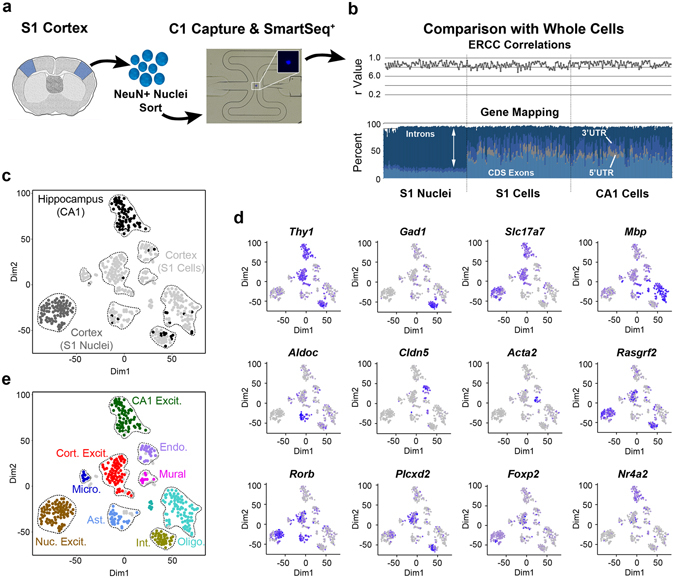
SNS reveals excitatory neuron identity. (a) Overview of the SNS pipeline. S1 mouse cortex was dissociated to single nuclei for NeuN+ and DAPI+ sorting and capture on C1 chips for modified SmartSeq (SmartSeq+) reactions. Inset shows DAPI positive nuclei in the C1 capture site. (b) Comparison of nuclear data sets with 100 random single S1 cortical or CA1 hippocampal data sets2. Top panel: Pearson correlation (r) coefficients for comparison of ERCC TPM values with their input quantities. Bottom panel: proportion of genomic reads mapping to coding sequences (CDS Exons), introns, or untranslated regions (3′ or 5′ UTRs). (c) t-SNE plots showing cluster distribution of hippocampal CA1, cortical S1 cells and cortical S1 nuclei. (d) t-SNE plots as in (c) showing positive expression levels (low – gray; high – blue) of cell type marker genes for oligodendrocytes (Mbp), astrocytes (Aldoc), endothelial cells (Cldn5), mural cells (Acta2), neurons (Thy1), inhibitory neurons (Gad1), excitatory neurons (Slc17a7), and excitatory neuron subtypes Rasgrf2 (layer 2–3), Rorb (layer 4), Plcxd2 (layer 5), FoxP2 (layer 6) and Nr4a2 (layer 6b)2, 29. (e) t-SNE plots showing expected identity of cluster groupings based on markers in (d) (Table S1, ambiguous data sets defined in Methods are shown in gray).
To identify cellular identity, nuclear data sets were combined with randomly selected whole cell S1 cortical and CA1 hippocampal data sets2 for principal component analysis, dimension reduction through t-Distributed Stochastic Neighbor Embedding (t-SNE) and density clustering1 (Fig. 1c–e, Supplementary Fig. S1). Cellular clusters showed unique marker gene expression (Fig. 1d) that permitted cell-type classification2 (Fig. 1e). Neuronal nuclei, having low expression of the pan-neuronal marker Thy1 (Fig. 1d) and clustering separately from cellular data (Fig. 1e), could still be classified as S1 cortical excitatory neurons based on expression of the excitatory neuronal marker Slc17a7 and markers associated with upper layer cortical projection or granule neurons (Fig. 1d). The absence of inhibitory neuron data sets expressing Gad1 from our NeuN sorted nuclei (Fig. 1d) likely reflects their expected lower abundance compared to excitatory neurons10 and their smaller nuclear size that may have been captured in limited fashion on the C1. In support of this presumption, nuclear expression of cell type-enriched genes2 (Supplementary Table S2) was consistent with S1 excitatory neurons, and not with other neuronal or non-neuronal cell types (Fig. 2a,b, Supplementary Fig. S2). Furthermore, the identified clusters were distinguished by biologically relevant genes, but not technical variability (Supplementary Fig. S1). Therefore, our results indicate that SNS accurately captures cellular identity.
Figure 2.
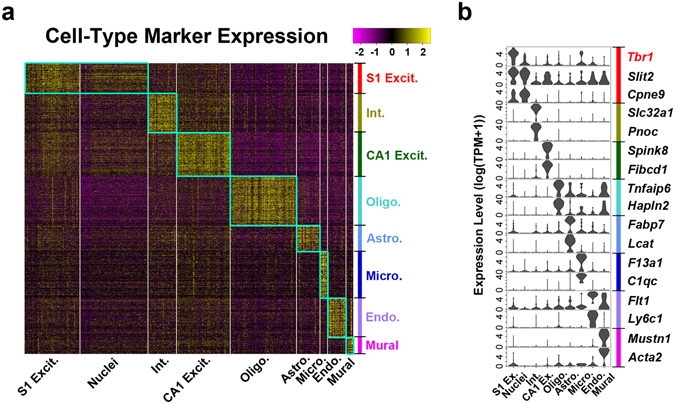
Nuclear transcriptomes accurately predict cell type. (a) Expression heatmap for cell type marker gene sets (colored bar) across all nuclear and cellular clusters (Fig. 1e). (b) Violin plots showing expression of select cell type marker genes across clusters.
To confirm that the single-nucleus data provides effective means to analyze cellular diversity, we have analyzed transcriptional heterogeneity within the measured nuclei, comparing it to the heterogeneity observed within the matched whole-cell measurements of the S1 excitatory neurons. Applying the PAGODA method20, we find statistically significant signatures distinguished within both nuclei and whole-cell measurements (Fig. 3a,e). The most prominent subpopulation within both measurements is driven by a large panel of synapse-associated genes, including Lrrtm4 and Gpc6 (Fig. 3b,f), and distinguishes neurons from layers 2–3 (Rasgrf +) from the neurons originating from other layers, such as Rorb + layer 4–5, or Foxp2 +/Syt6 + layer 6 neurons2, all of which are observed within both the measured nuclei and whole-cell populations, albeit at different proportions (Fig. 3c,g). Furthermore, these subpopulations show more distinct separation in nuclear data (Fig. 3d,h), which may underlie more defined type-specific expression observed from nuclear data compared with that of whole cells (Fig. 2a, Supplementary Fig. S2). Therefore, nuclear data accurately predicts cellular identity and provides an effective means for further subtype resolution.
Figure 3.
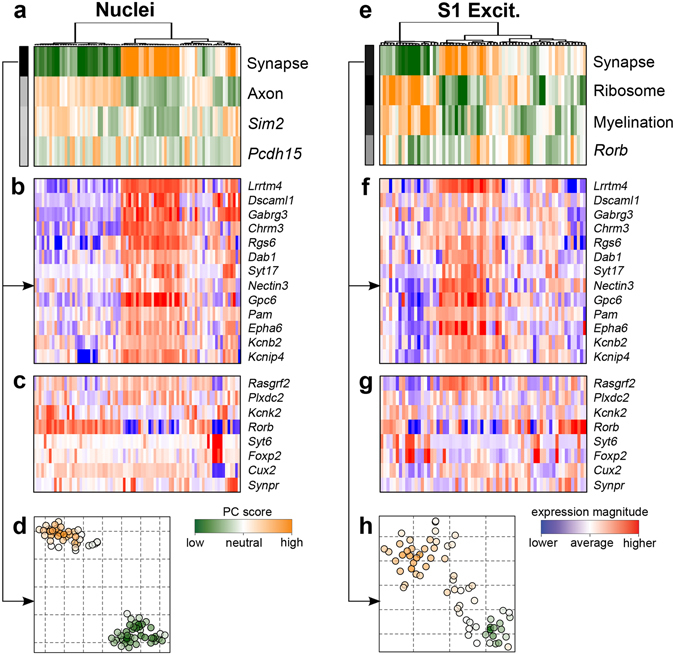
Transcriptional heterogeneity within the measured nuclei and corresponding whole-cell subpopulations. (a) Top four statistically significant aspects of heterogeneity (rows) are shown for the measured nuclei (columns), as identified by PAGODA20, labeled according to the key GO category or a gene driving each signature. (b) Expression patterns of genes driving the most prominent aspect, picked up by the synapse-associated GO category, are shown. (c) Expression of key marker genes defining subclasses of cortical neurons2 are shown. The synapse-distinguished neurons correspond to layer 2–3 (Rasgrf2 +) neurons. (d) A t-SNE embedding view, showing placement of the nuclei along the synapse-driven heterogeneity aspects shown in (a), which also separates two major subpopulations. (e–h) Analogous plots for an independent analysis of S1 excitatory whole cell neuron measurements. Expression of common synapse-associated (b) and marker (c) genes are shown (f and g) and t-SNE embedding (h) is driven by the synapse-associated aspect shown in (e).
However, nuclear RNA data, not surprisingly, did differ from that of whole cell RNA. For example, there was lower expression of the cortical pyramidal marker Tbr1 (Fig. 2b), which shows robust expression in cortical projection neurons and plays an important role in their specification and functionality21, 22. Further, while averaged nuclear expression values showed the highest correlation with the S1 excitatory neurons (Fig. 4a, Supplementary Fig. S3), the degree of agreement varied depending on exonic gene length, or the total length of the genic region (Fig. 4b). Overall, genes that were better detected in whole cells over nuclei tended to be shorter, such as Tbr1, while genes showing better detection in the nuclei tended to be longer (Fig. 4c, Supplementary Fig. S4). This prominent length bias likely stems from the higher contribution of intronic reads in the nuclear measurements, as nascent RNAs of longer genes often include extensive intronic regions that would commonly be removed in the mature RNAs captured in the whole cells (Fig. 1b). We therefore developed a computational model to normalize systematic biases between whole cells and nuclei that were associated with gene length (genic) and intronic fraction (Fig. 4d). While the interaction of the gene length and intronic fraction explains only 17% of the observed expression variation, controlling for such dependencies allowed us to reduce length bias below statistically significant levels (Fig. 4e–f, Supplementary Fig. S4). The bias correction also partially recovered Tbr1 expression in nuclei (Fig. 4e) and enabled more consistent overall expression of marker genes between matched nuclei and whole cells (Supplementary Fig. S4). Furthermore, application of this gene length bias correction to all data sets did not affect cell type classification (Supplementary Fig. S5). Therefore, we have developed an approach to normalize technical differences associated with differing maturity levels of transcripts detected between the nucleus and cytosol, while retaining biologically relevant gene expression dynamics.
Figure 4.
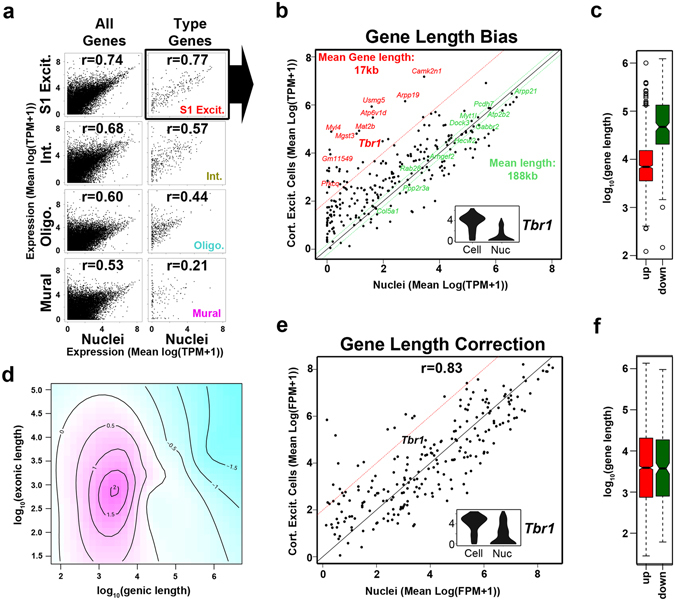
Gene length bias correction. (a) Scatter plots for nuclear and indicated cellular clusters using either all detected genes or the associated cell-type specific gene sets. Pearson correlation coefficients (r) are indicated. (b) Scatter plot indicated in (a) with genes detected higher in cells (red) or detected similarly between cells and nuclei (green) indicated. Inset is a violin plot of Tbr1 expression. (c) Boxplot illustrating significant difference in average gene length between genes detected as up or down in cells over nuclei (Supplementary Fig. S4; Student t test, p = 6.41 × 10−51; Wilcoxon test, p = 3.77 × 10−60). (d) The systematic length bias in the whole cell – nucleus comparison was captured by the generalized additive model. The plot shows the interaction of total gene length (genic) and exonic length of a gene (pink – higher M values (log2 fold expression difference between whole cells and nuclei), blue – lower M values; the levels are labeled on the contours). (e) Scatter plot as shown in (b) after gene length correction showing improved Tbr1 detection in nuclear data. (f) Boxplot on corrected expression values showing the absence of gene length bias (Supplementary Fig. S4; Student t test, p = 0.852; Wilcoxon test, p = 0.762).
Application of this approach allows for good concordance between the nuclear and whole cellular transcriptome, yet additional sources of nucleocytoplasmic differences in transcript abundance may arise from mitochondrial transcription, splicing or nuclear export rates18, or post-transcriptional regulatory mechanisms16. To better understand the transcriptomic differences relevant to biological differences, we examined genes showing differential transcript accumulation between cell-type matched nuclei and whole cells using corrected expression data (Fig. 5, Supplementary Table S3). While only a slightly higher proportion of mitochondrial RNA was detected in cellular data (Fig. 5a), the majority of differentially abundant transcripts were cellular (Fig. 5b,c) and associated with respiratory and metabolic ontologies (Supplementary Table S4). Genes with transcript accumulation in nuclear over cellular data did show some functional ontologies (Supplementary Table S5), but these annotations had significantly lower p-values compared to those of cellular respiration (Fig. 5d). This likely reflects the more exclusive detection of respiratory-related transcripts in cellular data, compared to only an enrichment of neuronal-related transcripts in nuclear data (Supplementary Fig. S6). In fact, genes that did show more exclusive detection in nuclear data (Fig. 5b) failed to show these functional annotations (Supplementary Table S5). Therefore, our data confirms a high concordance in the nuclear and whole cell transcriptomes, with the main exception of cellular respiration transcripts accumulated in the cytosol.
Figure 5.
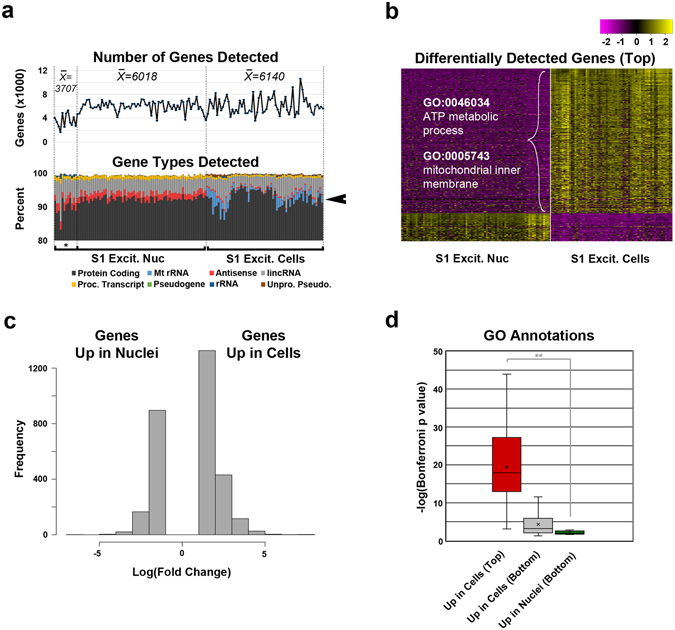
Differential transcript abundances between nuclei and whole cells. (a) Top panel: Total number of genes detected (count ≥ 4) from nuclei (*Indicates data sets generated from sorted nuclei frozen prior to C1 loading) and whole cell data sets representing S1 excitatory neurons. Lower panel: percentage of gene types detected, showing slightly more antisense transcripts detected in nuclear data and slightly more mitochondrial (Mt) rRNA detected in cellular data (arrow). (b) Heatmap of expression for top differentially detected genes (p < 1 × 10⁻²⁰) between cellular and nuclear data sets showing representative GO annotations for genes over-represented in cells. (c) Histogram showing a higher frequency of genes that were better detected in cellular compared to nuclear data sets for S1 excitatory neurons (Supplementary Table S3). (d) Box plot showing significance values for annotations of top (p < 1 × 10⁻²⁰) and bottom (p ≥ 1 × 10⁻²⁰) differentially detected genes (Biological Process and Cellular Component categories, Supplementary Tables S4–S5). Student t-test p value is indicated: **p = 0.0002.
Discussion
Significant progress in understanding tissue heterogeneity has been achieved through large scale transcriptomic studies1–3, 23, providing extensive subtype composition of complex tissues and greater insight into their concerted functionality. However, many banked specimens at repositories – such as brain or tumor tissues – are not amendable to single-cell RNA sequencing methodologies due to a requirement for intact viable single cells. Furthermore, even for tissues that can be available directly from biopsy, the stress of whole cell dissociation may itself influence the expression of certain genes24. As such, we have developed a scalable SNS pipeline that can be applied to complex and difficult to study fresh or frozen material, and that permits extensive subtype resolution10. In order to address potential limitations of nuclei, the nuclear transcriptomes of mouse cortical excitatory neurons were compared with those derived from whole cells2. While SNS on mouse brain nuclei provided more limited cell type sampling compared to whole cells, newer methodologies continue to evolve to more comprehensively profile different cell types of a tissue using their nuclear transcriptomes11. Importantly for these studies, we provide evidence for accurate prediction of subtype-defining marker gene expression by nuclear transcriptome profiling of excitatory neurons (Figs 2 and 4a), which we expect to be generally applicable to all neuronal and non-neuronal cell types, as well as the ability to effectively resolve transcriptional subpopulations within a narrowly-defined cell type, identifying excitatory neurons originating from different layers (Fig. 3).
We find that the single nucleus and whole cell transcriptomes correlate highly, yet exhibit technical differences due to the natural abundance of nascent transcripts present in nuclei18 (Fig. 4). Since comprehensive understanding of gene expression dynamics in complex tissues will likely require intersection of data sets across multiple studies and modalities, we provide a normalization strategy that can reduce technical biases arising from comparisons of nuclear and cellular data (See Methods). Transcript abundance differences retained after normalization (Fig. 5b) likely represent true biological divergences. Consistently, while normalized data showed similar cell type resolution, nuclear and cellular data from cortical excitatory neurons continued to cluster separately (Supplementary Fig. S5). This likely reflects RNA composition differences found between nuclear and cytosolic compartments that, while not directly interrogated by this study, limit integrated analyses of cellular and nuclear data. Some enrichment of cell type-specific functional transcripts was observed in nuclei, however, this might in fact underlie different proportions of layer-specific excitatory neurons in nuclear and cellular data sets (Figs 1d and 3c,g), nascent transcription associated with early responses to neuronal activities24 or slight differences persisting in nuclear versus whole cell comparisons. By contrast, there was an almost exclusive detection of mitochondrial respiration-associated transcripts in whole cell data sets (Fig. 5). This may be attributed to the post-mitotic state of neurons, as neuronal progenitors instead accumulated transcripts associated with cellular division in their nuclei12. These findings highlight the potential for cell state-dependent transcriptomic differences that may arise between nuclear and cytosolic fractions.
We have demonstrated that SNS accurately captures expression of a majority of cell-type specific and functionally relevant genes in post-mitotic cells, while showing under-representation of certain transcripts related to cellular physiology that may be more rapidly exported from the nucleus25. Interestingly, the majority of genes associated with the genome-scale metabolic reconstruction (iMM1415) were accurately predicted from nuclear RNA (Supplementary Fig. S6), demonstrating the retained potential for in silico cell-type specific metabolic modeling from nuclear transcriptomic data26, 27. Therefore, single-nucleus transcriptomic sequencing provides an effective method for characterizing functionally relevant gene expression profiles and metabolic modeling of individual cells from tissues previously precluded from single-cell analyses.
Methods
Sample Origin and Nuclei Preparation
Animal handling and tissue harvesting methods were performed in accordance with the guidelines and regulations of the local animal protection legislation and were approved by the local committee for ethical experiments on laboratory animals (Stockholms Norra Djurförsöksetiska nämnd, Sweden). Postnatal day 21 wild-type CD1 mice of both sexes were perfused with cold and oxygenated artificial cerebrospinal fluid solution. The brains were then harvested and the somatosensory cortex isolated by dissection, snap frozen and stored at −80 °C until used. Neuronal nuclei were prepared using nuclear extraction buffer for nuclei isolation, stained with the neuronal nuclear antigen marker NeuN and flow sorted using single cell purity mode on a Beckman Coulter MoFlo Astrios EQ as described previously10.
Nuclei Loading, RNA-Seq Library Preparation and Sequencing
For use on the Fluidigm C1 Single-Cell Auto Prep Array for mRNA Seq (Fluidigm, Cat# 100–5761), nuclei were either used directly after sorting or thawed rapidly from a DMSO frozen stock stored at −80 °C. Nuclei were loaded at ~120 nuclei/µl (5–10 µm capture sites, small chip) and RNA-seq libraries generated using a modified SmartSeq protocol containing both a supplemental random primer and PolydIdC as described previously10. For single nucleus libraries, 5 µL of cDNA were transferred to 96-well plates (Biorad, Cat# 9601) and normalized to 0.2 ng/µL in water using the EpiMotion (Eppendorf) liquid handling robot. Sequencing library preparation was performed as per the Fluidigm protocol. Libraries were subsequently sequenced on a HiSeq 2500 instrument (Illumina), using 50 bp single-end sequencing with dual index reads (2 × 8 bp). Raw sequence Fastq files were generated after sequencing runs using the BaseSpace Fastq generation algorithm (Illumina).
RNA-seq data processing and analyses
Cellular data sets associated with the S1 cortex or CA1 hippocampus (Supplementary Table S1) were randomly selected for download from the GEO database. Single cell or nuclear reads were aligned to the mouse reference genome (GRCm38) using STAR (2.3.0) and assembled and quantified by HTSeq (v0.6.1) using Gencode vM8 annotations. ERCC spike-ins were mapped and quantified at the same time. Gene counts were converted to transcripts per million mapped reads (TPM) and log(TPM+1) was calculated. For ERCC TPM, calculations were based on ERCC counts only. Cells or nuclei with fewer than 1000 genes showing log(TPM + 1) of at least 1 were excluded. Genes that were expressed in less than 3 cells were excluded. Identification of cell type clusters, violin plots, scatter plots, and differential expression analysis were performed using Seurat software1 in R (code and data available at: genome-tech.ucsd.edu/public/sNucSeqNorm). To identify cell types, principal component analysis (PCA) was first performed on variable genes identified across single nucleus/cell data sets, then expanded to include all genes through PCA projection. tSNE and spectral density clustering (Seurat version 1.2) was used define clusters, with distance metrics based on the first 10 principal components determined to have significant p values based on a jack straw method. Outlier cells that failed to cluster (n = 12) or were considered to ambiguously cluster, having previously ascribed annotations2 that were contrary to the current cluster’s identity (n = 36; mostly oligodendrocytes, see Supplementary Table S1) and which showed marker gene expression associated with more than one cell type (Fig. 1d), were removed as a precautionary measure to exclude potential multiplets that were subsequently found to exist in this data set and which had these attributes20. Differentially detected genes between S1 excitatory cells and nuclei were identified using the “FindAllMarkers” function (Seurat version 1.4), using the t-test method and detection thresholds of log-fold change greater than 1.0 and p value less than 0.01. Heatmap for cell or nuclear predicted expression was generated for genes having p values less than 1 × 10⁻²⁰. GO analyses were performed using the ToppFun function of the ToppGene suite (toppgene.cchmc.org) using default settings and with significance cutoff set at a Bonferroni adjusted p value of 0.05 and a maximum of 50 annotations per category.
Gene Length Bias Correction
To correct for length bias in comparisons of nuclei and whole-cell measurements, the nuclear gene expression levels were generated using featureCount28 (FPM values) and were normalized by the expected expression magnitude, as estimated by a generalized additive model. Both HTSeq and featureCount methods for gene counting were tested and featureCount was selected based on the highest r correlation value of normalized nuclear and cellular data (r = 0.83 versus r = 0.82). The generalized additive model was built using mgcv R package, using smoothed term to model interaction of the total genic length and exonic length for each gene (on log10 scale), using Gaussian distribution with identity link: gam(M ~ s(t, e), family = gaussian(link = identity) where M is the log2 fold expression ratio between the nuclei and the whole-cell estimates, t is the total (genic) gene length, and e is the exonic gene length. Software and associated data are available at: genome-tech.ucsd.edu/public/sNucSeqNorm.
Electronic supplementary material
Acknowledgements
Flow cytometry was performed at TSRI Flow Cytometry Core. Sequence data for the whole cell data sets were obtained from the Gene Expression Omnibus (www.ncbi.nlm.nih.gov/geo), accession code GSE60361. Gene count data and software used for correction of gene length bias associated with nuclear RNA is available at genome-tech.ucsd.edu/public/sNucSeqNorm. Funding support for KZ and JC was from the NIH Common Fund Single Cell Analysis Program (1U01MH098977). PVK was supported by NIH 1R01HL131768.
Author Contributions
B.B.L., S.C., Y.C.Y., J.C., S.L., and K.Z. conceived of the study. S.C. prepared mouse cortical samples. Y.C.Y. isolated and sorted nuclei. B.B.L. ran nuclei on the C1. B.B.L. and D.G. prepared libraries for sequencing. P.V.K. developed the model for gene length bias correction. B.B.L. analyzed the data, assembled figures and prepared the manuscript. S.C., Y.C.Y. and P.V.K. prepared supplementary methods. All authors discussed the results and implications at all stages and edited the manuscript.
Competing Interests
The authors declare that they have no competing interests.
Footnotes
Blue B. Lake, Simone Codeluppi and Yun C. Yung contributed equally to this work.
Electronic supplementary material
Supplementary information accompanies this paper at doi:10.1038/s41598-017-04426-w
Publisher's note: Springer Nature remains neutral with regard to jurisdictional claims in published maps and institutional affiliations.
Contributor Information
Peter V. Kharchenko, Email: peter.kharchenko@post.harvard.edu
Sten Linnarsson, Email: Sten.Linnarsson@ki.se.
Kun Zhang, Email: kzhang@bioeng.ucsd.edu.
References
- 1.Macosko EZ, et al. Highly Parallel Genome-wide Expression Profiling of Individual Cells Using Nanoliter Droplets. Cell. 2015;161:1202–1214. doi: 10.1016/j.cell.2015.05.002. [DOI] [PMC free article] [PubMed] [Google Scholar]
- 2.Zeisel A, et al. Brain structure. Cell types in the mouse cortex and hippocampus revealed by single-cell RNA-seq. Science. 2015;347:1138–1142. doi: 10.1126/science.aaa1934. [DOI] [PubMed] [Google Scholar]
- 3.Pollen AA, et al. Low-coverage single-cell mRNA sequencing reveals cellular heterogeneity and activated signaling pathways in developing cerebral cortex. Nat Biotechnol. 2014;32:1053–1058. doi: 10.1038/nbt.2967. [DOI] [PMC free article] [PubMed] [Google Scholar]
- 4.Fuzik J, et al. Integration of electrophysiological recordings with single-cell RNA-seq data identifies neuronal subtypes. Nat Biotechnol. 2016;34:175–183. doi: 10.1038/nbt.3443. [DOI] [PMC free article] [PubMed] [Google Scholar]
- 5.Gole J, et al. Massively parallel polymerase cloning and genome sequencing of single cells using nanoliter microwells. Nat Biotechnol. 2013;31:1126–1132. doi: 10.1038/nbt.2720. [DOI] [PMC free article] [PubMed] [Google Scholar]
- 6.Lodato MA, et al. Somatic mutation in single human neurons tracks developmental and transcriptional history. Science. 2015;350:94–98. doi: 10.1126/science.aab1785. [DOI] [PMC free article] [PubMed] [Google Scholar]
- 7.Rehen SK, et al. Constitutional aneuploidy in the normal human brain. J Neurosci. 2005;25:2176–2180. doi: 10.1523/JNEUROSCI.4560-04.2005. [DOI] [PMC free article] [PubMed] [Google Scholar]
- 8.Westra JW, et al. Neuronal DNA content variation (DCV) with regional and individual differences in the human brain. J Comp Neurol. 2010;518:3981–4000. doi: 10.1002/cne.22436. [DOI] [PMC free article] [PubMed] [Google Scholar]
- 9.Bushman, D. M. et al. Genomic mosaicism with increased amyloid precursor protein (APP) gene copy number in single neurons from sporadic Alzheimer’s disease brains. Elife4 (2015). [DOI] [PMC free article] [PubMed]
- 10.Lake BB, et al. Neuronal subtypes and diversity revealed by single-nucleus RNA sequencing of the human brain. Science. 2016;352:1586–1590. doi: 10.1126/science.aaf1204. [DOI] [PMC free article] [PubMed] [Google Scholar]
- 11.Habib N, et al. Div-Seq: Single-nucleus RNA-Seq reveals dynamics of rare adult newborn neurons. Science. 2016;353:925–928. doi: 10.1126/science.aad7038. [DOI] [PMC free article] [PubMed] [Google Scholar]
- 12.Grindberg RV, et al. RNA-sequencing from single nuclei. Proc Natl Acad Sci USA. 2013;110:19802–19807. doi: 10.1073/pnas.1319700110. [DOI] [PMC free article] [PubMed] [Google Scholar]
- 13.Krishnaswami SR, et al. Using single nuclei for RNA-seq to capture the transcriptome of postmortem neurons. Nat Protoc. 2016;11:499–524. doi: 10.1038/nprot.2016.015. [DOI] [PMC free article] [PubMed] [Google Scholar]
- 14.Zeng, W. et al. Single-nucleus RNA-seq of differentiating human myoblasts reveals the extent of fate heterogeneity. Nucleic Acids Res (2016). [DOI] [PMC free article] [PubMed]
- 15.Barthelson RA, Lambert GM, Vanier C, Lynch RM, Galbraith DW. Comparison of the contributions of the nuclear and cytoplasmic compartments to global gene expression in human cells. BMC Genomics. 2007;8:340. doi: 10.1186/1471-2164-8-340. [DOI] [PMC free article] [PubMed] [Google Scholar]
- 16.Bahar Halpern K, et al. Nuclear Retention of mRNA in Mammalian Tissues. Cell Rep. 2015;13:2653–2662. doi: 10.1016/j.celrep.2015.11.036. [DOI] [PMC free article] [PubMed] [Google Scholar]
- 17.Baker SC, et al. The External RNA Controls Consortium: a progress report. Nat Methods. 2005;2:731–734. doi: 10.1038/nmeth1005-731. [DOI] [PubMed] [Google Scholar]
- 18.Ameur A, et al. Total RNA sequencing reveals nascent transcription and widespread co-transcriptional splicing in the human brain. Nat Struct Mol Biol. 2011;18:1435–1440. doi: 10.1038/nsmb.2143. [DOI] [PubMed] [Google Scholar]
- 19.Gaidatzis D, Burger L, Florescu M, Stadler MB. Analysis of intronic and exonic reads in RNA-seq data characterizes transcriptional and post-transcriptional regulation. Nat Biotechnol. 2015;33:722–729. doi: 10.1038/nbt.3269. [DOI] [PubMed] [Google Scholar]
- 20.Fan J, et al. Characterizing transcriptional heterogeneity through pathway and gene set overdispersion analysis. Nat Methods. 2016;13:241–244. doi: 10.1038/nmeth.3734. [DOI] [PMC free article] [PubMed] [Google Scholar]
- 21.Bulfone A, et al. T-brain-1: a homolog of Brachyury whose expression defines molecularly distinct domains within the cerebral cortex. Neuron. 1995;15:63–78. doi: 10.1016/0896-6273(95)90065-9. [DOI] [PubMed] [Google Scholar]
- 22.Hevner RF, et al. Tbr1 regulates differentiation of the preplate and layer 6. Neuron. 2001;29:353–366. doi: 10.1016/S0896-6273(01)00211-2. [DOI] [PubMed] [Google Scholar]
- 23.Tasic B, et al. Adult mouse cortical cell taxonomy revealed by single cell transcriptomics. Nat Neurosci. 2016;19:335–346. doi: 10.1038/nn.4216. [DOI] [PMC free article] [PubMed] [Google Scholar]
- 24.Lacar B, et al. Nuclear RNA-seq of single neurons reveals molecular signatures of activation. Nat Commun. 2016;7:11022. doi: 10.1038/ncomms11022. [DOI] [PMC free article] [PubMed] [Google Scholar]
- 25.Wickramasinghe VO, et al. Selective nuclear export of specific classes of mRNA from mammalian nuclei is promoted by GANP. Nucleic Acids Res. 2014;42:5059–5071. doi: 10.1093/nar/gku095. [DOI] [PMC free article] [PubMed] [Google Scholar]
- 26.Duarte NC, et al. Global reconstruction of the human metabolic network based on genomic and bibliomic data. Proc Natl Acad Sci USA. 2007;104:1777–1782. doi: 10.1073/pnas.0610772104. [DOI] [PMC free article] [PubMed] [Google Scholar]
- 27.Sigurdsson MI, Jamshidi N, Steingrimsson E, Thiele I, Palsson BO. A detailed genome-wide reconstruction of mouse metabolism based on human Recon 1. BMC Syst Biol. 2010;4:140. doi: 10.1186/1752-0509-4-140. [DOI] [PMC free article] [PubMed] [Google Scholar]
- 28.Liao Y, Smyth GK, Shi W. The Subread aligner: fast, accurate and scalable read mapping by seed-and-vote. Nucleic Acids Res. 2013;41:e108–e108. doi: 10.1093/nar/gkt214. [DOI] [PMC free article] [PubMed] [Google Scholar]
- 29.Zeng H, et al. Large-scale cellular-resolution gene profiling in human neocortex reveals species-specific molecular signatures. Cell. 2012;149:483–496. doi: 10.1016/j.cell.2012.02.052. [DOI] [PMC free article] [PubMed] [Google Scholar]
Associated Data
This section collects any data citations, data availability statements, or supplementary materials included in this article.


