Abstract
High data volumes produced by state-of-the-art optical microscopes encumber research. Taking advantage of the laminar structure of many biological specimens we developed a method that reduces data size and processing time by orders of magnitude, while disentangling signal. The Image Surface Analysis Environment that we implemented automatically constructs an atlas of 2D images for arbitrary shaped, dynamic, and possibly multi-layered “Surfaces of Interest”. Built-in correction for cartographic distortion assures no information on the surface is lost, making it suitable for quantitative analysis. We demonstrate our approach by application to 4D imaging of the D. melanogaster embryo and D. rerio beating heart.
Advances in microscopy keep increasing data acquisition rates and have enabled the study of multi-scale dynamic problems such as following cells across entire embryos or distribution of molecules across the cell membrane1–4. However, increased data size makes storage, processing and transfer difficult and expensive. For light sheet microscopy in particular, this is broadly acknowledged as the bottleneck to mainstream adaptation5. The data problem is most severe when specimen structure does not align with the microscope, so that only a small fraction of the recorded region of interest contains desired information. This is a common situation, as biological samples often have laminar structure, consisting of one or multiple curved and possibly closed surfaces6,7. In this case analysis of multi-scale images also poses conceptual problems: even where it is computationally feasible to process data in three dimensions, such as large scale nuclear tracking8, interpretation in orthographic projections or cross-sections is challenging. By describing the data in Cartesian coordinates one cannot disentangle different layers or sides of a single layer in a straightforward way.
Here we present a solution to these problems by taking into account the structure of the specimen, rather than force the lab frame of reference. Instead of a Region Of Interest, for layered specimen it is natural to consider a Surface Of Interest (SOI), and move into the tissue frame by organizing the data in terms of coordinates on the surface. This effectively reduces the dimension of the data from three to two and is directly analogous to making maps of earth, where geographic data is shown on a flat grid of longitude and latitude. Previous approaches realized the benefit of dimensional reduction for bio image data processing, sometimes referring to it as unrolling1,9,10. However, these were tailored to specific tissues and effectively lost information by neglecting to deal with two central issues in cartography. First, mapping curved surfaces to the plane inevitably involves some form of geometric distortion, which prevents one from using the conventional ways of measuring geometric quantities such as size, shape, direction and velocity in the maps. Second, to put together a global picture of the surface, one has to be able to seamlessly navigate across map edges11. The limited scope and cartographic shortcomings of previous approaches prevent dimensional reduction from becoming a standard for handling large data.
We introduce a conceptual framework for tissue cartography as a compression method for arbitrarily shaped Surfaces Of Interest and overcome current limitations using established mathematics. By implementing our framework in an open source MATLAB toolbox for tissue cartography called ImSAnE (Image Surface Analysis Environment), we created a practical tool for data reduction and analysis of layered tissues. ImSAnE maps surfaces of interest to the plane, stores geometric metadata required for faithful measurements, and builds an atlas containing multiple overlapping maps to create a global picture. We demonstrate the power of our method and benchmark performance using SPIM recordings of a gastrulating fruit fly embryo and beating zebrafish heart. Finally, we show that our method removes out of surface clutter and can be applied to other microscopy data.
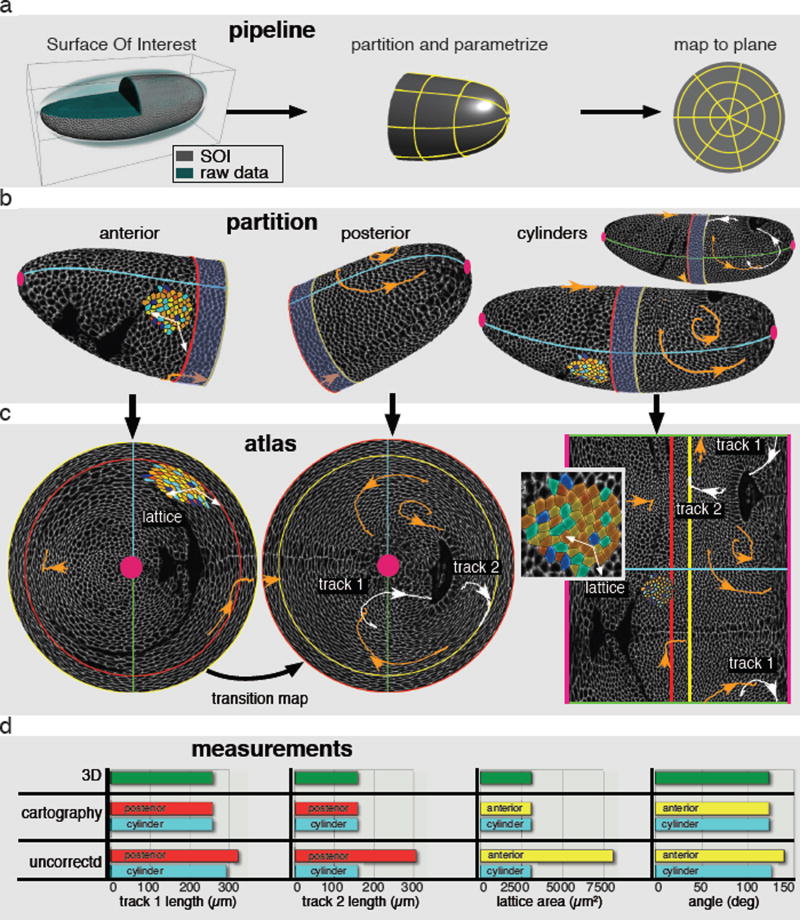
Before considering the general case, we explored the large class of tissues whose shape, like earth, can be projected onto a cylinder and which we will refer to as cucurboids. We use the fruit fly embryo to explain the method because it provides the additional simplification of a static shape, with much of the tissue moving along the surface of the egg during early gastrulation. As shown in Fig 1a, reducing data size by restricting to a SOI comes down to creating a mask. But different from a ROI, such a mask should contain only pixels lying on a smooth surface through the raw data, generally making the SOI data many orders of magnitude smaller. A smooth SOI was created for cucurboids by fitting a small number of interpretable shape parameters (SI). One could keep only pixels in the mask and analyze using 3D methods. However, the difficulties in processing and interpreting 3D data are readily solved by cartography, which refines this idea by storing the surface pixels in directly interpretable 2D images. These images are produced by assigning coordinates to the surface and then interpolating the data at the 3D positions corresponding to a regular grid of 2D surface coordinates (Fig 1a). Surface coordinates - also known as a parameterization - were tailored to the embryo and other cucurboids by generalizing familiar map projections of earth (SI).
Fig. 1. Tissue cartography on Drosophila melanogaster embryo undergoing gastrulation.
(a) The pipeline from left to right: identification of a SOI (grey) in the raw data (cyan), followed by partitioning into overlapping regions and parameterization (yellow lines). Finally, the image data is mapped to the parameter plane. (b) Partition of the apical embryo surface in anterior, posterior and cylinder regions. Solid lines represent region boundaries. Red: posterior, yellow: anterior, cyan and green: cuts in cylinder regions, pink: poles. Blue shaded domain indicates overlap of anterior and posterior regions. Membrane labeled surface data of one time point is shown in grey scale. Cell trajectories in orange and white. Also shown is a representative patch of segmented cells color-coded for coordination number with white vectors highlighting two edges. (c) Atlas of the embryo, showing anterior, posterior and cylinder maps from left to right. Color code as above. Inset shows close up of segmented cell patch in cylinder map. (d) Comparison of 3D to cartographic and uncorrected 2D measurements. Color code corresponds to region boundary as in (b). From left to right: Length of track 1 and 2 measured in the posterior hemi-embryo and cylinder region. Area of lattice and angle between highlighted vectors measured in anterior hemi-embryo and cylinder region.
Mapping closed surfaces to the plane introduces artificial edges that lead to problems with segmentation and tracking. Cartographic distortion further impairs automated image segmentation, which typically relies on directional and scale information. Although it is well known these problems are inevitable in flattening curved surfaces (review in SI), the type of distortion and the position of the cuts depend on the parameterization. The solution is to create an atlas that breaks the surface down into a number of overlapping regions with different coordinate systems. In Fig. 1b the surface is broken into overlapping posterior and anterior regions covering the poles and two cylinder regions covering the entire surface except for diametrically opposite lateral cuts between the poles. The polar regions are parameterized by angle and distance from the pole while the cylinders are parameterized by angle and position along the anterior-posterior axis. Similar to the distortion near the north and south poles in familiar Mercator projections of earth, the cylinder in Fig. 1c is heavily distorted near the anterior and posterior poles of the embryo, and has edges corresponding to the poles and a lateral cut. The anterior and posterior maps in Fig. 1c, on the other hand, show the poles with very low distortion (quantified in SI Fig. 2). Where parameterizations overlap, points on the surface will have two different sets of coordinate values, from which the transition map between the coordinates can be automatically constructed, effectively stitching the maps together. This way, the atlas provides a global picture in which each position on the surface is captured away from edges and at low distortion.
While introducing multiples maps reduces distortion enough to automate image segmentation using conventional Euclidean methods, quantitative measurements would require an impractical number of maps. Fortunately one can make faithful measurements by storing geometric metadata containing the relation between surface coordinates and 3D position (SI). ImSAnE implements general cartographic measurements for the first time. Figure 1d shows perfect agreement between 2D cartographic and direct 3D measurements of area, length and angle. In contrast, uncorrected 2D measurements show large error depending on the local distortion of the map.
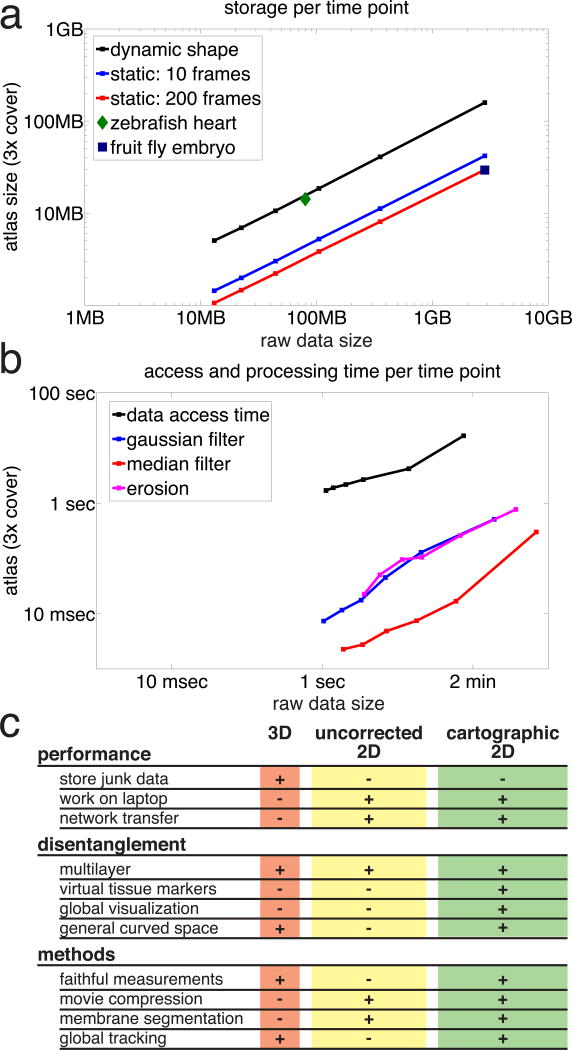
To evaluate the performance gained from our approach, we repeated atlas construction for the fly embryo data at different sub-samplings. We then benchmarked data size, loading time and performance at elementary image analysis operations. The data reduction (Fig 2a) and processing time (Fig 2b) for large data follow a two-thirds power-law that can be explained by linear scaling of many operations with the number of pixels. This dramatically improves relative gain as data size increases. Even for relatively small data sets, one gains an order of magnitude, while for typical SPIM datasets one gains three orders of magnitude (Fig 2ab). After an initial step of atlas construction on a powerful computer, bottlenecks in storage and network transfer are therefore resolved and data can be shared and analyzed on a laptop. Fig 2c compares features of our method to existing 3D and 2D approaches.
Fig. 2. Performance gain from tissue cartography.
(a) Storage per time point in atlas versus raw data. Atlas normalized by number of surface coverings. Color codes for time dependence. Black: dynamic shapes require storage of atlas and geometric metadata for each time point; blue: static shapes with 10 time points only require storage of geometric metadata once, reducing the average storage per time point; red: as blue for 200 time points, further reducing average storage. Blue Square indicates average storage for the embryo data from Fig 1, green diamond for heart data from Fig 3. (b) Access and processing times for atlas and raw data in (a). Black: time required to load the data. Colors: typical processing times. Blue: Gaussian filter, magenta: erosion, red: theoretical data transfer at 5 MB/s of dynamic surface from (a). (c) Feature table of 3D, uncorrected 2D, and cartographic projections, comparing performance in routine tasks, data disentanglement, and feasibility of data post-processing methods.
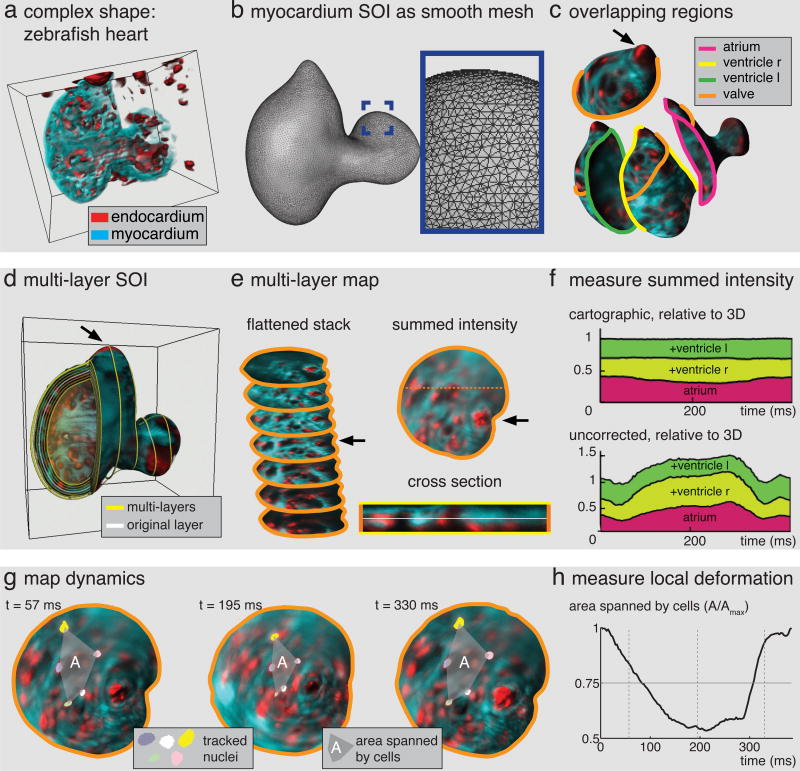
In general analogies to earth don’t hold. We therefore extended our method to surfaces of arbitrary shape. We also made it possible to foliate a tissue in a ‘stack’ of nested SOIs, which is vital for many applications such as apical basal organization and quantitative intensity measurements. To demonstrate this generalization we use a zebrafish heart (Fig 3a). Taking advantage of standard methods from computer graphics we first produce a smooth triangle mesh, representing the surface without shape assumptions (Fig 3b, SI Fig 4). To build an atlas for a general SOI in ImSAnE we then divide the surface into user defined or automatically generated overlapping regions, as shown in Fig 3c. Next, surface coordinates are generated automatically using conformal parameterization, which preserves shape (but not size, SI text, SI Fig 6) and has the rare property that it can be constructed for arbitrary surface regions in a computationally efficient way. Mapping surface data and making transition maps then proceeds as before. To create a multi-layer SOI we move the defining surface along the normal direction (Fig 3d). Surface coordinates are carried between layers along the surface normal, effectively generating a stack of maps, as shown in Figure 3e together with a summed intensity projection. In the cross section one can see the myocardium lying on top of the endocardium, flattened by the mapping.
Fig. 3. Tissue cartography for a complex dynamic surface.
(a) Zebrafish heart, red: endocardium, cyan: myocardium. (b) Smooth triangulation of myocardium Surface Of Interest. Inset shows zoom into highlighted region on atrium. (c) Overlapping regions on SOI, solid lines indicate region boundaries. For clarity, only the orange boundary is shown on the other regions. Arrow indicates valve. (d) Multi-layer SOI for zebrafish heart in (a), yellow lines indicate layers. White layer highlights surface in (b). (e) Conformal maps from orange region to plane for multiple layers arranged in flattened stack. Summed intensity projection on right with position of cross section below indicated by dashed line. In cross section, layer in (c) is highlighted in white. (f) Cartographic intensity measurements from different layers and regions add up faithfully for all times. Top: total intensity of regions in (c) for all layers, excluding overlap, normalized by 3D summed intensity within surface mask. Bottom: uncorrected summed intensity shows large error. Colors match region colors in (b). (g) Maps vary smoothly with time. Three time points show a group of tracked nuclei connected by a dashed line. (h) Area enclosed by tracked cells over time, normalized by maximum.
Consistency of the approach requires that we can make global measurements by adding up measurements from individual layers and different maps in the atlas. To test this we compared the summed intensity in the non-overlapping parts of the atlas to the total intensity in the 3D mask around the SOI and found near perfect agreement (Fig 3f). Agreement is also found for other observables, and perhaps surprisingly, even the volume of the heart can be measured in two-dimensions (SI).
Tissue shape can change dramatically with time. Observation of local dynamics on the surface, such as nuclear movement requires temporal continuity of maps. To this end we constrained the parameterization at each time to resemble the previous time and tested the result by using an automated tracking method to faithfully follow a group of cells shown in Fig 3g. We were able to use the nuclear trajectories as landmarks for quantifying local changes in shape and size (Fig 3h), which is important for understanding tissue mechanics.
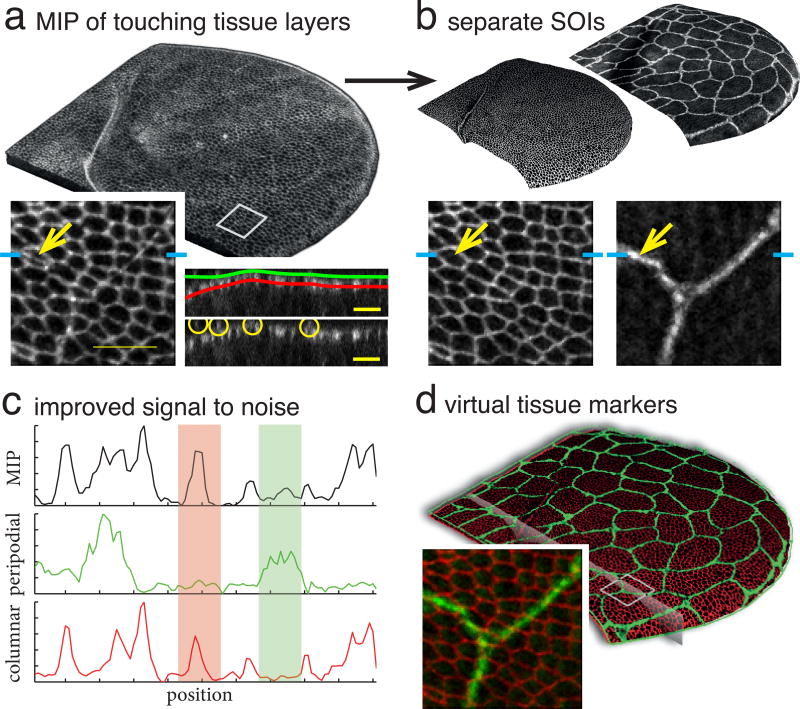
A SOI acts as an effective filter by isolating data lying on a smooth surface and disposing of unwanted information elsewhere. Therefore, we suspected that it can improve image quality in data that would otherwise not seem to benefit from our approach because it is not prohibitively large or the specimen is close to flat. To confirm this we recorded an E-cadherin labeled Drosophila pupal wing, which consists of a layer of columnar cells covered by a layer of large squamous cells (Fig 4). The membrane signal from the two tissue layers, which is otherwise hard to separate (Fig 4a), is cleanly partitioned by making a SOI for each (Fig 4b). Signal improvement is highlighted for a cross section in Fig 4c. By mapping the signal from the different SOI back to 3D in different colors, we create virtual tissue markers (Fig 4d). In SI Fig. 3 we show improvement for a scanning confocal recording of a Drosophila wing disc (SI Fig. 3ab) and a widefield recording of the Drosophila notum (SI Fig. 3cd).
Fig. 4. Data improvement and virtual tissue markers from SOIs.
(a) Maximum intensity projection of membrane labeled D. melanogaster pupal wing. Note difficulty in distinguishing two tissue layers. Left inset: detail with arrow indicating peripodial membrane. Right insets: cross section through data close to the fold with SOIs superimposed on top and yellow circles innoisdicating peripodial membrane on bottom. (b) Separated SOIs showing same inset region as (a). (c) Intensity profiles of cross section through inset regions in (ab) at position indicated by cyan ticks shows disentanglement of signal from different layers. Red and green highlights respectively show MIP signal contributions from columnar and peripodial layers. (d) Recombining separated signal in different colors creates Virtual Tissue Markers. 3D rendering of both layers, plane indicates cross section used for (c).
We have presented a method for efficiently handling large bio image data sets containing laminar specimen by reducing a dynamic Surface Of Interest of arbitrary shape to an atlas of two-dimensional images. No measurement error is introduced by this reduction, enabling complete analysis of a surface using only the much smaller atlas. It is broadly usable as the implementation in ImSAnE allows a user to automatically build an atlas and make measurements without knowing the underlying mathematics, and easily interfaces with other software by using open file formats. Application is not restricted to early development, but should include plant leaves12, super-resolution recordings of single cells3,13, or branching organs14. While projects like OpenSPIM15 have increased accessibility and affordability of light sheet microscopy, the resources required for handling large data still form an obstacle to mainstream use. We believe that our general framework for tissue cartography will contribute to clearing the way.
Methods
ImSAnE
The pipeline starts with SOI identification, which consists of two preprocessing steps, and is then followed by tissue cartography. The preprocessing steps are identification of a rough surface mask and generation of a smooth Surface of Interest, which can be performed by using built-in methods or external software, interfacing through standard file formats. Tissue cartography consists of atlas generation and measurements, done in ImSAnE. The text and SI further detail parametrization and measurement. To generate transition maps between parametrizations, we interpolate one coordinate grid over the other in the overlap of regions, taking advantage of the MATLAB function interp2. Self-contained tutorials explaining how to use ImSAnE are included in the supplementary software.
Code availability
ImSAnE is freely available under the GPL and included as a supplementary software zip file. Updates will be available from http://www.tissuecartography.org.
SOI generation in figures
For each data set in the manuscript there is a supplementary tutorial containing parameters required to produce the SOIs. For Fig 1 and Fig 4 we used built-in preprocessing methods, producing a rough surface by edge detection and a smooth SOI by fitting. For Fig 1 we fitted shape parameters while for Fig 4 we fitted a thin plate spline. For Fig 3, we used external preprocessing methods: Ilastik16 to generate a rough surface and Poisson surface reconstruction in Meshlab to generate a smooth surface triangulation. Parametrization for Fig 1 is described in the text and detailed in SI. To generate the conformal parametrization for Fig 3 we used17, which reduces this to a generalized eigenvalue problem. For all other time points we solved this linear equation under an added constraint to ensure continuity: at each time step, for two arbitrary positions, the closest surface position in the next frame must be assigned the same surface coordinate.
Analysis in figures
To segment and track individual cells shown in Fig 1bc and Fig 3e, we used Ilastik, following the pixel classification and automated tracking workflows. The lattice shown in Fig 1bc was extracted from Ilastik generated membrane segmentation using the MATLAB bwmorph function. 3D measurements shown in Fig 1d where performed based on 3D positions of cells and vertices: To measure track length, we summed the distance traveled between each time point. We used standard formulas for polygon area and angle to respectively measure the area of cells and angles between edges in our lattice representation (see SI for further detail). Uncorrected 2D measurements of length, angle and area where based on the flattened images using analogous methods in 2D. Cartographic measurements in Fig 1 as well as Fig 3 were done using ImSAnE built-in functions that weigh each measurement with a local distortion correction factor derived from the metric, explained in detail in the SI. The laptop used to perform data analysis is running Mac OS 10.9 and has a 2.8 GHz Intel Core i7 CPU with 16GB RAM.
The benchmark graphs shown in Fig 2 were generated from isotropically down-sampled versions of the data from Fig 1. Data storage was assessed with the Linux disk usage tool: Dynamic shape benchmarks where based on a single time point, while for static surfaces we used the average of indicated number of frames. Data access time was benchmarked using the MATLAB profiler, using MATLAB imread to read 3D data and the ImSAnE SOI reader using MATLAB imread. Processing time for typical image analysis operations was benchmarked by a Gaussian filter with MATLAB convn, and erosion with MATLAB imerode, all with linear kernel size 13. Data transfer rates where computed based on dynamic data size in Fig 2a. Benchmark analyses were performed using a computer with 16×2.4 GHz Intel Xeon CPU E5620, 96 GB RAM and western digital wdc WD4000FYYZ hard discs running Ubuntu Linux 12.04.
Data
Fly Stocks used: GAP43-mCherry (embryo); ubi:ECad-GFP (wing). Fusion of the embryo multi view data displayed in Fig 1 was performed using a front end to Elastix18 written in python. Data used in Fig 3 was taken from19 SI Video9 and kindly provided by M. Mickoleit and J. Huisken. Data for Fig 4 was recorded using a Leica SP8 during the Santa Barbara QBio‘13 summer school.
Acknowledgments
We thank Matteo Rauzi for providing a MuVi-SPIM recording of the Drosophila melanogaster embryo shown in Fig. 1, Marvin Albert for MuVI-SPIM fusion software. We also thank Dong-Yuan Chen and David Bilder for letting us record the the follicle data shown in SI Figure 4 and Ken Irvine for providing the confocal data shown in SI Figure 3. We thank Boris Shraiman for discussions and participants of the Santa Barbara quantitative biology summer school 2013 for testing the software. We also thank Boris Shraiman and David Bilder for critical comments on the manuscript. This work was funded by the Gordon and Betty Moore Foundation fund number GBMF2919.
References
- 1.Krzic U, Gunther S, Saunders TE, Streichan SJ, Hufnagel L. Multiview light-sheet microscope for rapid in toto imaging. Nat. Methods. 2012;9:730–733. doi: 10.1038/nmeth.2064. [DOI] [PubMed] [Google Scholar]
- 2.Tomer R, Khairy K, Amat F, Keller PJ. Quantitative high-speed imaging of entire developing embryos with simultaneous multiview light-sheet microscopy. Nat. Methods. 2012;9:755–763. doi: 10.1038/nmeth.2062. [DOI] [PubMed] [Google Scholar]
- 3.Chen B-C, et al. Lattice light-sheet microscopy: imaging molecules to embryos at high spatiotemporal resolution. Science. 2014;346:1257998. doi: 10.1126/science.1257998. [DOI] [PMC free article] [PubMed] [Google Scholar]
- 4.Bosveld F, et al. Mechanical control of morphogenesis by Fat/Dachsous/Four-jointed planar cell polarity pathway. Science. 2012;336:724–727. doi: 10.1126/science.1221071. [DOI] [PubMed] [Google Scholar]
- 5.Reynaud EG, Peychl J, Huisken J, Tomancak P. Guide to light-sheet microscopy for adventurous biologists. Nat. Methods. 2015;12:30–34. doi: 10.1038/nmeth.3222. [DOI] [PubMed] [Google Scholar]
- 6.Alberts B, et al. Molecular Biology of the Cell. Garland Science; 2014. [Google Scholar]
- 7.Gilbert SF. Developmental biology. Sinauer Associates Incorporated; 2014. [Google Scholar]
- 8.Amat F, et al. Fast, accurate reconstruction of cell lineages from large-scale fluorescence microscopy data. Nat. Methods. 2014;11:951–958. doi: 10.1038/nmeth.3036. [DOI] [PubMed] [Google Scholar]
- 9.Fowlkes CC, et al. A quantitative spatiotemporal atlas of gene expression in the Drosophila blastoderm. Cell. 2008;133:364–374. doi: 10.1016/j.cell.2008.01.053. [DOI] [PubMed] [Google Scholar]
- 10.Schmid B, et al. High-speed panoramic light-sheet microscopy reveals global endodermal cell dynamics. Nat Commun. 2013;4:2207. doi: 10.1038/ncomms3207. [DOI] [PMC free article] [PubMed] [Google Scholar]
- 11.Frankel T. The Geometry of Physics: An Introduction. Cambridge University Press; 2004. [Google Scholar]
- 12.Rolland-Lagan A-G, Bangham JA, Coen E. Growth dynamics underlying petal shape and asymmetry. Nature. 2003;422:161–163. doi: 10.1038/nature01443. [DOI] [PubMed] [Google Scholar]
- 13.Clark AG, Dierkes K, Paluch EK. Monitoring actin cortex thickness in live cells. Biophys. J. 2013;105:570–580. doi: 10.1016/j.bpj.2013.05.057. [DOI] [PMC free article] [PubMed] [Google Scholar]
- 14.McDonald DM, Choyke PL. Imaging of angiogenesis: from microscope to clinic. Nat Med. 2003;9:713–725. doi: 10.1038/nm0603-713. [DOI] [PubMed] [Google Scholar]
- 15.Pitrone PG, et al. OpenSPIM: an open-access light-sheet microscopy platform. Nat. Methods. 2013;10:598–599. doi: 10.1038/nmeth.2507. [DOI] [PMC free article] [PubMed] [Google Scholar]
- 16.Sommer C, Straehle C, Kothe U, Hamprecht FA. 2011 8th IEEE International Symposium on Biomedical Imaging (ISBI 2011) IEEE; 2011. Ilastik: Interactive learning and segmentation toolkit; pp. 230–233. [Google Scholar]
- 17.Mullen P, Tong Y, Alliez P. Spectral Conformal Parameterization - Mullen-2008 - Computer Graphics Forum - Wiley Online Library. Computer Graphics. 2008 [Google Scholar]
- 18.Klein S, Staring M, Murphy K, Viergever MA, Pluim JPW. elastix: a toolbox for intensity-based medical image registration. IEEE Trans Med Imaging. 2010;29:196–205. doi: 10.1109/TMI.2009.2035616. [DOI] [PubMed] [Google Scholar]
- 19.Mickoleit M, et al. High-resolution reconstruction of the beating zebrafish heart. Nat. Methods. 2014;11:919–922. doi: 10.1038/nmeth.3037. [DOI] [PubMed] [Google Scholar]


