

Abstract
Background and Purpose
Helix stapling enhances the activity of peptides that interact with a target protein in a helical conformation. These staples are also supposed to change the pharmacokinetics of the molecules and promote cytoplasmic targeting. We assessed the extent to which the pharmacokinetic characteristics are a function of the staple for a peptide inhibiting the interaction of p53 with the human double minute 2 (Hdm2) protein and differ from those of the standard cationic cell‐penetrating peptide nona‐arginine.
Experimental Approach
Stapled peptides and linear counterparts were synthesized in free and fluorescently labelled forms. Activity was determined in biochemical time‐resolved Förster resonance energy transfer experiments and cellular high‐content assays. Cellular uptake and intracellular trafficking were visualized by confocal microscopy.
Key Results
Peptides showed sub‐nanomolar potency. For short‐time incubation, uptake efficiencies for the stapled and linear peptides were similar and both were taken up less efficiently than nona‐arginine. Only for SJSA‐1 cells expressing the Hdm2 target protein, the stapled peptides showed an enhanced cytoplasmic and nuclear accumulation after long‐term incubation. This was also observed for the linear counterparts, albeit to a lesser degree. For HeLa cells, which lack target expression, no such accumulation was observed.
Conclusion and Implications
Cytosolic and nuclear accumulation was not an intrinsic property of the stapled peptide, but resulted from capture by the target Hdm2 after endo‐lysosomal release. Considering the rather poor uptake of stapled peptides, further development should focus on increasing the efficiency of uptake of these peptides.
Abbreviations
- CF
carboxyfluorescein
- CPP
cell‐penetrating peptide
- DCE
dichloroethane
- DIPEA
N,N‐diisopropylethylamine
- DMA
N,N‐dimethylacetamide
- Fmoc
fluorenylmethoxycarbonyl
- HATU
N‐[(dimethylamino)‐1H‐1,2,3‐triazolo‐[4,5‐b]pyridine‐1‐ylmethylene]‐N‐methylmethanaminium hexafluorophosphate N‐oxide
- HCTU
N,N,N′,N′‐tetramethyl‐O‐(6‐chloro‐1H‐benzotriazole‐1‐yl)uronium hexafluorophosphate
- Hdm2
human double minute 2
- MBHA
4‐methylbenzhydrylamine
- NMP
1‐methyl‐2‐pyrrolidinone
- PPI
protein–protein interaction
- TBS
Tris‐buffered saline
- TFA
trifluoroacetic acid
- TIS
triisopropylsilane
- UPLC
ultrafast LC
Introduction
Helices play a prominent role as a recognition element in protein–protein interactions (PPI) and thus are important targets for the development of PPI inhibitors (Azzarito et al., 2013). A peptide with this stabilized secondary structure motif represents the most logical competitive inhibitor of such an interaction. Usually, outside the native protein context, the helix‐forming propensity is considerably reduced, increasing the entropic cost for target binding. Several modes of helix stabilization have been described (Vorherr, 2015). The so‐called ‘stapling’ has been most successful to conformationally stabilize an α‐helix (Walensky and Bird, 2014). In this case, amino acid side chains that extend out of the same face of the helix are covalently linked via olefin metathesis. In comparison with their non‐clamped linear counterparts, stapled peptides were reported to show a greatly increased helical conformation and target binding. Therefore, the stapled helical peptides hold promise as therapeutic agents, especially for the efficient disruption of PPIs, for example, in the induction of apoptosis in a variety of oncogenic pathways (Walensky et al., 2004; Chang et al., 2013). The inhibition of the p53/human double minute 2 (Hdm2) interaction is of particular interest in this context, and a variety of studies on different variants of stapled peptides have been published (Walensky et al., 2004; Chang et al., 2013). Remarkably, despite their size, these stapled peptides have been shown to enter cells and reach their targets in the cytosol (Muppidi et al., 2014; Chu et al., 2015; Edwards et al., 2015). These properties have been linked to the constrained helical character of the peptides (Kim and Verdine, 2009).
Typically, efficient cellular entry is restricted to polycationic peptides, which are also referred to as cell‐penetrating peptides (CPPs) (Milletti, 2012; Copolovici et al., 2014). CPPs enter either by directly crossing the plasma membrane or by inducing endocytosis, which requires subsequent endosomal release for cytosolic targeting. The mode of uptake depends on the CPP, the cargo, the cell type and the concentration of the CPP (Tunnemann et al., 2006; Kosuge et al., 2008; Brock, 2014). It has been acknowledged that endosomal sequestration is a major bottleneck in the application of CPPs, because of both spatial confinement and hydrolytic degradation (Wadia et al., 2004; El‐Andaloussi et al., 2011).
Interestingly, in spite of their capacity to reach cytosolic targets, reports so far indicate that stapled peptides are also taken up by endocytosis and then reach the cytosol only slowly (Walensky et al., 2004; Kim and Verdine, 2009). Therefore, the cellular uptake routes of stapled peptides and CPPs share some characteristics, in spite of their different structure. Remarkably, so far, a direct comparison of the uptake and intracellular routing of cationic CPPs and stapled peptides is missing. Without such a direct comparison, it is impossible to place the efficiency of uptake of stapled peptides into context and fully rationalize the biological activity of stapled peptides. To resolve this deficit, we compared the cellular uptake of a short and long version of an Hdm2‐targeted cis‐stapled peptide (Brown et al., 2013; Chang et al., 2013), their linear counterparts and nona‐arginine (R9) in HeLa, HEK293 and SJSA‐1 cells. In addition, we used selected peptides to perform high‐content imaging to quantify the dependence of localization on the induction of downstream targets following the release of p53 from Hdm2.
Methods
Peptide synthesis
Peptides were prepared by automated synthesis, using a Biotage microwave peptide synthesizer (Initiator+ Alstra; Biotage, Sweden). The Rink‐MBHA‐polystyrene resin was used for stapling on the solid support. For stapling in solution, the fully protected peptide was cleaved from a trityl linker using 1,1,1,3,3,3‐hexafluoro‐2‐propanol. Peptide synthesis was performed using 2.4 eq Xaa/coupling. Each building block was pre‐dissolved in 1‐methyl‐2‐pyrrolidinone (NMP) as a mixture with Oxyma‐Pure, both 0.2 M and stable in solution at room temperature. Standard coupling (microwave) was performed for 4.5 min at 75°C using N,N,N′,N′‐tetramethyl‐O‐(6‐chloro‐1H‐benzotriazole‐1‐yl)uronium hexafluorophosphate / N,N‐diisopropylethylamine (HCTU/DIPEA). R8 + S5 were coupled with 2 × 1.2 eq. For the first coupling reaction, HCTU/DIPEA + 1 volume NMP (6–8 min at 75°C) was employed, while the second coupling was carried out following activation with N‐[(dimethylamino)‐1H‐1,2,3‐triazolo‐[4,5‐b]pyridine‐1‐ylmethylene]‐N‐methylmethanaminium hexafluorophosphate N‐oxide (HATU)/DIPEA (10 min 65°C) (mixed mode). The Xaa after S5 was attached using a double‐coupling procedure (2 × 2.4 eq mixed mode), and the Xaa after R8 was incorporated using triple coupling (2 × 2.4 eq mixed mode + 1× 2.4 eq Xaa + 5 eq N,N′‐diisopropylcarbodiimide (DIC), 20 min 50°C).
Cyclization on the resin
The well‐dried shrunken resin was suspended in a solution of dry 1,2‐dichloroethane (DCE) (15× the weight of the resin) containing 15 mol % = 0.15 eq of Grubbs‐I catalyst (purple solution). The Grubbs solution was prepared fresh for every addition. The Grubbs‐I solution was directly added to the resin without pre‐swelling. The purple‐brown suspension was shaken at 50°C under a constant stream of dry argon. Samples were taken after 15–30 min to perform test cleavages as a check for completion of the reaction by ultrafast LC (UPLC) retention time. More Grubbs‐I solution (freshly prepared) was added in 0.05 eq steps, if the reaction was not complete. If more than ~0.5 eq Grubbs‐I were added, many side reactions were usually visible.
Cyclization in solution
The fully protected dry peptide was dissolved ~10% (w/v) in N,N‐dimethylacetamide (DMA) and diluted with DCE (dry and degassed with argon) to a peptide concentration of 1%. At this point, a sample was taken to follow the reaction by UPLC. The peptide solution was warmed to 50°C under shaking and bubbling with argon. Three portions of Grubbs‐I catalyst were weighed out (0.15 eq in total). The first portion was dissolved ~1% (w/v) in DCE (dry and degassed with argon). Half of the first catalyst solution (0.025 eq) was applied to the warm peptide solution, followed by addition of the remaining portion after 3 min. During the next 3 min, the second Grubbs‐I sample was dissolved, and again, 2 × 0.025 eq was added in a similar fashion. Usually, the third portion of Grubbs catalyst was dissolved after analysis and applied in a similar fashion, resulting in a total of six additions. The reaction product was purified immediately or stored in the freezer.
Synthesis of fluorescein‐labelled stapled peptides
Following removal of the N‐terminal Fmoc group, carboxyfluorescein (CF) was coupled to the N‐terminus of the fully protected stapled peptide and the standard downstream protocols were applied.
Cleavage and purification
Side chain‐protected (resin‐bound) peptide was deprotected (and cleaved off the resin) using a mixture of TFA : TIS 95:5 for 30–45 min at 45°C. Following precipitation with cold diisopropylether, peptides were purified by preparative RP‐HPLC (Waters UV‐Autopurification System including a Waters 2545 Binary Gradient Module and a 2487 Waters UV detector at 224 nm; Waters, Milford, MA, USA) with solvent A: H20 0.1% TFA, and solvent B: acetonitrile on a Waters‐SunFire Prep‐C18 ODB 5 μm 50 mm × 150 mm preparative column. The fractions of interest were pooled and lyophilized to give the desired product. All peptides were greater than 95% pure according to UPLC (Waters Acquity) run on a BEH C18 column (1.7 μM) using a water : acetonitrile gradient and detection at 215 nm. All mass spectra were in agreement with the structures indicated in Table 1. Using NMR, we unambiguously assigned the cis‐ and trans‐double bonds for peptides 1a, 2a, 1b and 2b (Table 1) by the chemical shifts of the methylene protons next to the double bond. The cis‐derivative peptides 1a and 2a showed a δ of about 26–27 p.p.m., while the chemical shifts of the corresponding protons for the trans‐peptides 1b and 2b were around 32 p.p.m. All spectra were recorded on a Bruker AV‐III‐600 NMR spectrometer K (Bruker Biospin, Fällanden, Switzerland) at 300°K using a 1.7 mm TXI Cryoprobe, 1H (600.13 MHz) and 13C (150.90 MHz). Shifts were referenced internally to the solvent signals of DMSO‐d 6 at 2.50 and 39.5 p.p.m. respectively. The following NMR experiments were carried out with Bruker standard pulse sequences: 1D‐1H, 1H‐1H‐COSY, 1H‐1H‐ROESY, 1H‐13C‐COSY (edited HSQC) and 1H‐13C‐long‐range COSY (13C HMBC, 8 Hz). The sample concentration was approximately 1 mg/40 μL DMSO‐d 6. All assignments were based on chemical shifts and homo‐ and heteronuclear correlations. Concentrations of stapled peptides and linear precursors were determined in Tris–HCl pH 7, at 280 nm based on Trp absorption (ε: 5560 M−1·cm−1) and Tyr absorption (ε: 1200 M−1·cm−1). Fluorescein‐labelled peptides were dissolved in DMSO, and the concentration was determined by diluting the peptides in Tris–HCl buffer, pH 8.8, and measuring the absorbance at 492 nm using an extinction coefficient of 75 000 M−1·cm−1.
Table 1.
Hdm2–binding peptides referred to in this study
| Peptide | Sequence | |
|---|---|---|
| 1a | cisa | Ac‐TSFR 8*EY‐6‐ClW‐ALLS 5*‐NH2 |
| 1b | trans | Ac‐TSFR 8*EY‐6‐ClW‐ALLS 5*‐NH2 |
| CF1a | labelled 1a | CF‐TSFR 8*EY‐6‐ClW‐ALLS 5*‐NH2 |
| 2a | cis | Ac‐LTFR 8*EYWAQ‐Cba‐S 5*SAA‐NH2 |
| 2b | trans | Ac‐LTFR 8*EYWAQ‐Cba‐S 5*SAA‐NH2 |
| CF2a | labelled 2a | CF‐LTFR 8*EYWAQ‐Cba‐S 5*SAA‐NH2 |
| 3 | linear 1 | Ac‐TSFR 8EY‐6‐ClW‐ALLS 5‐NH2 |
| CF3 | labelled 3 | CF‐TSFR 8EY‐6‐ClW‐ALLS 5‐NH2 |
| 4 | linear 2 | Ac‐LTFR 8EYWAQ‐Cba‐S 5SAA‐NH2 |
| CF4 | labelled 4 | CF‐LTFR 8EYWAQ‐Cba‐S 5SAA‐NH2 |
The cyclization between i and i + 7 of the two α‐methyl, α‐alkenyl amino acids R8 and S5 (R and S optical isomers respectively) is indicated by an asterisk. cis and trans relate to the orientation of the olefinic bond in the staple. Cba, cyclobutyl‐Ala; 6‐ClW: l‐6‐chloro‐Trp.
Biochemical peptide binding assay
Binding was determined with a time‐resolved FRET (TR‐FRET) competition assay (Jeay et al., 2015). Hdm2 (amino acid residues 2–188) tagged with a C‐terminal biotin moiety was bound to streptavidin labelled with europium serving as the donor fluorophore. A p53‐derived peptide (amino acids 18–26 of p53: TFSDLWKLL) was labelled with Cy5 as the acceptor fluorophore. IC50 values calculated by curve fitting are means ± SDs of at least three independent experiments.
Cell culture
SJSA‐1, HeLa and HEK293 were obtained from the American Type Culture Collection (USA). SJSA‐1, a human osteosarcoma cell line, was cultured in RPMI medium supplemented with 10% fetal calf serum (FCS). HEK293 cells were grown in DMEM High Glucose medium and HeLa cells in McCoy medium or RPMI, all containing 10% FCS.
Confocal microscopy
One day before the experiment, 40 000 HeLa or SJSA‐1 cells or 50 000 HEK293 cells were seeded into IBIDI 8‐well microscopy chambers (Ibidi, Martinsried, Germany). Peptides were diluted to the indicated concentrations in RPMI +10% FCS. After incubation for 30 min or 24 h, cells were washed twice with medium and then imaged on a Leica SP5 confocal laser scanning microscope with an HCX PL APO 63 × N.A. 1.2 water immersion objective. During image acquisition, cells were maintained at 37°C. Fluorescein was excited using the 488 laser line of the argon laser, and emitted light was detected between 500 and 550 nm.
Quantitative imaging cytometry
For quantitative imaging cytometry, SJSA‐1 or HeLa cells were treated with 5, 10 or 20 μM of the unlabelled peptides and the CF peptides CF1a and CF2a added directly from a 10 mM DMSO stock solution with the HP Digital D300 Dispenser (Hewlett‐Packard, Palo Alto, CA, USA) in 96‐well plates suitable for imaging. After 24 h, the medium was removed. Next, the cells were washed once with PBS and fixed for 15 min at room temperature by addition of 100 μL of a 3.5% formaldehyde solution diluted freshly from the 37% stock solution with PBS. After two washing steps with PBS, cell membranes were permeabilized by a 10 min incubation at room temperature with PBS containing 0.25% Triton X‐100. Next, the plates were washed once with Tris‐buffered saline (TBS) supplemented with 0.05% Tween‐20 (TBS/T). To block non‐specific sites, we incubated the cells for 2 h at room temperature with 100 μL of blocking buffer consisting of PBS supplemented with 2% goat serum and 5% albumin. Subsequently, the cells were treated for 2 h at room temperature with 50 μL of anti‐Hdm2 rabbit monoclonal antibody diluted to 0.5 mg·mL−1 in blocking buffer. After five washing steps using TBS/T, cells were labelled by incubation with 50 μL blocking buffer containing 0.1 mg·mL−1 goat anti‐mouse IgG (H + L) antibody labelled with Alexa‐647 and 10 μM of the nuclear DNA staining dye DAPI. The plates were incubated for 60 min at room temperature in the dark and washed again five times with TBS/T and twice with PBS. Finally, 100 μL of PBS was added and the plates were sealed with a plastic foil.
High‐content analysis was performed on the iCyte platform (Thorlabs, Newton, NJ, USA) equipped with a 488 nm Argon and a 633 nm HeNe laser and a 405 nm diode. A 40‐fold magnification was used with a stage resolution of 0.5 μm to ensure high spatial resolution imaging. Event segmentation was based on the nuclear DAPI signal. This first segmentation identifies nuclei and is used as the boundary for all feature collections and calculations of the peptides and the pharmacodynamics (PD) marker. To avoid spectral bleeding and increase the specificity of the signals, a multi‐pass scanning approach was used. The green fluorescent signal was acquired using a 515–545 nm bandpass filter, and the red fluorescence signal was measured using a LongRed‐650 LP long pass filter. Both lasers were used at a fixed laser power. For each condition, at least 350 to 500 events were acquired and the integrated fluorescent signals in the nuclear boundaries quantified.
Data and statistical analysis
The data and statistical analysis comply with the recommendations on experimental design and analysis in pharmacology (Curtis et al., 2015). For analysis of high‐content data, the number of Hdm2‐positive cells was calculated from the mean values ±3 SD of the nuclear integrated red fluorescence signals determined in DMSO control cells. Data represent at least 600 events derived from two independent experiments.
Blinding and randomization
Experiments were conducted without blinding and randomization. For the analysis of peptide uptake and distribution by confocal microscopy, conclusions could be reached without risk of user bias. Determinations of biological activity using biochemical assays and high‐content screening occurred in an automated fashion using standardized procedures, again not leaving room for user bias.
Materials
Amino acids, reagents and solvents not specified were purchased from Bachem or Aldrich, Switzerland. DMA and NMP were from ABCR, Germany. 4‐Methylpiperidine used for Fmoc cleavage was obtained from Fluorochem, UK. HCTU and Fmoc‐β‐cyclobutyl‐alanine were provided by Chem‐Impex International, Wood Dale, IL, USA. 1‐[Bis(dimethylamino)methylene]‐1H‐1,2,3‐triazolo[4,5‐b]pyridinium 3‐oxide hexafluoro‐phosphate and HATU were from ChemShuttle, China. Oxyma‐Pure was from Iris‐Biotech, Germany. Building blocks Fmoc‐S5 and Fmoc‐R8 were from AApptec, Louisville, KY, USA. The formaldehyde solution was obtained from Sigma, Switzerland; goat serum from PromoCell, Heidelberg, Germany; and albumin from Amresco, Solon, OH, USA. The anti‐Hdm2 rabbit monoclonal antibody OP46 was purchased from Calbiochem, Switzerland, and the goat anti‐mouse IgG (H + L) antibody labelled with Alexa‐647 and DAPI from Invitrogen, Switzerland.
Results
Peptide synthesis
To assess the effects of helix stapling on biological activity, we selected two previously published Hdm2‐binding peptides (Figure 1). Sequences 1a and 2a (Table 1) were published as smTide‐02A (Brown et al., 2013) and ATPS‐7041 (Chang et al., 2013) respectively. However, these publications did not indicate whether stapled peptides were of e‐ or z‐configuration for the olefinic bond, even though the formation of both isomers had been noted before (Schafmeister et al., 2000). Here, we also included the linear counterparts and CF‐labelled peptides as indicated in Table 1.
Figure 1.
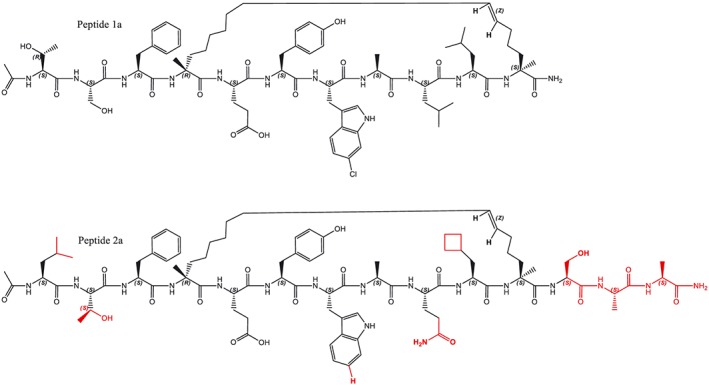
Structures of cis regioisomers of stapled peptides 1a (Brown et al., 2013) and 2a (Chang et al., 2013).
A more sophisticated solid‐phase protocol had to be used to obtain crude peptides of sufficient purity for stapling. Special conditions using double and triple couplings were mandatory, as indicated for peptide 1 analysed after olefin metathesis in Figure 2. The stapling reaction is critically influenced by the sequence, the stability of the catalyst and environmental factors as, for example, the presence of oxygen. In agreement with previous observations, the stapling resulted in a mixture of isomers, which could be separated for the cases of peptide 1 and 2. The ratio between cis‐ and trans‐products could be influenced to some extent by performing the reaction in solution or on the solid phase (Figure 2). The identity of the products was confirmed by NMR spectroscopy. Interestingly, stapling of peptide 1 on the solid phase resulted in a lower yield and more by‐products than that of peptide 2. The proximity of the C‐terminal S5 building block to the linker and/or the resin for peptide 1 may explain these findings. In the case of the more convenient solid‐phase stapling, the cis‐product was dominant and could be separated better by preparative HPLC. For these reasons, and because of the negligible difference in the biochemical assay (see below), we decided to preferentially carry out experiments using the acetylated or CF‐labelled z‐isomers. After purification, the purity of all peptides was confirmed by HPLC and the identity by mass spectrometry (Supporting Information Figures S1–S10 and Table S1).
Figure 2.
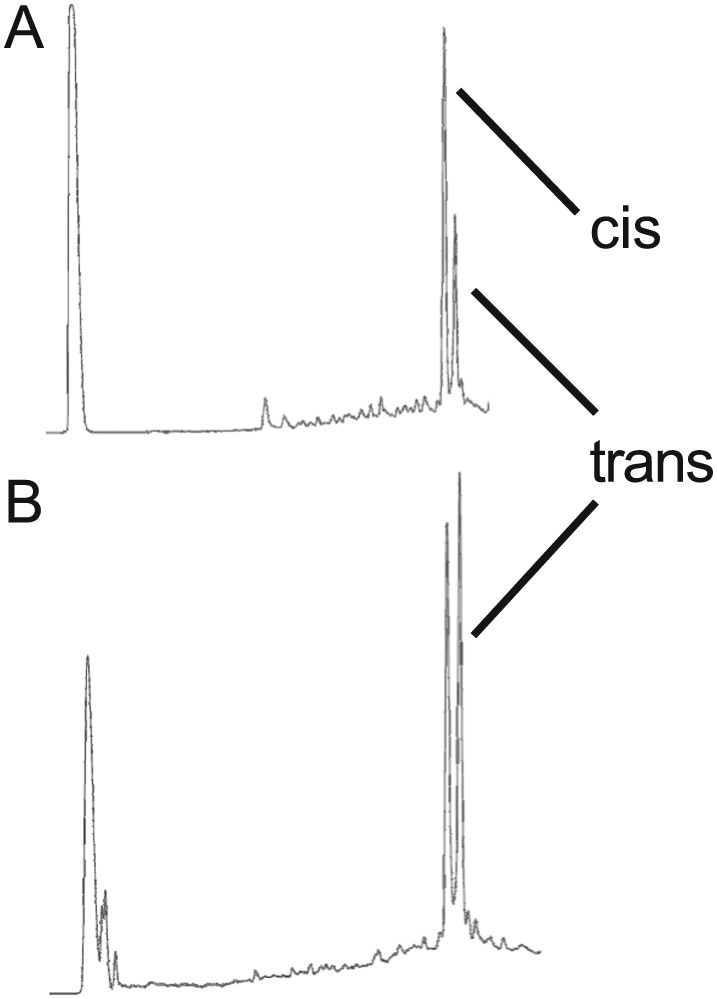
UPLC traces of crude peptide following stapling. (A) Stapling carried out on the solid phase and (B) stapling carried out in solution. The cis‐peptide corresponds to 1a.
Biochemical assay
We determined the IC50 values for the individual peptides using a TR‐FRET assay (Jeay, et al., 2015). All peptides, including the linear molecules, had sub‐nanomolar affinity for Hdm2 (Table 2). The IC50 values of the linear versions were approximately three times higher. For comparison, Nutlin‐3a was included in this set to demonstrate the high affinity of the peptides. For the Hdm2 interactions, the staple is thought to contribute to some extent to binding, as has been described for the very similar interaction of peptide 2a with Hdm4 (Chang et al., 2013). It has also been described before that, in comparison with the unmodified peptides, insertion of the two α‐methylated R8 and S5 building blocks promotes an α‐helical preorganization of the peptide, which by itself is sufficient to reduce the entropic penalty (Kim and Verdine, 2009). There was only a small difference in activity between the cis‐ and trans‐isomers. Due to interference with the TR‐FRET assay, IC50 values for the CF peptides could not be determined.
Table 2.
Results of the biochemical p53/Hdm2 competition assay for stapled Hdm2‐binding peptides and their linear counterparts
| Biochemical assay | IC50 Hdm2 ± SD (nM)a | |
|---|---|---|
| 1a | cis | 0.15 ± 0.04 |
| 1b | trans | 0.19 ± 0.05 |
| 2a | cis | 0.17 ± 0.06 |
| 2b | trans | 0.23 ± 0.08 |
| 3 | linear 1 | 0.45 ± 0.05 |
| 4 | linear 2 | 0.46 ± 0.08 |
| Nutlin‐3a | – | 8.0 ± 1.5 |
Means ±SD from at least three independent experiments.
Cellular assay
The cellular activity of the peptides was assessed by determining the induction and localization of the specific PD marker Hdm2 (Table 3). We used the osteosarcoma cell line SJSA‐1, as this cell line is p53 dependent and represents the standard cellular system to evaluate inhibitors of the p53/Hdm2 interaction. Disruption of the interaction of Hdm2 and p53 leads to an increase in Hdm2 protein levels, which can be measured by high‐content single‐cell analysis using a specific antibody against the protein. Following this approach, we found that the isomeric pairs of the longer and shorter stapled peptides showed comparable levels of induced PD marker. In all cases, this induction was highly concentration‐dependent but was significantly lower for the shorter CF peptides compared with the longer derivatives. For comparison, we also tested the linear peptides and found a threefold to fourfold increased signal over background for the longer peptide 4 and a weaker staining for peptide 3. Neither linear peptide showed concentration‐dependent activity.
Table 3.
Induction of the PD marker Hdm2 for stapled peptides and their linear counterparts in SJSA‐1 cells
| Peptide | DMSO (Hdm2‐positive cells in %)a | 5 μM (Hdm2‐positive cells in %) | 10 μM (Hdm2‐positive cells in %) | 20 μM (Hdm2‐positive cells in %) |
|---|---|---|---|---|
| 1a | 1.2 ± 0.2 | 4.4 ± 0.5 | 12.8 ± 0.7 | 43.5 ± 15.8 |
| 1b | 1.4 ± 0.1 | 8.7 ± 0.1 | 16.4 ± 4.5 | 38.8 ± 10.6 |
| 2a | 1.4 ± 0.9 | 43.0 ± 3.3 | 55.2 ± 0.2 | 69.3 ± 7.9 |
| 2b | 1.9 ± 0.2 | 28.5 ± 15.8 | 55.7 ± 5.2 | 66.7 ± 1.3 |
| 3 | 0.9 ± 0.2 | 3.7 ± 2.3 | 2.5 ± 0.3 | 3.4 ± 0.5 |
| 4 | 1.5 ± 0.2 | 7.7 ± 0.9 | 8.1 ± 0.3 | 6.8 ± 3.5 |
After treatment of 10 000 cells for 24 h with the peptides at the indicated concentrations, the cells were fixed and stained with an Hdm2‐specific antibody linked with a red fluorescent label. Hdm2 positive cells were calculated from the mean values ±3 SD of the nuclear integrated red fluorescence signal determined in DMSO control cells. Data represent determinations of at least 600 events derived from two independent experiments.
Interestingly, the longer stapled peptides 2a and 2b showed significantly higher activity than the corresponding shorter sequences, which was not reflected in the biochemical binding experiments. We were therefore interested to determine how much the peptides differed in their cellular uptake and targeting. Because of their better synthetic accessibility, we focused on the cis‐peptides and their linear counterparts.
Comparison of uptake efficiencies and subcellular localization
CF was coupled to the N‐terminus of the peptides as a fluorescent label to compare cellular uptake efficiencies and to follow intracellular trafficking. The cell lines SJSA‐1, HEK293 and HeLa cells were used for these experiments. HEK293 and HeLa cells are routinely used for CPP uptake studies and therefore provided a good reference point. We investigated uptake at peptide concentrations of 5 and 20 μM and after 30 min and 24 h. The two concentrations were chosen because in HeLa cells, at 5 μM, R9 is taken up by endocytosis, while at 20 μM, the peptide activates a rapid and non‐endocytic cytosolic uptake mechanism (Duchardt et al., 2007; Verdurmen et al., 2010). While the short 30 min incubation provides information on the capacity of the peptides to induce uptake, the long incubation period also captures differences in cellular retention and subcellular accumulation. Due to the resistance against proteolytic cleavage, stapled peptides have an advantage over linear sequences that only consist of natural amino acids (Wallbrecher et al., 2014). In particular, we were interested to compare the stapled peptides with R9, in terms of cytosolic delivery. After 30 min, R9 at 5 μM showed vesicular staining in all three cell lines, as well as some homogenous cytosolic fluorescence in HEK293 and SJSA‐1 cells. Using the same settings as for R9 at 5 μM, fluorescence of the stapled peptide was barely detectable (Figure S11). For R9 at 20 μM, all three cell lines showed a homogenous and intense cytoplasmic and nuclear staining (Figure 3). For the other peptides, we observed a punctate distribution of fluorescence in all three cell lines, although much weaker than for R9.
Figure 3.
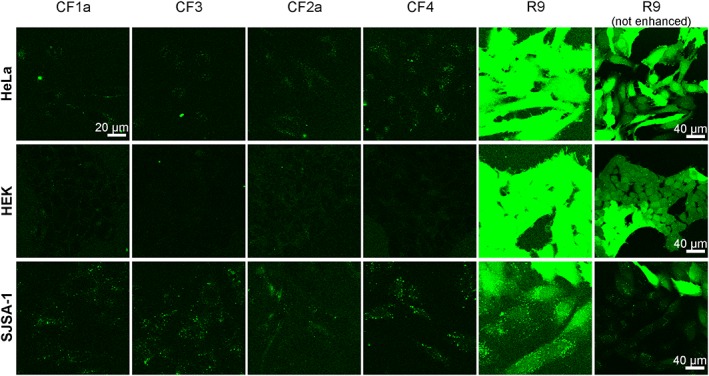
Intracellular distribution of stapled and linear peptides after 30 min incubation. Cells were incubated with 20 μM of the labelled peptides CF1a, CF3, CF2a and CF4 in RPMI +10% FCS and washed, and confocal images were recorded. R9 was used as a control CPP. Except for the R9 panels on the right, the brightness and contrast were enhanced to better visualize the peptides. The figure shows one representative experiment of two independent repetitions.
After 24 h, striking differences in the subcellular localization of the peptides were observed (Figure 4). In HEK293 and HeLa cells at 20 μM, fluorescence of the stapled peptide was distributed throughout the cell with little staining of the nucleus and only some punctuate fluorescence. Again, the uptake of the linear analogues was weaker than that of the stapled ones. Remarkably, in SJSA‐1 cells, the stapled peptides showed a strong accumulation in the nucleus, excluding the nucleoli. This was more prominent for the longer version CF2a. Also the linear counterparts showed a weak nuclear staining at 20 μM; however, the punctuate fluorescence was most prominent. There were no qualitative differences between the distribution of the peptides at concentrations of 5 and 20 μM (Figure S12). We did not perform an explicit toxicity assay, as there were no indications of cell damage, even for 20 μM after 24 h.
Figure 4.
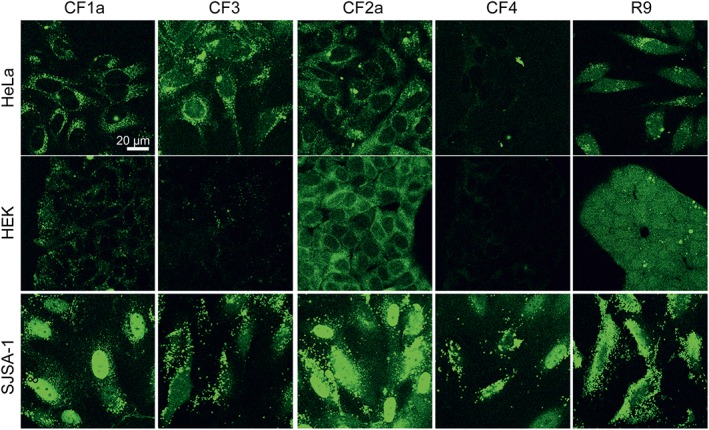
Intracellular distribution of peptides after a 24 h incubation. Cells were incubated with 20 μM of the CF‐labelled peptides in RPMI +10% FCS and washed and confocal images were recorded. R9 was used as a control CPP. The figure shows one representative experiment of three independent repetitions.
Correlation of CF peptide localization with induced target expression
Finally, we were interested to learn whether the differences in subcellular localization of the fluorescently labelled peptides in HeLa and SJSA‐1 cells correlated with the presence of the target. Cells were incubated with the fluorescein‐labelled CF2a peptide for 24 h, followed by fixation and staining with an antibody against the PD marker Hdm2. In both SJSA‐1 and HeLa cells, peptide uptake was concentration dependent (Figure 5 A). However, in SJSA‐1 cells, uptake exceeded that in HeLa cells by up to one order of magnitude. Peptide uptake showed a strong positive correlation with the presence of the target in both the cytoplasm and nucleus (Figure 5B). In addition, the fluorescence micrographs support the idea that the nuclear localization of the peptide coincides with the presence of the target (Supporting Information Figures S13, S14). These data indicate that the cytoplasmic and nuclear accumulation of the peptide is not an intrinsic characteristic of the stapled peptide. Instead, it is caused by the capture and retention of peptide due to interaction with the target. In‐line with this hypothesis, CF1a, which interacted more weakly with Hdm2, also showed less retention inside the cells (Supporting Information Figure S15).
Figure 5.
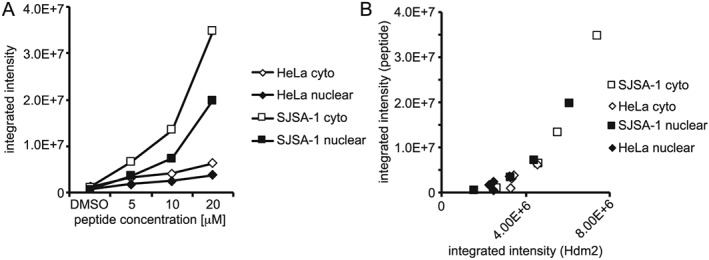
Correlation of peptide uptake with Hdm2 expression. After treatment of SJSA‐1 and HeLa cells using the indicated concentrations of the CF‐labelled CF2a peptide for 24 h, the cells were washed twice, fixed and stained with a specific antibody against the PD marker Hdm2 linked with a red fluorescent label. (A) Dose dependence of peptide uptake and (B) correlation of peptide uptake and Hdm2 expression. The figure shows the result of one representative experiment.
Discussion
Optimized synthesis protocols and preparative HPLC provided highly pure stapled peptide regioisomers. The olefin metathesis yielded both the cis‐ and trans‐stereoisomers, an observation that had not been stated in previous publications on the biological activity of these peptides (Brown et al., 2013; Chang et al., 2013). Therefore, we assume that these previous publications referred to a mixture of both stereoisomers. As shown by our biochemical assays, the stereoisomers showed only little difference in activity. We did not aim to optimize the reaction conditions to selectively prepare a specific derivative of the peptides used in this study. However, the strong sequence dependence of the olefin metathesis, in particular for solid‐phase stapling, indicates that if this had been the aim, an individual optimization had been required.
In the biochemical assay, the stapling improved target recognition. However, an enhancement by a factor of only three in both, the biochemical and cellular assays was less than expected. This can be explained by a helical preorganization of the linear peptide due to the presence of two α‐methylated building blocks, which are known to promote this conformation. The comparison of the cellular uptake of the stapled peptides with that of CPP R9 led to some interesting findings. In all tested cell lines, R9 showed more efficient uptake than the stapled peptides after 30 min incubation. In addition, only R9 had the capacity to induce rapid cytosolic entry at higher peptide concentrations, while the stapled peptides and their linear counterparts were restricted to punctate endo‐lysosomal staining. In contrast, after 24 h, the cellular uptake for the stapled peptides exceeded that of R9. This more effective intracellular retention is in agreement with what we had observed for bicyclic CPPs. In the case of short incubation times, uptake of R9 was also more effective than of cyclic peptides, while over long incubation times, the latter outperformed R9 (Wallbrecher et al., 2014). As R9 is proteolytically rather unstable, the enhanced long‐term accumulation of the stapled peptides is therefore most likely attributable to their higher proteolytic stability. All uptake experiments were conducted in the presence of serum, refuting earlier claims that entry of stapled peptides depends on disruption of membrane integrity in serum‐free conditions (Li et al., 2014).
Interestingly, the stapled peptides (especially CF2a) showed a unique association with intracellular membranes in HEK293 and HeLa cells after 24 h incubation, which we have not observed for any other fluorescein‐labelled peptide before. Therefore, it is also very unlikely that this distribution is a consequence of the fluorophore. Even though we did not attempt to identify the subcellular compartment in detail, the observed pattern suggests a staining of the endoplasmic reticulum, possibly mediated through the hydrophobic staple. In support of this hypothesis, the linear peptide showed a more vesicular staining pattern in HeLa cells.
In SJSA‐1 cells, an accumulation of nuclear fluorescence was observed only for the stapled peptides. The colocalization study confirmed the induction and nuclear localization of Hdm2, which is entirely compatible with this experimental finding. This result can best be explained by the p53/Hdm2 dependence of this cell line. The cytoplasmic and nuclear localization is therefore not an intrinsic characteristic of the stapled peptides but rather reflects retention through target binding. This interpretation is further supported by the fact that, in SJSA‐1 cells, the linear peptides also showed some homogenous nuclear fluorescence, which was not observed in HeLa or HEK293 cells.
Overall, the analysis of the time‐dependent changes in subcellular localization across the cell lines suggests a model in which the stapled peptides enter the cells by endocytosis. However, the entry of the stapled peptides is much less efficient than the uptake of nona‐arginine. Leakage out of the endosomes and accumulation inside the cytosol allows the association of the intact peptide with its target, and this is more pronounced for the stapled version. A similar relocalization of a stapled peptide from vesicles at a 4 h time pointing to a mitochondrial association at 24 h has already been described (Walensky et al., 2004).
While this manuscript was in preparation, Walensky et al. published a systematic analysis of biophysical determinants governing the uptake of stapled peptides (Bird et al., 2016). Using HPLC, the authors identified an optimum range of hydrophobicity for high uptake and low toxicity. In addition, the staple should ideally be placed at the amphipathic boundary, a condition which is met for the stapled peptides that we studied. It would be interesting to investigate to what extent variation of these characteristics also affects intracellular targeting and trafficking.
To conclude, our findings on the rather inefficient cellular uptake have important implications for the further clinical development of stapled peptides. The peptides need to be kept in circulation long enough to enable sufficient cellular entry. Due to their enlarged hydrophobic surface area, there should be sufficient plasma protein binding to fulfil this requirement. Given the high potency of the stapled peptides used for this study, cytoplasmic delivery represents the major challenge for further improvements. Therefore, future studies on stapled peptides should focus on a better understanding of the factors that promote cellular uptake and endosomal release. The higher intracellular activity of peptide CF2a compared with that of CF1a, demonstrates that such differences exist. Both peptides showed almost identical in vitro binding potency but behaved quite differently with respect to activity in the cellular assay, by about a factor of 10 at 5 μM.
Author contributions
T.V. and R.B. designed the experiments and wrote the paper, R.W. conducted the cellular uptake studies and analysed the data, P.C. and T.S. conducted biochemical assays and analysed the data abd S.R. performed the cellular bioactivity measurements and analysed the data.
Conflict of interest
The authors declare no conflicts of interest.
Declaration of transparency and scientific rigour
This Declaration acknowledges that this paper adheres to the principles for transparent reporting and scientific rigour of preclinical research recommended by funding agencies, publishers and other organisations engaged with supporting research.
Supporting information
Figure S1 LC‐MS of 1a.
Figure S2 LC‐MS of 1b.
Figure S3 LC‐MS of CF1a.
Figure S4 LC‐MS of 2a.
Figure S5 LC‐MS of 2b.
Figure S6 LC‐MS of CF2a.
Figure S7 LC‐MS of 3.
Figure S8 LC‐MS of CF3.
Figure S9 LC‐MS of 4.
Figure S10 LC‐MS of CF4.
Figure S11 Intracellular distribution of stapled peptides after a 30 min incubation. Cells were incubated with 5 μM of the peptides in RPMI + 10 % FCS, washed and confocal images were recorded. Fluorescein‐labeled R9 was used as a reference. Scale bar denotes 20 μm. The figure shows one representative experiment of two independent repetitions.
Figure S12 Intracellular distribution of stapled peptides after a 24 h incubation. Cells were incubated with 5 μM of the CF‐labeled peptides in RPMI + 10 % FCS, washed and confocal images were recorded. R9 was used as a control CPP. The bars indicate the size. In comparison to 20 μM, different contrast settings were used to improve visualization. The figure shows one representative experiments of three independent repetitions.
Figure S13 Colocalization of CF2a and Hdm2 in SJSA‐1 cells. After treatment of cells with the carboxyfluorescein‐labeled peptide at the indicated concentrations or DMSO control, cells were fixed, stained for detection of nuclei using DAPI and for Hdm2 using immunofluorescence and imaged by multi‐channel fluorescence microscopy (right panels). (A) Correlation of integrated fluorescein fluorescence in the nucleus and cytoplasm. (B, C) Correlation of integrated Hdm2 fluorescence in the nucleus versus carboxyfluorescein fluorescence in the cytoplasm (B) and in the nucleus (C).
Figure S14 Colocalization of CF2a and Hdm2 in HeLa cells. After treatment of cells with the carboxyfluorescein‐labeled peptide at the indicated concentrations or DMSO control, cells were fixed, stained for detection of nuclei using DAPI and for Hdm2 using immunofluorescence and imaged by multi‐channel fluorescence microscopy (right panels). (A) Correlation of integrated fluorescein fluorescence in the nucleus and cytoplasm. (B, C) Correlation of integrated Hdm2 fluorescence in the nucleus versus carboxyfluorescein fluorescence in the cytoplasm (B) and in the nucleus (C).
Figure S15 Colocalization of the labeled peptide CF1a with the PD marker Hdm2. After treatment of SJSA1 cells for 24 h with the carboxyfluorescein‐labeled peptide at the indicated concentrations, the cells were fixed and stained with a specific antibody against the PD marker Hdm2 linked with a red fluorescent label.
Table S1 Calculated and observed masses for the investigated peptides.
The supporting information provides fifteen figures providing HPLC traces and mass spectrometry spectra of the peptides, fluorescence micrographs demonstrating the peptide uptake at 5 μM after 30 min (Figure S11) and 24 h (Figure S12), and shows sample data for the high content screening for SJSA‐1 (Figure S13, Figure S15) and HeLa cells (Figure S14).
Acknowledgements
The excellent support of Roman Wille and Dieter Oser for peptide synthesis and the contributions of Monika Grueninger and Simon Baer for the tissue culture work at Novartis are gratefully acknowledged. For the NMR analyses, we appreciate the professional work carried out by Thomas Lochmann and Lukas Oberer.
Wallbrecher, R. , Chène, P. , Ruetz, S. , Stachyra, T. , Vorherr, T. , and Brock, R. (2017) A critical assessment of the synthesis and biological activity of p53/human double minute 2‐stapled peptide inhibitors. British Journal of Pharmacology, 174: 2613–2622. doi: 10.1111/bph.13834.
References
- Azzarito V, Long K, Murphy NS, Wilson AJ (2013). Inhibition of alpha‐helix‐mediated protein–protein interactions using designed molecules. Nat Chem 5: 161–173. [DOI] [PubMed] [Google Scholar]
- Bird GH, Mazzola E, Opoku‐Nsiah K, Lammert MA, Godes M, Neuberg DS et al. (2016). Biophysical determinants for cellular uptake of hydrocarbon‐stapled peptide helices. Nat Chem Biol 12: 845–852. [DOI] [PMC free article] [PubMed] [Google Scholar]
- Brock R (2014). The uptake of arginine‐rich cell‐penetrating peptides: putting the puzzle together. Bioconjug Chem 25: 863–868. [DOI] [PubMed] [Google Scholar]
- Brown CJ, Quah ST, Jong J, Goh AM, Chiam PC, Khoo KH et al. (2013). Stapled peptides with improved potency and specificity that activate p53. ACS Chem Biol 8: 506–512. [DOI] [PubMed] [Google Scholar]
- Chang YS, Graves B, Guerlavais V, Tovar C, Packman K, To KH et al. (2013). Stapled alpha‐helical peptide drug development: a potent dual inhibitor of MDM2 and MDMX for p53‐dependent cancer therapy. Proc Natl Acad Sci U S A 110: E3445–E3454. [DOI] [PMC free article] [PubMed] [Google Scholar]
- Chu Q, Moellering RE, Hilinski GJ, Kim Y‐W, Grossmann TN, Yeh JT‐H et al. (2015). Towards understanding cell penetration by stapled peptides. Med Chem Commun 6: 111–119. [Google Scholar]
- Copolovici DM, Langel K, Eriste E, Langel U (2014). Cell‐penetrating peptides: design, synthesis, and applications. ACS Nano 8: 1972–1994. [DOI] [PubMed] [Google Scholar]
- Curtis MJ, Bond RA, Spina D, Ahluwalia A, Alexander SP, Giembycz MA et al. (2015). Experimental design and analysis and their reporting: new guidance for publication in BJP. Br J Pharmacol 172: 3461–3471. [DOI] [PMC free article] [PubMed] [Google Scholar]
- Duchardt F, Fotin‐Mleczek M, Schwarz H, Fischer R, Brock R (2007). A comprehensive model for the endocytic uptake of cationic cell‐penetrating peptides. Traffic 8: 848–866. [DOI] [PubMed] [Google Scholar]
- Edwards AL, Wachter F, Lammert M, Huhn AJ, Luccarelli J, Bird GH et al. (2015). Cellular uptake and ultrastructural localization underlie the pro‐apoptotic activity of a hydrocarbon‐stapled BIM BH3 peptide. ACS Chem Biol 10: 2149–2157. [DOI] [PMC free article] [PubMed] [Google Scholar]
- El‐Andaloussi SE, Lehto T, Mager I, Rosenthal‐Aizman K, Oprea II, Simonson OE et al. (2011). Design of a peptide‐based vector, PepFect6, for efficient delivery of siRNA in cell culture and systemically in vivo . Nucleic Acids Res 39: 3972–3987. [DOI] [PMC free article] [PubMed] [Google Scholar]
- Jeay S, Gaulis S, Ferretti S, Bitter H, Ito M, Valat T et al. (2015). A distinct p53 target gene set predicts for response to the selective p53‐HDM2 inhibitor NVP‐CGM097. Elife 4 https://doi.org/10.7554/eLife.06498. [DOI] [PMC free article] [PubMed] [Google Scholar]
- Kim YW, Verdine GL (2009). Stereochemical effects of all‐hydrocarbon tethers in i,i+4 stapled peptides. Bioorg Med Chem Lett 19: 2533–2536. [DOI] [PubMed] [Google Scholar]
- Kosuge M, Takeuchi T, Nakase I, Jones AT, Futaki S (2008). Cellular internalization and distribution of arginine‐rich peptides as a function of extracellular peptide concentration, serum, and plasma membrane associated proteoglycans. Bioconjug Chem 19: 656–664. [DOI] [PubMed] [Google Scholar]
- Li YC, Rodewald LW, Hoppmann C, Wong ET, Lebreton S, Safar P et al. (2014). A versatile platform to analyze low‐affinity and transient protein‐protein interactions in living cells in real time. Cell Rep 9: 1946–1958. [DOI] [PMC free article] [PubMed] [Google Scholar]
- Milletti F (2012). Cell‐penetrating peptides: classes, origin, and current landscape. Drug Discov Today 17: 850–860. [DOI] [PubMed] [Google Scholar]
- Muppidi A, Doi K, Ramil CP, Wang HG, Lin Q (2014). Synthesis of cell‐permeable stapled BH3 peptide‐based Mcl‐1 inhibitors containing simple aryl and vinylaryl cross‐linkers. Tetrahedron 70: 7740–7745. [DOI] [PMC free article] [PubMed] [Google Scholar]
- Schafmeister CE, Po J, Verdine GL (2000). An all‐hydrocarbon cross‐linking system for enhancing the helicity and metabolic stability of peptides. J Am Chem Soc 122: 5891–5892. [Google Scholar]
- Tunnemann G, Martin RM, Haupt S, Patsch C, Edenhofer F, Cardoso MC (2006). Cargo‐dependent mode of uptake and bioavailability of TAT‐containing proteins and peptides in living cells. FASEB J 20: 1775–1784. [DOI] [PubMed] [Google Scholar]
- Verdurmen WP, Thanos M, Ruttekolk IR, Gulbins E, Brock R (2010). Cationic cell‐penetrating peptides induce ceramide formation via acid sphingomyelinase: implications for uptake. J Control Release 147: 171–179. [DOI] [PubMed] [Google Scholar]
- Vorherr T (2015). Modifying peptides to enhance permeability. Future Med Chem 7: 1009–1021. [DOI] [PubMed] [Google Scholar]
- Wadia JS, Stan RV, Dowdy SF (2004). Transducible TAT‐HA fusogenic peptide enhances escape of TAT‐fusion proteins after lipid raft macropinocytosis. Nat Med 10: 310–315. [DOI] [PubMed] [Google Scholar]
- Walensky LD, Bird GH (2014). Hydrocarbon‐stapled peptides: principles, practice, and progress. J Med Chem 57: 6275–6288. [DOI] [PMC free article] [PubMed] [Google Scholar]
- Walensky LD, Kung AL, Escher I, Malia TJ, Barbuto S, Wright RD et al. (2004). Activation of apoptosis in vivo by a hydrocarbon‐stapled BH3 helix. Science 305: 1466–1470. [DOI] [PMC free article] [PubMed] [Google Scholar]
- Wallbrecher R, Depre L, Verdurmen WP, Bovee‐Geurts PH, van Duinkerken RH, Zekveld MJ et al. (2014). Exploration of the design principles of a cell‐penetrating bicylic peptide scaffold. Bioconjug Chem 25: 955–964. [DOI] [PubMed] [Google Scholar]
Associated Data
This section collects any data citations, data availability statements, or supplementary materials included in this article.
Supplementary Materials
Figure S1 LC‐MS of 1a.
Figure S2 LC‐MS of 1b.
Figure S3 LC‐MS of CF1a.
Figure S4 LC‐MS of 2a.
Figure S5 LC‐MS of 2b.
Figure S6 LC‐MS of CF2a.
Figure S7 LC‐MS of 3.
Figure S8 LC‐MS of CF3.
Figure S9 LC‐MS of 4.
Figure S10 LC‐MS of CF4.
Figure S11 Intracellular distribution of stapled peptides after a 30 min incubation. Cells were incubated with 5 μM of the peptides in RPMI + 10 % FCS, washed and confocal images were recorded. Fluorescein‐labeled R9 was used as a reference. Scale bar denotes 20 μm. The figure shows one representative experiment of two independent repetitions.
Figure S12 Intracellular distribution of stapled peptides after a 24 h incubation. Cells were incubated with 5 μM of the CF‐labeled peptides in RPMI + 10 % FCS, washed and confocal images were recorded. R9 was used as a control CPP. The bars indicate the size. In comparison to 20 μM, different contrast settings were used to improve visualization. The figure shows one representative experiments of three independent repetitions.
Figure S13 Colocalization of CF2a and Hdm2 in SJSA‐1 cells. After treatment of cells with the carboxyfluorescein‐labeled peptide at the indicated concentrations or DMSO control, cells were fixed, stained for detection of nuclei using DAPI and for Hdm2 using immunofluorescence and imaged by multi‐channel fluorescence microscopy (right panels). (A) Correlation of integrated fluorescein fluorescence in the nucleus and cytoplasm. (B, C) Correlation of integrated Hdm2 fluorescence in the nucleus versus carboxyfluorescein fluorescence in the cytoplasm (B) and in the nucleus (C).
Figure S14 Colocalization of CF2a and Hdm2 in HeLa cells. After treatment of cells with the carboxyfluorescein‐labeled peptide at the indicated concentrations or DMSO control, cells were fixed, stained for detection of nuclei using DAPI and for Hdm2 using immunofluorescence and imaged by multi‐channel fluorescence microscopy (right panels). (A) Correlation of integrated fluorescein fluorescence in the nucleus and cytoplasm. (B, C) Correlation of integrated Hdm2 fluorescence in the nucleus versus carboxyfluorescein fluorescence in the cytoplasm (B) and in the nucleus (C).
Figure S15 Colocalization of the labeled peptide CF1a with the PD marker Hdm2. After treatment of SJSA1 cells for 24 h with the carboxyfluorescein‐labeled peptide at the indicated concentrations, the cells were fixed and stained with a specific antibody against the PD marker Hdm2 linked with a red fluorescent label.
Table S1 Calculated and observed masses for the investigated peptides.
The supporting information provides fifteen figures providing HPLC traces and mass spectrometry spectra of the peptides, fluorescence micrographs demonstrating the peptide uptake at 5 μM after 30 min (Figure S11) and 24 h (Figure S12), and shows sample data for the high content screening for SJSA‐1 (Figure S13, Figure S15) and HeLa cells (Figure S14).