

Abstract
Background
In order to identify factors that stimulate arteriogenesis after ischemia, we followed gene expression profiles in two extreme models for collateral artery formation over 28 days after hindlimb ischemia, namely “good‐responding” C57BL/6 mice and “poor‐responding” BALB/c mice.
Methods and Results
Although BALB/c mice show very poor blood flow recovery after ischemia, most known proarteriogenic genes were upregulated more excessively and for a longer period than in C57BL/6 mice. In clear contrast, chemokine genes Ccl19, Ccl21a, and Ccl21c and the chemokine receptor CCR7 were upregulated in C57BL/6 mice 1 day after hindlimb ischemia, but not in BALB/C mice. CCL19 and CCL21 regulate migration and homing of T lymphocytes via CCR7. When subjecting CCR7−/−/LDLR −/− mice to hindlimb ischemia, we observed a 20% reduction in blood flow recovery compared with that in LDLR −/− mice. Equal numbers of α‐smooth muscle actin–positive collateral arteries were found in the adductor muscles of both mouse strains, but collateral diameters were smaller in the CCR7−/−/LDLR −/−. Fluorescence‐activated cell sorter analyses showed that numbers of CCR7+ T lymphocytes (both CD4+ and CD8+) were decreased in the spleen and increased in the blood at day 1 after hindlimb ischemia in LDLR −/− mice. At day 1 after hindlimb ischemia, however, numbers of activated CD4+ T lymphocytes were decreased in the draining lymph nodes of LDLR −/− mice compared with CCR7−/−/LDLR −/− mice.
Conclusions
These data show that CCR7‐CCL19/CCL21 axis facilitates retention CD4+ T lymphocytes at the site of collateral artery remodeling, which is essential for effective arteriogenesis.
Keywords: arteriogenesis, CCL19, CCL21, CCR7, chemokine, chemoreceptor, hindlimb ischemia, peripheral artery disease
Subject Categories: Angiogenesis, Peripheral Vascular Disease
Introduction
Neovascularization, ie, arteriogenesis and angiogenesis, is the body's natural mechanism to repair blood flow and tissue perfusion after ischemia. Whereas angiogenesis, the hypoxia‐induced sprouting of new capillaries from the existing microvasculature, can only improve distribution of the available blood through ischemic tissues, arteriogenesis can restore the actual blood supply to tissues downstream of an arterial occlusion. Arteriogenesis is defined as the maturation of preexisting arterioles into fully functional mature collateral arteries.1 Arteriogenesis is triggered by increased shear stress and subsequent inflammatory processes in arterioles. Under healthy conditions, blood flow through the arteriole network is extremely low. But, when an artery becomes occluded, blood is redirected through the arterioles, drastically increasing blood flow, fluid shear stress, and circumferential stretch on the arteriole wall. Increased shear stress stimulates endothelial cells in the arteriole wall to express adhesion molecules and secrete chemokines and cytokines. This leads to the attraction, adhesion, and invasion of monocytes/macrophages,2, 3, 4, 5, 6, 7 but also of other circulating inflammatory cells, including populations of CD4+, CD8+, and regulatory T lymphocytes.6, 8, 9, 10, 11 These inflammatory cells play a critical role in arteriogenesis. They produce growth factors and matrix metalloproteases to enable rearrangement of the extracellular matrix, providing space for the maturing collaterals to grow. Smooth muscle cells change their phenotype from contractile to proliferative, causing expansion and growth of the vessel wall. The subsequent increase in vessel diameter eventually causes a decrease in fluid shear stress and circumferential stretch, which results in cessation of the arteriogenic process. Smooth muscle cells in the newly formed tunica media and activated fibroblasts in the adventitia secrete matrix components such as collagen and elastin to reconstitute the vessel wall.
Arteriogenesis often fails to fully restore tissue perfusion in patients with peripheral arterial disease. Identification of novel targets to stimulate arteriogenesis may offer new therapeutic opportunities for patients with severe peripheral arterial disease and critical limb ischemia.
It is well‐established that there are large differences in postischemic blood flow recovery between C57BL/6 and BALB/c mice.8, 12 In 2007, Chalothorn et al13 first showed that both the number of preexisting collateral arterioles present and their capacity to remodel into mature collateral arteries varies greatly between different mouse strains. C57BL/6 mice have a high density of preexisting collateral arteries and possess excellent remodeling capacity, when triggered. BALB/c mice, on the other hand, have virtually no preexisting collateral arteries and, on top of that, display a severely hampered response when triggered.13, 14 By whole genome expression analysis, we made use of the difference between both mouse strains to identify pathways that are crucial for collateral artery remodeling after induction of ischemia.
Via the chemokine receptor CCR7, chemokines CCL19 and CCL21 regulate migration and homing of dendritic cells and T lymphocytes to lymphoid and peripheral tissues during inflammatory reactions.15, 16, 17 In the current study, we show that the CCR7‐CCL19/CCL21 axis is differentially regulated at the site of arteriogenesis between C57BL/6 and BALB/c mice after hindlimb ischemia (HLI). We further demonstrate that the CCR7‐CCL19/CCL21 axis is an important contributor to effective arteriogenesis after ischemia by facilitating appropriate tissue retention of CCR7+ T lymphocytes at the site of collateral arteriole remodeling.
Methods
HLI Model
All animal experiments were approved by the committee on animal welfare of the Leiden University Medical Center (Leiden, The Netherlands).
Mice (BALB/c, C57BL/6, C57BL/6‐LDLR−/− or C57BL/6‐LDLR−/−/CCR7−/−, all male, aged 8–12 weeks) were anesthetized by intraperitoneal injection of midazolam (8 mg/kg, Roche Diagnostics), medetomidine (0.4 mg/kg, Orion), and fentanyl (0.08 mg/kg, Janssen Pharmaceuticals). Unilateral HLI was induced by electrocoagulation of the left femoral artery proximal to the superficial epigastric arteries. After surgery, anesthesia was antagonized with flumazenil (0.7 mg/kg, Fresenius Kabi), atipamezole (3.3 mg/kg, Orion), and buprenorphine (0.2 mg/kg, MSD Animal Health).
Blood flow recovery to the paw was measured over time using laser Doppler perfusion imaging (LDPI) (Moore Instruments). Mice were anaesthetized by intraperitoneal injection of midazolam (8 mg/kg) and medetomidine (0.4 mg/kg). Mice were placed in a double‐glazed pot and perfused with water at 37°C for 5 minutes prior to each measurement. After LDPI, anesthesia was antagonized by subcutaneous injection of flumazenil (0.7 mg/kg) and atipamezole (3.3 mg/kg). LDPI measurements in the treated paw were normalized to measurements of the untreated paw, as internal control.
Serum cholesterol levels were determined before surgery (Roche Diagnostics).
Aortic Ring Assay
Mouse aortic ring assays were performed as previously described.18 In brief, the thoracic aorta was removed from 8‐ to 10‐week‐old mice and transferred to a petri dish containing Opti‐MEM (Gibco). The surrounding fat and branching vessels were carefully removed and the aorta was flushed with Opti‐MEM (Gibco). Aortic rings of 0.5 to 1 mm were transferred to fresh Opti‐MEM and serum‐starved overnight. Collagen (type I, Millipore) was diluted to a concentration of 1 mg/mL with 1x DMEM (Gibco) and pH was adjusted with 5 N NaOH. Ninety‐six well‐plates were coated with 75 μL collagen matrix. Rings were transferred into the wells and after 1 hour, 150 μL Opti‐MEM supplemented with 2.5% FBS (PAA, Austria), penicillin‐streptomycin (PAA, Austria), and 30 ng/mL vascular endothelial growth factor (in‐house production and purification) was added to each well. The medium was changed first on day 3, then every other day. Microvessel outgrowth was quantified after 7 days by live phase‐contrast microscopy (Axiovert 40C, Carl Zeiss). Starting from a specific point on the ring, each microvessel emerging from the ring was counted as a sprout and individual branches arising from each microvessel counted as a separate sprout, working around the ring clockwise.
An in vivo angiogenesis analysis was previously described.19 Cold (4°C) growth factor reduced Matrigel (0.5 mL) (BD Biosciences) was injected into the subcutaneous space on the dorsal side of LDLR−/−/CCR7−/− or LDLR−/− mice on both the left and right flank under anesthesia induced by isoflurane inhalation. Mice were sacrificed 7 days postimplantation. Matrigel plugs were excised and processed for histological analysis. Paraffin sections (5 μm) were stained with hematoxylin‐phloxine‐saffron or anti‐CD31 (PECAM, Abcam, Cambridge, UK). Vascular ingrowth was scored by measuring the maximum ingrowth depth of capillary structures in 6 hematoxylin‐phloxine‐saffron–stained sections per plug (1 plug per mouse, 7 mice per group, expressed in μm). Quantification was performed in a double‐blinded fashion by 2 individuals using morphometric image analysis methods (Qwin, Leica Imaging Systems). The endothelial nature of the infiltrating cells was confirmed by staining for CD31.
Gene Expression
C57BL/6 and BALB/c mice were sacrificed by cervical dislocation and the adductor muscle group medial to the femur was excised en bloc before (pretreatment=pt) and at different time points (days 1, 3, 7, 14, and 28) after induction of HLI. The tissue was snap‐frozen, crushed using mortar and pestle, and homogenized over a Qiashredder (Qiagen). Total RNA was extracted using RNeasy fibrous tissue minikit (Qiagen) and RNA integrity was checked by NanoDrop (NanoDrop Technologies) and Bioanalyzer (Agilent Technologies).
For whole‐genome expression profiling, amplified biotinylated RNA was generated using the Illumina TotalPrep RNA Amplification Kit. For array analysis, MouseWG‐6 v2.0 Expression BeadChips (Illumina), which contain more than 45 200 transcripts, were used. Expression levels were log2‐transformed and quantile normalized. Transcripts showing background intensity (log2 expression of <6.75) both at baseline and after induction of HLI, were removed from the analysis. Genes were collapsed on gene symbol, thus averaging transcript variants. To detect differences in fold change expression relative to pt between the two mouse strains, values were expressed as ratios relative to pt and all samples were compared with all other samples by Bayes‐regularized 1‐way ANOVA (developed for microArray data with multiple conditions), with additional Tukey's honest significant difference post hoc multiple comparisons test to determine which pairs of groups showed differential expression, applying a P value of 0.05.20 Statistical Analysis of MicroArray Data21 was used for a multiclass analysis on all time points within each mouse strain to detect significant changes in expression at 1 or more time points. The immune responses of BALB/c and C57BL/6 mice were compared by selecting all gene names containing at least 1 of the following terms: interleukin, chemokine, interferon, transforming growth factor, and tumor necrosis factor.
For individual gene expression, total RNA was reverse‐transcribed using High‐Capacity RNA‐to‐cDNA Kit (Applied Biosystems). Quantitative polymerase chain reaction (qPCR) was performed on the ABI 7500 Fast system, using commercially available TaqMan gene expression assays for murine CCL19, CCL21a, and CCR7 (Applied Biosystems). Cycle threshold values were normalized against HPRT1.
Preexisting Collateral Density
Methods for measurement of collateral density between the anterior cerebral artery, middle cerebral artery, and posterior cerebral artery were described elsewhere.14, 22, 23 Briefly, animals were anesthetized by intraperitoneal injection of midazolam (8 mg/kg, Roche Diagnostics), medetomidine (0.4 mg/kg, Orion), and fentanyl (0.08 mg/kg, Janssen Pharmaceutica) and heparinized systemically. Maximal vasodilation was accomplished by canulation of the thoracic aorta and infusion of sodium‐nitroprusside (30 μg/mL) and papaverine (40 μg/mL) in PBS at ≈100 mm Hg prior to vascular casting. Yellow Microfil (Flow Tech Inc.) with adjusted viscosity, preventing capillary and venous filling, was infused under a stereomicroscope after craniotomy. The dorsal cerebral circulation was fixed with topical application of 4% paraformaldehyde to prevent any reduction in vessel dimensions after Microfil injection. Whole brains were fixed overnight in 4% paraformaldehyde and subsequently incubated in Evans Blue (2 μg/mL in 4% paraformaldehyde) for several days to improve contrast for visualization of the vasculature. Digital images were obtained of the dorsal brain surface and processed with ImageJ software (National Institutes of Health). Collateral density was calculated by determining the total number of pial collaterals between the anterior cerebral artery–middle cerebral artery, anterior cerebral artery–posterior cerebral artery, and middle cerebral artery–posterior cerebral artery and dividing by the dorsal surface area of the cerebral hemispheres. Areas that sustained damage, were incompletely filled, or were otherwise uncountable, were excluded from analysis.
Immunohistochemistry
For harvesting tissues, C57BL/6, LDLR−/−/CCR7−/−, and LDLR−/− mice were anesthetized by intraperitoneal injection of midazolam (8 mg/kg, Roche Diagnostics), medetomidine (0.4 mg/kg, Orion), and fentanyl (0.08 mg/kg, Janssen Pharmaceutica). Mice were sacrificed by exsanguination. The adductor muscle group and gastrocnemius muscle were harvested and snap‐frozen or fixed in 3.7% paraformaldehyde.
CCR7
Adductor muscle groups of wild‐type C57BL/6 mice before and 1 day after induction of HLI were used for histological analysis of CCR7+ cells using anti‐CCR7 (Abcam). Randomly photographed images were used to quantify the number of CCR7+ cells per section (total of 9 images of 3 sections per mouse).
Anti–α‐smooth muscle actin
Serial 5‐μm‐thick paraffin‐embedded sections were used for histological analysis of collateral artery number and size. Vessels at the midpoint of the adductor muscle group, stained using anti–α‐smooth muscle actin (anti–α‐SMA) (DAKO), are likely composed of collaterals but may also include arterioles of the opposing tree. Randomly photographed images through the central part of the adductor muscle group were used to quantify the number and lumen diameter of α‐SMA+ vessels using ImageJ software (total of 9 images of 3 sections per limb per mouse). To correct for nonperpendicularly cut sections, the circular lumen area of α‐SMA+ vessels was calculated from the lumen diameter measured at the narrowest point.
CD31
Serial frozen sections (6 μm) of ligated and nonligated gastrocnemius muscle (10 days after HLI) were fixed in ice‐cold acetone and used for histological analyses of capillary density. Sections were stained using anti‐CD31 (BD Biosciences). Randomly photographed images through the gastrocnemius muscles were used to quantify the number of CD31+ vessels per section using ImageJ software (total 6 sections per limb per mouse).
Fluorescent triple staining α‐SMA/CCL19/lymphatic vascular endothelial hyaluronan receptor‐1
Serial frozen sections (6 μm) were fixed in ice‐cold acetone after air drying. Before each staining, the tissue was blocked with a PBS solution of 3% BSA and 2% FCS to minimize nonspecific labeling. Sections were stained in the dark using anti–α‐SMA antibody conjugated with a Cy3 fluorochrome (Sigma), goat anti‐CCL19 antibody (R&D systems) with secondary anti‐goat antibody conjugated with an Alexa 488 fluorochrome (Molecular Probes), rat anti–lymphatic vascular endothelial hyaluronan receptor‐1 (LYVE‐1) antibody (eBiosciences) with secondary anti‐rat antibody conjugated with an APC‐labeled fluorochrome (eBiosciences), and Vectashield (Vector Labs) for cell nuclear staining. Randomly photographed images through the distal part of the adductor muscle group were taken on a, LSM700 microscope and contrast‐stretched using Zen 2009 software (Carl Zeiss).
Flow Cytometry
Blood, spleen, peritoneal leukocytes, and mesenteric lymph nodes were harvested from C57BL/6, BALB/c, and LDLR−/− mice. Blood, spleen, bone marrow, and nondraining lymph nodes were harvested before (pt) and 1 day after induction of HLI in LDLR−/−/CCCR7−/− and LDLR−/− mice. Draining lymph nodes were dissected from the ipsilateral inguinal region, nondraining form the contralateral iguinal region. Total circulating leukocytes were measured using a KX‐21N Hematology Analyzer (Sysmex). Tissues were minced through a 40‐μm cell strainer (BD Biosciences) to obtain single‐cell suspensions, which were resuspended in Iscove's Modified Dulbecco's Medium (Lonza) with 2% FCS. For DC‐specific cell surface staining, the spleen and lymph nodes were first perfused with collagenase (1 mg/mL) and DNase (0.02 mg/mL) for 10 minutes and minced. Erythrocytes were lysed and samples for intracellular staining were permeabilized. Fluorochrome‐conjugated monoclonal antibodies specific for CD3, CD4, CD8, CD11c, CD11b, CD19, CD25, CD86, CD115, FoxP3, Ly6C, Ly6G, B220, DX5, MHCII, CCR7, CCR2, F4/80, CD62L, IL12, IL10, NK1.1, and Tbet were used.
Statistical Analyses
Results are presented as mean±SEM. Comparisons between groups were performed using Student t test or 1‐way ANOVA. As LDPI measurements were performed on the same LDLR−/− and LDLR−/−/CCR7−/− mice over time, these data were also analyzed using a repeated measures two‐way ANOVA. Statistical analyses were performed using SPSS 17.0 software (SPSS Inc, Chicago, IL) and GraphPad Prism 6 (La Jolla, CA). P<0.05 values were considered statistically significant.
Results
Blood Flow Recovery in C57BL/6 and BALB/c Mice
HLI was induced in C57BL/6 and BALB/c mice by single coagulation of the left femoral artery and blood flow recovery was measured by LDPI (Figure 1A and 1B). As was previously reported,8, 12, 13, 14 blood flow recovery was heavily impaired in BALB/c mice directly after HLI (Figure 1C, P<0.001) and did not recover at all before termination at 28 days. C57BL/6 mice, on the other hand, made a full recovery within 7 days. The observed difference in residual flow between the 2 strains directly after femoral artery ligation confirms the previously reported differences in the number of preexisting collateral arterioles.13, 14 The difference in recovery rates further demonstrates the difference in remodeling capacity between the two strains.
Figure 1.
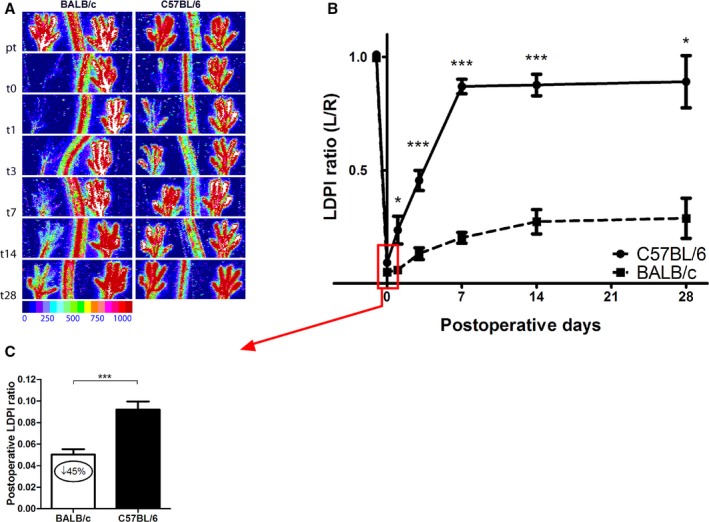
Blood flow recovery after hindlimb ischemia (HLI) in C57BL/6 vs BALB/c mice. A, Representative laser Doppler perfusion imaging (LAPI) of the paws of C57BL/6 and BALB/c mice before and after induction of HLI. B, Quantification of paw perfusion in C57BL/6 and BALB/c mice before and after induction of HLI. Values are expressed as the ratio of perfusion in the ligated over the unligated paw. BALB/c: n=17 (t0), n=4 (t1), n=10 (t3), n=6 (t7), n=3 (t14), and n=2 (t28). C57BL/6: n=19 (t0), n=4 (t1), n=15 (t3), n=12 (t7), n=9 (t14), and n=5 (t28). C, Perfusion ratios in C57BL/6 (n=19) and BALB/c (n=17) mice directly after femoral artery ligation. *P<0.05, ***P<0.001. t indicates days after induction.
Postischemic Gene Expression
In the HLI model, arteriogenesis takes place mainly in the adductor muscle. To include collateral arterial tissue, but also infiltrating leukocytes, but not the draining lymph nodes, we performed microarray whole‐genome expression analyses on total adductor muscle mRNA of C57BL/6 and BALB/c mice before (pt) and at days 1, 3, 7, 14, and 28 after induction of HLI (Figure 2). Of the 20.910 genes that were expressed above background signal, 3.729 genes were significantly upregulated or downregulated over time in C57BL/6 mice (significance analysis of microarrays, q<5%), of which 786 genes were upregulated already at day 1 after induction of HLI. In BALB/c mice, we observed a more exaggerated response; 6.876 genes were upregulated or downregulated over time, of which 809 genes were upregulated at day 1 (q<5%). Looking at the heatmap of those genes that are upregulated at day 1 in either C57BL/6 or BALB/c mice, or in both, it becomes apparent that there is great overlap in gene sets between the two strains (Figure 3A). However, where this upregulation is fast and transient in the C57BL/6, mice a delayed and prolonged response is observed in BALB/c mice.
Figure 2.
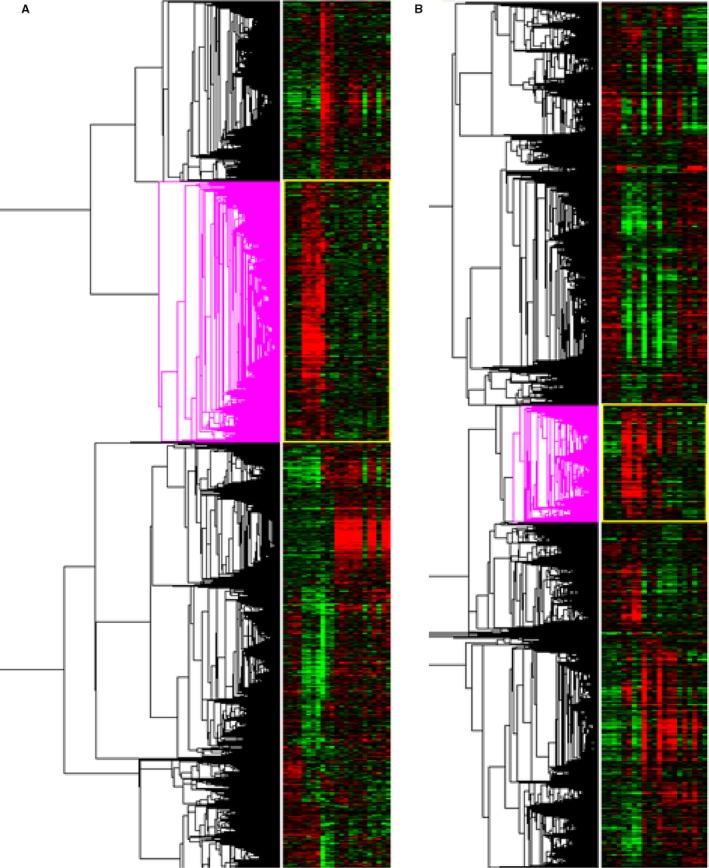
Whole‐genome expression analysis over time. A, Heatmap of gene regulation before and after induction of hindlimb ischemia (HLI) in C57BL/6 mice. The pink clustering shows genes that are significantly upregulated at day 1 after HLI. C57BL/6: n=4 (t0), n=4 (t1), n=3 (t3), n=3 (t7), n=4 (t14), and n=5 (t28). B, Heatmap of gene regulation before and after induction of HLI in BALB/c mice. The pink clustering shows genes that are significantly upregulated at day 1 after HLI. BALB/c: n=4 (t0), n=4 (t1), n=4 (t3), n=4 (t7), n=3 (t14), and n=2 (t28). t indicates days after induction.
Figure 3.
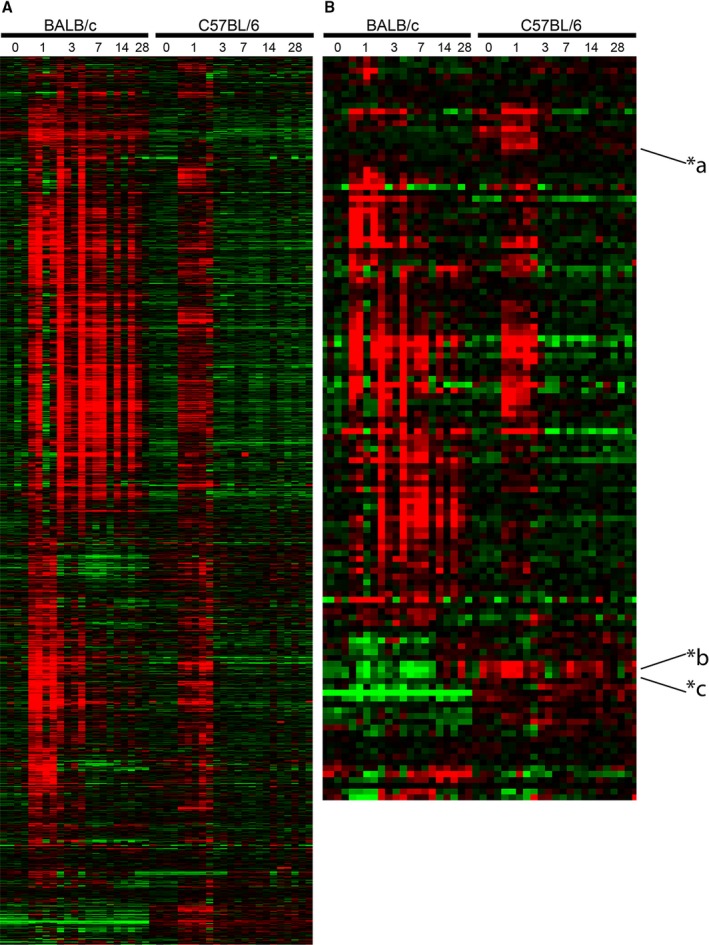
Whole‐genome expression analysis in C57BL/6 and BALB/c mice before and after induction of hindlimb ischemia (HLI). A, Heatmap of significantly upregulated genes at t1 compared with t0 in the adductor muscle of either BALB/c or C57BL/6 mice or in both, after induction of HLI. BALB/c: n=4 (t0), n=4 (t1), n=4 (t3), n=4 (t7), n=3 (t14), and n=2 (t28). C57BL/6: n=4 (t0), n=4 (t1), n=3 (t3), n=3 (t7), n=4 (t14), and n=5 (t28). B, Heatmap of inflammatory gene expression in C57BL/6 and BALB/c mice before and after induction of HLI. Gene definitions containing any of these criteria (interleukin, chemokine, interferon, transforming growth factor, tumor necrosis factor) were selected. Expression levels of each gene are presented relative to the median expression level across all samples; median‐centered. Red indicates a relative high, green a relative low, and black an intermediate expression. BALB/c: n=4 (t0), n=4 (t1), n=4 (t3), n=4 (t7), n=3 (t14), and n=2 (t28). C57BL/6: n=4 (t0), n=4 (t1), n=3 (t3), n=3 (t7), n=4 (t14), and n=5 (t28). *a=chemokine (C‐C motif) ligand 19 (Ccl19), *b=chemokine (C‐C motif) ligand 21c (leucine) (Ccl21c), and *c=chemokine (C‐C motif) ligand 21a (Ccl21a). t indicates days after induction.
As arteriogenesis is an inflammation‐driven process, we selected genes related to inflammation that significantly changed over time in either C57BL/6 mice or BALB/c mice or in both (Figure 3B). As shown before,24, 25, 26, 27 BALB/c and C57BL/6 mice demonstrated several differences in their immune response over time. Similar to what is described above, the inflammatory response of the C57BL/6 mice was fast but transient, whereas this response was prolonged in BALB/c mice. However, we observed that chemokine genes Ccl19, Ccl21a, and Ccl21c were upregulated in C57BL/6 but not BALB/c mice.
Expression of the CCR7‐CCL19/CCL21 Axis
To verify at which time points the expression of Ccl19, Ccl21a, and Ccl21c was more induced in the adductor muscle of C57BL/6 mice compared with BALB/c mice, we performed a Bayesian ANOVA analysis on all expressed genes at all time points, relative to baseline expression levels. After only 1 day of HLI, the expression of the 3 chemokines was significantly more induced in C57BL/6 versus BALB/C adductor muscle (P=0.00002, 0.0017, and 0.019, respectively; data not shown). We confirmed these findings by real‐time qPCR (RT/qPCR) in the adductor muscle (Figure 4A through 4C). RT/qPCR showed that Ccr7 was also upregulated in the adductor muscle of C57BL/6 mice (Figure 4C). This response was transient and levels had normalized by day 3. In the ischemic gastrocnemius muscle, this pattern was not observed, but Ccl19 and Ccr7 showed delayed and prolonged upregulation in BALB/c mice (Figure 4D through 4F).
Figure 4.
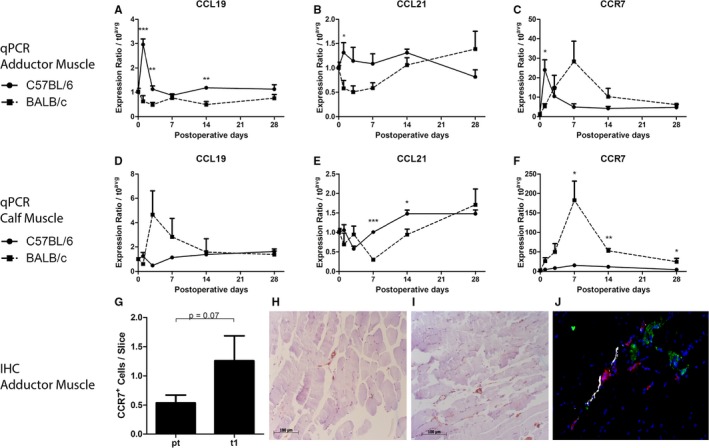
Expression of the CCL19/CCL21‐CCR7 axis. A through C, Relative expression of Ccl19, Ccl21c, and Ccr7, respectively, in the adductor muscles of C57BL/6 and BALB/c mice before and after induction of hindlimb ischemia (HLI), as measured by real‐time quantitative polymerase chain reaction (qPCR). BALB/c: n=4 (t0), n=4 (t1), n=4 (t3), n=4 (t7), n=3 (t14), and n=2 (t28). C57BL/6: n=4 (t0), n=4 (t1), n=3 (t3), n=3 (t7), n=4 (t14), and n=5 (t28). D through F, Relative expression of Ccl19, Ccl21c, and Ccr7, respectively, in the calf muscles of C57BL/6 and BALB/c mice before and after induction of HLI, as measured by real‐time qPCR. BALB/c: n=4 (t0), n=4 (t1), n=4 (t3), n=4 (t7), n=3 (t14), and n=3 (t28). C57BL/6: n=4 (t0), n=4 (t1), n=4 (t3), n=4 (t7), n=4 (t14), and n=5 (t28). G, Number of CCR7+ cells in the adductor muscle of C57BL/6 mice before (n=6) vs after induction of HLI (n=6). H and I, Representative images of CCR7+ cells in the adductor muscle of C57BL/6 mice before (H) and 1 day after (I) induction of HLI. J, Representative image of fluorescent stainings for α‐smooth muscle actin (red), CCL19 (green), and lymphatic vascular endothelial hyaluronan receptor‐1 (white) in the adductor muscle of C57BL6/6 mice. *P<0.05, **P<0.01, ***P<0.001. IHC indicates immunohistochemistry; t, days after induction.
When staining for CCR7 in the perivascular space around remodeling collateral arterioles in the adductor muscle of C57BL/6, 1 day after induction of ischemia, we observed a trend towards increased numbers of CCR7+ cells, compared with before the induction of ischemia (Figure 4G, P=0.07). Because of the involvement in migration of lymphocytes from the circulation, through the peripheral tissue into lymphoid vessels, we then performed a triple staining for CCL19 with α‐SMA and LYVE‐1 as a marker of lymphoid vessels. CCL19 did not colocalize with lymphoid vessels, but was observed predominantly in the muscle tissue, in close proximity to α‐SMA+ arterioles (Figure 4H).
Blood Flow Recovery in LDLR−/−/CCR7−/− Mice
To further establish the role of the CCR7‐CCL19/CCL21 axis, we studied blood flow recovery after HLI in CCR7−/− mice. These mice were bred on a C57BL/6/LDLR−/− background and, therefore, we used C57BL/6/LDLR−/− mice as controls. The mice were kept on a normal chow diet and plasma total cholesterol levels were similar in both groups (Figure 5A). In both groups, mice appeared healthy and did not show significant weight loss over the course of the experiment (Figure 5B). Blood flow recovery in LDLR−/− mice (Figure 6A and 6B) after single ligation of the left femoral artery was comparable to that of wild‐type C57BL/6 mice (Figure 1A and 1B) and the animals made a full recovery within 10 days. In LDLR−/−/CCR7−/− mice, however, blood flow recovery was significantly hampered from day 10 onward (LDLR−/− 0.95±0.04 versus LDLR−/−/CCR7−/− 0.76±0.04, P=0.003) and full recovery was not reached before sacrifice at day 21 (Figure 6A and 6B). Over the whole time period, blood flow recovery was significantly impaired in LDLR−/−/CCR7−/− compared with LDLR−/− mice (P=0.0186). Directly after ligation, however, perfusion was similar in both groups (Figure 6C). This indicates that numbers of preexisting collateral arterioles are similar between both mouse strains. Indeed, when we quantified the collateral circulation of the pia mater, which has been shown to be representative for collateral densities in muscle tissues,14, 22, 23 similar numbers of collateral arterioles were counted in both strains (Figure 6D and 6E).
Figure 5.
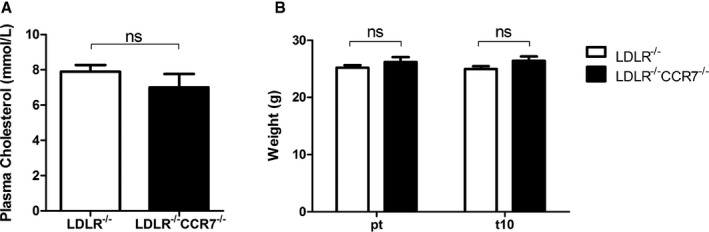
A, Plasma total cholesterol levels in LDLR −/− and LDLR −/−/CCR7−/− mice on a normal chow diet. n=11 for both groups. B, Average body weight of LDLR −/− and LDLR −/−/CCR7−/− mice before (pt) and at day 10 (t10) after induction of hindlimb ischemia (HLI). n=11 for both groups. ns indicates not significant.
Figure 6.
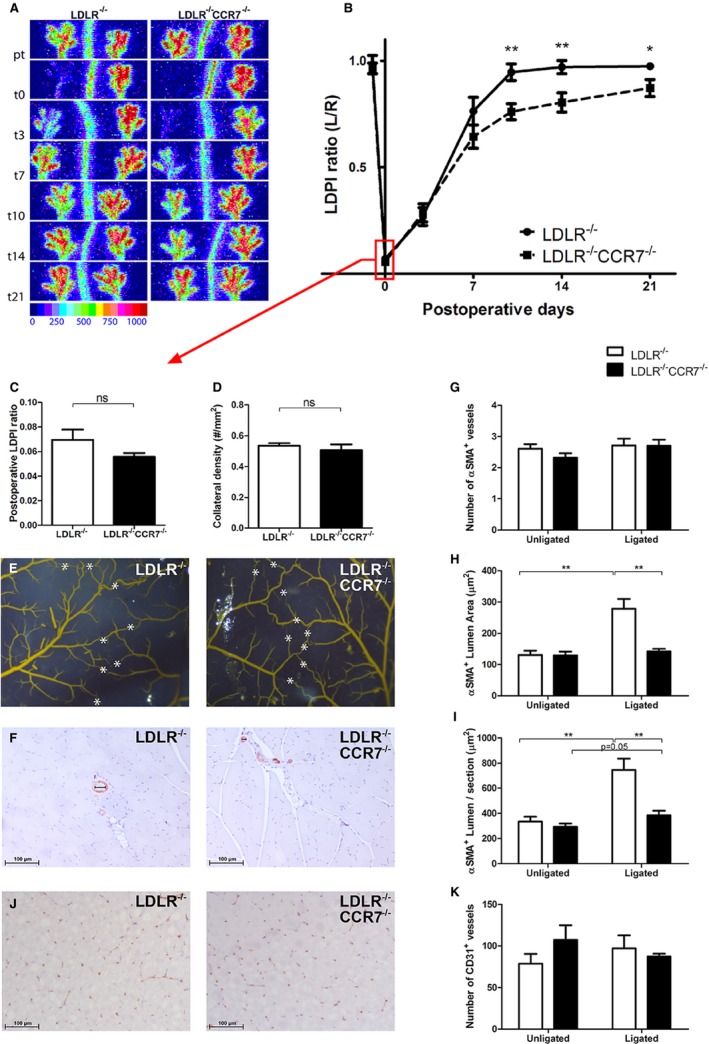
Blood flow recovery after hindlimb ischemia (HLI) in LDLR −/− vs LDLR −/−/CCR7−/− mice. A, Representative laser Doppler perfusion imaging (LDPI) of the paws of LDLR −/− and LDLR −/−/CCR7−/− mice before and after induction of HLI. B, Quantification of paw perfusion in LDLR −/− and LDLR −/−/CCR7−/− mice before and after induction of HLI. Values are expressed as the ratio of perfusion in the ligated over the unligated paw. LDLR −/−: n=11 (t0), n=11 (t3), n=11 (t7), n=11 (t10), n=10 (t14), and n=10 (t21). LDLR −/−/CCR7−/−: n=11 (t0), n=11 (t3), n=11 (t7), n=11 (t10), n=11 (t14), and n=11 (t21). C, Perfusion ratios in LDLR −/− and LDLR −/−/CCR7−/− mice directly after femoral artery ligation. n=11 for both groups. D, Preexisting collateral density in the pia mater of LDLR −/− (n=6) and LDLR −/−/CCR7−/− (n=7) mice. E, Representative images of the arterial network in the pia mater of LDLR −/− and LDLR −/−/CCR7−/− mice. White asterisks indicate collateral arteries between anterior, middle, and posterior cerebral arteries. F, Representative images of stainings for α‐smooth muscle actin (α‐SMA +) arterioles in adductor muscles of LDLR −/− and LDLR −/−/CCR7−/− mice, at day 10 after induction of HLI. G through I, Number, average lumen area, and collective lumen area per section, respectively, of α‐SMA + arterioles in adductor muscles of LDLR −/− (unligated n=8 and ligated n=9) and LDLR −/−/CCR7−/− (unligated n=9 and ligated n=8) mice, at day 10 after induction of HLI. J, Representative images of stainings for CD31+ capillaries in gastrocnemius muscles of LDLR −/− and LDLR −/−/CCR7−/− mice, at day 10 after induction of HLI. K, Number of CD31+ capillaries in gastrocnemius muscles of LDLR −/− (n=6) and LDLR −/−/CCR7−/− (n=6) mice, at day 7 after induction of HLI. *P<0.05, **P<0.01, ns=not significant. t indicates days after induction.
Arteriogenesis in LDLR−/−/CCR7−/− Mice
The impaired blood flow recovery in LDLR−/−/CCR7−/− mice was confirmed by measuring the α‐SMA+ arterioles in the adductor muscle group 10 days after HLI (Figure 6F). As predicted by the collateral densities of the pia mater, the number of α‐SMA+ arterioles was similar between LDLR−/−/CCR7−/− and LDLR−/− mice (Figure 6G). Also, the lumen area of the α‐SMA+ vessel in the adductor muscle group of nonligated limbs was similar. However, the mean lumen area per α‐SMA+ vessel (Figure 6H; LDLR−/− 279±31 μm2 versus LDLR−/−/CCR7−/− 143±8 μm2, P=0.001) and total lumen area of α‐SMA+ vessels per section (Figure 6I; LDLR−/− 746±90 μm2 versus LDLR−/−/CCR7−/− 384±36 μm2, P=0.003) had increased more in the adductor muscle group of the ligated paw of LDLR−/− mice than in the LDLR−/−/CCR7−/− mice. Thus, CCR7 deficiency results in impaired outward remodeling of collateral arterioles after induction of HLI.
Angiogenesis in LDLR−/−/CCR7−/− Mice
We also quantified the number of CD31+ capillaries in the gastrocnemius muscles (Figure 6J). Unlike the effects of CCR7 deficiency on arteriogenesis, angiogenesis was not severely affected in LDLR−/−/CCR7−/− mice. Even though the ratio of capillary densities in the ischemic over the nonischemic calf appeared lower in the LDLR−/−/CCR7−/− mice compared with the LDLR−/− mice, indicating decreased ischemia‐induced angiogenesis, this difference was not significant (Figure 6K; ratio of ischemic to nonischemic gastrocnemius: 1.31±0.20 in LDLR−/− versus 0.95±0.19 in LDLR−/−/CCR7−/−, P=0.22).
We further observed that in an in vivo angiogenesis model, LDLR−/−/CCR7−/− mice showed similar ingrowth of CD31+ endothelial cells into the subcutaneous matrigel plug as LDLR−/− mice. However, in an ex vivo aortic ring assay, we observed a decrease in the number of sprouts growing out of LDLR−/−/CCR7−/− aortas compared with LDLR−/− aortas. These data imply that CCR7 does affect arterial but not venous remodeling and growth (Figure 7).
Figure 7.
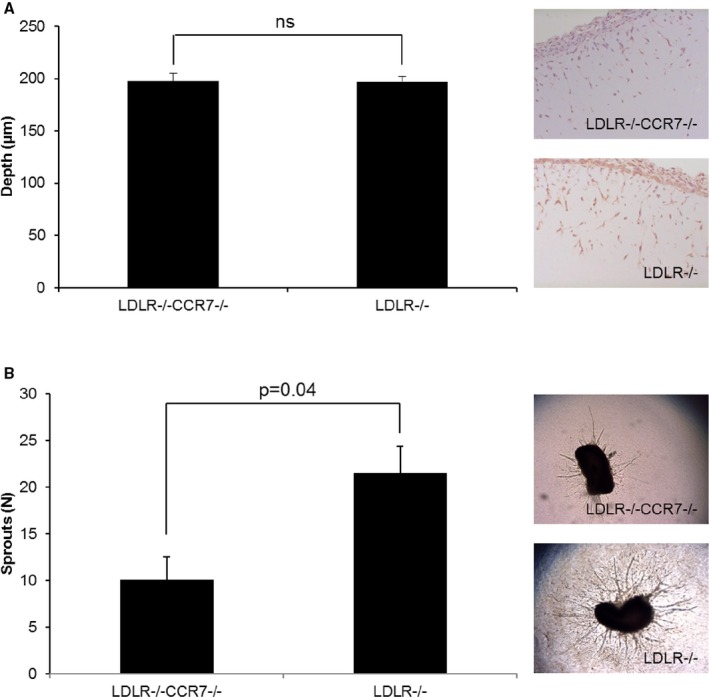
Angiogenesis assays in vivo and ex vivo. A, Quantification of the depth (μm) of ingrowth of CD31+ cells into subcutaneously injected matrigel, with representative images, in LDLR −/−/CCR7−/− and LDLR −/− mice. n=7 for both groups. (B) Number of sprouts, with representative images, growing out of aorta segments, from LDLR −/−/CCR7−/− and LDLR −/− mice, embedded in collagen. n=3 mice per group per 10 rings per mouse. ns indicates not significant.
Baseline Leukocyte Phenotype
The CCR7‐CCL19/CCL21 axis plays a crucial role in migration, homing, and retention of DCs and T lymphocytes. As the CCR7−/− mice used for this study were bred on an LDLR−/− background, we first compared baseline leukocyte profiles in peripheral blood, spleen, and lymph nodes of C57BL/6‐LDLR−/− mice with those of wild‐type C57BL/6 and BALB/c mice. When looking at DCs, we observed several differences in numbers of DCs in the various compartments between C57BL/6 and BALB/c mice and between LDLR−/− and BALB/c mice. For instance, total DCs, CCR7+ DCs, and MHCIIhigh/CCR7+ DCs were lower in the lymph nodes of BALB/c mice than in the other two strains (Figure 8A through 8C), whereas the MHCIIhigh/CCR7+ DCs were particularly higher in the spleen of BALB/c mice (Figure 5D). CD4+/CCR7+ T lymphocytes, but not CD8+/CCR7+ T lymphocytes, were also increased in the spleen of BALB/c mice (Figure 8E and 8F). Furthermore, Foxp3+/CD4+ Tregulatory lymphocytes were also increased in both the spleen and lymph nodes of BALB/c mice, compared with the other two strains (Figure 8G and 8H). However, no differences in either DCs or T lymphocytes were observed between the C57BL/6 and LDLR−/− mice in any tissue. With regards to the CCR7‐CCL19/CCL21 axis, we concluded that wild‐type C57BL/6 and C57BL/6 LDLR−/− have a similar leukocyte phenotype at baseline. However, we did observe an increase in CD14+/CCR7+ monocytes and F4/80+/CCR7+ macrophages in the peritoneum of LDLR−/− mice compared with both C57BL/6 and BALB/c mice at baseline (Figure 8I and 8J) but not in other tissues including the blood, spleen, and lymph nodes (Figure 9).
Figure 8.
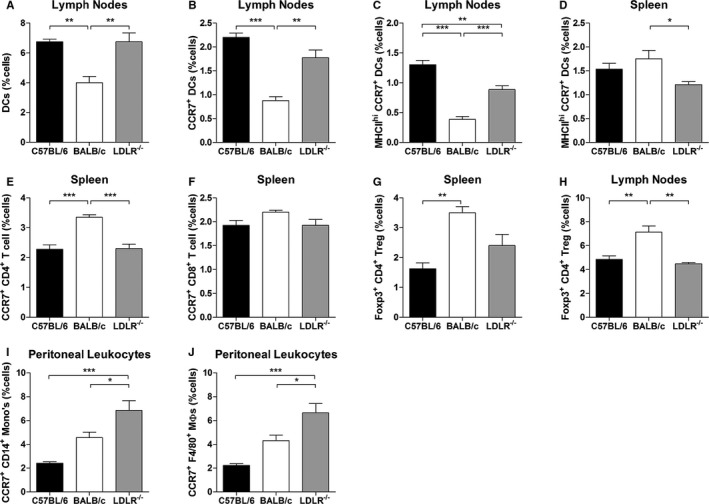
Leukocyte profiles in C57BL/6, BALB/c, and C57BL/6‐LDLR −/− mice. A and B, Dendritic cells (DCs) and CCR7+ DCs in the lymph nodes of C57BL/6, BALB/c, and LDLR −/− mice (percentage of total number of cells). C and D, MHCII high/CCR7+ DCs in the lymph nodes and spleen of C57BL/6, BALB/c, and LDLR −/− mice (percentage of total number of cells). E and F, CD4+/CCR7+ and CD8+/CCR7+ T lymphocytes in the spleen of C57BL/6, BALB/c, and LDLR −/− mice (percentage of total number of cells). G and H, Foxp3+/CD4+ Tregulatory lymphocytes in the spleen and lymph nodes of C57BL/6, BALB/c, and LDLR −/− mice (percentage of total number of cells). I and J, CD14+/CCR7+ monocytes and F4/80+/CCR7+ macrophages in the peritoneum of C57BL/6, BALB/c, and LDLR −/− mice (percentage of total number of cells). n=4 in all groups. *P<0.05, **P<0.01, ***P<0.001.
Figure 9.
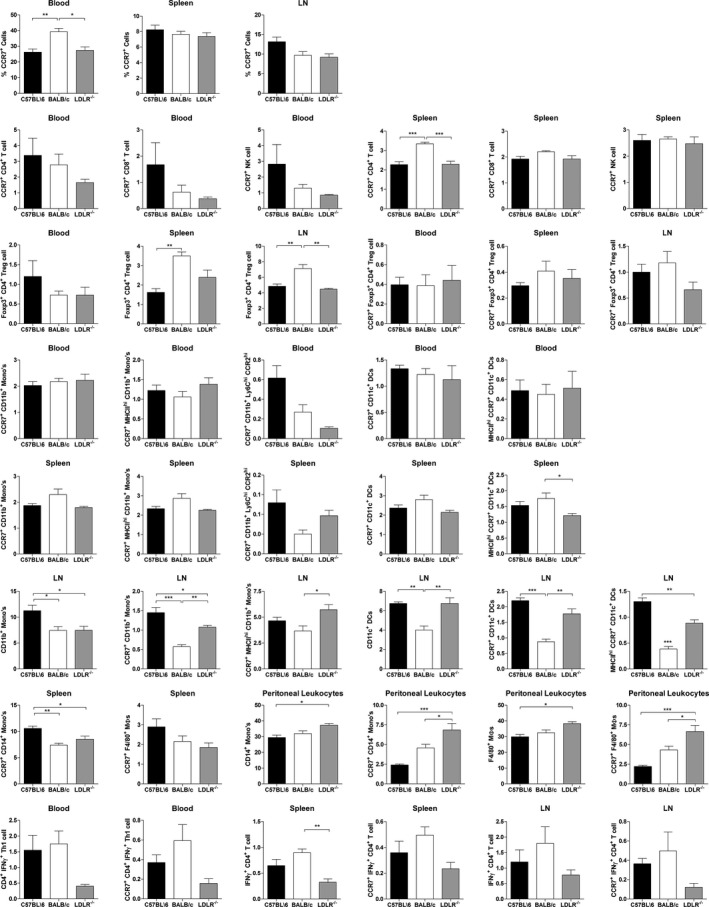
Leukocyte profiles in C57BL/6, BALB/c, and C57BL/6‐LDLR −/− mice. Various subtypes of CCR7+ dendritic cells (DCs), CD4+, CD8+, natural killer, Th1 and regulatory T lymphocytes, monocytes, and macrophages in the blood, spleen, lymph nodes (LN), and peritoneum of C57BL/6, BALB/c, and LDLR −/− mice (percentage of total number of cells). n=4 in all groups.*P<0.05, **P<0.01, ***P<0.001
Postischemic Leukocyte Mobilization
Although they play a major role in arteriogenesis, we observed no differences in monocytes and macrophages between LDLR−/− and LDLR−/−/CCR7−/− mice after HLI (data not shown). Therefore, we focused on the mobilization of T lymphocytes and DCs after induction of HLI. Total numbers of CD4+ and CD8+ T lymphocytes did not differ between both mouse strains (data not shown). When we looked at activated and nave T lymphocytes separately, we noticed that for both CD4+ and CD8+ T lymphocytes, numbers of activated cells in the spleen dramatically decreased after induction of HLI, whereas the naive cells increased in numbers. This was true for both the LDLR−/− and LDLR−/−/CCR7−/− mice (Figure 10A through 10D). Similarly, for CD4+ T lymphocytes, the number of activated cells in the peripheral blood increased, where the number of naive cells decreased, in both mouse strains (Figure 10E and 10F). For CD8+ T lymphocytes, however, this was only true in LDLR−/− mice, whereas in the LDLR−/−/CCR7−/− mice, numbers of both activated and naive CD8+ T lymphocytes remained unaltered after induction of HLI (Figure 10G and 10H). However, even though the pool of activated T lymphocytes in the spleen was drained at day 1 after HLI, a decrease of activated CD4+ and CD8+ T lymphocytes, in particular, was observed in the lymph nodes of LDLR−/− mice. These effects were most outspoken for activated CD4+ T lymphocytes in the draining lymph nodes, indicating that these are cells being retained in the affected tissue, enabling them to exert their function in arteriogenesis. In the LDLR−/−/CCR7−/− mice, these effects were not observed, which indicates an impaired retention of T lymphocytes at the site of collateral remodeling (Figure 10I through 10L).
Figure 10.
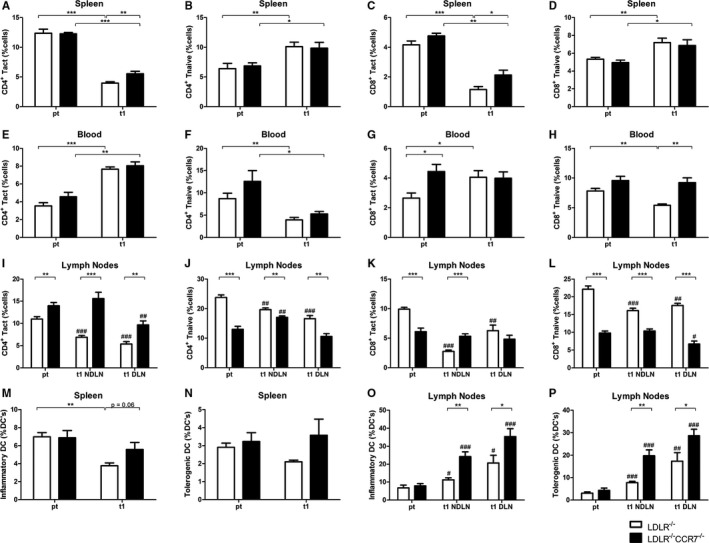
Postischemic mobilization of T lymphocytes and dendritic cells (DCs) in LDLR −/− vs LDLR −/−/CCR7−/− mice. A through D, Activated and naive CD4+ and CD8+ T lymphocytes (percentage of total number of cells) in the spleen of LDLR −/− vs LDLR −/−/CCR7−/− mice before (pt) and at day 1 after induction of hindlimb ischemia (HLI) (n=6 in all groups). E through H, Activated and naive CD4+ and CD8+ T lymphocytes (percentage of total number of cells) in the peripheral blood of LDLR −/− vs LDLR −/−/CCR7−/− mice before (pt) and at day 1 after induction of HLI (n=6 in all groups). I through L, Activated and naive CD4+ and CD8+ T lymphocytes (percentage of total number of cells) in the nondraining lymph nodes (NDLN) and draining lymph nodes (DLN) of LDLR −/− (n=6 in all groups) vs LDLR −/−/CCR7−/− (n=6 for pt and DLN, n=5 for NDLN) mice before (pt) and at day 1 after induction of HLI. M and N, Activated inflammatory and tolerogenic DCs (percentage of total DCs) in the spleen (n=6 for pt, n=5 for t1) of LDLR −/− vs LDLR −/−/CCR7−/− mice before (pt) and at day 1 after induction of HLI. O and P, Activated inflammatory and tolerogenic DCs (percentage of total DCs) in the NDLNs and DLNs of LDLR −/− (n=6 in all groups) vs LDLR −/−/CCR7−/− (n=6 for pt and NDLN, n=5 for DLN) mice before (pt) and at day 1 after induction of HLI. *P<0.05, **P<0.01, and ***P<0.001, between strains; # P<0.05, ## P<0.01, and ### P<0.001, within strains, compared with pt (pretreatment). t indicates days after induction.
The fraction of inflammatory DCs also decreased in the spleen of LDLR−/− but not LDLR−/−/CCR7−/− mice at 1 day after induction of ischemia, whereas the fraction of tolerogenic DCs was unchanged in the spleen in both mouse strains (Figure 10M and 10N). Numbers of DCs in the peripheral blood were too low to generate reliable data on changes in DC numbers after HLI (data not shown). The fraction of activated inflammatory and tolerogenic DCs also increased in lymph nodes, but the increase was more outspoken in LDLR−/−/CCR7−/− mice, indicating that DCs also failed to retain in adductor muscle of these mice. However, in contrast to activated CD4+ T lymphocytes, these effects were observed in both draining and nondraining lymph nodes. Therefore, DC retention is most likely not specific to remodeling collateral arterioles (Figure 10O and 10P).
Discussion
In this study, we show that the CCR7‐CCL19/CCL21 axis is essential for effective arteriogenesis in a murine HLI model. We made use of the large differences in collateral arteriole remodeling capacities between C57BL/6 and BALB/c mice, which led to the identification of the CCR7‐CCL19/CCL21 axis as one of the “missing links” in arteriogenesis in BALB/c mice. Using LDLR−/−/CCR7−/− mice, we show that CCR7 deficiency leads to hampered blood flow recovery after HLI, via decreased outward remodeling of collateral arterioles, ie, decreased arteriogenesis, whereas angiogenesis is not affected.
The C57BL/6 mouse has an extensive preexisting network of collateral arterioles and, when triggered, these arterioles rapidly remodel into functional collateral arteries. The BALB/c mouse on the other hand, has only a few preexisting collateral arterioles and these arterioles have a very limited capacity to remodel into functional collateral arteries.8, 12, 13, 14 This striking difference between the two strains triggered the group of James Faber to perform in‐depth studies into the genetic makeup of these and other mouse strains. They have linked up to 40% of the variation in collateral arteriole formation to a single locus, Canq1, on murine chromosome 7.22, 23, 28 When looking at differences in gene expression, however, in the adductor muscles of both mouse strains, we observed that the response to HLI is much more outspoken in BALB/c mice than in C57BL/6 mice. More genes are regulated in BALB/c mice and for a more prolonged period of time. The response in BALB/c mice is delayed compared with that in the C57BL/6 mice; however, that would only explain a slightly delayed recovery of blood flow, but not the complete absence of recovery over 28 days. Therefore, it seems more likely that, although the BALB/c mice appear to “try their best,” by activating all proarteriogenic and proangiogenic gene programs, one or several factors are missing, which leads to the ultimate failure in blood flow recovery. A previous study by Lee et al29 showed that there is a large inflammatory component to postischemic gene regulation in C57BL/6 mice. In a model for acute cerebral stroke in C57BL/6 mice, Offner et al30 also showed rapid and broad activation of the peripheral immune system. Just as we observed in the C57BL/6 mice, CCR7 was upregulated in the ischemic tissue at ≈1 day (22 hours) after artery ligation. Upregulation of CCR7 in the spleen was already observed within 6 hours. Correspondingly, 2 studies in humans showed depletion of CCR7 expression in the acute phase in the peripheral blood of patients with ischemic stroke, likely due to infiltration of circulating CCR7+ cells into the cerebral tissue.31 One week after stroke, however, the number of CCR7+ T lymphocytes dramatically increased in the peripheral blood of stroke patients.32 Similar effects were observed following acute myocardial infarction, where CCR7+ T lymphocytes were rapidly depleted from the peripheral blood of patients directly after reperfusion, only to increase again in the hours after intervention.33 .
For the first time, we report increased expression of CCR7 ligands Ccl19 and Ccl21 in the affected adductor muscle of C57BL/6 but not BALB/c mice. When we costained CCL19 expression in adductor muscle tissue at day 1 after induction of HLI with both α‐SMA and LYVE‐1, we noticed that the upregulation of CCL19 predominantly occurred in the perivascular tissue itself, not in the lymphoid vessels. This corresponds to the increase in the number of CCR7+ cells in the perivascular space at day 1 after HLI that we observed in the adductor muscles of C57BL/6 mice, but also with the depletion of activated CD4+ T lymphocytes specifically in the draining lymph nodes of LDLR−/− mice compared with LDLR−/−/CCR7−/− mice at day 1 after HLI.
This is perhaps a controversial finding. Previous immunological studies on trafficking of T lymphocytes and DCs, but also neutrophils and macrophages, showed that the CCR7‐CCL19/CCL21 axis functions primarily to facilitate the exodus of leukocytes from the peripheral tissue, into the lymph nodes.15, 16, 17, 34, 35, 36 The role of the CCR7‐CCL19/CCL21 axis, however, is still controversial in cardiovascular disease. In atherosclerosis and myocardial infarction, the axis has been shown to play an important role. However, whereas on an ApoE−/− background, CCR7 deficiency aggravates atherosclerosis in hypercholesterolemic mice, CCR7 deficiency reduces plaque formation in mice with an LDLR−/− background.37, 38, 39 In human patients with atherosclerosis, CCR7 and its ligands CCL19 and CCL21 have been shown to be increased in both coronary and carotid artery lesions.40, 41 The main difference between atherosclerosis and arteriogenesis with respect to the inflammatory response is that while inflammation is chronic in atherosclerosis, it is only transient in effective arteriogenesis. Different types of immune cells infiltrate the affected tissues in a tightly registered order and the inflammatory response is ceased again within days.42 However, when arteriogenesis is not effective, like in BALB/c, the inflammatory reaction is prolonged and more chronic in character. Indeed, the upregulation of Ccl19 and Ccl21, and the retention of CCR7+ in the adductor muscle tissue, are only transient in C57BL/6 and LDLR−/− mice.
A weakness of this study is that technical restrictions in immunohistochemistry did not allow us to confirm that the CCR7+ cells in the adductor muscle at day 1 are indeed activated CD4+ T lymphocytes. CCR7 is expressed on many types of leukocytes, but mainly on the various subtypes of T lymphocytes and (matured) DCs, of which CD4+ T lymphocytes play a confirmed role in arteriogenesis.8 More importantly, this is the only cell type that is depleted specifically from the draining lymph nodes at day 1. This depletion is more outspoken in LDLR−/− than in LDLR−/−/CCR7−/− mice, which lack the ability to retain cells in the tissue via CCR7‐CCL19/CCL21 interactions. An additional weakness is that we cannot rule out the effects of CCR7 expression in vascular smooth muscle cells. We did not observe accumulation of any type of leukocyte in the blood in LDLR−/−/CCR7−/− mice compared with LDLR−/− mice, which indicates that there is no defect in leukocyte extravasation. However, the aortic ring assay shows that angiogenic sprouting from aorta segments is enhanced by the presence of CCR7, without an external stimulus. Therefore, an additional role of smooth muscle cells is not unlikely.
In correspondence to the upregulation of the CCR7‐CCL19/CCL21 axis in the good‐responding C57BL/6 mice, we found that CCR7 deficiency leads to a hampered recovery of blood flow after HLI. As both LDLR−/− and LDLR−/−/CCR7−/− mice had a similar number of preexisting collateral arterioles in the pia mater and in the adductor muscle of the contralateral paw, the decrease in blood flow recovery in LDLR−/−/CCR7−/− mice was caused solely by the decrease in arteriogenic capacity, not by changes in embryonic collateral arteriole formation. Although several studies have shown that CCR7, via CCL21, can increase angiogenesis in models for rheumatoid arthritis and cancer,43, 44 we did not observe decreases in angiogenesis in CCR7‐deficient mice.
Blood flow recovery was hampered in CCR7‐deficient mice, but the phenotype is not nearly as dramatic as it is in BALB/c mice. Part of this may be explained by the fact that CCR7‐deficient animals do have an extensive preexisting collateral network, in contrast to BALB/c mice. However, looking at the maximal recovery of blood flow, the CCR7‐CCL19/CCL21 axis is most likely only one of several crucial differences between the good‐ and poor‐responding C57BL/6 and BALB/c strains.
Conclusions
We found that most known inflammatory genes are upregulated more strongly and for a prolonged period of time in the poor‐responding BALB/c mouse strain in response to HLI. When looking for missing links in these mice, we found a lack of upregulation of the CCR7‐CCL19/CCL21 axis, which we did observe in good‐responding C57BL/6 mice. CCR7 deficiency indeed leads to a hampered blood flow recovery after HLI, due to a decrease in arteriogenesis, but not in angiogenesis. Early and transient upregulation of Ccl19 and Ccl21 around remodeling collateral arterioles in the affected muscle tissue, not in the lymphoid vessels, leads to a transient retention of, what are most likely, CD4+ T lymphocytes in the tissue, allowing them to exert a positive role in the initial phase of arteriogenesis.
Sources of Funding
This study was performed with financial support to PHAQ from BioMedical Materials, the Dutch Ministry of Economic Affairs, and Agriculture and Innovation (BMM‐PENT; P1.03) and to AYN from the Netherlands Organization for Scientific Research (Veni 916.12.041).
Disclosures
None.
(J Am Heart Assoc. 2017;6:e005281. DOI: 10.1161/JAHA.116.005281.)
References
- 1. van Oostrom MC, van Oostrom O, Quax PH, Verhaar MC, Hoefer IE. Insights into mechanisms behind arteriogenesis: what does the future hold? J Leukoc Biol. 2008;84:1379–1391. [DOI] [PubMed] [Google Scholar]
- 2. Bergmann CE, Hoefer IE, Meder B, Roth H, van Royen N, Breit SM, Jost MM, Aharinejad S, Hartmann S, Buschmann IR. Arteriogenesis depends on circulating monocytes and macrophage accumulation and is severely depressed in op/op mice. J Leukoc Biol. 2006;80:59–65. [DOI] [PubMed] [Google Scholar]
- 3. Heil M, Ziegelhoeffer T, Pipp F, Kostin S, Martin S, Clauss M, Schaper W. Blood monocyte concentration is critical for enhancement of collateral artery growth. Am J Physiol Heart Circ Physiol. 2002;283:H2411–H2419. [DOI] [PubMed] [Google Scholar]
- 4. Schaper J, Konig R, Franz D, Schaper W. The endothelial surface of growing coronary collateral arteries. Intimal margination and diapedesis of monocytes. A combined SEM and TEM study. Virchows Arch A Pathol Anat Histol. 1976;370:193–205. [DOI] [PubMed] [Google Scholar]
- 5. Voskuil M, Hoefer IE, van Royen N, Hua J, de Graaf S, Bode C, Buschmann IR, Piek JJ. Abnormal monocyte recruitment and collateral artery formation in monocyte chemoattractant protein‐1 deficient mice. Vasc Med. 2004;9:287–292. [DOI] [PubMed] [Google Scholar]
- 6. Hellingman AA, Zwaginga JJ, van Beem RT, Hamming JF, Fibbe WE, Quax PH, Geutskens SB. T‐cell‐pre‐stimulated monocytes promote neovascularisation in a murine hind limb ischaemia model. Eur J Vasc Endovasc Surg. 2011;41:418–428. [DOI] [PubMed] [Google Scholar]
- 7. Bickert T, Marshall RP, Zhang Z, Ludewig P, Binder M, Klinke A, Rottbauer W, Amling M, Wagener C, Ito WD, Horst AK. Acceleration of collateral development by carcinoembryonic antigen‐related cell adhesion molecule 1 expression on CD11b/(+)Gr‐1(+) myeloid cells—brief report. Arterioscler Thromb Vasc Biol. 2012;32:2566–2568. [DOI] [PubMed] [Google Scholar]
- 8. van Weel V, Toes RE, Seghers L, Deckers MM, de Vries MR, Eilers PH, Sipkens J, Schepers A, Eefting D, van Hinsbergh VW, van Bockel JH, Quax PH. Natural killer cells and CD4+ T‐cells modulate collateral artery development. Arterioscler Thromb Vasc Biol. 2007;27:2310–2318. [DOI] [PubMed] [Google Scholar]
- 9. Hellingman AA, van der Vlugt LE, Lijkwan MA, Bastiaansen AJ, Sparwasser T, Smits HH, Hamming JF, Quax PH. A limited role for regulatory T cells in post‐ischemic neovascularization. J Cell Mol Med. 2012;16:328–336. [DOI] [PMC free article] [PubMed] [Google Scholar]
- 10. Stabile E, Kinnaird T, la Sala A, Hanson SK, Watkins C, Campia U, Shou M, Zbinden S, Fuchs S, Kornfeld H, Epstein SE, Burnett MS. CD8+ T lymphocytes regulate the arteriogenic response to ischemia by infiltrating the site of collateral vessel development and recruiting CD4+ mononuclear cells through the expression of interleukin‐16. Circulation. 2006;113:118–124. [DOI] [PubMed] [Google Scholar]
- 11. Zouggari Y, Ait‐Oufella H, Waeckel L, Vilar J, Loinard C, Cochain C, Recalde A, Duriez M, Levy BI, Lutgens E, Mallat Z, Silvestre JS. Regulatory T cells modulate postischemic neovascularization. Circulation. 2009;120:1415–1425. [DOI] [PubMed] [Google Scholar]
- 12. Helisch A, Wagner S, Khan N, Drinane M, Wolfram S, Heil M, Ziegelhoeffer T, Brandt U, Pearlman JD, Swartz HM, Schaper W. Impact of mouse strain differences in innate hindlimb collateral vasculature. Arterioscler Thromb Vasc Biol. 2006;26:520–526. [DOI] [PubMed] [Google Scholar]
- 13. Chalothorn D, Clayton JA, Zhang H, Pomp D, Faber JE. Collateral density, remodeling, and VEGF‐A expression differ widely between mouse strains. Physiol Genomics. 2007;30:179–191. [DOI] [PubMed] [Google Scholar]
- 14. Chalothorn D, Faber JE. Strain‐dependent variation in collateral circulatory function in mouse hindlimb. Physiol Genomics. 2010;42:469–479. [DOI] [PMC free article] [PubMed] [Google Scholar]
- 15. Bromley SK, Thomas SY, Luster AD. Chemokine receptor CCR7 guides T cell exit from peripheral tissues and entry into afferent lymphatics. Nat Immunol. 2005;6:895–901. [DOI] [PubMed] [Google Scholar]
- 16. Debes GF, Arnold CN, Young AJ, Krautwald S, Lipp M, Hay JB, Butcher EC. Chemokine receptor CCR7 required for T lymphocyte exit from peripheral tissues. Nat Immunol. 2005;6:889–894. [DOI] [PMC free article] [PubMed] [Google Scholar]
- 17. Johnson LA, Jackson DG. Control of dendritic cell trafficking in lymphatics by chemokines. Angiogenesis. 2014;17:335–345. [DOI] [PubMed] [Google Scholar]
- 18. Baker M, Robinson SD, Lechertier T, Barber PR, Tavora B, D'Amico G, Jones DT, Vojnovic B, Hodivala‐Dilke K. Use of the mouse aortic ring assay to study angiogenesis. Nat Protoc. 2012;7:89–104. [DOI] [PubMed] [Google Scholar]
- 19. Doorn J, Fernandes HA, Le BQ, van de Peppel J, van Leeuwen JP, de Vries MR, Aref Z, Quax PH, Myklebost O, Saris DB, van Blitterswijk CA, de Boer J. A small molecule approach to engineering vascularized tissue. Biomaterials. 2013;34:3053–3063. [DOI] [PubMed] [Google Scholar]
- 20. Baldi P, Long AD. A Bayesian framework for the analysis of microarray expression data: regularized t ‐test and statistical inferences of gene changes. Bioinformatics. 2001;17:509–519. [DOI] [PubMed] [Google Scholar]
- 21. Tusher VG, Tibshirani R, Chu G. Significance analysis of microarrays applied to the ionizing radiation response. Proc Natl Acad Sci USA. 2001;98:5116–5121. [DOI] [PMC free article] [PubMed] [Google Scholar]
- 22. Wang S, Zhang H, Dai X, Sealock R, Faber JE. Genetic architecture underlying variation in extent and remodeling of the collateral circulation. Circ Res. 2010;107:558–568. [DOI] [PMC free article] [PubMed] [Google Scholar]
- 23. Zhang H, Prabhakar P, Sealock R, Faber JE. Wide genetic variation in the native pial collateral circulation is a major determinant of variation in severity of stroke. J Cereb Blood Flow Metab. 2010;30:923–934. [DOI] [PMC free article] [PubMed] [Google Scholar]
- 24. Scalzo AA, Fitzgerald NA, Simmons A, La Vista AB, Shellam GR. Cmv‐1, a genetic locus that controls murine cytomegalovirus replication in the spleen. J Exp Med. 1990;171:1469–1483. [DOI] [PMC free article] [PubMed] [Google Scholar]
- 25. Hammond KJ, Pellicci DG, Poulton LD, Naidenko OV, Scalzo AA, Baxter AG, Godfrey DI. CD1d‐restricted NKT cells: an interstrain comparison. J Immunol. 2001;167:1164–1173. [DOI] [PubMed] [Google Scholar]
- 26. Brown MG, Dokun AO, Heusel JW, Smith HR, Beckman DL, Blattenberger EA, Dubbelde CE, Stone LR, Scalzo AA, Yokoyama WM. Vital involvement of a natural killer cell activation receptor in resistance to viral infection. Science. 2001;292:934–937. [DOI] [PubMed] [Google Scholar]
- 27. Heinzel FP, Sadick MD, Mutha SS, Locksley RM. Production of interferon gamma, interleukin 2, interleukin 4, and interleukin 10 by CD4+ lymphocytes in vivo during healing and progressive murine leishmaniasis. Proc Natl Acad Sci USA. 1991;88:7011–7015. [DOI] [PMC free article] [PubMed] [Google Scholar]
- 28. Wang S, Zhang H, Wiltshire T, Sealock R, Faber JE. Genetic dissection of the Canq1 locus governing variation in extent of the collateral circulation. PLoS One. 2012;7:e31910. [DOI] [PMC free article] [PubMed] [Google Scholar]
- 29. Lee CW, Stabile E, Kinnaird T, Shou M, Devaney JM, Epstein SE, Burnett MS. Temporal patterns of gene expression after acute hindlimb ischemia in mice: insights into the genomic program for collateral vessel development. J Am Coll Cardiol. 2004;43:474–482. [DOI] [PubMed] [Google Scholar]
- 30. Offner H, Subramanian S, Parker SM, Afentoulis ME, Vandenbark AA, Hurn PD. Experimental stroke induces massive, rapid activation of the peripheral immune system. J Cereb Blood Flow Metab. 2006;26:654–665. [DOI] [PubMed] [Google Scholar]
- 31. Barr TL, Conley Y, Ding J, Dillman A, Warach S, Singleton A, Matarin M. Genomic biomarkers and cellular pathways of ischemic stroke by RNA gene expression profiling. Neurology. 2010;75:1009–1014. [DOI] [PMC free article] [PubMed] [Google Scholar]
- 32. Yan J, Greer JM, Etherington K, Cadigan GP, Cavanagh H, Henderson RD, O'Sullivan JD, Pandian JD, Read SJ, McCombe PA. Immune activation in the peripheral blood of patients with acute ischemic stroke. J Neuroimmunol. 2009;206:112–117. [DOI] [PubMed] [Google Scholar]
- 33. Hoffmann J, Fiser K, Weaver J, Dimmick I, Loeher M, Pircher H, Martin‐Ruiz C, Veerasamy M, Keavney B, von Zglinicki T, Spyridopoulos I. High‐throughput 13‐parameter immunophenotyping identifies shifts in the circulating T‐cell compartment following reperfusion in patients with acute myocardial infarction. PLoS One. 2012;7:e47155. [DOI] [PMC free article] [PubMed] [Google Scholar]
- 34. Beauvillain C, Cunin P, Doni A, Scotet M, Jaillon S, Loiry ML, Magistrelli G, Masternak K, Chevailler A, Delneste Y, Jeannin P. CCR7 is involved in the migration of neutrophils to lymph nodes. Blood. 2011;117:1196–1204. [DOI] [PubMed] [Google Scholar]
- 35. Feig JE, Shang Y, Rotllan N, Vengrenyuk Y, Wu C, Shamir R, Torra IP, Fernandez‐Hernando C, Fisher EA, Garabedian MJ. Statins promote the regression of atherosclerosis via activation of the CCR7‐dependent emigration pathway in macrophages. PLoS One. 2011;6:e28534. [DOI] [PMC free article] [PubMed] [Google Scholar]
- 36. Hayasaka H, Kobayashi D, Yoshimura H, Nakayama EE, Shioda T, Miyasaka M. The HIV‐1 Gp120/CXCR4 axis promotes CCR7 ligand‐dependent CD4 T cell migration: CCR7 homo‐ and CCR7/CXCR4 hetero‐oligomer formation as a possible mechanism for up‐regulation of functional CCR7. PLoS One. 2015;10:e0117454. [DOI] [PMC free article] [PubMed] [Google Scholar]
- 37. Li J, Ley K. Lymphocyte migration into atherosclerotic plaque. Arterioscler Thromb Vasc Biol. 2015;35:40–49. [DOI] [PMC free article] [PubMed] [Google Scholar]
- 38. Luchtefeld M, Grothusen C, Gagalick A, Jagavelu K, Schuett H, Tietge UJ, Pabst O, Grote K, Drexler H, Forster R, Schieffer B. Chemokine receptor 7 knockout attenuates atherosclerotic plaque development. Circulation. 2010;122:1621–1628. [DOI] [PubMed] [Google Scholar]
- 39. Wan W, Lionakis MS, Liu Q, Roffe E, Murphy PM. Genetic deletion of chemokine receptor Ccr7 exacerbates atherogenesis in ApoE‐deficient mice. Cardiovasc Res. 2013;97:580–588. [DOI] [PMC free article] [PubMed] [Google Scholar]
- 40. Cai W, Tao J, Zhang X, Tian X, Liu T, Feng X, Bai J, Yan C, Han Y. Contribution of homeostatic chemokines CCL19 and CCL21 and their receptor CCR7 to coronary artery disease. Arterioscler Thromb Vasc Biol. 2014;34:1933–1941. [DOI] [PubMed] [Google Scholar]
- 41. Halvorsen B, Dahl TB, Smedbakken LM, Singh A, Michelsen AE, Skjelland M, Krohg‐Sorensen K, Russell D, Hopken UE, Lipp M, Damas JK, Holm S, Yndestad A, Biessen EA, Aukrust P. Increased levels of CCR7 ligands in carotid atherosclerosis: different effects in macrophages and smooth muscle cells. Cardiovasc Res. 2014;102:148–156. [DOI] [PubMed] [Google Scholar]
- 42. Meisner JK, Price RJ. Spatial and temporal coordination of bone marrow‐derived cell activity during arteriogenesis: regulation of the endogenous response and therapeutic implications. Microcirculation. 2010;17:583–599. [DOI] [PMC free article] [PubMed] [Google Scholar]
- 43. Pickens SR, Chamberlain ND, Volin MV, Pope RM, Talarico NE, Mandelin AM, Shahrara S. Role of the CCL21 and CCR7 pathways in rheumatoid arthritis angiogenesis. Arthritis Rheum. 2012;64:2471–2481. [DOI] [PMC free article] [PubMed] [Google Scholar]
- 44. Zhao B, Cui K, Wang CL, Wang AL, Zhang B, Zhou WY, Zhao WH, Li S. The chemotactic interaction between CCL21 and its receptor, CCR7, facilitates the progression of pancreatic cancer via induction of angiogenesis and lymphangiogenesis. J Hepatobiliary Pancreat Sci. 2011;18:821–828. [DOI] [PubMed] [Google Scholar]