

Abstract
The number of relevant and well‐characterized cell lines and xenograft models for studying human breast cancer are few, and may represent a limitation for this field of research. With the aim of developing new breast cancer model systems for in vivo studies of hormone dependent and independent tumor growth, progression and invasion, and for in vivo experimental therapy studies, we collected primary mammary tumor specimens from patients, and implanted them in immunodeficient mice. Primary tumor tissue from 29 patients with breast cancer was implanted subcutaneously with matrigel in SCID mice, in the presence of continuous release of estradiol. The tumors were transferred into new animals when reaching a diameter of 15mm and engrafted tumors were harvested for morphological and molecular characterization from passage six. Further, gene expression profiling was performed using Agilent Human Whole Genome Oligo Microarrays, as well as DNA copy number analysis using Agilent Human Genome CGH 244K Microarrays. Of the 30 primary tumors implanted into mice (including two implants from the same patient), two gave rise to viable tumors beyond passage ten. One showed high expression levels of estrogen receptor‐α protein (ER) while the other was negative. Histopathological evaluation of xenograft tumors was carried out at passage 10–12; both xenografts maintained the morphological characteristics of the original tumors (classified as invasive grade III ductal carcinomas). The genomic profile of the ER‐positive xenograft tumor resembled the profile of the primary tumor, while the profile obtained from the ER‐negative parental tumor was different from the xenograft. However, the ER‐negative parental tumor and xenograft clustered on the same branch using unsupervised hierarchical clustering analysis on RNA microarray expression data of “intrinsic genes”. A significant variation was observed in the expression of extracellular matrix (ECM)‐related genes, which were found downregulated in the engrafted tumors compared to the primary tumor. By IHC and qRT‐PCR we found that the downregulation of stroma‐related genes was compensated by the overexpression of such molecules by the mouse host tissue. The two established breast cancer xenograft models showed different histopathological characteristics and profound diversity in gene expression patterns that in part can be associated to their ER status and here described as basal‐like and luminal‐like phenotype, respectively. These two new breast cancer xenografts represent useful preclinical tools for developing and testing of new therapies and improving our knowledge on breast cancer biology.
Keywords: Breast cancer, Model system, Luminal, Basal, RNA microarray, Genome array
1. Introduction
Nearly 70% of breast cancer patients have tumors expressing estrogen receptor α protein (ER), which is a favorable prognostic marker. Indeed, endocrine treatments targeting ER are desirable because they are generally well tolerated and avoid the morbidity associated with chemotherapy (Winer et al., 2004; Hayes et al., 2007). However, about 30% of ER‐positive patients will not respond to hormonal treatment with selective estrogen receptor modulators (SERMs) like tamoxifen or raloxifene, the ER downregulator fulvestrant, and aromatase inhibitors, due to acquisition of resistance (Massarweh and Schiff, 2007).
Patients with ER‐negative tumors have a less favorable prognosis, and are largely depending on the use of systemic chemotherapy. Treatment of patients with HER2 positive tumors with Herceptin (trastuzumab) in combination with chemotherapy have recently been shown to significantly reduce the frequency of relapse (Piccart‐Gebhart et al., 2005; Romond et al., 2005). Alternative treatment strategies are also needed for HER2 negative, hormone dependent and independent tumors and for the development of novel treatment alternatives, models that better reflect the complexity of the disease are required.
The majority of in vivo tumor models available for the study of breast cancer biology are based on well‐characterized cell lines established as monolayer cultures. The tumor heterogeneity in these cultures may have been lost during selection pressure upon establishing these models. New representative in vivo systems reflecting the tissue heterogeneity of the original tumor are indeed needed, and would be useful in various biological studies. A preclinical model that derives from engraftment of clinical samples directly into animals offers an improved opportunity for experimental studies of new and old therapies as well as identification of new treatment targets.
In the present study, we report the establishment of two new breast cancer xenograft models obtained by transplanting human primary breast tumors into immunodeficient (SCID) mice. Of the 30 specimens, two (named MAS98.06 and MAS98.12) were maintained for more than 10 passages and have been characterized histologically and at the molecular level by performing expression and genomic profile analyses.
2. Results
2.1. Establishment of xenografts
A total of 30 primary tumors obtained from surgery were implanted subcutaneously into SCID mice as described in the Experimental procedures section. No treatment had been given to the patients prior to surgery. The lag time from implantation to tumor growth after the primary transplant varied from 2.7 to 9.4 months. Only six tumors gave rise to tumors after the primary implant (P0–P1), and the number was further reduced to three tumors after the second passage (P1– P2). One of the tumors caused serious cachexia in the animals at a small size (<10mm), and was eventually lost after eight passages. Two xenografts (MAS98.06 and MAS98.12) were able to grow and maintained for more than 10 generations. The engraftment time for these two tumors (P0–P1) was 9.4 and 7.3 months respectively, while the other tumors that did not give rise to serially transplantable xenografts had shorter time of tumor formation in the first passage (less than four months from P0 to P1).
2.2. Histopathology
Histopathological evaluation of xenograft tumors was carried out at passage 10–12. The tumor size selected for evaluation measured from 8 to 15mm. The two xenografts maintained the morphological characteristics of the original tumors, both classified as invasive grade III ductal carcinoma (Figure 1A, B). Further, MAS98.06 showed strong positive staining for the ERα and PgR while MAS98.12 was ERα and PgR negative (Figure 1C and D), and had lost expression of PgR compared to the patient's primary tumor. As expected, decreased inflammatory component was observed in the engrafted tumors compared to the original tumors.
Figure 1.
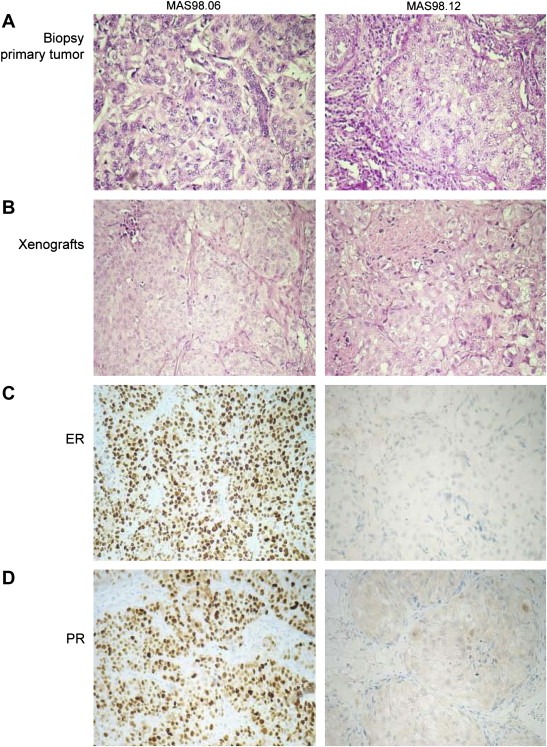
Histopathological analysis. Histopathological evaluation was carried out on formalin‐fixed paraffin‐embedded tissue sections from xenografts and primary tumors. Panels A and B: H&E staining for primary tumor biopsies and xenografts respectively. Panels C and D: ER and PgR immunostaining of the two engrafted tumors.
2.3. TP53 mutation
Direct sequencing of exon 2–11 of the TP53 gene showed that MAS98.06 primary tumor carried a mutation on one allele in codon 179 (CAT>CGT; His>Arg) with the wild‐type (wt) allele present. The same mutation was detected in the MAS98.06 xenograft, but in this case the wt allele was lost. In the MAS98.12 parental tumor a small population of cells were found to carry a codon 120 mutation, whereas all engrafted tumors carried a mutation in codon 120 (AAG>GAG; Lys>Glu) together with a loss of the wt allele.
2.4. Array‐CGH analysis
Characterization of genomic alterations by array‐CGH was carried out on paired original and engrafted tumors in mice without estradiol (E2) treatment. As shown in Figure 2A, MAS98.06 primary and xenograft tumors shared the main alterations, though these alterations were more pronounced in the engrafted tumors. For example, the heterozygous deletions on 8p and 13q arms in the primary tumor were homozygous in the xenograft (Figure 3B). The MAS98.12 primary tumor did not show extensive genomic alterations as expected for an ER‐negative tumor, and only a few low‐level gains as shown on chromosome 8q, were apparent (Figure 2B). In contrast, the MAS98.12 xenograft showed a more complex genomic phenotype characterized by several high‐level alterations such as loss of 8p, gain/amplification of 1q, 8q, 10p and 13q (Figure 2B), many of which have been described as characteristic of basal‐like tumors (Bergamaschi et al., 2006).
Figure 2.
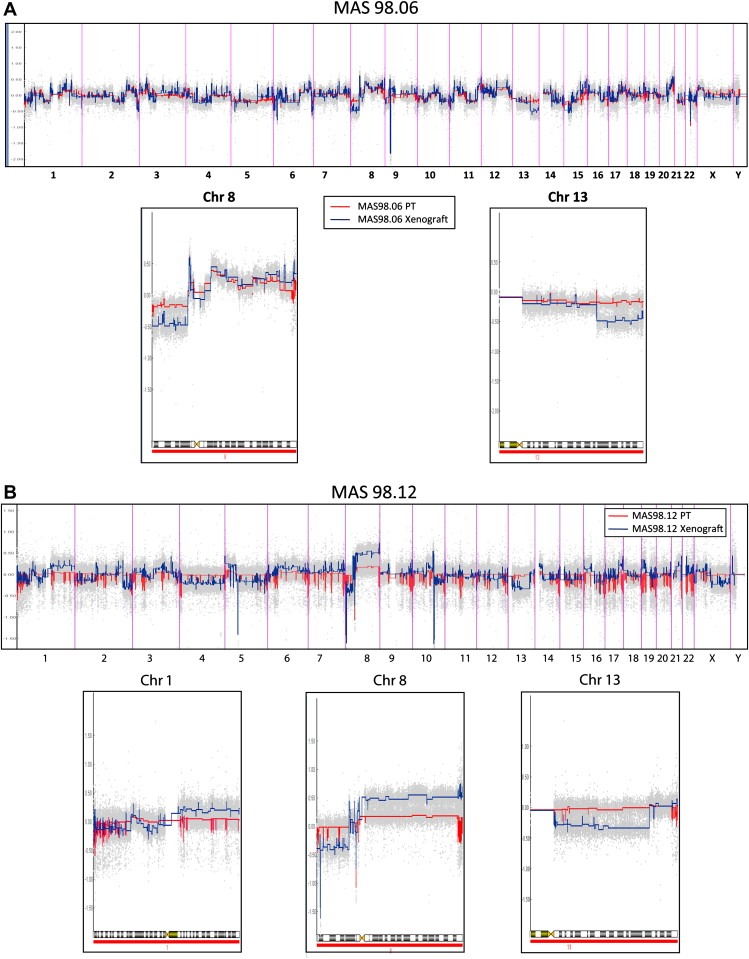
Xenograft and primary tumor aCGH profile. A) Estimation of copy number ratios in MAS98.06 by the CGH‐Explorer PCF algorithm. Red color corresponds to primary tumor; blue color corresponds to the paired xenograft (vertical bars show chromosomes boundaries). High resolution of copy number profiles for chromosome 8 and 13 are showed. B) Evaluation of copy number ratios in MAS98.12 by the CGH‐Explorer PCF algorithm. Red color corresponds to primary tumor; blue color corresponds to the paired xenograft (vertical bars show chromosomes boundaries). High resolution of copy number profile for chromosome 1, 8 and 13 is reported.
Figure 3.
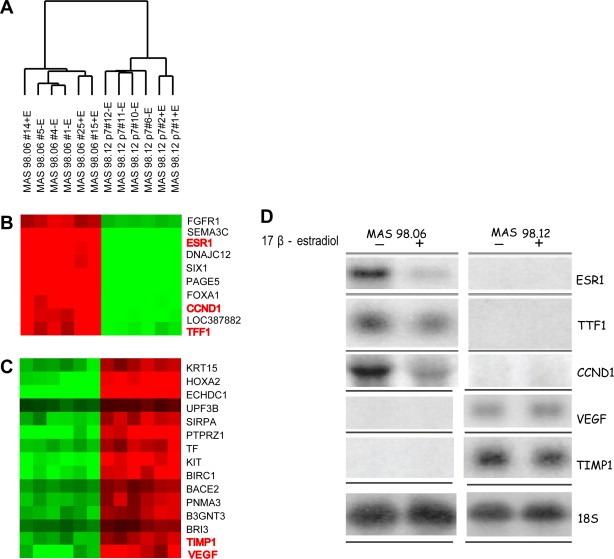
Expression analysis of xenografts. A) Unsupervised hierarchical clustering of 12 breast carcinoma xenografts across 18.442 genes which passed the filtering criteria (Fig. S1). B–C) Selected panels of differential gene expression between MAS98.06 and MAS98.12 xenografts. Genes in red were investigated by Northern blotting. D) Northern blot analysis of genes differentially expressed in two representative MAS98.06 and MAS98.12 xenografts from mice maintained with and without estradiol after implantation.
2.5. Gene expression analyses
Gene expression analysis was carried out on six parallel engrafts from each of the two xenografts. By unsupervised hierarchical clustering, the xenograft was separated into two distinct clusters, with all xenografts from the same tumor clustering within the same branch (Figure 3A). Gene clusters representative of the groups are shown in Figure 3B and C. Northern analysis was carried out on selected genes (ESR1, TFF1, VEGF, CCND1, TIMP1) and confirmed the microarray results (Figure 3D). We observed subgroups within each of the two types of xenografts strongly driven by E2 treatment. As described in Material and Methods, three of the six MAS98.06 low passage xenografts and two of the six MAS98.12 xenografts were derived from mice supplemented with estradiol. To evaluate the overall expression patterns in xenografts MAS98.06 and MAS98.12 from E2‐treated versus untreated animals, a two‐class supervised SAM analysis was employed. The analysis was carried out separately for the ER‐positive and ER‐negative models. A total of 972 genes (FDR 5%) were found differentially expressed among the treated and untreated MAS98.06 ER‐positive xenografts.
To determine whether phenotypic changes observed in E2‐treated tumors were enriched for genes in specific pathways, the expression data were subjected to Gene set enrichment analysis (GSEA) (Subramanian et al., 2005). E2 treatment resulted in significant upregulation of several genes involved in cell cycle and immune responses (Table 1).
Table 1.
GSEA. GSEA identified several functional genesets significantly enriched in xenografts treated with estradiol versus non‐treated. Analysis was conducted in MAS98.06 and MAS98.12 separately and genesets with FDR less than 0.25 were considered as ‘significant’ and reported in the table.
| Name | NES | FDR q‐val | |
|---|---|---|---|
| Enriched in treated MAS98.06 xenografts | SIG_BCR_SIGNALING_PATHWAY | 2.236 | 0.042 |
| CELLCYCLEPATHWAY | 2.141 | 0.051 | |
| FRASOR_ER_UP | 2.111 | 0.044 | |
| IL2RBPATHWAY | 2.013 | 0.094 | |
| ST_B_CELL_ANTIGEN_RECEPTOR | 1.915 | 0.149 | |
| GLUT_DOWN | 1.856 | 0.191 | |
| INFLAMMATORY_RESPONSE_PATHWAY | 1.817 | 0.213 | |
| SIG_IL4RECEPTOR_IN_B_LYMPHOCYTES | 1.782 | 0.223 | |
| TESTIS_GENES_FROM_XHX_AND_NETAFFX | 1.765 | 0.216 | |
| SA_B_CELL_RECEPTOR_COMPLEXES | 1.762 | 0.195 | |
| Enriched in non‐treated MAS98.06 xenografts | CELL_CYCLE_ARREST | –1.909 | 0.114 |
| NOS1PATHWAY | –1.815 | 0.123 | |
| MAP00190_OXIDATIVE_PHOSPHORYLATION | –1.717 | 0.164 | |
| CELL_CYCLE_CHECK POINT | –1.589 | 0.250 | |
| Enriched in treated MAS98.12 xenografts | – | – | – |
| Enriched in non‐treated MAS98.12 xenografts | ST_B_CELL_ANTIGEN_RECEPTOR | –2.641 | 0.000 |
| EMT_UP | –2.055 | 0.096 | |
| ST_PHOSPHOINOSITIDE_3_KINASE_PATHWAY | –1.878 | 0.268 | |
| PDGFPATHWAY | –1.868 | 0.201 | |
| ERKPATHWAY | –1.859 | 0.164 | |
| TCRPATHWAY | –1.816 | 0.194 | |
| SIG_IL4RECEPTOR_IN_B_LYMPHOCYTES | –1.790 | 0.195 | |
| ST_G_ALPHA_I_PATHWAY_ | –1.734 | 0.230 | |
| GHPATHWAY | –1.724 | 0.222 | |
The same analyses were carried out on the ER‐negative MAS98.12 xenografts. As expected, fewer genes, 195 (FDR 5%) had significantly different expression level when comparing MAS98.12 xenografts from control and E2 supplemented animals. Surprisingly, by GSEA we found that ER‐negative xenografts from non‐E2 supplemented animals were enriched for several gene involved in immune response pathways (as found for the ER‐positive xenografts supplemented by estradiol) as well as for genes involved in growth factor pathways (Table 1).
To determine whether the engrafted tumors retained the molecular features of the primary tumors, we compared their respective gene expression patterns. By unsupervised hierarchical clustering, samples were divided into three clusters; one represented by the two primary tumors forming one branch in the dendrogram away from their xenografts, and the other two clusters grouped the two xenografts with their respective replicates (Figure 4A). We observed several clusters of genes differently expressed between the xenografts and the primary tumors (Figure 4B–D and see full heatmap in Fig. S2). SAM analysis was employed to identify genes whose expression was significantly changed after transplantation into the animals and independent of the ER status. Interestingly, a series of genes involved in extracellular matrix (ECM) formation as well as stroma‐related molecules were found significantly downregulated in both xenografts compared to the parental tumors (Figure 4C).
Figure 4.
Expression analysis of xenografts and primary tumors. Unsupervised hierarchical clustering of 12 breast carcinoma xenografts and two paired primary tumors. 19.072 genes passed the filtering criteria and were used for this analysis (Fig. S1A). B and D) Selected panels of differential gene expression patterns for xenografts and primary tumors.
2.6. ECM characterization
To shed more light on the gene expression variation of the ECM‐related genes identified by SAM, we retrieved the expression level of 278 ECM‐related genes that previously have been shown to classify primary breast tumors into four ECM groups with prognostic relevance (Bergamaschi et al., 2008). Unsupervised hierarchical clustering of the 278 ECM genes showed that xenografts and primary tumors clustered in three separate subgroups (see full heatmap in Fig. S3). The gene cluster driving the separation of the two xenografts from the primary tumors was mainly represented by genes coding for structural molecules such as collagen fibers and several MMPs as seen in Figure 5A and Fig. S3. Moreover, we observed that the majority of these molecules were downregulated in the xenografts compared to the original tumors. The two xenografts and their corresponding primary tumors were then assigned to each of the four ECM groups using Pearson correlation to the previously developed expression centroids applying a significant correlation cutoff of >0.1 (Figure 5B). Interestingly, all MAS98.12 xenografts and the original tumor were classified as ECM1 and ECM3, respectively, while MAS98.06 and the paired primary tumor were assigned to ECM 2 and ECM4, respectively.
Figure 5.
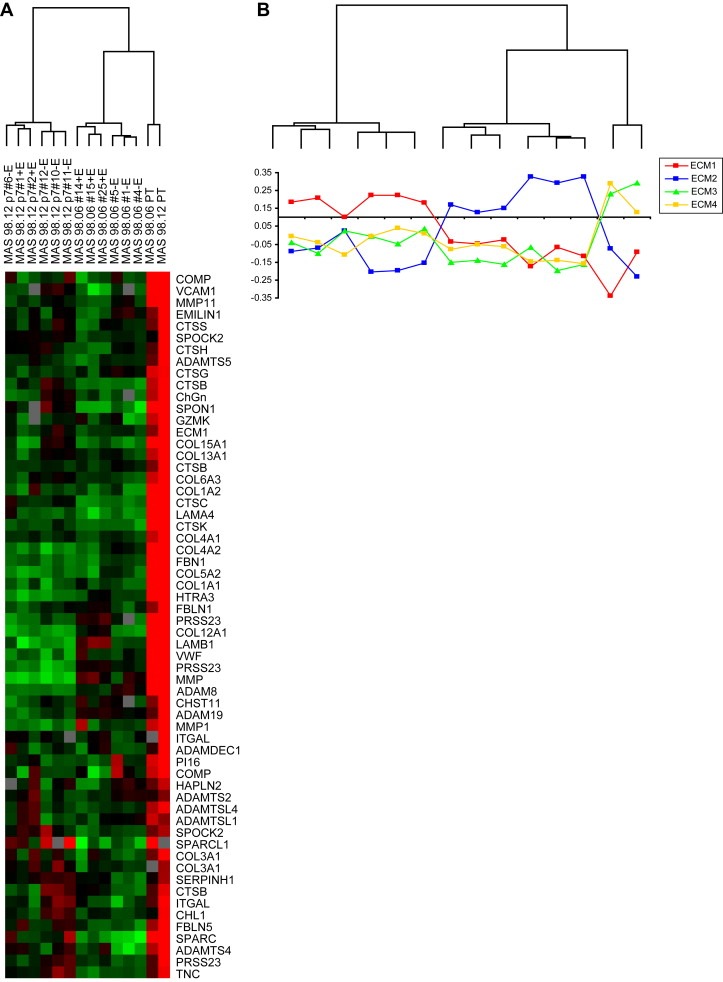
Expression patterns of 278 ECM‐related genes in a group of 12 breast carcinomas and two primary tumors. A) Cluster of ECM genes upregulated in primary tumors compared to xenografts. B) Correlation of each sample to each of the four ECM centroids. Tumors with low correlation (<0.11) were considered unclassified.
To further investigate whether the stroma in the xenografts contained murine components, qRT‐PCR using species‐specific primers and probes was performed. From the microarray results, we selected five genes (COL4A1, SPARC, CTSB, PECAM1, MMP11) that showed a differential expression between xenografts and primary tumors. As shown in Figure 6A, higher expression levels for COL4A1, SPARC and CTSB were detected when qRT‐PCR was carried out with mouse specific primers and probes. To further validate the results from both qRT‐PCR and microarrays, we carried out IHC staining using a variety of antibodies specific for mouse ECM proteins. Only anti‐COLIV showed no‐cross hybridization with human collagens and confirmed that the host is clearly supporting the production of this ECM structural protein. Interestingly, the detection of COLIV was not only restricted to the periphery of the tumor but was also found branching inside the engrafted tumors as seen in Figure 6B.
Figure 6.
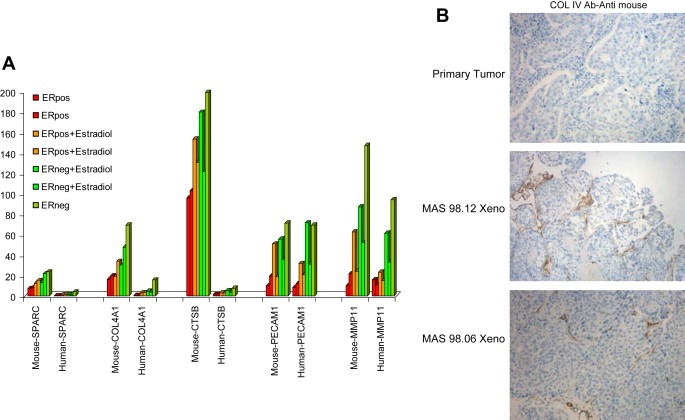
A) qRT‐PCR analysis of 5 ECM‐related genes. Expression levels were normalized against GAPDH using species‐specific primer for mouse and human. Representative xenograft samples are shown. B) Representative IHC staining for COLIV carried out in formalin‐fixed paraffin‐embedded sections of primary tumors and xenografts.
2.7. Intrinsic molecular subtypes
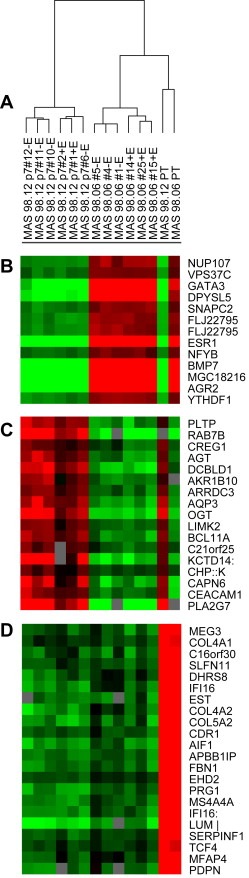
In an attempt to molecularly classify the xenograft models and the paired primary tumors, we included 40 well‐characterized primary tumors in addition to two xenograft replicates and their primary tumors, and employed unsupervised hierarchical clustering analysis of the “intrinsic” genes that identify the five molecular subtypes (Sorlie et al., 2003, 2001). We observed that the primary tumors clustered on the same main branch as their xenografts (Figure 7). Moreover, ER‐positive xenografts (MAS98.06) and the parental tumor tightly clustered with luminal‐B like tumors and showed an upregulation of proliferation genes, while MAS98.12 xenografts and primary tumors showed an expression profile resembling basal‐like phenotype.
Figure 7.
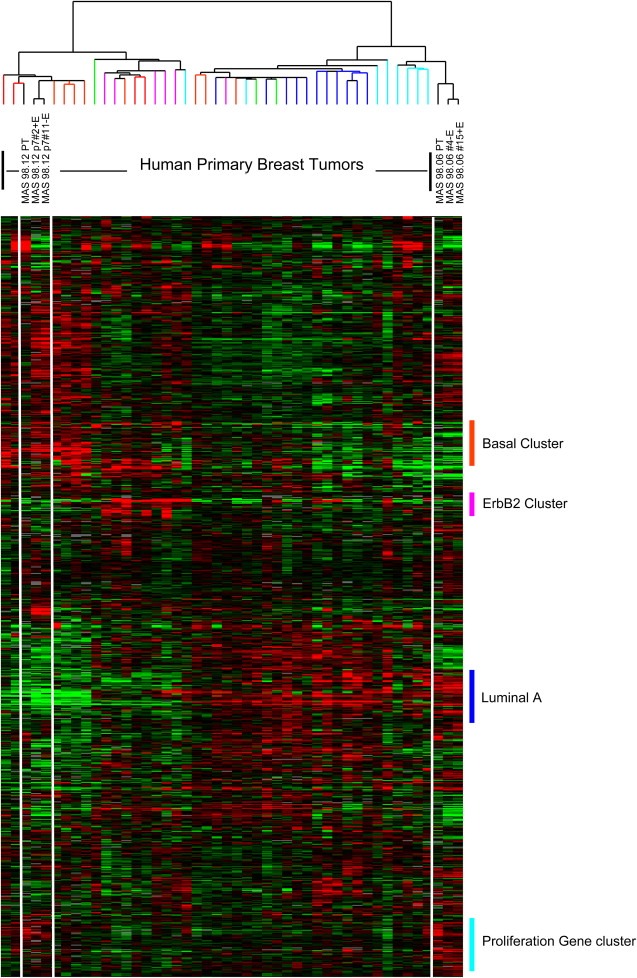
Expression patterns of “intrinsic molecular subtypes genes” in xenografts and primary tumors. 40 primary tumors were included in the analysis along with two representative xenograft replicates and their primary tumors. 822 clones corresponding to the original intrinsic genelist were clustered. Sample dendrogram branches are color‐coded based on centroid classification (Sorlie et al., 2003). Colored vertical bars indicate gene clusters typical for the different subtypes.
3. Discussion
The aim of the present study was to establish xenografts from human primary breast tumors to obtain an in vivo preclinical model better resembling the complexity of the disease. The success rate in establishing xenografts models from clinical samples is low and estimated around 10%. In our case, the engraftment rate after the second passage was ∼20%; 6 primary tumors out of 30 grew as tumors in the animals, but only two were maintained for more than 10 passages (∼7%). In this study, only one of the implanted patient tumors was triple negative, and the low success rate may reflect the high percentage of ER‐positive tumors included in the study. This is in agreement with another recent study, where the engraftment of 200 human breast cancer specimens (of which 70% were ER positive) resulted in only one ER‐positive xenograft (Marangoni et al., 2007). In order to improve the growth conditions for human breast cancer cells, investigators have used a humanized mammary fat pad by the injection of immortalized human breast fibroblasts (Luo et al., 2009). However, of the 48 primary tumors included in that study, only one of the eight successfully forming tumors was ER positive, confirming the low rate of engraftment for ER‐positive tumors.
We here report a detailed characterization of two primary engrafted tumors (named MAS98.06 and MAS98.12) and a thorough molecular comparison with paired original primary tumors. Histological analysis of low passage xenografts showed features of invasive ductal carcinoma resembling the primary tumors. Further, they maintained molecular markers such as ER protein expression. ER was detected in MAS98.06 primary tumor and maintained in MAS98.06 xenograft while the MAS98.12 xenograft was negative for ER, as the primary tumor. However, the MAS98.12 patient tumor was PgR positive, but the receptor expression was lost in the xenograft tumor. In a reevaluation of the staining, it may be commented that the PgR‐positive staining was weak in the majority of cells, and mainly located in the cytoplasm of the cells, not in the nuclei as required for a positive staining. A subset of patients with ERα negative, PgR‐positive tumors may respond to endocrine therapy (Dowsett et al., 2006), but this was not the case for this patient. This is not surprising, as indicated by the aggressiveness seen when the tumor was xenografted into immunodeficient mice. However, the presence of the PgR in the cells of the primary tumor is not conflicting with a basal‐like subtype in the primary tumor (Schneider et al., 2008; Rakha and Ellis, 2009). Additional analysis of the MAS98.12 biopsy by staining for the cytokeratin 5 and 6 protein revealed a focal positive staining (data not shown), strongly supporting the presence of cells with a basal‐like phenotype in this tumor.
Both xenografts harbored a homo/hemi‐zygous mutation of the TP53 gene. In the first mutation analysis, the MAS98.12 parental tumor biopsy was found to have a wild‐type TP53 gene. In a refined mutation analysis, a small subpopulation of cells were found to be mutated in codon 120 of the TP53 gene, similar to the xenograft tumors, indicating a selection pressure towards losing the wild‐type allele during tumor growth in the mice.
To determine to which extent the genomic phenotype was maintained by the engrafted tumors, we analyzed the genomic profile by oligonucleotide array‐CGH. The ERα positive xenograft and parental tumor shared the same main alterations. However, the xenografts showed a selection towards homozygous deletions. On the contrary, the ERα negative primary tumor showed a quasi‐normal profile while its xenografts showed a more complex phenotype. The expression profile of the MAS98.12 primary tumor showed similarities to the profile of a claudin‐low subtype of ER negative, therapy resistant basal‐like tumors (data not shown), recently described to have a signature of tumor initiating/tumor stem cells (Hennessy et al., 2009). Interestingly, the aCGH profile of these claudin‐low tumors showed very few genomic alterations, thus resembling the profile observed in MAS98.12 primary tumors. Further, the presence of a high fraction of non‐epithelial cells in the tissue from the primary tumor could have affected the analysis. Indeed, this tumor was highly infiltrated by inflammatory cells and may mask the status of TP53 mutation that was only detected in the xenograft tumors.
Expression profiling of xenografts and parental tumors followed by unsupervised clustering analysis organized xenografts and primary tumors in separated groups. By SAM analysis, we identified a set of ECM‐related genes downregulated by the tumors growing in animals compared to the primary tumors. In a recent study we have shown that primary breast carcinomas can be classified based on the expression of ECM‐related genes and that the four identified groups were associated with clinical outcome. To investigate whether primary tumors switched ECM expression profile after growing in the animal, we classified xenografts and the original tumors based on the centroids of the ECM signature. The ERα positive primary tumor (MAS98.06 PT) showed expression features of ECM4‐like tumors known to be enriched for Luminal A tumors and was associated with better prognosis. Interestingly, the xenografts derived from this tumor were all assigned to ECM2 which was the second most aggressive ECM phenotype and it is characterized by ERα positive tumors carrying TP53 mutations and tumors classified as luminal B (Bergamaschi et al., 2008). These data are in agreement with the intrinsic classification reported in Figure 7 where we observed that MAS98.06 primary tumor and xenografts clustered tightly with Luminal B tumors. Luminal B subtypes showed upregulation of proliferation genes that may help explain the success of engraftment of this ERα positive tumor.
The ERα negative xenografts (MAS98.12) showed characteristics of ECM1‐like tumors that in our previous study was mostly ERα negative basal‐like tumors and identified a poor prognostic group. By intrinsic molecular characterization, MAS98.12 xenografts and primary tumor clustered with basal‐like tumors and the results are in line with what is known from previous studies (Sorlie et al., 2003, 2001).
The switch in stroma composition observed in the xenografts is an interesting phenomenon. We hypothesized that this may possibly be due to a compensating overproduction of ECM‐related genes by the host, which was confirmed by qRT‐PCR on selected ECM genes using species‐specific probes. We observed that the stroma‐xenograft was characterized by several upregulated murine ECM components, indicating that the interaction between the human tumor cells and the host plays an important role in maintenance and growth of engrafted tumors. Moreover, by using an anti‐COLIV antibody specific for mice we could detect collagen IV infiltrating the xenograft tumors. Indeed as reported previously, stromal fibroblasts and host cells produce paracrine factors that have a profound influence on the growth of cancer cells, metastatic spread, and therapeutic response (Bhowmick et al., 2004).
In conclusion, this study reports the histological, molecular, and genetic characterization of two xenografts established from tumor biopsies obtained from patients, one ERα positive, and the other ERα negative. Based on the intrinsic “molecular subtype” classification, the ERα positive xenograft was identified as luminal‐like, known to be a tumor that rarely grows in mice. These two models are valuable representations of human breast cancer heterogeneity that may improve our understanding of the biology of this disease, and represent useful and important in vivo systems for further studies on testing and evaluating new treatments.
4. Experimental procedures
4.1. Patient material
Thirty primary tumors from 29 patients were implanted into SCID mice. Twenty two of the patients presented with infiltrating ductal carcinomas, four had infiltrating lobular carcinomas and three were diagnosed with mucinous carcinomas. The majority of patients (25 out of 29) had tumors >2cm (pT2), while four patients were found to have larger tumors (>5cm; pT3). Twenty five patients had WHO grade II or III tumors, and 15 patients were found to have lymph node metastases. Only one of the patients was both estrogen receptor (ER) and progesterone receptor (PgR) negative, while 26 were ER‐positive and 25 were PgR‐positive. Of the two tumors that eventually grew as xenografts, one (MAS98.06) was derived from a patient with a WHO grade III infiltrating ductal carcinoma pT2 which was ER and PgR positive, with metastasis to 12 of 25 lymph nodes at the time of diagnosis. The other xenograft, MAS98.12, originated from a patient with a WHO grade III infiltrating ductal carcinoma, pT2 that was ER negative and PgR positive, and without any lymph node metastasis. None of the patients had distant metastatic disease at the time of diagnosis.
4.2. Animals
All procedures and experiments involving animals were approved by The National Animal Research Authority, and carried out according to the European Convention for the Protection of Vertebrates used for Scientific Purposes. SCID mice were bred in our nude rodent facility. Animals were kept in a specific pathogen free environment, in positive pressure rooms with filtered and humidified air. Four to five week old female animals were used. During the procedure for tumor tissue implantation or passages, the mice were anesthetized by s.c. injection of a mixture containing 0.1mg/kg fentanyl, 5mg/kg fluanison and 2.5mg/kg midazolam.
4.3. Establishment of xenografts
The primary tumor tissues were placed in culture medium and transported from The Akershus University Hospital to The Norwegian Radium Hospital. Specimens were reduced into small pieces (2–3mm) and implanted subcutaneously in a back pocket of SCID mice, containing matrigel. All mice were maintained in the presence of continuous release 17β‐estradiol (E2) pellets (1.7mg/pellet, blood level>900pg/ml; Innovative Research of America, Sarasota, FL). Tumors were harvested and a small piece reimplanted subcutaneously as described above to generate a new passage when reaching a diameter of approximately 15mm.
From the two xenografts MAS98.06 and MAS98.12, six parallel tumors were maintained and used for the characterization, as described below. Three of the six MAS98.06 xenografts and two of the six MAS98.12 xenografts were obtained from animals supplemented with E2.
4.4. Tissue sampling for microarray and morphological examination
Xenograft tissues removed from the animals were immediately snap frozen in liquid nitrogen, and stored at −80°C until isolation of total RNA and DNA. Part of the tissues were sectioned and fixed in 4% formalin buffered in PBS, and prepared for histopathological examination by dehydration in gradients of ethanol and embedded in paraffin. Sections 5μm thick were cut, stained with hematoxylin and eosin (H&E), and examined under a light microscope. Fresh frozen tissue from the primary tumor was stored at −80°C until isolation of total RNA and DNA with the same procedures as for the xenograft tissue.
4.5. TP53 mutation analyses
TP53 mutations were detected by direct sequencing of exon 2–11 using an ABI 3730 DNA Analyzer (Applied Biosystems) and analyzed on SeqScape Software v5.2. Primer sequences can be found as supplementary material (Table S1).
4.6. Expression analysis
Total RNA from the 12 xenograft and the 2 primary tumors were isolated from 40mg of snap frozen tumor tissue following the TRIzol® manufacturer's instructions and resuspended in RNase‐free water. 400ng total RNA was amplified and labeled following the Agilent Low RNA Input Fluorescent Linear Amplification Kit protocol. Tumor RNA was labeled with Cy5 and the Universal Human Reference (Stratagene®) with Cy3. Hybridization of tumor and reference RNA was performed following the Agilent's oligonucleotide microarray hybridization user's manual. A total of 750ng labeled cRNA per channel was mixed and hybridized onto 44k 60‐mer Human Whole Genome Oligo Microarrays (G4110A) at 60°C and 4rpm for 17h.
The arrays were scanned using the Agilent dual‐laser DNA microarray scanner (G2565A) and data extracted by the Agilent Feature Extraction Software. All raw data can be obtained from the Stanford Microarray Database (http://genome‐www5.stanford.edu//).
Expression data from 40 primary breast tumors were included in the analysis for molecular classification of the xenografts and the respective primary tumors. Of these 40 tumors, 20 were previously published by Sorlie et al. (2006).
4.7. Array‐CGH analysis
Genomic DNA was isolated from xenografts and primary tumors by chloroform/phenol extraction followed by ethanol precipitation (Nuclear Acid Extractor 340A; Applied Biosystem) as described (Geisler et al., 2001). 1μg of DNA was labeled with Cy5 and combined with the same amount of Cy3 labeled reference (normal female DNA) and hybridized to Agilent's 244K Human Genome CGH Microarrays in SureHyb hybridization chambers rotated at 20rpm for 40h in a 65°C oven. After hybridization, microarrays were washed and immediately scanned by Agilent Microarray Scanner.
4.8. Data mining
4.8.1. Expression analysis
Fluorescence ratios were normalized by mean centering genes for each array. Only well measured genes showing a signal intensity over background >1.5 in both test and reference channels in at least 80% of the samples were included; ∼38.000 clones met these criteria. Hierarchical clustering was performed and displayed using Cluster and TreeView software (http://genome‐www5.Stanford.EDU/MicroArray/SMD/restech.html).
4.8.2. aCGH analysis
CGH images were processed by Feature Extraction Software and DNA gains and losses were identified applying the PCF CGH‐Explorer algorithm (Lingjaerde et al., 2005) to normalized and filtered data.
4.8.3. Centroid analysis
Based on the previously described breast cancer ECM subtypes (Bergamaschi et al., 2008), all samples were classified into one of the four ECM subtypes using a list of 278 genes. Correlations with the centroids were calculated for each specimen and samples that did not reach a correlation of >0.1 for any of the centroids were designated unclassified.
4.9. Statistical evaluation
4.9.1. Significance analysis of microarray
Significance analysis of microarray (SAM) (Tusher et al., 2001) was applied to all genes that passed filtering criteria. A two‐class test was carried out comparing xenografts group versus the primary tumors. A 10 nearest neighbor imputation engine was applied to estimate missing data and 100 permutations were carried out to calculate expected values and to calibrate false‐positive calls. False‐positive level was set to 5% for comparing samples from the estradiol treated and untreated animals, and for the comparison between xenografts and primary tumors at <1%.
4.9.2. Gene set enrichment analyses (GSEA)
GSEA (Subramanian et al., 2005) was performed on the genes that passed the filtering criteria to identify significantly differential expressed genes using the C2 v1 curated gene set collection from the MSigDb database.
4.10. Validation of microarray data
4.10.1. Northern blot analysis
Total RNA was extracted and analyzed by standard Northern blotting technique. Samples of 10μg RNA were subjected to gel electrophoresis before transfer onto Hybond‐N+ membranes (Amersham Life Sciences/GE Healthcare Life Sciences). The cDNA probes were labeled with [α‐32P] dCTP (Amersham Life Sciences/GE Healthcare Life Sciences) by random priming technique, and standard Church hybridization conditions were used (Church and Gilbert, 1984). To evaluate the amounts of RNA loaded, the filters were rehybridized to a kinase‐labeled oligonucleotide probe complementary to nucleotides 287–305 of human 18S rRNA. The probes used for Northern blot analyses were obtained from the following sources: ER‐α (ESR1) from Dr. MV Govindan (Le Centre Hospitalier de l'Université Laval, Quebec, Canada), pS2 (TTF1) from Dr. P. Chambon (l'Institut de Génétique et de Biologie Moléculaire et Cellulaire, Strasbourg, France), cyclin D1 (CCND1) from Dr. D. Beach (Howard Hughes Medical Institute, Cold Spring Harbor, NY), and TIMP‐1 (TIMP1) from British Biotech Pharmaceutical (Oxford, UK), uPAR (PLAUR) from Dr. N. Brünner (Rigshospitalet, Copenhagen), VEGF‐A (VEGF) from Dr. R.S. Kerbel (Sunnybrook Health Sciences Centre, Toronto, Canada).
4.10.2. qRT‐PCR of selected genes
Total RNA was isolated from 60 to 70mg of snap frozen tumor tissue following the TRIzol® manufacturer's instructions. cDNAs were reverse transcribed from 1μg of total RNA and quantitative (q)RT‐PCR was performed using Applied Biosystems (Foster City, CA) TaqMan probes and reagents on an ABI 7900 sequence detection system according to the manufacturer's instructions. PCR was initiated at 95°C for 15min (to activate the modified Taq polymerase), followed by a 40 cycle amplification (95°C 15s, 58°C 30s, 72°C 30s). Melting curve analysis was performed to ensure specific PCR product while excluding primer dimers. Comparative CT method (Livak and Schmittgen, 2001) was use to calculate relative gene expression levels which were normalized to GAPDH. PCR primers and probes were designed as species‐specific (mouse and human) and sequences are reported in Table S2.
4.10.3. IHC
Immunohistochemical staining was carried out on formalin‐fixed, paraffin‐embedded (FFPE) tumor sections. Collagen IV, Collagen I and SPARC were analyzed using respectively rabbit polyclonal anti‐mouse COLIV Mab (Acris antibodies GmbH, Hiddenhausen, Germany), rabbit polyclonal anti‐mouse COL I (novus Biologicals Inc., Littleton, USA) and rat monoclonal anti‐mouse SPARC Mab (R&D systems Inc., Minneapolis, USA). Antigen retrieval for collagens staining was carried out by heating slides for 10min at 95°C in 10mM citrate buffer, pH 6.0. The immuno‐reaction was enhanced by streptavidin–biotin peroxidase technique, followed by counterstaining with Carazzi Hematoxylin.
Supporting information
Fig. S1 Unsupervised hierarchical cluster of xenograft.
Fig. S2 Unsupervised hierarchical cluster of xenografts and primary tumors.
Fig. S3 Unsupervised hierarchical cluster of ECM‐related genes in xenografts and primary tumors.
Table S1 TP53 primer sequences.
Table S2 Species‐specific primers and probes sequences.
Table S3 SAM genelist.
Acknowledgments
We wish to thank Eldri Undlien Due, Phoung Vu, Caroline Frøyland and all the members of the Børresen‐Dale lab for helpful technical assistance, comments and discussions. The skillful technical assistance of Marita Martinsen, Solveig Garman‐Vik and Thomas Halvorsen is highly appreciated. Dr. Wenche Reed (MD, PhD) is acknowledged for valuable discussions on breast cancer pathology in the parental and xenograft tumors. This work was supported by grants to ALBD and to GMM from the Norwegian Cancer Society (Grant no. 80108003 and C99026, respectively) and the Research Council of Norway (Grant no. 175240/S10).
Supplementary information 1.
Supplementary data associated with this article can be found in the online version at doi: 10.1016/j.molonc.2009.07.003.
Bergamaschi Anna, Hjortland Geir Olav, Triulzi Tiziana, Sørlie Therese, Johnsen Hilde, Ree Anne Hansen, Russnes Hege Giercksky, Tronnes Sigurd, Mælandsmo Gunhild M., Fodstad Oystein, Borresen-Dale Anne-Lise, Engebraaten Olav, (2009), Molecular profiling and characterization of luminal‐like and basal‐like in vivo breast cancer xenograft models, Molecular Oncology, 3, doi: 10.1016/j.molonc.2009.07.003.
References
- Bergamaschi, A. , Kim, Y.H. , Wang, P. , Sorlie, T. , Hernandez-Boussard, T. , Lonning, P.E. , Tibshirani, R. , Borresen-Dale, A.L. , Pollack, J.R. , 2006. Distinct patterns of DNA copy number alteration are associated with different clinicopathological features and gene-expression subtypes of breast cancer. Genes Chromosomes Cancer. 45, (11) 1033–1040. [DOI] [PubMed] [Google Scholar]
- Bergamaschi, A. , Tagliabue, E. , Sorlie, T. , Naume, B. , Triulzi, T. , Orlandi, R. , Russnes, H.G. , Nesland, J.M. , Tammi, R. , Auvinen, P. , 2008. Extracellular matrix signature identifies breast cancer subgroups with different clinical outcome. J. Pathol.. 214, (3) 357–367. [DOI] [PubMed] [Google Scholar]
- Bhowmick, N.A. , Neilson, E.G. , Moses, H.L. , 2004. Stromal fibroblasts in cancer initiation and progression. Nature. 432, (7015) 332–337. [DOI] [PMC free article] [PubMed] [Google Scholar]
- Church, G.M. , Gilbert, W. , 1984. Genomic sequencing. Proc. Natl. Acad. Sci. U.S.A.. 81, (7) 1991–1995. [DOI] [PMC free article] [PubMed] [Google Scholar]
- Dowsett, M. , Houghton, J. , Iden, C. , Salter, J. , Farndon, J. , A'Hern, R. , Sainsbury, R. , Baum, M. , 2006. Benefit from adjuvant tamoxifen therapy in primary breast cancer patients according oestrogen receptor, progesterone receptor, EGF receptor and HER2 status. Ann. Oncol.. 17, (5) 818–826. [DOI] [PubMed] [Google Scholar]
- Geisler, S. , Lonning, P.E. , Aas, T. , Johnsen, H. , Fluge, O. , Haugen, D.F. , Lillehaug, J.R. , Akslen, L.A. , Borresen-Dale, A.L. , 2001. Influence of TP53 gene alterations and c-erbB-2 expression on the response to treatment with doxorubicin in locally advanced breast cancer. Cancer Res.. 61, (6) 2505–2512. [PubMed] [Google Scholar]
- Hayes, D.F. , Thor, A.D. , Dressler, L.G. , Weaver, D. , Edgerton, S. , Cowan, D. , Broadwater, G. , Goldstein, L.J. , Martino, S. , Ingle, J.N. , 2007. HER2 and response to paclitaxel in node-positive breast cancer. N. Engl. J. Med.. 357, (15) 1496–1506. [DOI] [PubMed] [Google Scholar]
- Hennessy, B.T. , Gonzalez-Angulo, A.M. , Stemke-Hale, K. , Gilcrease, M.Z. , Krishnamurthy, S. , Lee, J.S. , Fridlyand, J. , Sahin, A. , Agarwal, R. , Joy, C. , 2009. Characterization of a naturally occurring breast cancer subset enriched in epithelial-to-mesenchymal transition and stem cell characteristics. Cancer Res.. 69, (10) 4116–4124. [DOI] [PMC free article] [PubMed] [Google Scholar]
- Lingjaerde, O.C. , Baumbusch, L.O. , Liestol, K. , Glad, I.K. , Borresen-Dale, A.L. , 2005. CGH-Explorer: a program for analysis of array-CGH data. Bioinformatics. 21, (6) 821–822. [DOI] [PubMed] [Google Scholar]
- Livak, K.J. , Schmittgen, T.D. , 2001. Analysis of relative gene expression data using real-time quantitative PCR and the 2(-Delta Delta C(T)) Method. Methods. 25, (4) 402–408. [DOI] [PubMed] [Google Scholar]
- Luo, M. , Fan, H. , Nagy, T. , Wei, H. , Wang, C. , Liu, S. , Wicha, M.S. , Guan, J.L. , 2009. Mammary epithelial-specific ablation of the focal adhesion kinase suppresses mammary tumorigenesis by affecting mammary cancer stem/progenitor cells. Cancer Res.. 69, (2) 466–474. [DOI] [PMC free article] [PubMed] [Google Scholar]
- Marangoni, E. , Vincent-Salomon, A. , Auger, N. , Degeorges, A. , Assayag, F. , de Cremoux, P. , de Plater, L. , Guyader, C. , De Pinieux, G. , Judde, J.G. , 2007. A new model of patient tumor-derived breast cancer xenografts for preclinical assays. Clin. Cancer Res.. 13, (13) 3989–3998. [DOI] [PubMed] [Google Scholar]
- Massarweh, S. , Schiff, R. , 2007. Unraveling the mechanisms of endocrine resistance in breast cancer: new therapeutic opportunities. Clin. Cancer Res.. 13, (7) 1950–1954. [DOI] [PubMed] [Google Scholar]
- Piccart-Gebhart, M.J. , Procter, M. , Leyland-Jones, B. , Goldhirsch, A. , Untch, M. , Smith, I. , Gianni, L. , Baselga, J. , Bell, R. , Jackisch, C. , 2005. Trastuzumab after adjuvant chemotherapy in HER2-positive breast cancer. N. Engl. J. Med.. 353, (16) 1659–1672. [DOI] [PubMed] [Google Scholar]
- Rakha, E.A. , Ellis, I.O. , 2009. Triple-negative/basal-like breast cancer: review. Pathology. 41, (1) 40–47. [DOI] [PubMed] [Google Scholar]
- Romond, E.H. , Perez, E.A. , Bryant, J. , Suman, V.J. , Geyer, C.E. , Davidson, N.E. , Tan-Chiu, E. , Martino, S. , Paik, S. , Kaufman, P.A. , 2005. Trastuzumab plus adjuvant chemotherapy for operable HER2-positive breast cancer. N. Engl. J. Med.. 353, (16) 1673–1684. [DOI] [PubMed] [Google Scholar]
- Schneider, B.P. , Winer, E.P. , Foulkes, W.D. , Garber, J. , Perou, C.M. , Richardson, A. , Sledge, G.W. , Carey, L.A. , 2008. Triple-negative breast cancer: risk factors to potential targets. Clin. Cancer Res.. 14, (24) 8010–8018. [DOI] [PubMed] [Google Scholar]
- Sorlie, T. , Wang, Y. , Xiao, C. , Johnsen, H. , Naume, B. , Samaha, R.R. , Borresen-Dale, A.L. , 2006. Distinct molecular mechanisms underlying clinically relevant subtypes of breast cancer: gene expression analyses across three different platforms. BMC Genomics. 7, 127 [DOI] [PMC free article] [PubMed] [Google Scholar]
- Sorlie, T. , Tibshirani, R. , Parker, J. , Hastie, T. , Marron, J.S. , Nobel, A. , Deng, S. , Johnsen, H. , Pesich, R. , Geisler, S. , 2003. Repeated observation of breast tumor subtypes in independent gene expression data sets. Proc. Natl. Acad. Sci. U.S.A. 100, (14) 8418–8423. [DOI] [PMC free article] [PubMed] [Google Scholar]
- Sorlie, T. , Perou, C.M. , Tibshirani, R. , Aas, T. , Geisler, S. , Johnsen, H. , Hastie, T. , Eisen, M.B. , van de Rijn, M. , Jeffrey, S.S. , 2001. Gene expression patterns of breast carcinomas distinguish tumor subclasses with clinical implications. Proc. Natl. Acad. Sci. U.S.A. 98, (19) 10869–10874. [DOI] [PMC free article] [PubMed] [Google Scholar]
- Subramanian, A. , Tamayo, P. , Mootha, V.K. , Mukherjee, S. , Ebert, B.L. , Gillette, M.A. , Paulovich, A. , Pomeroy, S.L. , Golub, T.R. , Lander, E.S. , 2005. Gene set enrichment analysis: a knowledge-based approach for interpreting genome-wide expression profiles. Proc. Natl. Acad. Sci. U.S.A. 102, (43) 15545–15550. [DOI] [PMC free article] [PubMed] [Google Scholar]
- Tusher, V.G. , Tibshirani, R. , Chu, G. , 2001. Significance analysis of microarrays applied to the ionizing radiation response. Proc. Natl. Acad. Sci. U.S.A. 98, (9) 5116–5121. [DOI] [PMC free article] [PubMed] [Google Scholar]
- Winer, E.P. , Berry, D.A. , Woolf, S. , Duggan, D. , Kornblith, A. , Harris, L.N. , Michaelson, R.A. , Kirshner, J.A. , Fleming, G.F. , Perry, M.C. , 2004. Failure of higher-dose paclitaxel to improve outcome in patients with metastatic breast cancer: cancer and leukemia group B trial 9342. J. Clin. Oncol.. 22, (11) 2061–2068. [DOI] [PubMed] [Google Scholar]
Associated Data
This section collects any data citations, data availability statements, or supplementary materials included in this article.
Supplementary Materials
Fig. S1 Unsupervised hierarchical cluster of xenograft.
Fig. S2 Unsupervised hierarchical cluster of xenografts and primary tumors.
Fig. S3 Unsupervised hierarchical cluster of ECM‐related genes in xenografts and primary tumors.
Table S1 TP53 primer sequences.
Table S2 Species‐specific primers and probes sequences.
Table S3 SAM genelist.