

Abstract
Sensory perception, including 2-point discrimination (2ptD), is tightly linked to cortical processing of tactile stimuli in primary somatosensory cortices. While the role of cortical activity in response to a tactile stimulus has been widely investigated, the role of baseline cortical activity is largely unknown. Using resting state fMRI we investigated the relationship between local BOLD fluctuations in the primary somatosensory cortex (the representational field of the hand) and 2ptD of the corresponding index finger (right and left). Cortical activity was measured using fractional amplitudes of the low frequency BOLD fluctuations (fALFF) and synchronicity using regional homogeneity (ReHo) of the S1 hand region during rest. 2ptD correlated with higher ReHo values in the representational areas of the contralateral S1 cortex (left hand: p = .028; right hand: p = .049). 2ptD additionally correlated with higher fALFF in the representational area of the left hand (p = .007) and showed a trend for a significant correlation in the representational area of the right hand (p = .051). Thus, higher BOLD amplitudes and synchronicity at rest, as measures of cortical activity and synchronicity, respectively, are related to better tactile discrimination abilities of the contralateral hand. Our findings extend the relationship seen between spontaneous BOLD fluctuations and sensory perception.
Keywords: Fractional amplitude of low frequency fluctuations, Regional homogeneity, Resting state fMRI, Tactile perception
1. Introduction
Sensory perception is tightly linked to cortical representation in primary somatosensory cortices (S1). For example, tactile discrimination abilities, have consistently shown relationships with a number of cortical processing markers. Predictive measures include changes in S1 cortical activity (Hoeffken et al., 2007; Pleger et al., 2006, 2001; Ragert et al., 2003; Tegenthoff et al., 2005), finger map size (Duncan & Boynton, 2007), and EEG oscillations (Adhikari, Sathian, Epstein, Lamichhane, & Dhamala, 2014), confirming that activity in S1 is related to task performance.
Tactile discrimination performance could additionally be predicted by blood oxygen level dependent (BOLD) responses evoked by tactile stimulation using fMRI (Pleger et al., 2003; Stilla, Deshpande, LaConte, Hu, & Sathian, 2007; Zhang et al., 2005), extending the behavioral link between tactile performance and cortical activity to even a relatively slow, but indisputably relevant (Logothetis, Pauls, Augath, Trinath, & Oeltermann, 2001), measure of cortical activity. This was independent of whether tactile discrimination was measured using two-point discrimination (2ptD) thresholds (Pleger et al., 2003) or using grating orientation discrimination (Stilla et al., 2007; Zhang et al., 2005), suggesting that both are reliable measures of tactile discrimination and relate in a similar way to the BOLD response in S1.
More recently, cortical activity’s relevance to task performance has been extended past the “task-on” phases to periods where the task is not present. Pre-stimulus cortical activity, for example, has proven its predictive potential in pain to a laser stimulus (Boly et al., 2007), a visual perception task (Hesselmann, Kell, Eger, & Kleinschmidt, 2008), and even a frequency-discrimination task (Haegens, Händel, & Jensen, 2011). While these examples represent “task-free” phases, since they are before the stimulus, there is an indirect task effect that cannot be resolved using activity shortly following or even prior to an expected task. As such, pre-stimulus activity is distinctly different from a baseline condition, which is measured over a task-free period with no expectation or immediate memory of a task. This “task-free”, or baseline, condition is termed “resting state”. It has, to date, been shown that resting state BOLD activity has predicted performance in other modalities, such as in motor (Fox, Snyder, Vincent, & Raichle, 2007) and visual tasks (Baldassarre et al., 2012). It is not yet clear, however, if tactile discrimination is also related to baseline activity, even though it has been shown to be related to task-evoked activity.
Therefore, we used resting state fMRI to investigate whether tactile discrimination, specifically 2ptD, could be reflected by baseline brain activity. Resting state activity was measured using the fractional amplitudes of the low frequency fluctuations (fALFF) of the BOLD signal during resting state, which provide a ratio of the power of low frequency fluctuations to all frequencies measured (Song et al., 2011; Zou et al., 2008), and which are believed to be related to spontaneous cortical activity in gray matter. Regional synchronicity (ReHo), a measure the synchronicity of the BOLD fluctuations in a given region, was additionally assessed (An et al., 2013; Liu et al., 2008; Zang, Jiang, Lu, He, & Tian, 2004).
Since the amplitudes of resting BOLD fluctuations have previously been shown to predict task-evoked BOLD activation as well as relate to cognitive performance (Feng, Feng, & Chen, 2013; Hao et al., 2013; Mennes et al., 2011; Wang et al., 2013; Wei et al., 2012; Xu et al., 2014), and ReHo has been shown to be elevated in the S1 cortex of acupuncturists (known for having high tactile discrimination ability) (Dong et al., 2013), we hypothesized that the local fALFF and ReHo values in the S1 hand region would likewise relate to sensory performance, here in terms of tactile acuity.
2. Experimental procedures
2.1. Subjects and behavioral measures
Twenty-four right-handed subjects participated in this study. Five subjects were excluded from further analysis due to either excessive movement in the scanner, incomplete data, or use of medication. This resulted in 19 subjects (11 men, 8 women; aged 24 ± 3.8 years) included in the analysis, all of whom fell within the normal range of depression and trait anxiety levels, as assessed using the Beck Depression Inventory (BDI, Beck, 1987) and State-Trait Anxiety Inventory (STAI, Spielberger, Gorsuch, Lushene, Vagg, & Jacobs, 1983), respectively. 2ptD thresholds of the index fingerpad of the left and right hands were measured outside the scanner using an in-house constructed device (see below). The study was performed in accordance with the Declaration of Helsinki and had been approved by the local ethics committee of the Ruhr-University Bochum. Prior to enrollment study participants gave written, informed consent.
2.2. Two-point discrimination thresholds
2-point discrimination (2ptD) thresholds were assessed on the tip of the index finger (D2) of both hands by using the method of constant stimuli (Kalisch, Ragert, Schwenkreis, Dinse, & Tegenthoff, 2009). A custom-made device was used to measure the 2ptD thresholds at a fixed location on the skin of the fingertips by rapidly switching between stimuli (Fig. 1). The device has been proven to reliably stabilize the hand and blind the subjects to avoid pressure-related and anticipatory confounds. The stimuli consisted of seven pairs of brass needles with individual spacing (ranging from .7 to 2.5 mm in increments of .3 mm) and a single needle as zero distance (control condition). Brass pins were .7 mm thick with blunt tips of approximately 200 μm in diameter. Tactile stimuli were applied for approximately 1 sec (estimated range: 700–1300 sec) with application forces ranging between 150 and 200 mN. The participants were instructed to place their finger on the support and to maintain this initial position of the finger throughout the experiment. Probes were presented ten times in randomized order resulting in 80 trials per session. Application force was controlled by the fixed set up and by an experienced investigator (TK). Any variation in application force is therefore expeded to be minimal and controlled for via repetitions. Participants were not informed about the ratio of paired to single needles being 7:1. The participants had to decide immediately after stimulus contact if they had the sensation of one or two needles being applied; they had to report the percept of a single needle (or any ambiguous stimulus) as “1” and the distinct percept of two needle tips as “2”. The tip spacing was plotted against the percentage of double-tip responses given and fitted by a binary logistic regression, resulting in a psychometric function where chance level of the sigmoid fit marked the individual 2ptD threshold. All participants underwent one training session in order to familiarize themselves with the testing procedure.
Fig. 1.
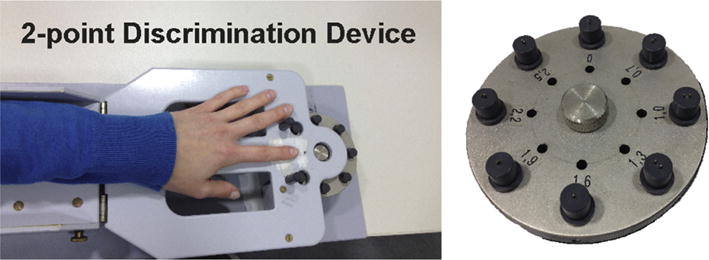
Two-point discrimination set-up. Seven different inter-pin distances (.7–2.5 mm) and 1 control pin (0 mm) are presented to the stationary index finger in random order by the experimenter using the in-house-built device shown here.
2.3. MRI protocol
Participants were scanned in a Phillips 3.0 T Achieva X scanner using a 32-channel head coil. Functional images (Gradient-echo EPI, TR = 2500 TE = 35 msec, Flip angle = 90°, FOV: 224 × 232 mm, 39 axial slices, slice thickness = 3 mm, no gap, 200 scans, 5 dummy scans, total acquisition time: 8 min 37 sec) were acquired with the participants’ eyes closed under the instruction to “not think about anything in particular”. High-resolution, T1-weighted, structural images (MPRAGE, TR/TE: 8.5/3.9 msec, voxel size (1 mm)3 isotropic) were also acquired to create individual gray- and white-matter masks using SPM8 for subsequent noise removal from the resting state BOLD signal and to localize the hand knob in the primary motor cortex as a landmark of the representational field of the hand in the adjacent S1 cortex.
2.4. Image preprocessing and statistical analysis
Preprocessing of resting state functional images was performed with SPM8 and included slice time correction, spatial realignment, normalization to the EPI template, without any additional spatial smoothing. Covariate removal (individual CSF, WM, 6 head motion parameters) was accomplished using the aCompCorr method provided by the Conn Toolbox (v13o) (Behzadi, Restom, Liau, & Liu, 2007; Whitfield-Gabrieli & Nieto-Castanon, 2012) using the individual tissue masks obtained from segmentation of the normalized high resolution T1 images. fALFF (.01–.08 Hz) and ReHo (KCC, 26 neighbors) z-scores were then calculated using the data processing assistant provided by the REST Toolbox (DPARSFA, REST version 2.4) (Song et al., 2011) within the whole brain SPM gray-matter (GM) mask. The GM mask was binarized using a threshold of .4 (i.e., only voxels with a likelihood of being gray matter at or above 40% were included in the analysis).
2.5. fALFF and ReHo
The amplitude of the low frequency fluctuations (ALFF) measures local activity of a given region (Zang et al., 2007). ALFF values are calculated by applying a fast Fourier transformation to the BOLD time series of each voxel, giving the power of each frequency over time. The square root of the power of frequencies between .01 and .08 Hz is proportional to the amplitudes of the BOLD signal and the changes in these amplitudes are considered the fluctuations of the BOLD signal. Dividing the low frequency band (.01–.08 Hz) by all frequencies measured proved more specific and sensitive to BOLD signal within gray matter as compared to CSF (Zou et al., 2008). This measure is termed fractional ALFF (fALFF) and is considered to be a more gray matter-specific measure of local spontaneous brain activity than ALFF (An et al., 2013; Zou et al., 2008) (see Fig. 2).
Fig. 2.
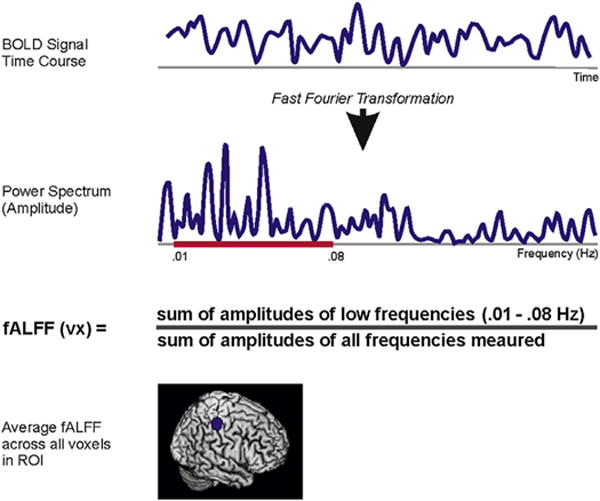
Fractional amplitude of low frequency fluctuations. The BOLD signal time course is extracted for each voxel of the brain. The power spectrum (proportional to amplitude) is obtained by applying a fast Fourier transformation to the BOLD time course. fALFF for the voxel is calculated as the ratio of the sum of the amplitudes (square root of the power) of frequencies .01–.08 Hz and the sum of the amplitudes of all frequencies measured (0–.2 Hz). ROI-level fALFF values are the average of all voxels’ fALFF values (in z-scores). ROI = region of interest.
Regional homogeneity (ReHo) values were determined using the Kendall coefficient of concordance (KCC), which is a value between 0 and 1 given to a voxel that describes how homogeneous its time series is with its neighboring voxels (26 neighbors in this study) (Liu et al., 2008; Zang et al., 2004). ReHo values closer to 1 indicate higher concordance or local homogeneity. fALFF and ReHo maps were converted to z-scores before performing statistical analyses.
Following a standardized procedure, DPARSFA calculated the mean and standard deviation fALFF or ReHo value, for each individual, within the thresholded whole brain GM mask. Z-scores were then calculated on a voxel-wise basis by subtracting the individual’s mean fALFF or ReHo value from each voxel’s value and then dividing by the standard deviation of fALFF or ReHo value, respectively, again for that individual. In this way, z-score values represent a voxel’s fALFF or ReHo value in relation to all other gray matter voxels in the brain. Positive z-scores, therefore, are taken to represent those voxels with higher activity (fALFF) or synchronicity (ReHo), than the average gray matter voxel in that individual’s brain. Likewise, negative z-scores represent voxels below average activity or synchronicity in that individual’s gray matter.
2.6. Regions of interest (ROIs) and statistical analysis
ROIs were determined individually using each participant’s normalized (MNI) 3D T1 image. A spherical ROI (8 mm radius) was centered on the midline of the postcentral gyrus of both left and right hemispheres, just posterior to the hand knob of the motor cortex, for the ‘S1 Hand knob’ ROIs, which could be identified for all subjects (See Table 1). To investigate the specific relevance of fALFF and ReHo measures within the primary sensorimotor cortex (SI) to tactile performance, as opposed to the same measures in other primary sensory cortices, which do not play a role in 2ptD thresholds, additional ROIs (8-mm spheres) were placed bilaterally in the primary visual (V1) and auditory (A1) cortices. V1 ROIs were placed using the calcarine sulcus as a landmark, and A1 ROIs were placed using the superior temporal gyrus, again separately for each participant using their normalized T1 structural image.
Table 1.
Descriptive statistics.
| Subject | Age | Gender | 2ptD (mm)
|
Left S1 ROI
|
Right S1 ROI
|
|||||
|---|---|---|---|---|---|---|---|---|---|---|
| Right hand | Left hand | MNI coordinates | fALFF | ReHo | MNI coordinates | fALFF | ReHo | |||
| 1 | 22 | f | 1.49 | 1.41 | −44, −28, 51 | .12 | .04 | 33, −32, 56 | .07 | −.10 |
| 2 | 27 | f | 1.64 | 1.83 | −45, −27, 52 | .18 | .26 | 39, −30, 54 | .11 | .20 |
| 3 | 32 | m | 1.48 | 1.21 | −44, −26, 51 | .52 | .93 | 42, −26, 51 | .25 | .72 |
| 4 | 25 | f | 1.41 | 1.22 | −45, −26, 50 | −.05 | −.18 | 39, −28, 54 | .19 | .00 |
| 5 | 22 | f | 1.56 | 1.37 | −42, −28, 52 | .30 | .30 | 32, −32, 56 | .18 | .21 |
| 6 | 20 | m | 1.83 | 1.68 | −39, −30, 52 | .05 | .02 | 39, −28, 56 | .09 | −.05 |
| 7 | 25 | m | 1.51 | 1.69 | −39, −30, 52 | .05 | .08 | 38, −30, 57 | .03 | −.20 |
| 8 | 21 | m | 1.48 | 1.29 | −44, −28, 54 | .28 | .67 | 45, −24, 50 | .18 | .15 |
| 9 | 21 | f | 1.69 | 1.67 | −42, −27, 52 | .06 | .40 | 40, −27, 56 | .05 | .29 |
| 10 | 30 | m | 1.47 | 1.45 | −44, −28, 52 | .11 | .08 | 42, −26, 51 | .05 | .19 |
| 11 | 21 | m | 1.70 | 1.60 | −44, −27, 51 | .06 | −.30 | 42, −27, 54 | .07 | −.06 |
| 12 | 24 | f | 1.72 | 1.72 | −44, −27, 51 | −.01 | .02 | 45, −24, 51 | −.05 | −.05 |
| 13 | 26 | m | 1.78 | 1.57 | −42, −28, 54 | .06 | −.17 | 45, −24, 52 | .06 | .11 |
| 14 | 22 | f | 1.75 | 1.76 | −45, −27, 51 | .13 | −.02 | 46, −22, 54 | .06 | .14 |
| 15 | 21 | m | 1.41 | 1.49 | −44, −30, 54 | .41 | .69 | 45, −24, 54 | .35 | .51 |
| 16 | 19 | f | 1.64 | 1.56 | −45, −27, 56 | .06 | −.05 | 45, −24, 52 | .15 | .18 |
| 17 | 30 | m | 1.54 | 1.54 | −45, −26, 52 | .25 | .56 | 45, −24, 52 | .17 | .17 |
| 18 | 26 | m | 1.60 | 1.45 | −48, −22, 50 | .13 | .17 | 44, −24, 52 | .04 | −.04 |
| 19 | 24 | m | 1.49 | 1.18 | −45, −27, 52 | .21 | .46 | 48, −21, 51 | .24 | 1.02 |
| Mean ± SEM. | 1.59 ± .03 | 1.51 ± .04 | .15 ± .03 | .20 ± .08 | .12 ± .02 | .18 ± .07 | ||||
Subjects’ behavioral performance (2ptD of index finger of specified hand), resting state parameter values, and central coordinates for the left and right S1 ROIs. fALFF and ReHo values are given in z-scores. S1 = primary somatosensory cortex; f = female; m = male; MNI = Montreal Neurological Institute; fALFF = fractional Amplitude of Low Frequency Fluctuations, ReHo = Regional Homogeneity; ROI = Region of Interest.
The mean was extracted from the fALFF and ReHo z-score maps for the S1 hand, V1, and A1 ROIs and was then linearly correlated with the 2ptD thresholds of the contralateral hand using Statistica (StatSoft, Inc. version 10). Multiple regression analyses including age and gender with either fALFF or ReHo determined the combination of factors that maximally explained the variance in 2ptD thresholds (forward stepwise, highest adjusted R2). Additional multiple regression analyses further investigated the relationship between resting state parameters and 2ptD thresholds when controlling for percent GM in the individual ROIs. Independent Student’s t-tests compared differences due to gender and paired Student’s t-tests compared 2ptD between left and right index fingers as well as fALFF and ReHo scores between hemispheres. 2ptD thresholds are presented as mean ± SEM.
3. Results
3.1. Tactile performance
2ptD thresholds ranged from 1.41 to 1.83 mm (1.59 ± .13 mm) for the right index finger and from 1.18 to 1.83 mm (1.51 ± .19 mm) for the left index finger (Table 1). No gender differences were seen in 2ptD of the right (t = .70, p = .50) or the left (t = 1.1, p = .28) hand. These values are within the range reported by previous studies (Kalisch et al., 2009; Ragert et al., 2003).
3.2. Local resting state measures in S1
fALFF scores in the left S1 hand ROI were negatively correlated with 2ptD thresholds of the contralateral hand (right S1 to left hand: p = .007, R2 = .32; Table 2; Fig. 3) i.e., study participants with higher fALFF scores tended to have lower 2ptD thresholds. The correlation between the right S1 hand ROI and left hand 2ptD thresholds fell just below the significance threshold (left S1 to right hand: p = .051, R2 = .16; Table 2; Fig. 3). ReHo scores were also negatively correlated with 2ptD thresholds of the contralateral hand (right S1 to left hand: p = .028, R2 = .21; left S1 to right hand: p = .049, R2 = .16; Table 2; Fig. 3).
Table 2.
Behavioral correlations.
| Comparison | ROI | Uncorrecteda
|
Corrected for GM%b
|
||
|---|---|---|---|---|---|
| R2c | p | R2c | p | ||
| fALFF-2ptD | Right S1 | .32 | .007** | .29 | .03* |
| Left S1 | .16 | .05 (ns) | .14 | .04* | |
| Right V1 | <.01 | .85 | <.01 | .84 | |
| Left V1 | <.01 | .44 | .15 | .13 | |
| Right A1 | <.01 | .63 | <.01 | .45 | |
| Left A1 | .18 | .04* | .14 | .05* | |
| ReHo-2ptD | Right S1 | .21 | .03* | .33 | .03* |
| Left S1 | .16 | .05* | .13 | .05* | |
| Right V1 | <.01 | .60 | <.01 | .59 | |
| Left V1 | <.01 | .89 | .03 | .61 | |
| Right A1 | <.01 | .90 | <.01 | .96 | |
| Left A1 | <.01 | .67 | <.01 | .76 | |
| fALFF–ReHo | Right S1 | .44 | <.002** | .69 | <.0001**** |
| Left S1 | .76 | <.0001**** | .76 | <.0001**** | |
| Right V1 | .55 | <.0001**** | .54 | <.0001**** | |
| Left V1 | .66 | <.0001**** | .65 | <.0001**** | |
| Right A1 | .60 | <.0001**** | .59 | <.001*** | |
| Left A1 | .02 | .26 | <.01 | .29 | |
Linear regression analysis between resting state parameters and two-point discrimination of the contralateral hand and between fALFF and ReHo within a ROI.
p < .05,
p < .01,
p < .001
p < .0001.
fALFF = fractional Amplitude of Low Frequency Fluctuations, ReHo = Regional Homogeneity.
“Uncorrected” refers to the simple regression between the resting state measure and 2ptD without additional nuisance covariates.
“Corrected for GM%” refers to the partial correlation between the resting state parameter and 2ptD of the contralateral hand when controlling for GM% of the ROI.
R2 is the adjusted R2 value to control for the different number of predictors in uncorrected and corrected models.
Fig. 3.
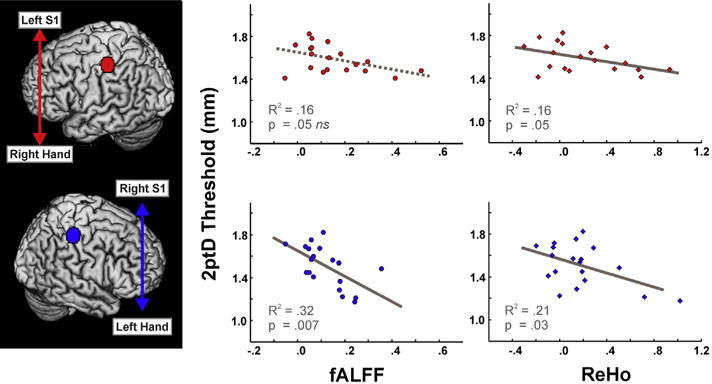
Two-point discrimination and resting state fMRI parameters. Higher fALFF (left column, circles) and ReHo (right column, diamonds) values of the S1 hand ROI in the left (top row) and right (bottom row) hemispheres are related to lower two-point discrimination thresholds (i.e., better performance) of the contralateral hand. All fALFF and ReHo scores are shown as z-scores. 2ptD = 2-point discrimination; S1 = primary somatosensory cortex.
The inclusion of age and gender in the regression analysis provided no additional explanation of the variance in 2ptD thresholds. Gender also had no significant effect on fALFF (p > .15) or ReHo (p > .26) scores of either hemisphere. fALFF values for S1 hand ROIs were comparable for left and right hemispheres (t = 1.45, p = .16), as were ReHo scores (t = .36, p = .72).
3.3. Local resting state measures in V1 and A1
No relationship was found between 2ptD thresholds of the contralateral hand and ReHo values of V1 or A1 ROIs. Likewise, fALFF for both V1 ROIs as well as for the right A1 ROI showed no correlation with 2ptD thresholds nor with fALFF values of the ipsilateral S1 hand ROI. The left A1 ROI negatively correlated with 2ptD thresholds of the right hand, and also showed a strong positive relationship with the fALFF value of the left S1 hand ROI (R2 = .33, p = .006).
3.4. fALFF and ReHo
fALFF and ReHo scores were highly correlated in all ROIs investigated, with the exception of the left A1 (See Table 2). FALFF in the S1 hand region, for example, positively correlated with ReHo in both left (R2 = .76, p < .0001) and right (R2 = .44, p < .002) hemispheres. A voxel-level analysis within the S1 hand ROIs additionally showed a strongly positive correlation for the left (R2 = .32, p < .001) and right (R2 = .27, p < .001) hemispheres (Fig. 4), resulting in an overall significant correlation between fALFF and ReHo (R2 = .30, p < .001).
Fig. 4.
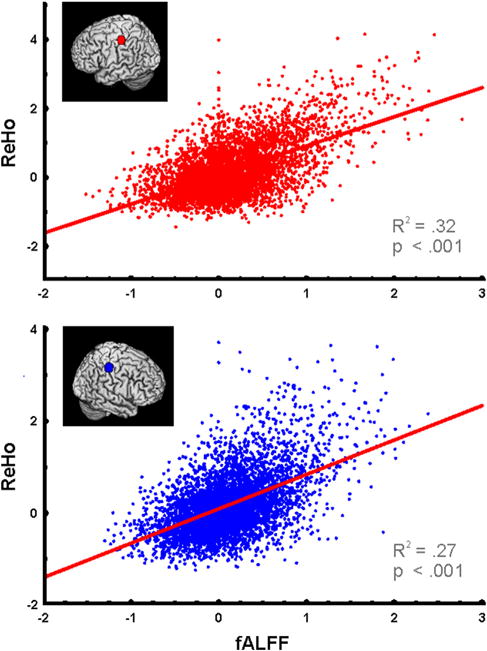
fALFF and ReHo. Voxelwise analysis of fALFF and ReHo z-scores within individuals’ left (top) and right (bottom) S1 hand knobs.
3.5. Partial volume effects
There were no direct correlations between percent GM in the individual ROIs and 2ptD thresholds (p > .05). The addition of percent GM to the relationships measured between fALFF and 2ptD showed no consistent changes, however it strengthened the relationship between the left S1 and the right hand, and slightly weakened the relationship between the right S1 and the left hand (See Table 2). Relationships between ReHo and 2ptD and between fALFF and ReHo were minimally affected (Table 2).
4. Discussion
In this study we investigated the relationship between somatosensory cortical brain activity at rest and tactile discrimination abilities. We found that higher resting state activity and synchronicity in the S1 hand regions, as measured by resting state BOLD fluctuations and ReHo, respectively, relate to better tactile acuity of the contralateral hand. So far, using fMRI techniques, tactile acuity has been investigated by task-related BOLD activations and more recently by means of connectivity analyses (Sathian, Deshpande, & Stilla, 2013), but not by local measures of resting state BOLD fluctuations. We demonstrate here for the first time that resting state BOLD measures of cortical activity and synchronicity predict baseline tactile acuity.
4.1. Cortical activity and 2ptD
The BOLD signal provides information about neural activity on the basis of the neurovascular coupling that necessitates an influx of oxygenated blood to areas of higher neural activity and thus higher local metabolism (Logothetis et al., 2001; Maandag et al., 2007; Smith et al., 2002). The greater the changes in neural activity associated with a task, the higher the influx of oxygenated blood, and the higher the signal-to-noise ratio of the measured signal. Likewise, the BOLD signal during resting state fMRI is thought to reflect an accumulation of spontaneous neural activity (Magri, Schridde, Panzeri, Murayama, & Logothetis, 2011). Instead of measuring the BOLD response to a task, resting state fMRI measures the BOLD fluctuations, where the power, specifically of the low frequency fluctuations (<.1 Hz) is proportional to the amplitude of the fluctuations (Zang et al., 2007). Larger amplitudes thus reflect higher, and/or more synchronized (intravoxel synchronicity), underlying neural activity. Therefore, the larger S1 BOLD signal fluctuations measured in this study (fALFF) can be interpreted as higher and/or more synchronized underlying S1 neural activity. Against this background our results suggest that higher S1 neural activity, as assessed by resting state BOLD fluctuations, is related to better tactile discrimination.
How “baseline” activity is defined, has been a matter of debate in fMRI. Earlier definitions of baseline included the time leading up but not including the event (i.e., pre-stimulus), however the notion that rest periods between tasks can be taken as a baseline measure has been challenged (Stark & Squire, 2001). The growing field of resting state fMRI suggests baseline activity be measured in a scan separate from task in order for it to be considered task-independent. However, even with the potential confounds of tasks, pre-stimulus BOLD activity has been shown to relate to visual perception (Hesselmann et al., 2008) and pain intensity (Boly et al., 2007). Interestingly, using separate task and rest scans, Fox and colleagues (Fox et al., 2007) reported that while differences in button press force were indeed associated with different task-evoked BOLD amplitudes, the differing BOLD responses were in turn also associated with underlying resting state BOLD activity. We now extend upon these findings providing evidence that in the case of somatosensation, resting state activity is directly linked to performance, suggesting that the localized BOLD activity (at rest) can indeed be considered a surrogate marker of subsequent behavior.
4.2. Cortical synchronicity and 2ptD
In addition to BOLD amplitudes, our results suggest that the ReHo of the BOLD signal also predicts tactile performance. Namely, the more synchronous the signal from voxels within the S1 hand region are with their neighbors (intervoxel synchronicity) at rest, the better the contralateral hand can distinguish two points in space. These results agree with previous results from Pleger and colleagues (Pleger et al., 2001), which show that synchronizing neural activity in the S1 hand region improves tactile discrimination, and with data from the macaque visual cortex, which show that increased local synchronization within V4 relates to improved orientation discrimination performance (Wang, Illiescu, Ma, Josic, & Dragoi, 2011). Interestingly, it was additionally shown that synchronizing the activity enlarged the cortical representation of the fingers, and that the enlargement also correlated with improvement in tactile discrimination (Pleger et al., 2003). Our results support the aforementioned previous studies, all of which link local synchronicity and sensory discrimination performance, and by extending these findings to the “resting” human brain, our data suggest that tactile discrimination is inherently linked to the implicit synchronicity within the S1 hand region. Importantly, the relationship between tactile performance and cortical synchronization did not extend to other primary sensory cortices unrelated to tactile processing.
4.3. ReHo and fALFF’s relationship
It must be noted that ReHo and fALFF were strongly correlated with one another on a ROI level, which could explain their similar roles in predicting 2ptD thresholds. This is most likely due to their dependency on similar neurovascular components, as was found previously for ReHo and ALFF (the non-fractional form of fALFF) (Yuan et al., 2013). The authors found a similarly strong positive relationship between the two parameters, which was stronger than either of their individual relationships with the BOLD response to breath holding, a representation of a mainly vascular (non-neural) influence on the BOLD signal. Therefore, we suspect this relationship between fALFF and ReHo is also based primarily on their common neural influences.
Furthermore, we speculate that there is a causal link between the two measures, such that increased synchronicity of neural activity in fact induces higher fluctuations of the BOLD signal. The relationship between synchronicity and activity is well-documented electrophysiologically, where synchronization via local interneuronal (inhibitory) activity, increases local field potentials. Since the BOLD signal correlates with local field potentials, even at rest (Magri et al., 2011), we presume that increased synchronization of the underlying neural activity could lead to larger BOLD signal fluctuations within a voxel (i.e., increased fALFF values). Higher synchronicity within a voxel, resulting in larger fluctuations, could, in turn, be linked to a higher synchronicity across voxels (i.e., higher ReHo values). This study cannot resolve this issue, however we can confirm the strong relationship between BOLD signal synchronicity and amplitudes within the S1 hand region as well as in the primary visual and the right primary auditory cortices.
While we did find a negative relationship between fALFF in the left A1 and 2ptD of the right hand, there was no such effect for ReHo of the same ROI, nor was there one between fALFF of the right A1 and 2ptD. The additional lack of correlation between fALFF and ReHo in the left A1 ROI suggests that this relationship was due a strong similarity between the left A1 and left S1 fALFF value, rather than a relationship between the auditory cortex with tactile performance.
The role of cortical synchronization in 2ptD is further supported by findings that GABA concentration, the principal neurotransmitter responsible for cortical inhibition and synchronization, correlates with behavioral discrimination in visual and somatomotor cortices (Edden, Muthukumaraswamy, Freeman, & Singh, 2009; Puts, Edden, Evans, McGlone, & McGonigle, 2011). Thus, the relationship between 2ptD and S1 synchronization, as measured by ReHo scores, may reflect the underlying GABA concentration and activity levels, since all have been consistently linked to sensory processing.
4.4. Methodological considerations
Although a significant part of the 2ptD variance (13–33%) could be explained by the activity and synchronicity within S1 in the absence of the task, a substantial portion of the variance still remains unexplained. One likely contributor is the ROI used. A spherical 8 mm spherical ROI was used in this study, but if a task-activation mask had been used to determine each individual’s hand region in S1, we presumably could have eliminated all noise voxels unassociated with tactile discrimination of the index finger. This would likely have further strengthened the relationship between the resting state parameters and tactile discrimination. Nonetheless, the spherical ROI’s average activity at rest still proved to be able to predict about 25% of task performance. Future studies combining resting state fMRI and task-evoked BOLD response with tactile discrimination will likely explain an even greater proportion of tactile discrimination variance and could directly relate resting state parameters to that from the task-evoked BOLD response. It is likely the two would be related, as has been shown for motor tasks (Kannurpatti, Rypma, & Biswal, 2012; Yuan et al., 2013) as well as electrophysiologically (Maandag et al., 2007). A second likely contributor to variance is the inclusion of physiological noise confounds, which are inherent in resting state fMRI. We attempted to control for these confounds by de-noising the functional data before fALFF and ReHo analyses using the anatomical Comp-Corr method employed by the Conn Toolbox; aCompCorr has been shown to be at least as adequate in de-noising resting state fMRI and ASL data as de-noising the data using acquired physiological data (Behzadi et al., 2007). Nonetheless, we encourage future studies investigating resting state parameters and tactile discrimination to acquire physiological data (e.g., heart rate, respiration) to ensure that these confounds do not influence the relationship between functional and behavioral measures. Additionally, the robustness of our results are restricted by the limited number of subjects investigated. Future studies will need to incorporate a larger sample size in order to further assess the stability of the relationship between tactile performance and resting state parameters found in this study.
Apart from variance on account of using a spherical ROI and physiological confounds, other potential contributors to 2ptD variability include differences in receptor density and finger tip surface area, all of which had not been assessed in this study, but can influence 2ptD thresholds. Future studies combining peripheral physiological measures and cortical activity at rest will provide more insight to clarify the many factors influencing tactile acuity.
Also of note, while we have shown here that higher activity and synchronicity in S1 (as measured with resting state BOLD fMRI) is related to better tactile performance, it remains unclear to what extent this activity and synchronicity is due to excitatory and/or inhibitory neural processes. Both types of neural activity play a role in tactile discrimination (Hicks & Dykes, 1983), and both are highly interrelated on the neural level (Douglas & Martin, 2004) contributing to the BOLD signal (Logothetis et al., 2001). However, other methodological approaches, such as spectroscopy of excitatory and inhibitory neurotransmitters and TMS, will need to be applied to further close the gap between perceptual performance, excitability, and spontaneous activity as assessed by resting state fMRI.
5. Conclusions
Tactile discrimination has been consistently related to cortical processing. This study extends the importance of local activity and synchronization within the S1 cortex, providing evidence that these two functional measures, even at rest, are related to perceptive performance. Future studies addressing reduced tactile acuity, as in aging or pathological conditions with related sensory loss, should further investigate the relevant cortical changes in S1 activity, particularly at rest. As such, it is even conceivable that local BOLD fluctuations could serve as biomarker to predict treatment response to interventions trying to improve tactile acuity.
Supplementary Material
Acknowledgments
This work was supported by the DFG (SFB 874 Part A1 to M.T., M.L., O.H., SFB 874 Part A5 to H.R.D., SFB 874 Part A8 to T.S–W. and FOR 1581 to B.G.], the Ruhr-University Bochum (BoNe-uroMed to L.M.H., FORUM- F767-12 to T.K.), the National Institutes of Health (R21 NS077300, and R01 EB016089 to R.A.E.E.), and an Autism Speaks Translational Postdoctoral Fellowship (to N.A.P.).
Abbreviations
- 2ptD
two-point discrimination
- BA
Brodmann Area
- BOLD
Blood Oxygenation Level Dependent
- fMRI
functional magnetic resonance imaging
- GM
gray matter
- S1
primary somatosensory cortex
- SPM
statistical parametric mapping
- fALFF
fractional amplitude of low frequency fluctuations
- ReHo
regional homogeneity
Footnotes
Supplementary data
Supplementary data related to this article can be found at http://dx.doi.org/10.1016/j.cortex.2014.09.018.
References
- Adhikari BM, Sathian K, Epstein CM, Lamichhane B, Dhamala M. Oscillatory activity in neocortical networks during tactile discrimination near the limit of spatial acuity. NeuroImage. 2014;91C:300–310. doi: 10.1016/j.neuroimage.2014.01.007. [DOI] [PMC free article] [PubMed] [Google Scholar]
- An L, Cao QJ, Sui MQ, Sun L, Zou QH, Zang YF, et al. Local synchronization and amplitude of the fluctuation of spontaneous brain activity in attention-deficit/hyperactivity disorder: a resting-state fMRI study. Neuroscience Bulletin. 2013;29(5):603–613. doi: 10.1007/s12264-013-1353-8. [DOI] [PMC free article] [PubMed] [Google Scholar]
- Baldassarre A, Lewis CM, Committeri G, Snyder AZ, Romani GL, Corbetta M. Individual variability in functional connectivity predicts performance of a perceptual task. Proceedings of the National Academy of Sciences of the United States of America. 2012;109(9):3516–3521. doi: 10.1073/pnas.1113148109. [DOI] [PMC free article] [PubMed] [Google Scholar]
- Beck A. Beck depression inventory scoring manual. New York: The Psychological Corporation; 1987. [Google Scholar]
- Behzadi Y, Restom K, Liau J, Liu TT. A component based noise correction method (CompCor) for BOLD and perfusion based fMRI. NeuroImage. 2007;37(1):90–101. doi: 10.1016/j.neuroimage.2007.04.042. [DOI] [PMC free article] [PubMed] [Google Scholar]
- Boly M, Balteau E, Schnakers C, Degueldre C, Moonen G, Luxen A, et al. Baseline brain activity fluctuations predict somatosensory perception in humans. Proceedings of the National Academy of Sciences of the United States of America. 2007;104(29):12187–12192. doi: 10.1073/pnas.0611404104. [DOI] [PMC free article] [PubMed] [Google Scholar]
- Dong M, Qin W, Zhao L, Yang X, Yuan K, Zeng F, et al. Expertise modulates local regional homogeneity of spontaneous brain activity in the resting brain: an fMRI study using the model of skilled acupuncturists. Human Brain Mapping. 2013;35:1074–1084. doi: 10.1002/hbm.22235. [DOI] [PMC free article] [PubMed] [Google Scholar]
- Douglas RJ, Martin KAC. Neuronal circuits of the neocortex. Annual Review of Neuroscience. 2004;27:419–451. doi: 10.1146/annurev.neuro.27.070203.144152. [DOI] [PubMed] [Google Scholar]
- Duncan RO, Boynton GM. Tactile hyperacuity thresholds correlate with finger maps in primary somatosensory cortex (S1) Cerebral Cortex. 2007;17(12):2878–2891. doi: 10.1093/cercor/bhm015. [DOI] [PubMed] [Google Scholar]
- Edden RAE, Muthukumaraswamy SD, Freeman TCA, Singh KD. Orientation discrimination performance is predicted by GABA concentration and gamma oscillation frequency in human primary visual cortex. Journal of Neuroscience. 2009;29(50):15721–15726. doi: 10.1523/JNEUROSCI.4426-09.2009. [DOI] [PMC free article] [PubMed] [Google Scholar]
- Feng T, Feng P, Chen Z. Altered resting-state brain activity at functional MRI during automatic memory consolidation of fear conditioning. Brain Research. 2013;1523:59–67. doi: 10.1016/j.brainres.2013.05.039. [DOI] [PubMed] [Google Scholar]
- Fox MD, Snyder AZ, Vincent JL, Raichle ME. Intrinsic fluctuations within cortical systems account for intertrial variability in human behavior. Neuron. 2007;56(1):171–184. doi: 10.1016/j.neuron.2007.08.023. [DOI] [PubMed] [Google Scholar]
- Haegens S, Händel BF, Jensen O. Top-down controlled alpha band activity in somatosensory areas determines behavioral performance in a discrimination task. Journal of Neuroscience. 2011;31(14):5197–5204. doi: 10.1523/JNEUROSCI.5199-10.2011. [DOI] [PMC free article] [PubMed] [Google Scholar]
- Hao X, Wang K, Li W, Yang W, Wei D, Qiu J, et al. Individual differences in brain structure and resting brain function underlie cognitive styles: evidence from the embedded figures test. PLoS One. 2013;8(12):e78089. doi: 10.1371/journal.pone.0078089. [DOI] [PMC free article] [PubMed] [Google Scholar]
- Hesselmann G, Kell CA, Eger E, Kleinschmidt A. Spontaneous local variations in ongoing neural activity bias perceptual decisions. Proceedings of the National Academy of Sciences of the United States of America. 2008;105(31):10984–10989. doi: 10.1073/pnas.0712043105. [DOI] [PMC free article] [PubMed] [Google Scholar]
- Hicks TP, Dykes RW. Receptive field size for certain neurons in primary somatosensory cortex is determined by GABA-mediated intracortical inhibition. Brain Research. 1983;274(1):160–164. doi: 10.1016/0006-8993(83)90533-4. [DOI] [PubMed] [Google Scholar]
- Höffken O, Veit M, Knossalla F, Lissek S, Bliem B, Ragert P, et al. Sustained increase of somatosensory cortex excitability by tactile coactivation studied by paired median nerve stimulation in humans correlates with perceptual gain. Journal of Physiology. 2007;584(Pt 2):463–471. doi: 10.1113/jphysiol.2007.140079. [DOI] [PMC free article] [PubMed] [Google Scholar]
- Kalisch T, Ragert P, Schwenkreis P, Dinse HR, Tegenthoff M. Impaired tactile acuity in old age is accompanied by enlarged hand representations in somatosensory cortex. Cerebral Cortex. 2009;19(7):1530–1538. doi: 10.1093/cercor/bhn190. [DOI] [PubMed] [Google Scholar]
- Kannurpatti SS, Rypma B, Biswal BB. Prediction of task-related BOLD fMRI with amplitude signatures of resting-state fMRI. Frontiers in Systems Neuroscience. 2012;6:7. doi: 10.3389/fnsys.2012.00007. [DOI] [PMC free article] [PubMed] [Google Scholar]
- Liu Y, Wang K, Yu C, He Y, Zhou Y, Liang M, et al. Regional homogeneity, functional connectivity and imaging markers of Alzheimer’s disease: a review of resting-state fMRI studies. Neuropsychologia. 2008;46(6):1648–1656. doi: 10.1016/j.neuropsychologia.2008.01.027. [DOI] [PubMed] [Google Scholar]
- Logothetis NK, Pauls J, Augath M, Trinath T, Oeltermann A. Neurophysiological investigation of the basis of the fMRI signal. Nature. 2001;412(6843):150–157. doi: 10.1038/35084005. [DOI] [PubMed] [Google Scholar]
- Maandag NJG, Coman D, Sanganahalli BG, Herman P, Smith AJ, Blumenfeld H, et al. Energetics of neuronal signaling and fMRI activity. Proceedings of the National Academy of Sciences of the United States of America. 2007;104(51):20546–20551. doi: 10.1073/pnas.0709515104. [DOI] [PMC free article] [PubMed] [Google Scholar]
- Magri C, Schridde U, Panzeri S, Murayama Y, Logothetis NK. Different LFP frequency bands convey complementary information about the BOLD signal. BMC Neuroscience. 2011;12(Suppl. 1):P204. [Google Scholar]
- Mennes M, Zuo XN, Kelly C, Di Martino A, Zang YF, Biswal B, et al. Linking inter-individual differences in neural activation and behavior to intrinsic brain dynamics. NeuroImage. 2011;54(4):2950–2959. doi: 10.1016/j.neuroimage.2010.10.046. [DOI] [PMC free article] [PubMed] [Google Scholar]
- Pleger B, Blankenburg F, Bestmann S, Ruff CC, Wiech K, Stephan KE, et al. Repetitive transcranial magnetic stimulation-induced changes in sensorimotor coupling parallel improvements of somatosensation in humans. Journal of Neuroscience. 2006;26(7):1945–1952. doi: 10.1523/JNEUROSCI.4097-05.2006. [DOI] [PMC free article] [PubMed] [Google Scholar]
- Pleger B, Dinse HR, Ragert P, Schwenkreis P, Malin JP, Tegenthoff M. Shifts in cortical representations predict human discrimination improvement. Proceedings of the National Academy of Sciences of the United States of America. 2001;98(21):12255–12260. doi: 10.1073/pnas.191176298. [DOI] [PMC free article] [PubMed] [Google Scholar]
- Pleger B, Foerster AF, Ragert P, Dinse HR, Schwenkreis P, Malin JP, et al. Functional imaging of perceptual learning in human primary and secondary somatosensory cortex. Neuron. 2003;40(3):643–653. doi: 10.1016/s0896-6273(03)00677-9. [DOI] [PubMed] [Google Scholar]
- Puts NAJ, Edden RAE, Evans CJ, McGlone F, McGonigle DJ. Regionally specific human GABA concentration correlates with tactile discrimination thresholds. Journal of Neuroscience. 2011;31(46):16556–16560. doi: 10.1523/JNEUROSCI.4489-11.2011. [DOI] [PMC free article] [PubMed] [Google Scholar]
- Ragert P, Dinse HR, Pleger B, Wilimzig C, Frombach E, Schwenkreis P, et al. Combination of 5 Hz repetitive transcranial magnetic stimulation (rTMS) and tactile coactivation boosts tactile discrimination in humans. Neuroscience Letters. 2003;348:105–108. doi: 10.1016/s0304-3940(03)00745-6. [DOI] [PubMed] [Google Scholar]
- Sathian K, Deshpande G, Stilla R. Neural changes with tactile learning reflect decision-level reweighting of perceptual readout. Journal of Neuroscience. 2013;33(12):5387–5398. doi: 10.1523/JNEUROSCI.3482-12.2013. [DOI] [PMC free article] [PubMed] [Google Scholar]
- Smith AJ, Blumenfeld H, Behar KL, Rothman DL, Shulman RG, Hyder F. Cerebral energetics and spiking frequency: the neurophysiological basis of fMRI. Proceedings of the National Academy of Sciences of the United States of America. 2002;99(16):10765–10770. doi: 10.1073/pnas.132272199. [DOI] [PMC free article] [PubMed] [Google Scholar]
- Song XW, Dong ZY, Long XY, Li SF, Zuo XN, Zhu CZ, et al. REST: a toolkit for resting-state functional magnetic resonance imaging data processing. PLoS One. 2011;6(9):e25031. doi: 10.1371/journal.pone.0025031. [DOI] [PMC free article] [PubMed] [Google Scholar]
- Spielberger C, Gorsuch R, Lushene R, Vagg P, Jacobs G. Manual for the state-trait anxiety inventory (Form Y) Palo Alto: Consulting Psychologists Press; 1983. [Google Scholar]
- Stark CE, Squire LR. When zero is not zero: the problem of ambiguous baseline conditions in fMRI. Proceedings of the National Academy of Sciences of the United States of America. 2001;98(22):12760–12766. doi: 10.1073/pnas.221462998. [DOI] [PMC free article] [PubMed] [Google Scholar]
- Stilla R, Deshpande G, LaConte S, Hu X, Sathian K. Posteromedial parietal cortical activity and inputs predict tactile spatial acuity. Journal of Neuroscience. 2007;27(41):11091–11102. doi: 10.1523/JNEUROSCI.1808-07.2007. [DOI] [PMC free article] [PubMed] [Google Scholar]
- Tegenthoff M, Ragert P, Pleger B, Schwenkreis P, Förster AF, Nicolas V, et al. Improvement of tactile discrimination performance and enlargement of cortical somatosensory maps after 5 Hz rTMS. PLoS Biology. 2005;3(11):e362. doi: 10.1371/journal.pbio.0030362. [DOI] [PMC free article] [PubMed] [Google Scholar]
- Wang X, Han Z, He Y, Caramazza A, Song L, Bi Y. Where color rests: spontaneous brain activity of bilateral fusiform and lingual regions predicts object color knowledge performance. NeuroImage. 2013;76:252–263. doi: 10.1016/j.neuroimage.2013.03.010. [DOI] [PubMed] [Google Scholar]
- Wang Y, Illiescu BF, Ma J, Josic K, Dragoi V. Adaptive changes in neuronal synchronization in macaque V4. Journal of Neuroscience. 2011;31(37):13204–13213. doi: 10.1523/JNEUROSCI.6227-10.2011. [DOI] [PMC free article] [PubMed] [Google Scholar]
- Wei T, Liang X, He Y, Zang Y, Han Z, Caramazza A, et al. Predicting conceptual processing capacity from spontaneous neuronal activity of the left middle temporal gyrus. Journal of Neuroscience. 2012;32(2):481–489. doi: 10.1523/JNEUROSCI.1953-11.2012. [DOI] [PMC free article] [PubMed] [Google Scholar]
- Whitfield-Gabrieli S, Nieto-Castanon A. Conn: a functional connectivity toolbox for correlated and anticorrelated brain networks. Brain Connectivity. 2012;2(3):125–141. doi: 10.1089/brain.2012.0073. [DOI] [PubMed] [Google Scholar]
- Xu J, Rees G, Yin X, Song C, Han Y, Ge H, et al. Spontaneous neuronal activity predicts intersubject variations in executive control of attention. Neuroscience. 2014;263C:181–192. doi: 10.1016/j.neuroscience.2014.01.020. [DOI] [PubMed] [Google Scholar]
- Yuan R, Di X, Kim EH, Barik S, Rypma B, Biswal BB. Regional homogeneity of resting-state fMRI contributes to both neurovascular and task activation variations. Magnetic Resonance Imaging. 2013;31(9):1492–1500. doi: 10.1016/j.mri.2013.07.005. [DOI] [PMC free article] [PubMed] [Google Scholar]
- Zang Y, Jiang T, Lu Y, He Y, Tian L. Regional homogeneity approach to fMRI data analysis. NeuroImage. 2004;22(1):394–400. doi: 10.1016/j.neuroimage.2003.12.030. [DOI] [PubMed] [Google Scholar]
- Zang YF, He Y, Zhu CZ, Cao QJ, Sui MQ, Liang M, et al. Altered baseline brain activity in children with ADHD revealed by resting-state functional MRI. Brain & Development. 2007;29(2):83–91. doi: 10.1016/j.braindev.2006.07.002. [DOI] [PubMed] [Google Scholar]
- Zhang M, Mariola E, Stilla R, Stoesz M, Mao H, Hu X, et al. Tactile discrimination of grating orientation: fMRI activation patterns. Human Brain Mapping. 2005;25(4):370–377. doi: 10.1002/hbm.20107. [DOI] [PMC free article] [PubMed] [Google Scholar]
- Zou QH, Zhu CZ, Yang Y, Zuo XN, Long XY, Cao QJ, et al. An improved approach to detection of amplitude of low-frequency fluctuation (ALFF) for resting-state fMRI: fractional ALFF. Journal of Neuroscience Methods. 2008;172(1):137–141. doi: 10.1016/j.jneumeth.2008.04.012. [DOI] [PMC free article] [PubMed] [Google Scholar]
Associated Data
This section collects any data citations, data availability statements, or supplementary materials included in this article.