Abstract
Histone deacetylase inhibitors (HDACis) inhibit tumor cell growth and survival, possibly through their ability to regulate the expression of specific proliferative and/or apoptotic genes. However, the HDACi-regulated genes necessary and/or sufficient for their biological effects remain undefined. We demonstrate that the HDACis suberoylanilide hydroxamic acid (SAHA) and depsipeptide regulate a highly overlapping gene set with at least 22% of genes showing altered expression over a 16-h culture period. SAHA and depsipeptide coordinately regulated the expression of several genes within distinct apoptosis and cell cycle pathways. Multiple genes within the Myc, type β TGF, cyclin/cyclin-dependent kinase, TNF, Bcl-2, and caspase pathways were regulated in a manner that favored induction of apoptosis and decreased cellular proliferation. APAF-1, a gene central to the intrinsic apoptotic pathway, was induced by SAHA and depsipeptide and shown to be important, but not essential, for HDACi-induced cell death. Overexpression of p16INK4A and arrest of cells in G1 can suppress HDACi-mediated apoptosis. Although p16INK4A did not affect the genome-wide transcription changes mediated by SAHA, a small number of apoptotic genes, including BCLXL and B-MYB, were differentially regulated in a manner consistent with attenuated HDACi-mediated apoptosis in arrested cells. We demonstrate that different HDACi alter transcription of a large and common set of genes that control diverse molecular pathways important for cell survival and proliferation. The ability of HDACi to target multiple apoptotic and cell proliferation pathways may provide a competitive advantage over other chemotherapeutic agents because suppression/loss of a single pathway may not confer resistance to these agents.
Histone deacetylase inhibitors (HDACis) are anti-cancer agents that inhibit tumor cell growth and/or survival (1, 2). Although several HDACis are already in use in clinical trials, their mechanisms of action remain largely undefined. Regulation of gene expression by HDACis is essential for their antitumor activities because inhibition of new gene transcription or translation suppressed HDACi-induced cell cycle arrest and apoptosis (3-5). Previous expression profiling studies showed a relatively small number of genes (2-10%) were modulated by HDACis (6-9). HDACi-mediated transactivation of p21WAF1/CIP1 often underlies G1 arrest mediated by these agents (10), indicating that the molecular processes that underpin the biological effects of these drugs can be identified through a thorough understanding of HDACi-responsive genes. The detailed study presented herein aims to identify the molecular events involved in HDACi-mediated apoptosis and growth suppression.
We previously showed that suberoylanilide hydroxamic acid (SAHA) and depsipeptide induce death of the acute T cell leukemia cell line CEM through the intrinsic apoptotic pathway with subtle, yet significant, differences in their mechanisms of action (5). Overexpression of Bcl-2 suppressed apoptosis mediated by these HDACis, resulting in the accumulation of cells within G2/M. This result indicates that SAHA and depsipeptide can program cells to undergo apoptosis or arrest in G2/M, and the biological outcome depends on the molecular pathway(s) that remain intact. However, inhibition of cell cycle progression at G1/S through overexpression of p16INK4A blocked apoptosis mediated by SAHA and depsipeptide (5). This finding indicates that progression through G1 may be necessary for these HDACis to induce apoptosis; however, the molecular events underpinning these effects have not been addressed.
Herein, we used DNA microarrays to identify genes whose transcription was altered by SAHA and depsipeptide over a time course and profiled gene expression in p16INK4A-overexpressing cells that were resistant to SAHA-induced apoptosis. By analyzing dynamic changes in gene expression and using advanced statistical methods to analyze the data, we identified subtle changes in gene expression induced by SAHA and depsipeptide and demonstrated that a large proportion of the genes analyzed showed altered expression, and that molecular pathways that control cell growth and survival were targeted for deregulation by these agents.
Materials and Methods
Cell Culture and Reagents. CEM, Jurkat, and CEM cells capable of inducible expression of p16INK4A (11) were cultured as described in ref. 5. Depsipeptide (FR901228/FK228, a gift from Gloucester Pharmaceutical, Cambridge, MA) and SAHA- (Aton Pharma, Tarrytown, NY) responsive genes were identified by DNA microarray by using doses of drug that each gave ≈50% cell death at 24 h (5). After incubation for 1, 2, 4, 8, and 16 h with SAHA, depsipeptide, or DMSO as a control, harvested CEM cells (3 × 10⁷ cells per treatment time point) were used for microarray and histone H3 acetylation assays. SAHA and depsipeptide steadily induced histone H3 acetylation from 1 h with little or no difference in the magnitude or kinetics of acetylation mediated by SAHA compared with depsipeptide (data not shown). CEM-p16INK4A cells were pretreated for 24 h with 0 or 100 ng/ml doxycycline (Sigma) to induce p16INK4A expression and then treated with 2.5 μM SAHA. For each time point, a control flask was simultaneously treated with DMSO and harvested in parallel.
Target Labeling and Microarray Hybridization. Extraction of RNA, production and labeling of cDNA, and microarray hybridizations were performed as described in ref. 12. Test and reference cDNA, from the HDACi-treated and control flask cells at corresponding time points, was cohybridized to spotted cDNA arrays. Each time series consisted of six arrays corresponding to the six time points, and each time series was repeated in triplicate, including two biological replicates and a dye swap. The arrays were printed at the Peter Mac Microarray Core facility with ≈10,500 probes representing 9,954 unique accessions and 8,810 unigene clusters printed onto superamine slides. Slides were hybridized, washed, and subsequently scanned by using ScanArray 5000 (PerkinElmer) and Agilent (Agilent Technologies, Palo Alto, CA) confocal laser scanners, and data were extracted by using genepix pro 4.1 software (Axon Instruments, Union City, CA).
Small Interfering RNA (siRNA) Experiments. siRNA oligonucleotides for APAF1 (13) and GFP were synthesized (MWG Biotech, Ebersberg, Germany), prepared according to the manufacturers instructions, and resuspended in RNase-free H2O at 20 μM. siRNA (1.25 μM) was added to prechilled 0.4 cm-gap electroporation cuvettes (Bio-Rad). CEM and Jurkat cells (2.5 × 10⁶) were washed twice in serum-free media and resuspended to 1 × 10⁷ cells per ml in 250 μl of cold, serum-free RPMI medium 1640. Cells were added to the cuvettes, mixed, and incubated on ice for 5 min. Cells were then pulsed once at 260 mV, 960 μF, and 200 ohms by using a Bio-Rad electroporator. Forty-eight hours after electroporation, protein knockdown was determined by Western blotting, and cells were analyzed for SAHA-induced apoptosis as described in ref. 5.
Statistical Analysis. The expression data were normalized and analyzed by using the R software package limma (14). Differential expression was assessed by using linear models and empirical Bayes moderated F statistics (15). genespring software was used for hierarchical clustering and heat maps.
Further Details. Further details of the experimental procedures are provided in Supporting Materials and Methods, which is published as supporting information on the PNAS web site.
Results
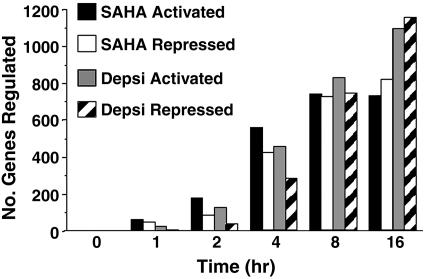
SAHA- and Depsipeptide-Induced Gene Expression Profiles. CEM cells were cultured with SAHA or depsipeptide over a 16-h time course, and gene expression data obtained from three independent microarray hybridizations for each time point was analyzed by using multivariate statistical methods that use all of the arrays simultaneously to assess differential expression and to judge statistical significance. For each gene, F statistics were used to test for any change in expression over the six time points in response to SAHA or depsipeptide. Genes were considered significant if the P values, adjusted for multiple testing by using Benjamini and Hochberg's method (16), were <0.05. The false discovery rate was thereby controlled to be <5%. As early as 1 h after treatment with SAHA or depsipeptide (Fig. 9 A and B, which is published as supporting information on the PNAS web site), a small number of differentially expressed genes were detected, and this number of genes progressively increased over the 16-h time course. More than 40% of genes on the array were significantly activated or repressed in response to SAHA or depsipeptide. Although the data demonstrate this result to be genuine differential expression, most of these genes showed fold changes that were relatively small in magnitude. We therefore restricted our attention to genes that showed at least a 1.5-fold change from time 0 h to at least one later time point. Using this criterion, a final list of 2,205 (22.1%) and 2,466 (24.8%) genes differentially expressed at one or more time points by SAHA or depsipeptide, respectively, were identified for further analysis (Fig. 1 and Fig. 10 A and B, which is published as supporting information on the PNAS web site). In cells treated with SAHA, the number of regulated genes increased from 85 at 1 h to 1,482 by 16 h, whereas the number of depsipeptide-regulated genes increased from 23 at 1 h to 2,107 by 16 h (Fig. 1). Interestingly, most of the early response genes (1-4 h) were transcriptionally activated, with the number of repressed genes steadily increasing over time. This finding is in contrast to our previous study with multiple myeloma cells that showed that the majority of transcriptionally altered genes were repressed after treatment with SAHA for 6 h (9).
Fig. 1.
Numbers of genes up- and down-regulated at each time point after treatment with SAHA or depsipeptide. Numbers of genes that were differentially expressed by at least 1.5-fold from time 0 h to at least one later time point in response to SAHA or depsipeptide are shown.
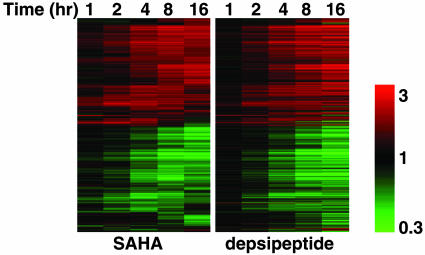
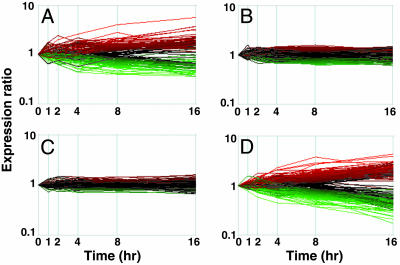
Comparison of SAHA- and Depsipeptide-Altered Gene Expression Profiles and Identification of Genes Specifically Regulated by SAHA or Depsipeptide. Almost all of the SAHA- and depsipeptide-responsive genes appeared to be similarly increased or decreased across the time course (Fig. 2); however, small subsets of genes were identified as selectively altered in expression by either SAHA (150 genes) or depsipeptide (364 genes) (Fig. 3 and Tables 1 and 2, which are published as supporting information on the PNAS web site). Only 43 of the 150 unique SAHA genes and 32 of the 364 unique depsipeptide genes were regulated ≥1.5-fold within the first 4 h. This finding suggests that these two structurally diverse HDACis initially regulate a highly overlapping set of common target genes and pathways, and as time progresses, the responses diverge. We previously showed that in contrast to SAHA, depsipeptide-induced cleavage of Bid required caspases (5) and, therefore, we examined the SAHA- and depsipeptide-selective gene lists for up-regulation of a noncaspase protease and caspase, respectively. Although SAHA did not appear to selectively regulate the expression of a noncaspase protease, caspase-1 was induced by depsipeptide. Caspase-1 can cleave Bid (17), is strongly inhibited by the polycaspase inhibitor zVAD-fmk (18), and depsipeptide-induced Bid cleavage was significantly attenuated in the presence of zVAD-fmk (5). It is possible that the transcriptional activation of caspase-1 by depsipeptide underlies Bid cleavage induced by this HDACi.
Fig. 2.
Hierarchical cluster analysis of gene expression profiles induced by SAHA and depsipeptide in CEM cells. Genes selected as differentially expressed by either SAHA or depsipeptide based on a 1.5-fold up- or down-regulation from time 0 h to at least one later time point were clustered based on standard correlation coefficients by using SAHA expression ratios (Left), and this gene order was retained for the depsipeptide cluster (Right). Each row represents a separate element on the microarray, and each column represents time in culture with SAHA or depsipeptide. The scale in this and other figures shows the level of expression, where red indicates increased gene expression, green indicates decreased expression, and the intensity of color correlated to the magnitude change. Black indicates no change.
Fig. 3.
Gene expression profiles of SAHA- and depsipeptide-selective genes. Genes identified as selectively regulated by SAHA (n = 150) (A) or depsipeptide (n = 364) (D) are shown, with their corresponding expression in response to the other HDACis shown in C and B, respectively. Up-regulated genes are depicted in red, down-regulated genes are depicted in green, and each line corresponds to a single gene. Genes were considered to be selectively regulated by SAHA if they (i), were significant for SAHA; (ii), were not significant for depsipeptide; and (iii), showed a significant difference in response to SAHA relative to depsipeptide. The third condition was also tested by using an F statistic and was used to eliminate genes that responded similarly to the two compounds but narrowly failed to reach significance for one. The reverse criterion was used to select genes specifically regulated by depsipeptide.
SAHA and Depsipeptide Regulate Many Common Cell Proliferation and Apoptosis Genes. We have previously shown that the effects of SAHA and depsipeptide on tumor cell cycle progression and survival depend on new gene transcription (5). It was therefore important to identify genes regulated by both HDACis that may affect these processes. The common genes whose expression was affected by SAHA and depsipeptide were categorized into different functional groups based on their biological function, and genes in the cell proliferation and apoptosis categories were examined in greater detail.
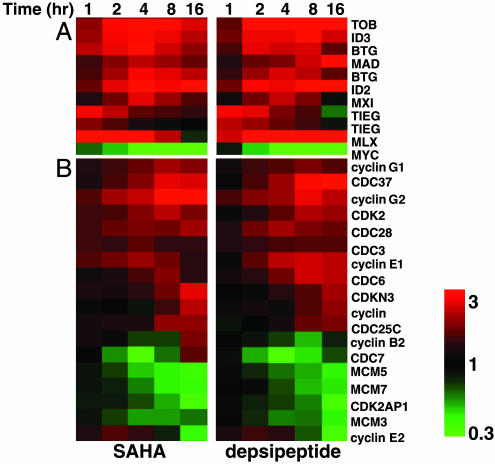
Cell Proliferation-Related Genes. SAHA- and depsipeptide-responsive genes involved in cell proliferation were clustered hierarchically, and approximately equal numbers of genes were up- and down-regulated over the 16-h time course, although in general the activated genes were regulated with earlier kinetics (Fig. 11 and Table 3, which are published as supporting information on the PNAS web site). Predominant in this functional group was the rapid up-regulation of antiproliferative/growth arrest genes (Fig. 4), consistent with the loss of cell proliferation observed. These genes included TOB1, BTG1, and BTG2, which belong to the same family of antiproliferative genes (19). Interestingly, three members of the Myc/Max/Mad family, namely MXI1, MAD, and MLX, were up-regulated by both HDACis, whereas MYC was robustly down-regulated (Fig. 4). Mad proteins inhibit the transcriptional activity of Myc by competing for Max and, overall, this response would result in a loss of Myc-driven transactivation and cell proliferation (20). Other rapidly up-regulated antiproliferative genes included the immediate early growth response gene TIEG, which is an upstream activator of the type β TGF pathway (21), and the inhibitor of differentiation/DNA binding (ID) genes ID2 and ID3 that can induce lymphocyte growth arrest and apoptosis (22) and are downstream targets of type β TGF signaling (23). In addition, SAHA and depsipeptide affected the expression of several cyclins (e.g., cyclins G1, G2, E1, E2, F, and B2), cyclin-dependent kinases (CDKs) and their inhibitors (CDK2, CDK2N2, and CDK2AP1), cell division cycle genes (e.g., CDC6, CDC7, CDC25C, CDC34, and CDC37), and down-regulated genes involved in DNA replication initiation (MCM-3, MCM-5, and MCM-7).
Fig. 4.
Functional clustering of SAHA- and depsipeptide-regulated cell proliferation genes. (A) Genes that encode early regulated antiproliferative proteins. (B) Genes that encode cell cycle-related proteins. For this and all similar data, genes were hierarchically clustered based on standard correlation coefficients.
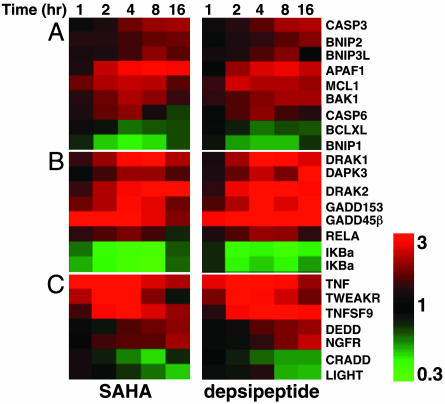
Apoptosis-Related Genes. HDACis can trigger apoptosis within 4 h (4), and apoptotic genes were commonly regulated by SAHA and depsipeptide with rapid kinetics (Fig. 12, which is published as supporting information on the PNAS web site). Consistent with our previous finding that the intrinsic apoptotic pathway was important for SAHA- and depsipeptide-mediated apoptosis (4, 5), these HDACis modulated the expression of many genes that play a key role in this pathway, such as APAF1, BAK1, MCL1, BCL-XL, CASP3, and CASP6 (24). Moreover, genes that regulate the induction and prolongation of this pathway, including NF-κB-pathway genes (IκBα and RELA) (25), and the Bcl-2-related apoptosis-regulatory BNip family members BNIP1, BNIP2, and BNIP3L (26), were also transcriptionally altered (Fig. 5A). Multiple proapoptotic genes, including the serine/threonine DAP-kinase family members DRAK1, DRAK2, (27) and DAPK3 (28), GADD45β, which induces cell cycle arrest at G2/M and apoptosis in response to genotoxic stresses (29), and GADD153, a component of the ER stress-mediated apoptosis pathway (30), were activated by SAHA and depsipeptide (Fig. 5B). Furthermore, genes encoding tumor necrosis factor (TNF) family receptors and ligands [TNF, TNFSF9, TNFRSF12A (TWEAKR/FN14), and TNFRSF14, (NGFR/TNFRSF16)], and death receptor-signaling components (CRADD and DEDD) (31) were modulated by both HDACis (Fig. 5C).
Fig. 5.
Functional clustering of SAHA- and depsipeptide-regulated apoptosis genes. (A) Genes that encode members of the intrinsic death pathway. (B) Genes that encode apoptotic proteins mentioned in the text. (C) Genes that encode members of the death receptor pathway.
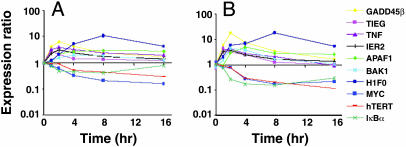
Validation of Expression Profiles of Selected Genes by Quantitative Real-Time PCR. To verify changes in gene expression detected by our microarray analysis, we performed quantitative real-time PCR analysis on 10 genes whose expression was altered by the HDACis. These 10 genes represent genes that regulate cell proliferation and apoptosis (TIEG, TNF, IER2, and IκBα) and previously identified HDACi-regulated genes (GADD45β, APAF1, BAK, H1F0, MYC, and TERT) that were also found in our analysis. As shown in Fig. 6, there was a high correlation between the microarray and real-time data for all 10 genes, with average Pearson correlation coefficients of 0.9 for SAHA and 0.95 for depsipeptide (data not shown). One of these highly correlated genes was BAK, which had a maximal fold induction of <2-fold in the microarray screen, illustrating that the 1.5-fold cutoff we used is a reliable limit for the identification of differentially expressed genes. Western blotting confirmed that gene expression changes induced by SAHA and depsipeptide correlated with changes in protein expression (data not shown). Furthermore, inhibition of de novo protein synthesis by using cycloheximide did not affect the regulation of these genes by SAHA, suggesting that they were all primary response genes (data not shown).
Fig. 6.
Validation of microarray data by SYBR Green quantitative real-time PCR. (A) SAHA-mediated gene expression changes obtained from microarray assays. (B) The same RNA as used for SAHA microarray experiments was subjected to quantitative real-time PCR. Values for each gene were normalized to expression levels of L32, and fold induction at each time point was calculated relative to time 0 h. Data are representative of at least three independent experiments.
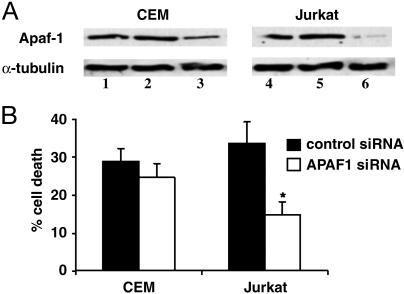
siRNA-Mediated Knockdown of Apaf-1 Attenuates SAHA-Induced Apoptosis. To assess the functional importance of an HDACi-regulated gene, we used RNA interference to determine whether reduction in APAF1 affected HDACi-induced apoptosis. APAF1 is required for robust apoptosis through the intrinsic death pathway (32), and loss of APAF1 expression can induce a drug-resistant phenotype (33). In addition, APAF1 expression was not affected by vincristine and cisplatin (data not shown), suggesting that this gene is specifically regulated by HDACis. We extended the analysis to include another acute T cell leukemia line Jurkat because these cells also undergo apoptosis in response to SAHA and depsipeptide in a similar manner to CEM cells (data not shown). In addition, SAHA and depsipeptide similarly regulated the expression of all 10 validated genes (including APAF1) in Jurkat cells (data not shown). As shown in Fig. 7A, the siRNA to APAF1 specifically reduced Apaf-1 expression. CEM and Jurkat cells pretreated with APAF1 siRNA showed a reduction in SAHA-mediated apoptosis compared with SAHA-treated cells transfected with control siRNA (Fig. 7B). The greater inhibition of SAHA-mediated apoptosis in the Jurkat cell line directly correlated with the greater efficiency of APAF1 knockdown in the Jurkat cells. Similar inhibition in depsipeptide-induced apoptosis was observed in CEM and Jurkat cells treated with APAF1 siRNA but not control siRNA (data not shown). These findings demonstrate transcriptional activation of APAF1 by HDACis can play an important role in HDACi-induced apoptosis.
Fig. 7.
Knockdown of APAF1 expression attenuates SAHA-induced apoptosis. (A) CEM and Jurkat cells transfected with no siRNA (lanes 1 and 4), 1.25 μM control (GFP) (lanes 2 and 5), or APAF1 siRNA (lanes 3 and 6) were analyzed 48 h after transfection for APAF1 expression by Western blot. The blot was reprobed for α-tubulin as a loading control. (B) At 48 h after electroporation, CEM and Jurkat cells were treated with SAHA (2.5 μM) for 18 h, then collected and scored for apoptosis by propidium iodide staining. Data are expressed as the mean ± SD of three separate experiments. Statistical differences between samples (P < 0.05) were determined by using the Mann-Whitney U test and are denoted by an asterisk.
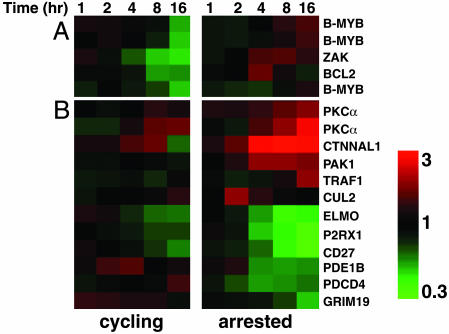
SAHA Regulates Small but Distinct Subsets of Genes in Cycling and Arrested Cells. Overexpression of the tumor suppressor protein p16INK4A mediates cell cycle arrest at the G1/S boundary and confers protection against HDACi-induced apoptosis (5). Microarray experiments were performed to determine whether cell cycle arrest significantly altered the SAHA-mediated gene expression profile. p16INK4A-induced cell cycle arrest at G1/S but had no effect on the induction or level of SAHA-induced H3 hyperacetylation (data not shown). The SAHA-treated cycling and p16INK4A-arrested cells revealed remarkably similar gene expression profiles (Fig. 13, which is published as supporting information on the PNAS web site), with only 107 genes and 303 genes specifically regulated by SAHA in cycling cells and arrested cells, respectively (Fig. 14, which is published as supporting information on the PNAS web site). Only three apoptotic genes were regulated by SAHA in the cycling cells and not in the arrested cells. ZAK, BCL2, and B-MYB were all down-regulated in response to SAHA in the cycling cells but were largely unaffected in the arrested cells (Fig. 8A). The apoptotic role of ZAK has yet to be fully defined; however, Bcl-2 and B-Myb inhibit apoptosis, and both have been shown to regulate SAHA-mediated apoptosis (4, 34). In the SAHA-treated p16INK4A-expressing cells, antiapoptotic genes such as PKCα (35), PAK1 (36), and TRAF1 (37) were induced, whereas proapoptotic genes, including GRIM19 (38), PDCD4 (39), P2RX1 (40), and CD27 (37), were repressed (Fig. 8B). Overall, this result would produce a prosurvival environment that is consistent with the suppression of SAHA-mediated apoptosis seen in cells overexpressing p16INK4A.
Fig. 8.
Functional clustering of specific SAHA-regulated apoptosis genes in cycling and arrested cells. Expression profiles of apoptosis-related genes identified as specifically regulated by SAHA in cycling (A) or arrested cells (B).
Discussion
HDACi induce tumor cell cycle arrest or apoptosis. A number of HDACis have entered early phase clinical trials, including SAHA and depsipeptide, that are both in phase I and II trials (see www.clinicaltrials.gov). We previously showed that SAHA and depsipeptide largely activated common apoptotic pathways, although there were differences in the activities of the two compounds (5). Although both drugs required new gene transcription to mediate tumor cell death (5), the mechanistic link between altered gene expression and apoptosis, and whether these two structurally diverse compounds mediate similar or disparate gene expression changes, had not been addressed. Herein, we used microarray expression profiling to identify the genes commonly and selectively regulated by SAHA and depsipeptide over a 16-h time course. Previous studies demonstrated that up to 10% of genes in transformed cells are altered in response to HDACis (6-9). Our data and rigorous statistical analysis demonstrate that the number of genes altered by HDACis has been underestimated, with >40% of genes within the genome affected by SAHA or depsipeptide over the 16-h time course.
Based on hierarchical clustering, the transcriptional responses induced by SAHA and depsipeptide were remarkably similar. Some degree of overlap was expected because both drugs target histone deacetylase (HDACs). However, the extent of similarity between the two profiles was surprising because depsipeptide has been reported to preferentially inhibit the activities of class I HDACs over class II HDACs (41), whereas SAHA inhibits class I and II HDACs (42). SAHA and depsipeptide activate the intrinsic apoptotic pathway within 10 h (5). Consistent with this phenotype, proapoptotic genes were rapidly up-regulated and antiapoptotic genes were down-regulated by both HDACis, and a number of genes within the same molecular pathway were coordinately regulated. For example, genes involved in the intrinsic apoptotic pathway (i.e., BAX, BCL-XL, APAF1, CASPASE-3, and CASPASE-6) were regulated by SAHA and depsipeptide. In addition, these HDACis altered the expression of a number of genes belonging to the same family that can activate or positively modulate the intrinsic pathway (i.e., DAPK, BNIP, and GADD family members). Although a small number of proapoptotic genes were repressed (i.e., BNIP1) and antiapoptotic genes were activated (i.e., MCL1), the overall response was one that would provide a strong proapoptotic signal. Moreover, although activation of the NF-κB pathway (through induction of RELA and repression of IκBα) is often associated with an antiapoptotic response, recent evidence suggests that this pathway can enhance or suppress apoptosis depending on the cell type and apoptotic stimulus (25). Further, the transcription of TNF superfamily genes and genes involved in death-receptor signaling (DEDD and CRADD) was altered by SAHA and depsipeptide. These findings support previous studies showing that SAHA affects the expression of multiple genes within pathways that specifically regulate tumor cell growth and survival (9).
Apaf-1 is a key downstream effector protein of the intrinsic apoptotic pathway that has been proposed to play an important role in regulating chemotherapeutic responses (43). APAF1 was rapidly transactivated by a range of HDACis in diverse tumor cell types (unpublished data) and is up-regulated by SAHA in multiple myeloma cells (9), demonstrating that it is a common HDACi-regulated gene. Down-regulation of APAF1 by siRNA attenuated, but did not completely inhibit, apoptosis mediated by SAHA and depsipeptide. Moreover, we have recently shown that Apaf-1 knockout fibroblasts did not activate caspase-3 after HDACi treatment; however, the cells still died over an extended time course (44). Loss of APAF1 activity through mutation or loss of expression has been reported in human tumors and cell lines (33, 43), and the identification of chemotherapeutic drugs such as SAHA and depsipeptide that can use this important apoptotic gene when it is present, yet can overcome its functional inactivation, may be an important clinical advance.
In addition to inducing apoptosis, HDACis can suppress tumor cell cycle progression (5). We have shown that overexpression of Bcl-2 inhibits SAHA- and depsipeptide-induced apoptosis but does not affect the inhibition of cell proliferation (4, 5), and a large number of cell proliferation genes were regulated by SAHA and depsipeptide. The transcriptional response was consistent with growth suppression and, strikingly, a number of genes within key growth-regulatory pathways were coordinately regulated. For example, decreased expression of MYC and activation of MAD, MXI1, and MLX is consistent with suppression of the Myc pathway. Similarly, induction TIEG, ID2, ID3, and GADD45β are hallmarks of an activated type β TGF pathway, and three members of the BTG/Tob growth suppressor gene family were also induced. Finally, a number of cyclins, CDKs and CDK inhibitors, whose expression is tightly coordinated to regulate appropriate cell cycle progression, were aberrantly expressed in HDACi-treated cells. It is presently unclear whether one or more of these pathways are necessary and/or sufficient for HDACi-mediated growth suppression. The finding that HDACis alter expression of a number of genes within the same pathway suggests that as with the apoptotic process, HDACi affect multiple molecular pathways that can inhibit the proliferation of transformed cells.
The overexpression or induction of CDK inhibitors such as p16INK4A and p21WAF1/Cip1 induces G1 arrest and protects cells against the cytotoxic activities of HDACis (5, 45). The mechanisms underlying protection by CDK inhibitors remained largely unknown, although it has been proposed that p21WAF1/CIP can suppress HDACi-induced apoptosis by binding to caspase-3 and inhibiting its ability to target important proapoptotic substrates (45). To our knowledge, there have been no antiapoptotic functions assigned to p16INK4A to date. In fact, in addition to cell cycle arrest, ectopic expression of p16INK4A can induce apoptosis in certain cell types (46). We showed that overexpression of p16INK4A did not significantly affect the transcriptional response of cells to SAHA. This finding demonstrates that HDACis can regulate gene expression in noncycling cells and shows that changes in transcriptional responses do not occur as a consequence of cells accumulating in a particular phase of the cell cycle in response to HDACis. Analysis of the small number of apoptotic genes whose transcription was differentially altered by SAHA in cycling versus noncycling cells showed that overexpression of p16INK4A resulted in a increase in SAHA-induced antiapoptotic genes and a decrease in SAHA-induced proapoptotic genes. Of particular note was the differential effects on BCL-XL and B-MYB that were down-regulated in SAHA-treated cycling cells but unaffected or even slightly up-regulated in SAHA-treated noncycling cells. SAHA-induced apoptosis has been associated with down-regulation of B-Myb and, like Bcl-2, Bcl-XL inhibited the cytotoxic effects of SAHA (34). As such, the loss of SAHA-mediated repression of B-MYB and BCL-XL correlates with suppression of SAHA-induced apoptosis in p16INK4A-expressing cells.
This study provides comparative gene profiling analysis of the effects of SAHA and depsipeptide, the two HDACis being tested most widely in clinical trials. Both agents commonly target a number of important molecular pathways that regulate cell growth and survival. The pleiotropic effects of HDACis might provide an advantage as an anticancer agent because most transformed cells have multiple gene defects affecting several pathways that regulate cell proliferation and survival. Thus, a single proapoptotic or antiproliferative pathway may not be critical for the therapeutic effects of HDACis. Indeed, our studies with caspase inhibitors (4, 5, 44, 47) and cells lacking Apaf-1 (44) demonstrate that although HDACis can use an intact intrinsic apoptotic pathway, inactivation of this pathway does not prevent HDACi-induced cell death. The present findings have important implications for the clinical use of SAHA and depsipeptide as anticancer agents either alone or in combination with other drugs.
Supplementary Material
Acknowledgments
We thank Dr. Sarah Russell for helpful advice, Prof. Reinhard Kofler (Tyrolean Cancer Research Institute, Innsbruck, Austria) for providing CEM-p16INK4A cells, and Gloucester Pharmaceutical Co. for providing depsipeptide. This work is supported by grants from the Wellcome Trust, the National Health and Medical Research Council of Australia, and the Anti-Cancer Council of Victoria. R.W.J. is a Wellcome Trust Senior Research Fellow.
Author contributions: M.J.P., G.K.S., R.K.v.L., D.D.B., and A.J.H. performed research; V.M.R. and P.A.M. analyzed data; P.A.M. and R.W.J. designed research; and R.W.J. wrote the paper.
Abbreviations: CDK, cyclin-dependent kinase; HDACi, histone deacetylase inhibitor; SAHA, suberoylanilide hydroxamic acid; siRNA, small interfering RNA.
References
- 1.Johnstone, R. W. (2002) Nat. Rev. Drug Discov. 1, 287-299. [DOI] [PubMed] [Google Scholar]
- 2.Marks, P. A., Richon, V. M., Miller, T. & Kelly, W. K. (2004) Adv. Cancer Res. 91, 137-168. [DOI] [PubMed] [Google Scholar]
- 3.Glick, R. D., Swendeman, S. L., Coffey, D. C., Rifkind, R. A., Marks, P. A., Richon, V. M. & La Quaglia, M. P. (1999) Cancer Res. 59, 4392-4399. [PubMed] [Google Scholar]
- 4.Ruefli, A. A., Ausserlechner, M. J., Bernhard, D., Sutton, V. R., Tainton, K. M., Kofler, R., Smyth, M. J. & Johnstone, R. W. (2001) Proc. Natl. Acad. Sci. USA 98, 10833-10838. [DOI] [PMC free article] [PubMed] [Google Scholar]
- 5.Peart, M. J., Tainton, K. M., Ruefli, A. A., Dear, A. E., Sedelies, K. A., O'Reilly, L. A., Waterhouse, N. J., Trapani, J. A. & Johnstone, R. W. (2003) Cancer Res. 63, 4460-4471. [PubMed] [Google Scholar]
- 6.Van Lint, C., Emiliani, S. & Verdin, E. (1996) Gene Expression 5, 245-253. [PMC free article] [PubMed] [Google Scholar]
- 7.Glaser, K. B., Staver, M. J., Waring, J. F., Stender, J., Ulrich, R. G. & Davidsen, S. K. (2003) Mol. Cancer Ther. 2, 151-163. [PubMed] [Google Scholar]
- 8.Mariadason, J. M., Corner, G. A. & Augenlicht, L. H. (2000) Cancer Res. 60, 4561-4572. [PubMed] [Google Scholar]
- 9.Mitsiades, C. S., Mitsiades, N. S., McMullan, C. J., Poulaki, V., Shringarpure, R., Hideshima, T., Akiyama, M., Chauhan, D., Munshi, N., Gu, X., et al. (2004) Proc. Natl. Acad. Sci. USA 101, 540-545. [DOI] [PMC free article] [PubMed] [Google Scholar]
- 10.Richon, V. M., Sandhoff, T. W., Rifkind, R. A. & Marks, P. A. (2000) Proc. Natl. Acad. Sci. USA 97, 10014-10019. [DOI] [PMC free article] [PubMed] [Google Scholar]
- 11.Ausserlechner, M. J., Obexer, P., Wiegers, G. J., Hartmann, B. L., Geley, S. & Kofler, R. (2001) J. Biol. Chem. 276, 10984-10989. [PubMed] [Google Scholar]
- 12.Bowtell, D. D. & Sambrook, J. F. (2002) DNA Microarrays: A Molecular Cloning Manual (Cold Spring Harbor Lab. Press, Plainview, NY).
- 13.Lassus, P., Opitz-Araya, X. & Lazebnik, Y. (2002) Science 297, 1352-1354. [DOI] [PubMed] [Google Scholar]
- 14.Gentleman, R., Bates, D., Bolstad, B., Carey, V., Dettling, M., Dudoit, S., Ellis, B., Gautier, L., Gentry, J., Hornik, K., et al. (2004) Genome Biol. 5, R80. [DOI] [PMC free article] [PubMed] [Google Scholar]
- 15.Smyth, G. K. (2004) Stat. Appl. Genet. Mol. Biol. 3, Article 3. [DOI] [PubMed]
- 16.Benjamini, Y. & Hochberg, Y. (1995) J. R. Stat. Soc. B 57, 289-300. [Google Scholar]
- 17.Guegan, C., Vila, M., Teismann, P., Chen, C., Onteniente, B., Li, M., Friedlander, R. M., Przedborski, S. & Teissman, P. (2002) Mol. Cell. Neurosci. 20, 553-562. [DOI] [PubMed] [Google Scholar]
- 18.Ekert, P. G., Silke, J. & Vaux, D. L. (1999) Cell Death Differ. 6, 1081-1086. [DOI] [PubMed] [Google Scholar]
- 19.Tirone, F. (2001) J. Cell. Physiol. 187, 155-165. [DOI] [PubMed] [Google Scholar]
- 20.Grandori, C., Cowley, S. M., James, L. P. & Eisenman, R. N. (2000) Annu. Rev. Cell Dev. Biol. 16, 653-699. [DOI] [PubMed] [Google Scholar]
- 21.Cook, T. & Urrutia, R. (2000) Am. J. Physiol. 278, G513-G521. [DOI] [PubMed] [Google Scholar]
- 22.Kee, B. L., Rivera, R. R. & Murre, C. (2001) Nat. Immunol. 2, 242-247. [DOI] [PubMed] [Google Scholar]
- 23.Miyazawa, K., Shinozaki, M., Hara, T., Furuya, T. & Miyazono, K. (2002) Genes Cells 7, 1191-1204. [DOI] [PubMed] [Google Scholar]
- 24.Cory, S. & Adams, J. M. (2002) Nat. Rev. Cancer 2, 647-656. [DOI] [PubMed] [Google Scholar]
- 25.Kucharczak, J., Simmons, M. J., Fan, Y. & Gelinas, C. (2003) Oncogene 22, 8961-8982. [DOI] [PubMed] [Google Scholar]
- 26.Zhang, H. M., Cheung, P., Yanagawa, B., McManus, B. M. & Yang, D. C. (2003) Apoptosis 8, 229-236. [DOI] [PubMed] [Google Scholar]
- 27.Sanjo, H., Kawai, T. & Akira, S. (1998) J. Biol. Chem. 273, 29066-29071. [DOI] [PubMed] [Google Scholar]
- 28.Kawai, T., Akira, S. & Reed, J. C. (2003) Mol. Cell. Biol. 23, 6174-6186. [DOI] [PMC free article] [PubMed] [Google Scholar]
- 29.Selvakumaran, M., Lin, H. K., Sjin, R. T., Reed, J. C., Liebermann, D. A. & Hoffman, B. (1994) Mol. Cell. Biol. 14, 2352-2360. [DOI] [PMC free article] [PubMed] [Google Scholar]
- 30.Oyadomari, S. & Mori, M. (2004) Cell Death Differ. 11, 381-389. [DOI] [PubMed] [Google Scholar]
- 31.Aggarwal, B. B. (2003) Nat. Rev. Immunol. 3, 745-756. [DOI] [PubMed] [Google Scholar]
- 32.Yoshida, H., Kong, Y. Y., Yoshida, R., Elia, A. J., Hakem, A., Hakem, R., Penninger, J. M. & Mak, T. W. (1998) Cell 94, 739-750. [DOI] [PubMed] [Google Scholar]
- 33.Soengas, M. S., Capodieci, P., Polsky, D., Mora, J., Esteller, M., Opitz-Araya, X., McCombie, R., Herman, J. G., Gerald, W. L., Lazebnik, Y. A., et al. (2001) Nature 409, 207-211. [DOI] [PubMed] [Google Scholar]
- 34.Vrana, J. A., Decker, R. H., Johnson, C. R., Wang, Z., Jarvis, W. D., Richon, V. M., Ehinger, M., Fisher, P. B. & Grant, S. (1999) Oncogene 18, 7016-7025. [DOI] [PubMed] [Google Scholar]
- 35.Matassa, A. A., Kalkofen, R. L., Carpenter, L., Biden, T. J. & Reyland, M. E. (2003) Cell Death Differ. 10, 269-277. [DOI] [PubMed] [Google Scholar]
- 36.Vadlamudi, R. K., Bagheri-Yarmand, R., Yang, Z., Balasenthil, S., Nguyen, D., Sahin, A. A., den Hollander, P. & Kumar, R. (2004) Cancer Cell 5, 575-585. [DOI] [PubMed] [Google Scholar]
- 37.Baker, S. J. & Reddy, E. P. (1998) Oncogene 17, 3261-3270. [DOI] [PubMed] [Google Scholar]
- 38.Angell, J. E., Lindner, D. J., Shapiro, P. S., Hofmann, E. R. & Kalvakolanu, D. V. (2000) J. Biol. Chem. 275, 33416-33426. [DOI] [PubMed] [Google Scholar]
- 39.Afonja, O., Juste, D., Das, S., Matsuhashi, S. & Samuels, H. H. (2004) Oncogene 23, 8135-8145. [DOI] [PubMed] [Google Scholar]
- 40.Harada, H., Chan, C. M., Loesch, A., Unwin, R. & Burnstock, G. (2000) Kidney Int. 57, 949-958. [DOI] [PubMed] [Google Scholar]
- 41.Furumai, R., Matsuyama, A., Kobashi, N., Lee, K. H., Nishiyama, M., Nakajima, H., Tanaka, A., Komatsu, Y., Nishino, N., Yoshida, M. & Horinouchi, S. (2002) Cancer Res. 62, 4916-4921. [PubMed] [Google Scholar]
- 42.Kapustin, G. V., Fejer, G., Gronlund, J. L., McCafferty, D. G., Seto, E. & Etzkorn, F. A. (2003) Org. Lett. 5, 3053-3056. [DOI] [PubMed] [Google Scholar]
- 43.Johnstone, R. W., Ruefli, A. A. & Lowe, S. W. (2002) Cell 108, 153-164. [DOI] [PubMed] [Google Scholar]
- 44.Shao, Y., Gao, Z., Marks, P. A. & Jiang, X. (2004) Proc. Natl. Acad. Sci. USA 101, 18030-18035. [DOI] [PMC free article] [PubMed] [Google Scholar]
- 45.Burgess, A. J., Pavey, S., Warrener, R., Hunter, L. J., Piva, T. J., Musgrove, E. A., Saunders, N., Parsons, P. G. & Gabrielli, B. G. (2001) Mol. Pharmacol. 60, 828-837. [PubMed] [Google Scholar]
- 46.Calbo, J., Marotta, M., Cascallo, M., Roig, J. M., Gelpi, J. L., Fueyo, J. & Mazo, A. (2001) Cancer Gene Ther. 8, 740-750. [DOI] [PubMed] [Google Scholar]
- 47.Ungerstedt, J. S., Sowa, Y., Xu, W. S., Shao, Y., Dokmanovic, M., Perez, G., Ngo, L., Holmgren, A., Jiang, X. & Marks, P. A. (2005) Proc. Natl. Acad. Sci. USA 102, 673-678. [DOI] [PMC free article] [PubMed] [Google Scholar]
Associated Data
This section collects any data citations, data availability statements, or supplementary materials included in this article.


