

Abstract
Ductal carcinoma in situ (DCIS) is a non‐invasive form of breast cancer where cells restricted to the ducts exhibit an atypical phenotype. Some DCIS lesions are believed to rapidly transit to invasive ductal carcinomas (IDCs), while others remain unchanged. Existing classification systems for DCIS fail to identify those lesions that transit to IDC. We studied gene expression patterns of 31 pure DCIS, 36 pure invasive cancers and 42 cases of mixed diagnosis (invasive cancer with an in situ component) using Agilent Whole Human Genome Oligo Microarrays 44k. Six normal breast tissue samples were also included as controls. qRT‐PCR was used for validation. All DCIS and invasive samples could be classified into the “intrinsic” molecular subtypes defined for invasive breast cancer. Hierarchical clustering establishes that samples group by intrinsic subtype, and not by diagnosis. We observed heterogeneity in the transcriptomes among DCIS of high histological grade and identified a distinct subgroup containing seven of the 31 DCIS samples with gene expression characteristics more similar to advanced tumours. A set of genes independent of grade, ER‐status and HER2‐status was identified by logistic regression that univariately classified a sample as belonging to this distinct DCIS subgroup. qRT‐PCR of single markers clearly separated this DCIS subgroup from the other DCIS, and contains samples from several histopathological and intrinsic molecular subtypes. The genes that differentiate between these two types of DCIS suggest several processes related to the re‐organisation of the microenvironment. This raises interesting possibilities for identification of DCIS lesions both with and without invasive characteristics, which potentially could be used in clinical assessment of a woman's risk of progression, and lead to improved management that would avoid the current over‐ and under‐treatment of patients.
Keywords: DCIS, Molecular subtypes of breast cancer, Progression, Gene expression
1. Introduction
Ductal carcinoma in situ (DCIS), non‐invasive lesions of the breast, account for approximately 20% of mammographically detected breast cancers (Leonard and Swain, 2004). It has been estimated that about 50% of untreated DCIS lesions progress to invasive ductal carcinomas (IDC), with a high degree of variability in the latency of this progression (Collins et al., 2005). Approximately one half of all local recurrences that appear after surgical treatment of DCIS are invasive cancers (Cuzick, 2003).
Traditionally, pathologists have classified DCIS using architectural features of the lesions (Bethwaite et al., 1998). However, this classification is of limited clinical value, particularly as individual DCIS lesions often demonstrate architectural heterogeneity (Patani et al., 2008). All existing DCIS classification schemes, including those focused on nuclear grade (Lagios et al., 1982), are unable to reliably differentiate between DCIS that will remain stable and those likely to progress to full invasive tumours. At the molecular level, there are currently no biomarkers capable of distinguishing between aggressive and benign DCIS, nor biomarkers to assess patient likelihood for local recurrence following surgery.
Several studies have emphasised the importance of studying the tumour microenvironment to increase our understanding of progression to invasive disease (Casey et al., 2009; Celis et al., 2007; Hu and Polyak, 2008; Tlsty and Hein, 2001). Tumorigenesis and progression require a “team effort” across different cell types that together determine the observed tumour heterogeneity and the invasive potential of the tumour (Celis et al., 2007; Hu and Polyak, 2008; Hu et al., 2008; Navin and Hicks, 2010; Polyak and Hu, 2005). Several microenvironmental processes have been highlighted to play a central role including disruption of the myoepithelial cell layer (Hu et al., 2008; Polyak and Hu, 2005), epithelial–mesenchymal transition (EMT) (Jechlinger et al., 2003; Lien et al., 2007; Turley et al., 2008), and angiogenesis (Blick et al., 2008; Rice and Quinn, 2002; Teo et al., 2003; Yu et al., 2007). Stromal signatures related to macrophage and fibroblastic responses have been identified as present in the stroma for a subset of DCIS cases; in particular, the macrophage response is primarily associated with high‐grade, oestrogen and progesterone negative DCIS (Sharma et al., 2009).
Whole‐genome expression analyses using microarrays have shown great power in characterising tumours (Chang et al., 2004; Perou et al., 2000; van 't Veer et al., 2002; Wang et al., 2005; West et al., 2005), and have led to the identification of five molecular subtypes of invasive breast cancer associated with differing clinical outcomes (Naume et al., 2007, 2001, 2003). Comprehensive gene expression studies comparing DCIS and IDCs have identified stage‐specific markers, but gene signatures that predict the likelihood of DCIS lesions to progress to an invasive disease state, remain to be identified (Hannemann et al., 2006; Ma et al., 2003; Porter et al., 2003; Schuetz et al., 2006).
In this study, gene expression profiling was performed on 31 pure DCIS, 36 pure invasive carcinomas (<15 mm) and 42 mixed lesions (invasive carcinoma with an in situ component). Differences in gene expression pattern within DCIS, and between DCIS and invasive carcinomas were examined, and a putative progressive group of DCIS was identified that exhibited phenotypes more similar to invasive breast cancer. This subgroup of DCIS was identified with a gene profile independent of the traditional markers ER, HER2 and grade.
2. Material and methods
2.1. Patients and tumour material
Patients with fresh frozen tumour samples, collected at the Fresh Tissue Biobank, Department of Pathology, Uppsala University Hospital, Sweden, were selected from a population‐based cohort of 854 women diagnosed between 1986 and 2004 with one of three types of primary breast cancer lesions: a) pure DCIS, b) pure invasive breast cancer, 15 mm or less, or c) mixed lesions (invasive carcinoma with an in situ component). All histopathological specimens, both paraffin‐embedded (used in IHC analyses) and frozen (used in microarray and RT‐PCR analyses), were re‐evaluated by a breast pathologist. Thinner sections (4 μm) from the frozen specimens were cut before, between sections 5 and 6, and after the last 20 μm RNA section for H&E staining. These sections were used to estimate the proportion of tumour cells (in situ‐/invasive‐cells) in each lesion. 77% of the pure DCIS samples have a DCIS component of >70%. 76% of the invasive samples have a tumour content of >70%. 79% of the mixed samples have a tumour/DCIS component of >70%. Invasive breast cancer was classified based on the Elston‐Ellis classification system (grade I–III) (Elston and Ellis, 1993). DCIS lesions were classified according to the European Organisation for Research and Treatment of Cancer (EORTC) system (Holland et al., 1994). We denoted the EORTC grades I–III using the nomenclature A–C to emphasise that in situ and invasive lesions were classified based on different systems. In lesions with both an invasive and an in situ element, the classification was determined for both elements separately. Control samples of normal breast epithelium were taken from six women undergoing surgery for benign conditions including hyperplasia and fibroadenoma.
109 patient tissues were successfully analysed by microarrays, of which 31 consisted of pure DCIS, 36 pure invasive cancers and 42 cases of mixed diagnosis. The study was designed to investigate gene expression changes between the groups aiming at identifying differences related to tumour progression from in situ to invasive cancer. Patient characteristics are described in Table 1. Of the 109 tumours, 29 were removed by mastectomy (12 DCIS, 2 invasive and 15 mixed), and 80 by breast conserving surgery (19 DCIS, 34 invasive and 27 mixed).
Table 1.
Patient characteristics.
| DCIS (n = 31) | Invasive ≤15 mm (n = 36) | Mixed lesion (n = 42) | |
|---|---|---|---|
| Age, years (median) | 57.5 | 58.8 | 57.5 |
| Size, mm (median) | 20 (3 multifocal) | 11.5 | 15 (4 multifocal) |
| Grade, I–III and/or A–C* | 1/15/15 | 17/15/4 | Inv.: 12 (I)/21 (II)/9 (III) |
| DCIS: 5 (A)/13 (B)/17 (C) | |||
| Immunohistochemistry: | Number (%) | Number (%) | Number (%) |
| ER+ | 22 (71%) | 31 (86%) | 34 (81%) |
| PR+ | 20 (65%) | 28 (78%) | 26 (62%) |
| Ki‐67+ | 6 (19%) | 9 (25%) | 18 (43%) |
| HER2+ (2+ or 3+) | 20 (65%) | 17 (47%) | 33 (78.5%) |
| P53+ | 15 (48%) | 18 (50%) | 14 (33%) |
| Breast cancer subtypes: | |||
| Luminal A | 7 (23%) | 8 (22%) | 9 (21%) |
| Luminal B | 7 (23%) | 11 (30%) | 12 (28.5%) |
| ERBB2+ | 2 (6%) | 5 (14%) | 9 (21%) |
| Basal‐like | 6 (19%) | 6 (17%) | 8 (19%) |
| Normal‐like | 9 (29%) | 6 (17%) | 4 (9.5%) |
* ELSTON grading of invasive tumours designated as I–III. EORTC grading of DCIS tumours designated as A–C. Inv: Invasive.
This study has been approved by the Ethics Committee at Uppsala University Hospital (Dnr 2005:118).
2.2. Immunohistochemistry
Immunohistochemical staining (IHC) of paraffin‐embedded tumour sections was performed for oestrogen receptor (ER), progesterone receptor (PR), HER2 receptor and the proliferation marker Ki‐67. A cut‐off limit for positive staining was chosen for ER >10% (ER NCL‐6F11, Novocastra, Newcastle, UK), PR >10% (PR NCL‐1A6, Novocastra) and Ki‐67 >10% (Ki‐67 MIB‐1, DAKO A/S, Glostrup, Denmark) stained tumour cells, irrespective of the intensity of the staining. The staining for HER2 (c‐erbB‐2 poly rabbit, DAKO) was scored according to the HercepTest™ (DAKO), in which 2+/3+ was considered positive. All stainings were performed in an automatic staining machine (Ventana Medical Systems, Tucson, AZ).
2.3. aCGH analysis
Array‐based CGH (aCGH) was carried out using 1 μg genomic DNA from each sample on Agilent Human Genome CGH 244K Microarrays (G4411B) according to the manufacturer's protocol (Agilent Technologies, Palo Alto, CA). Raw data were extracted and normalised using the Feature Extraction software version 9.1.3.1 (Agilent Technologies) and further processed in Nexus Copy Number v. 3.1 (BioDiscovery, El Segundo, CA). Aberrations were detected using the rank segmentation algorithm with default settings; single copy gains were defined as >0.2 and high copy gains (2 or more copies) as >0.5 with significance threshold 0.00005. The HER2 gene is spanned by five unique probes.
2.4. RNA extraction, linear amplification and microarray hybridisation
Total RNA was extracted from each sample using the RNeasy Mini Kit (Qiagen, Hilden, Germany) and the quality determined using BioAnalyzer 2100 (Agilent Technologies). Total RNA (400 ng) was amplified and labelled using Agilent Low RNA Input Fluorescent Linear Amplification Kit. Tumour samples were labelled with Cy5, the Universal Human Reference (Stratagene, La Jolla, CA) with Cy3, and 750 ng of labelled cRNA was hybridised onto Agilent Whole Human Genome Oligo Microarrays 44k (G4112A) and incubated at 60 °C with 4 rpm for 17 h. Slides were scanned on an Agilent Microarray Scanner G2565A.
2.5. cDNA synthesis and real‐time PCR analysis
cDNA was synthesised in a total volume of 20 μl with 100 ng total RNA using High Capacity cDNA Reverse Transcription kit (Applied Biosystems, Foster City, CA) and used as template for real‐time PCR analysis in TaqMan Gene Expression Assays (Applied Biosystems) on an ABI Prism 7900HT sequence detector system (Applied Biosystems). Universal Human Reference RNA (Stratagene) was used to generate standard curves. Each sample was run in triplicate. The relative gene expression levels were determined using the standard curve method and normalised relative to the reference gene PGK1.
2.6. Data processing
Microarray data were pre‐processed using Agilent Feature Extraction Software (v. 9.1) with default settings including loess normalisation. Data were filtered for spot quality and included in the analysis if the signal intensity of both tumour sample and reference were at least 1.5 over background in at least 70% of the samples. This filtered file of 32,287 spots was used for Significant Analysis of Microarrays (SAM) and Gene Set Enrichment Analysis (GSEA). For the remaining analyses, raw feature intensities were background corrected using RMA normalisation (Irizarry et al., 2003, 2003) in R/Bioconductor (Gentleman et al., 2004). Normalisation within arrays was performed using intensity‐dependent loess normalisation (Smyth and Speed, 2003). Each array was MvA plotted to inspect hybridisation quality (data not shown).
2.7. Statistics
Class discovery was performed using unsupervised hierarchical clustering with Pearson correlation distance and Ward's method. Prior to clustering analysis, the data were median‐centered on a gene per gene basis across the dataset.
Class distinction was performed using SAM (Tusher et al., 2001) to detect genes that were differentially expressed between two given classes. To functionally annotate gene lists derived from SAM, we used DAVID (Database for Annotation, Visualisation and Integrated Discovery) (Dennis et al., 2003). In addition, we used GSEA v2 (Subramanian et al., 2005) with the 1892 gene sets contained within the C2 (“functional gene set”) of MSigDB to search for significantly differentially expressed gene sets between groups of samples. Standard parameters were used for the analysis and the false discovery rate threshold was set at 25% to determine significance. All samples were assigned to one of the five molecular subtypes using a 50‐gene predictor PAM50 (Parker et al., 2009).
Fisher's Exact test in R/Bioconductor was used for analysis of associations between clinical or histopathological parameters and gene expression or patient clusters.
We used a logistic regression model to identify genes that predict whether a sample belongs to the DCIS “type I” or “type II” phenotypes independent of grade, HER2 and ER status. In particular, our logistic regression model had the form:
Here, Grade is a random variable with three levels (low, medium, high) corresponding to EORTC grades A, B, and C; ER is a random variable with two levels (0,1) where 1 represents an ER‐positive tumour sample; and HER2 is a random variable with three levels (low, medium, high) corresponding to levels of immunohistochemical staining of the HER2 protein. To predict the two level variable ‘DCIS Type’, each genomic feature g on the ∼44K probe Agilent array was included in the model individually, and the features g that had the lowest p‐value (suggesting the largest contribution to predicting DCIS Type status independent of the clinico‐histopathological variables) were selected for further analysis. Control probes on the array were also considered within this logistic regression as a control, and no such probe was significant under our model. ϵ is a standard error term in this model.
3. Results
3.1. Hierarchical clustering and identification of molecular subtypes
One hundred and nine tumours passed all quality control criteria and were successfully analysed in the array experiments. This includes 31 pure DCIS, 36 pure invasive cancers and 42 cases of mixed diagnosis. Six normal breast tissue samples were also used as controls. Hierarchical clustering using the most variable genes across all of the samples (>2 fold = 740 genes) did not separate the patients by diagnosis, or by any other clinical marker except for oestrogen receptor (ER) status to some extent (Supplementary Figure S1). All tumours were assigned to one of the five previously defined molecular subtypes of breast cancer (Perou et al., 2000; Sorlie et al., 2001), by correlation to the expression centroids using PAM50 (Parker et al., 2009). In total, 24 of the samples were identified as luminal A (22%), 30 as luminal B (28%), 16 as ERBB2+ (15%), 20 were basal‐like (18%), and 19 normal‐like (17%). All five subtypes were present in each of the three diagnosis groups of DCIS, IDC and mixed (molecular subtype frequency; % of DCIS vs. invasive vs. mixed): luminal A (7% vs. 8% vs. 9%), luminal B (7% vs. 11% vs. 12%), ERBB2+ (2% vs. 5% vs. 9%), basal‐like (6% vs. 6% vs. 8%) and normal‐like (9% vs. 6% vs. 4%) (Table 1).
3.2. Heterogeneity in gene expression among DCIS
Hierarchical clustering restricted to the 31 pure DCIS across the most variable genes (>2 fold = 605 genes) separated the samples into a pure ER‐negative group (n = 7) and a predominantly ER‐positive group (n = 24, 22 ER‐positive, 2 ER‐negative) (Figure 1A). The smaller group defined a distinct subgroup of seven DCIS that were highly proliferative (by Ki‐67; p = 0.014), high‐grade (EORTC grade C; p = 0.03), ER‐negative (p < 0.001), PR‐negative (p = 0.002), and HER2‐positive (p < 0.001), in comparison with the remaining 24 DCIS. Interestingly, eight additional DCIS of high‐grade (grade C; black squares in Figure 1) were contained within the larger group composed of the remaining 24 DCIS. We designated this subgroup of seven DCIS as “DCIS type I” and the remaining 24 DCIS as “DCIS type II”. Using the most variable genes across this patient set, we observe prominent differences in gene expression between these two groups (See Supplementary Figure S2 for the entire heatmap and Supplementary Table S1 for gene lists corresponding of over‐ (red bars) and under‐ (blue bars) expressed genes in “type I” illustrated in Figure S2).
Figure 1.
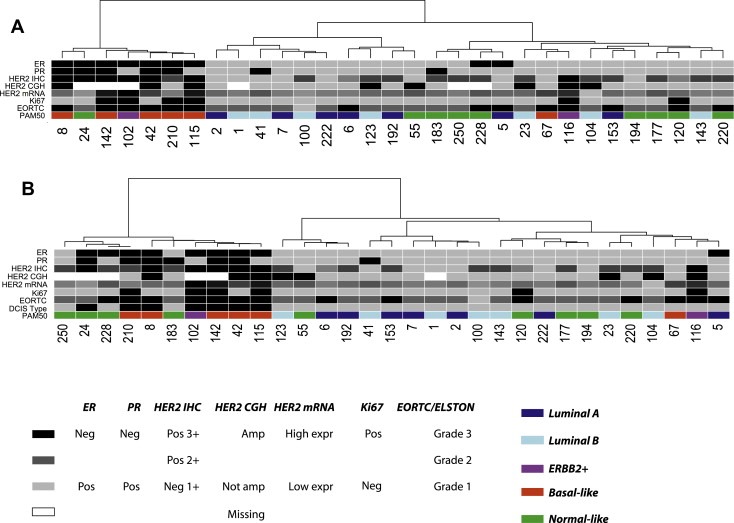
Hierarchical clustering of pure DCIS. A: Clustering of 605 genes showing variation of expression of at least 2 fold across all pure DCIS samples (see Supplemental Figure S2 for heatmap and Supplemental Table S1 for gene list). B: Clustering of the top 100 ER‐, HER2‐ and grade‐independent genes identified by logistic regression (see Supplemental Figure S3 for heatmap and Supplemental Table S3 for all 492 genes identified by logistic regression). DCIS Type indicates the DCIS subgroup: type I = black, type II = grey. Colour coding panel: ER: ER‐positive = grey, ER‐negative = black. PR: PR‐positive = grey, PR‐negative = black. HER2 IHC: 1+ = grey, 2+ = dark grey, 3+ = black. HER2 CGH: amplified = black, non‐amplified = grey, missing data = white. HER2 mRNA: gray‐scale according to expression value; black indicates high gene expression value. Ki‐67: Ki‐67‐positive = black, Ki‐67‐negative = grey. EORTC: grade A = grey, grade B = dark grey, grade C = black. PAM50 represents the different “intrinsic” molecular subtypes previously identified for invasive breast cancer. Dark blue = luminal A, light blue = luminal B, purple = ERBB2+, red = basal‐like and green = normal‐like. ER, PR and Ki‐67 status determined by IHC.
Next, we performed SAM (Tusher et al., 2001) to identify the genes most differentially expressed between the DCIS type I (n = 7) and DCIS type II (n = 24) phenotypes and identified 455 genes (FDR = 0%) (Supplementary Table S2). Genes highly expressed in the DCIS type I group include CXCL1, SNAI1, S100A7 and MMP1. GSEA (Subramanian et al., 2005) identified several pathways and processes that were enriched in the DCIS type I phenotype, including an EMT gene set (FDR q‐value = 0.023) (Jechlinger et al., 2003), an NFKB‐induced gene set (FDR q‐value = 0.023) and a cell proliferation gene set (FDR q‐value = 0.042) (Table 2). The EMT and the NFKB gene sets were also found enriched in the DCIS type I phenotype when compared with the eight high‐grade DCIS type II lesions, emphasising the differences among high‐grade DCIS lesions in the two subgroups.
Table 2.
Gene sets enriched in the DCIS type I to type II subgroup with FDR q‐value <0.05.
| Enriched in DCIS‐invasive‐like | |||
|---|---|---|---|
| GSEA TermID | Description | No. of genes | FDR q‐val |
| CR_DEATH | Cancer related genes involved in cell death | 69 | 0.020 |
| AMIPATHWAY | Endogenous anti‐thrombosis pathways are overwhelmed in plaque‐narrowed blood vessels, resulting in potentially lethal myocardial infarction. | 21 | 0.029 |
| CSKPATHWAY | Csk inhibits T cell activation by phosphorylating Lck; Csk is regulated by cAMP‐dependent kinases and is opposed by the T cell activator CD45. | 21 | 0.020 |
| CR_IMMUNE_FUNCTION | Cancer related genes involved in immune function | 41 | 0.022 |
| NFKB‐INDUCED | Genes upregulated by NF‐kappa B | 94 | 0.023 |
| EMT_UP | Upregulated during the TGFbeta‐induced epithelial–mesenchymal transition (EMT) of Ras‐transformed mouse mammary epithelial (EpH4) cells (EMT is representative of late‐stage tumour progression and metastasis) | 51 | 0.023 |
| CBF_LEUKEMIA_DOWNING_AML | Genes upregulated in AML samples with the CBF subtype | 64 | 0.020 |
| TCRPATHWAY | T cell receptors bind to foreign peptides presented by MHC molecules and induce T cell activation. | 42 | 0.024 |
| SIG_BCR_SIGNALING_PATHWAY | Members of the B cell antigen receptors (BCR) signaling pathway | 44 | 0.023 |
| CELL_SURFACE_RECEPTOR_LINKED_SIGNAL_TRANSDUCTION | Any series of molecular signals initiated by the binding of an extracellular ligand to a receptor on the surface of the target cell. | 107 | 0.028 |
| NKTPATHWAY | T cell differentiation into Th1 and Th2 cells occurs by differential chemokine receptor expression, which mediates tissue localization and immune response. | 20 | 0.029 |
| ST_T_CELL_SIGNAL_TRANSDUCTION | On activation of the T cell receptor, phospholipase C is activated to produce second messengers DAG and PIP3, both required for T cell activation. | 40 | 0.039 |
| SIG_PIP3_SIGNALING_IN_B_LYMPHOCYTES | Genes related to PIP3 signaling in B lymphocytes | 32 | 0.036 |
| BCRPATHWAY | B cell antigen receptors (BCRs) activate tyrosine kinases and transiently increase tyrosine phosphorylation on binding to antigen. | 34 | 0.033 |
| CCR5PATHWAY | CCR5 is a G‐protein coupled receptor expressed in macrophages that recognizes chemokine ligands and is targeted by the HIV envelope protein GP120. | 17 | 0.041 |
| ST_TUMOUR_NECROSIS_FACTOR_PATHWAY | Tumour necrosis factor is a pro‐inflammatory cytokine that activates NF‐kB and c‐Jun. | 29 | 0.042 |
| CELL PROLIFERATION | The multiplication or reproduction of cells, resulting in the rapid expansion of a cell population. | 183 | 0.042 |
| ST_B_CELL_ANTIGEN_RECEPTOR | B cell receptors bind antigens and promote B cell activation. | 37 | 0.043 |
| IL12PATHWAY | IL12 and Stat4 Dependent Signaling Pathway in Th1 Development. | 16 | 0.043 |
| RAP_UP | Genes upregulated in response to rapamycin starvation | 149 | 0.043 |
To further explore the functionality of the genes highly expressed in the DCIS type I phenotype, we used DAVID (Dennis et al., 2003) and identified GO classes including “Developmental process” (p < 0.001), “Angiogenesis” (p = 0.05), “Organ morphogenesis” (p = 0.014) and “Blood vessel morphogenesis” (p = 0.04) (Table 3).
Table 3.
A selection of significant functional annotation categories from DAVID analysis.
| Category | Term | Count | Un‐adjusted P | Adjusted P |
|---|---|---|---|---|
| GO classes enriched in DCIS type I | ||||
| GOTERM_BP_ALL | GO:0032502∼developmental process | 81 | 3.26E‐09 | 2.14E‐06 |
| GOTERM_BP_ALL | GO:0001568∼blood vessel development | 10 | 9.24E‐04 | 0.065228395 |
| GOTERM_BP_ALL | GO:0001525∼angiogenesis | 9 | 6.49E‐04 | 0.052705541 |
| GOTERM_BP_ALL | GO:0009887∼organ morphogenesis | 17 | 1.37E‐04 | 0.014593665 |
| GOTERM_BP_ALL | GO:0048514∼blood vessel morphogenesis | 10 | 3.77E‐04 | 0.036717664 |
| GO classes enriched in IDC | ||||
| GOTERM_CC_ALL | GO:0031012∼extracellular matrix | 53 | 1.68E‐32 | 7.27E‐30 |
| GOTERM_BP_ALL | GO:0016477∼cell migration | 17 | 1.43E‐05 | 0.003565703 |
| GOTERM_BP_ALL | GO:0032502∼developmental process | 102 | 3.28E‐11 | 2.46E‐08 |
| GOTERM_BP_ALL | GO:0001568∼blood vessel development | 17 | 1.16E‐07 | 4.34E‐05 |
| GOTERM_BP_ALL | GO:0001525∼angiogenesis | 11 | 1.52E‐04 | 0.029055562 |
| GOTERM_BP_ALL | GO:0009887∼organ morphogenesis | 21 | 2.45E‐05 | 0.005570863 |
| GOTERM_BP_ALL | GO:0048514∼blood vessel morphogenesis | 13 | 2.41E‐05 | 0.005739423 |
3.3. The DCIS type I phenotype is identified by genes independent of ER, HER2 and grade
In the DCIS type I phenotype, all tumours were of high EORTC grade (C) with one exception (a single grade B), ER‐negative and HER2‐positive (by IHC) with one exception (Figure 1A). Although most molecular subtypes are represented within this patient subset, the poor‐outcome subtypes are predominant (five basal‐like, one ERBB2+ and one normal‐like). To ablate the effects of patient subtype, we asked whether this set of samples would co‐cluster using genes with expression profiles that are independent of grade, ER‐ and HER2‐status. Towards this end, we used logistic regression to identify genes that univariately classify a sample as type I or type II independent of these traditional clinico‐histopathological parameters (see Methods). The model identified 492 genes (p < 0.001) separating these two groups (Supplementary Table S3). Subsequent hierarchical clustering identifies three additional samples that co‐clustered with the DCIS type I including one grade C/ER‐ (by IHC) and two grade B/ER+. All three samples were identified as normal‐like by the PAM50 classifier (Figure 1B; heatmap in Supplementary Figure S3).
3.4. The DCIS type I signature is conserved in an independent dataset
A previously published gene expression dataset (Hannemann et al., 2006) consisting of 39 DCIS and 40 IDC cases was explored to validate our findings. In this report, the DCIS tumours were classified into well‐, intermediately‐ and poorly‐differentiated categories. Hierarchical clustering of their in situ lesions with the top 100 genes identified by logistic regression in our study (44 of these were identified on their cDNA platform) separated the 39 samples into three main groups (Figure 2). Of the 15 poorly differentiated DCIS (sample DCIS.30.GS in the validation dataset contained both well‐ and poorly‐differentiated DCIS components), eleven of these predominantly clustered closely together within the leftmost group. These samples are primarily ER‐negative and HER2‐positive (including DCIS.30.GS). The four poorly differentiated samples categorized clustered with the well‐ and intermediately‐differentiated samples.
Figure 2.

Validation of the DCIS type I subgroup in an independent dataset. Hierarchical clustering of the 39 DCIS samples in the validation dataset (Hannemann et al., 2006) by 44 of the top 100 genes independent of ER, HER2 and grade identified by logistic regression (only 44 genes were matched on the cDNA platform used in (Hannemann et al., 2006)). Colour coding panel: DCIS grade: black = poorly‐differentiated, grey = intermediate differentiated, light grey = well‐differentiated. HER2 and ER: grey = positive by IHC and black = negative by IHC.
3.5. Genes differentially expressed between in situ and invasive tumours point to changes in tumour microenvironment
To identify genes that may be markers of the difference between in situ and invasive carcinomas, we applied SAM and identified 474 genes significantly differentially expressed between the DCIS type II phenotype (n = 24) and the IDCs (n = 36) (FDR = 0%) (Supplementary Table S4). Seven samples classified as DCIS type I were excluded from this analysis, as these contain many features that are similar to IDCs. Many of the identified genes are also known to be highly expressed in IDCs including MMP2, MMP14, MMP11, CSPG2, SPARC, FN1 and POSTN are related to invasion and metastasis. In line with this, GSEA identified genes involved in EMT (FDR q‐value = 0.008) as well as several matrix metalloproteinases as highly expressed in IDCs (FDR q‐value = 0.022) (Supplementary Table S5). GO classes enriched in IDCs are shown in Table 3. In contrast, only 13 genes were identified by SAM as differentially expressed between the DCIS type I phenotype and invasive grade III tumours (Supplementary Table S6). Hierarchical clustering performed over all DCIS (n = 31) and IDC (n = 36) samples using a larger list of 1724 genes from SAM analysis (FDR < 5%), separated the majority of the in situ lesions from the invasive tumours, except for the DCIS type I cases that co‐clustered with the IDC samples (Supplementary Figure S4A).
Lastly, gene expression patterns of 474 SAM genes were investigated in the validation dataset (Hannemann et al., 2006) of which 279 could be matched to their microarray platform. Hierarchical clustering revealed that most of the 39 in situ lesions could be separated from the 40 invasive cancers (Supplementary Figure S4B).
3.6. Hierarchical clustering based on published gene signatures
We examined our data using an existing 43‐gene signature designed to separate well‐ from poorly‐differentiated DCIS, (Hannemann et al., 2006). Using the 40 genes identifiable on our microarray platform, hierarchical clustering of the 31 DCIS samples in our dataset separated the DCIS type I from the type II subgroup (Supplemental Figure S5). A 35‐gene signature designed to separate DCIS from IDC samples (Hannemann et al., 2006) did not separate such samples in our data (not shown).
Similarly, gene expression profiles of two other published gene signatures associated with angiogenesis and EMT, respectively (Bhati et al., 2008; Jechlinger et al., 2003), separated the DCIS type I and type II phenotype groups by hierarchical clustering (Supplementary Figure S6A and B).
3.7. Real‐time PCR validation of selected genes
For validation by an independent gene expression technology, we selected four genes (FOXA1, TRAF3IP3, HCST and CYP1B1) identified as differential expressed between the DCIS type I and type II phenotypes in the SAM analysis. TaqMan qRT‐PCR analysis of 28 DCIS showed significant differential expression between the two subgroups for FOXA1 (p = 0.0001) and borderline significance for TRAF3IP3 (p = 0.057) (Figure 3A and B). HCST (p = 0.162) and CYP1B1 (p = 0.145) were not significantly differential expressed as measured by qRT‐PCR (Figure 3C and D). Furthermore, to validate our findings of high expression of EMT‐related genes in the type I group relative to the type II group, three EMT‐related genes also identified by the SAM analysis were analysed by qRT‐PCR; SNAI1 (p = 0.033), S100A8 (p = 0.002) and CXCL1 (p = 0.001), all of which showed significant differential expression between the two DCIS subgroups (Figure 3E–G).
Figure 3.

Validation of microarray gene expression by real‐time PCR. A–D: Relative expression levels of genes identified by SAM; FOXA1, TRAF3IP3, HCST and CYP1B1, measured by TaqMan qRT‐PCR in 22 type II and 6 type I DCIS cases. E–G: Relative expression level of EMT‐related genes identified by SAM; SNAI1, S100A8 and CXCL1, measured by TaqMan qRT‐PCR in 22 DCIS type II and 6 DCIS type I cases. Black horizontal bars represent median value for each DCIS phenotype.
4. Discussion
Choosing tumour samples randomly from a population‐based cohort has the advantage that results will not be biased by selection. Lack of full cohort coverage due to an under‐representation of small tumours is inevitable, although this issue is not expected to have a large impact on studies comparing invasive and in situ tumours of similar size. We would like to emphasise that this study was not designed to look at prognosis and there was no effort made during patient selection to choose patients who received similar therapy. None of the DCIS patients died from breast cancer and only three experienced a local recurrence.
Similar to invasive breast cancer, DCIS displays heterogeneity in gene expression patterns, even within samples of the same histological grade. By hierarchical clustering of whole‐genome expression data, we identified a subgroup of high‐grade DCIS lesions (type I) that demonstrate a distinctive gene expression profile compared to other DCIS (type II). Importantly, type II DCIS also contain samples with high‐grade (Figure 1A). The DCIS type I phenotype (n = 7) consisted of six grade C and one grade B tumours, and were all ER‐negative and HER2‐positive by IHC. Three additional samples showed strikingly similar gene expression profiles to the DCIS type I phenotype using genes identified by logistic regression to be classifiers of this subgroup independent of grade, ER‐ and HER2‐status (Figure 1B). These three samples were classified as “normal‐like”, had low expression of HER2, and two were ER+ by IHC. This provides additional evidence that the DCIS type I phenotype is not an artefact of ER‐negative and HER2‐positive DCIS in the dataset, and might suggest that an invasive‐like profile is inherent across breast cancer subtypes. Invasive carcinomas have been reported to develop among women with DCIS of all nuclear grades (Collins et al., 2005), which further supports the existence of an invasive‐like phenotype beyond histopathological and molecular intrinsic subtypes. The DCIS type I subgroup showed similarities to more advanced tumours by clustering together with mixed and invasive tumours (Supplementary Figure S1).
As previously reported, DCIS samples were classified into the “intrinsic” molecular subtypes (Allred et al., 2008; Hannemann et al., 2006; Vincent‐Salomon et al., 2008) originally defined for invasive breast cancer (Perou et al., 2000). Hierarchical clustering of all samples in this study (DCIS, invasive, mixed) using the most variable genes revealed no clustering by diagnosis but rather a trend to group by intrinsic subtypes (Supplementary Figure S1). This suggests that the intrinsic biology of tumours, reflected in their expression patterns, contains features distinct from both stage and histological grade, and that this diversity is already present in early lesions. Several intrinsic subtypes are present in the DCIS type I subgroup (five basal‐like, one ERBB2+, one normal‐like) further emphasising the high degree of heterogeneity in all breast lesions, and suggests that progression from DCIS to invasive cancer occurs in several subtypes. Indeed, Allred and co‐workers observed co‐existence of several intrinsic subtypes within individual DCIS lesions (Allred et al., 2008; Navin and Hicks, 2010). Similarities in genomic aberrations between DCIS and invasive carcinomas also support that genomic/biological diversity is acquired at early stages of cancer development (Vincent‐Salomon et al., 2008). A previous gene expression profiling study reported that the most dramatic transcriptome change occurs at the normal to DCIS transition (Porter et al., 2003) and others have reported that different stages of breast cancer (atypical ductal hyperplasia, DCIS and IDC) are highly similar to each other at the level of the transcriptome (Ma et al., 2003). However, studies comparing DCIS and IDCs have identified stage‐specific markers (Schuetz et al., 2006) along with a gene expression classifier that differed between DCIS and invasive breast cancer (Hannemann et al., 2006). Our results demonstrate important differences between DCIS lesions of the same histopathological grade and suggest that genes conferring invasive growth are only active in some pre‐invasive lesions.
There are also important differences between in situ lesions and invasive tumours. We identified almost 500 genes differentially expressed between the DCIS type II subgroup and the small invasive tumours in this study. Here, we excluded the type I DCIS since we have established that they resemble invasive breast tumours. Genes encoding extracellular matrix (ECM)‐related proteins and proteins involved in EMT were highly expressed in the invasive tumours. Interestingly, most of the lesions within the DCIS type I subgroup shared these expression patterns with the invasive tumours. These observations also hold within the validation study, where some of the poorly differentiated DCIS samples co‐clustered with the invasive tumours. Hence, some high‐grade DCIS, both positive and negative for ER/PR and HER2, show gene expression features of invasive carcinomas, such as activated microenvironment re‐organisation processes, indicating that they have or will acquire a motile phenotype in addition to the ability to invade the basement membrane. In contrast, other high‐grade DCIS exhibited different gene expression profiles and do not appear to be associated with EMT nor with breakage of basement membrane and ECM.
Several microarray studies have been conducted to identify gene signatures associated with different features of breast tumour invasion. Investigation of the expression profiles of two such gene lists (a tumour specific angiogenesis signature (Bhati et al., 2008) and an EMT‐related gene set (Jechlinger et al., 2003)) in our data emphasised the re‐organisation of the microenvironment specifically in the DCIS type I tumours (Supplementary Figure 6A and B). The role of EMT in breast cancer prognosis is still under debate, however a number of EMT‐related genes have been linked to poor‐outcome in breast cancer. For example, Jechlinger et al. (2003) found that several EMT/metastasis‐specific genes from their study correlated with poor prognosis as assessed by the 70‐gene signature published by van 't Veer et al. (2002). By hierarchical clustering using these EMT‐related genes and all DCIS lesions in our study, separation of luminal and basal‐like samples was evident (Supplementary Figure 6B) and it has been suggested that this process is specific to tumours of basal‐like type (Sarrio et al., 2008). Specific detection of EMT in tumour biopsies is difficult as it is a transient state and mesenchymal to epithelial transition (MET) is necessary for subsequent metastatic development (Hugo et al., 2007). Studies of micrometastatic cells from the bone marrow have shown that these cells express proteins characteristic of EMT and a more aggressive phenotype (Willipinski‐Stapelfeldt et al., 2005), suggesting bone marrow to be a repository for these transient cells. It remains to be determined whether this is a universal trait of all breast cancer, or confined to certain subtypes. Gene expression analysis by qRT‐PCR for a handful of genes selected to be differentially expressed between the DCIS type I and the type II subgroups from the microarray data also showed statistically different expression between the two groups for 5 of the 7 genes (Figure 3). Our results indicate that not all high‐grade DCIS lesions exhibit a potential for invasion. Studies that favour more aggressive treatment, such as radiation therapy given to all DCIS patients after lumpectomy may therefore represent over treatment (Allred et al., 2008; Emdin et al., 2006; Fisher et al., 2001; Houghton et al., 2003). One could speculate that the DCIS type I subgroup of patients might be considered for more aggressive therapies while the DCIS type II subgroup could be spared such regimens.
Since this study was designed to find differences related to tumour progression from in situ to invasive cancer, follow‐up studies are needed to investigate these biological markers and their potential for predicting prognosis and survival. Also, due to a low matching percentage (about 50%) between the microarray platforms used in our study and the validation study (Hannemann et al., 2006), confirmation of these results is needed in other, larger DCIS datasets, preferably with associated survival/recurrence follow‐up data.
5. Conclusions
All DCIS and invasive samples can be classified into the “intrinsic” molecular subtypes as defined previously for invasive breast carcinomas. Hierarchical clustering revealed that samples cluster by intrinsic subtypes, and not by diagnosis. We identified a subgroup of high‐grade DCIS with a more active stroma including high expression of angiogenic factors and EMT markers that could not be distinguished solely by grade, ER‐ and HER2‐status. qRT‐PCR of single markers clearly separated this DCIS subgroup from the other DCIS, which consisted of both high and low grade lesions as well as ER‐ and HER2‐positive and negative samples. The results were validated in an independent published microarray dataset (Hannemann et al., 2006). Further validation is needed within in a prospective design, to confirm the potentially invasive and poor prognostic characteristics of this DCIS type I, invasive‐like subgroup.
Financial support
This work has been supported by grants from the Norwegian Cancer Society (PR‐2006‐0332 to TS), the Norwegian Research Council (163027/V40 to TS; 155218/300 to ALBD) the Swedish Cancer Society (4920‐B06‐03PCD to FW) and “Foreningen for brystkreftopererte” – the Pink Ribbon Campaign. AAM is a fellow of the Norwegian Cancer Society.
Conflict of interest
None declared.
Supporting information
The following are the supplementary data related to this article:
Fig. S1. Hierarchical clustering of 740 genes showing at least 2 fold variation in expression across the whole dataset (31 DCIS, 36 invasive and 42 mixed cases). Colour coding: Diagnosis: White = normal tissue, light grey = DCIS, dark grey = invasive and black = mixed. “DCIS type” indicates the type of DCIS: type I = black, type II = grey. ER: ER‐positive = grey, ER‐negative = black. PR: PR‐positive = grey, PR‐negative = black. HER2 IHC: 1+ = grey, 2+ = dark grey, 3+ = black. HER2 CGH: amplified = black, not‐amplified = grey, missing data = white. HER2 mRNA: Black indicates high HER2 gene expression. Ki‐67: Ki‐67‐positive = black, Ki‐67‐negative = grey. EORTC/ELSTON: grade A/I = grey, grade B/II = dark grey, grade C/III = black. PAM50 represent the different “intrinsic” molecular subtypes previously identified for invasive breast cancer. Dark blue = luminal A, light blue = luminal B, purple = ERBB2+, red = basal‐like and green = normal‐like. ER, PR and Ki‐67 status determined by IHC.
Fig. S2. Hierarchical clustering of the 31 DCIS across the most variable genes (>2 fold = 605 genes). Colour coding: ER: ER‐positive = grey, ER‐negative = black. PR: PR‐positive = grey, PR‐negative = black. HER2 IHC: 1+ = grey, 2+ = dark grey, 3+ = black. HER2 CGH: amplified = black, not‐amplified = grey, missing data = white. HER2 mRNA: Dark colour represents high HER2 gene expression. Ki‐67: Ki‐67‐positive = black, Ki‐67‐negative = grey. EORTC: grade A = grey, grade B = dark grey, grade C = black. PAM50 represent the different “intrinsic” molecular subtypes previously identified for invasive breast cancer. Dark blue = luminal A, light blue = luminal B, purple = ERBB2+, red = basal‐like and green = normal‐like. Red and blue horizontal bars represent upregulated and down‐regulated genes in the DCIS type I subgroup, respectively. Genes are listed in Supplementary Table S1. ER, PR and Ki‐67 status determined by IHC.
Fig. S3. Hierarchical clustering of the 31 DCIS using the top 100 genes independent of ER, HER2 and grade identified by logistic regression. Colour coding: ER: ER‐positive = grey, ER‐negative = black. PR: PR‐positive = grey, PR‐negative = black. HER2 IHC: 1+ = grey, 2+ = dark grey, 3+ = black. HER2 CGH: amplified = black, not‐amplified = grey, missing data = white. HER2 mRNA: Dark colour represents high HER2 gene expression. Ki‐67: Ki‐67‐positive = black, Ki‐67‐negative = grey. EORTC: grade A = grey, grade B = dark grey, grade C = black. PAM50 represent the different “intrinsic” molecular subtypes previously identified for invasive breast cancer. Dark blue = luminal A, light blue = luminal B, purple = ERBB2+, red = basal‐like and green = normal‐like. ER, PR and Ki‐67 status determined by IHC.
Fig. S4A. Hierarchical clustering of 1724 genes identified by SAM between the non‐invasive‐like DCIS and IDCs (FDR < 5%). Colour coding: Diagnosis: light grey = DCIS and dark grey = invasive. “DCIS type” indicates the DCIS subgroup: type I = black, type II = grey. ER: ER‐positive = grey, ER‐negative = black. PR: PR‐positive = grey, PR‐negative = black. HER2 IHC: 1+ = grey, 2+ = dark grey, 3+ = black. HER2 CGH: amplified = black, not‐amplified = grey, missing data = white. HER2 mRNA: Black indicates high HER2 gene expression. Ki‐67: Ki‐67‐positive = black, Ki‐67‐negative = grey. EORTC/ELSTON: grade A/I = grey, grade B/II = dark grey, grade C/III = black. PAM50 represent the different “intrinsic” molecular subtypes previously identified for invasive breast cancer. Dark blue = luminal A, light blue = luminal B, purple = ERBB2+, red = basal‐like and green = normal‐like. ER, PR and Ki‐67 status determined by IHC.
Fig. S4B. Hierarchical clustering of all DCIS and IDCs in the validation dataset (Hannemann et al., 2006) using genes identified by SAM between the non‐invasive‐like DCIS and IDCs (FDR = 0%). Only 279 of the 474 genes were matched on the cDNA array platform. Colour coding: DCIS grade EORTC: light grey = well‐differentiated, grey = intermediate differentiated, black = poorly‐differentiated. Invasive grade ELSTON: light grey = well‐differentiated, grey = intermediate differentiated, black = poorly‐differentiated. HER2 and = ER: grey = positive by IHC and black = negative by IHC.
Fig. S5. Hierarchical clustering of the 31 DCIS using the 43‐gene classifier published by Hannemann et al. (2006). Colour coding: ER: ER‐positive = grey, ER‐negative = black. PR: PR‐positive = grey, PR‐negative = black. HER2 IHC: 1+ = grey, 2+ = dark grey, 3+ = black. HER2 CGH: amplified = black, not‐amplified = grey, missing data = white. HER2 mRNA: Dark colour represents high HER2 gene expression. Ki‐67: Ki‐67‐positive = black, Ki‐67‐negative = grey. EORTC: grade A = grey, grade B = dark grey, grade C = black. “DCIS type” indicates the DCIS subgroup: type I = black, type II = grey. PAM50 represent the different “intrinsic” molecular subtypes previously identified for invasive breast cancer. Dark blue = luminal A, light blue = luminal B, purple = ERBB2+, red = basal‐like and green = normal‐like. ER, PR and Ki‐67 status determined by IHC.
Fig. S6A. Hierarchical clustering of the 31 DCIS using tumour specific vascular genes published by Bhati et al. (2008) (Willipinski‐Stapelfeldt et al., 2005). (41 of the 55 genes could be matched to our array platform).
Fig. S6B. Hierarchical clustering of EMT‐related genes published by Jechlinger et al. (2003) (131 of 148 genes could be matched to our array platform). Colour coding Fig. S6A and B: ER: ER‐positive = grey, ER‐negative = black. PR: PR‐positive = grey, PR‐negative = black. HER2 IHC: 1+ = grey, 2+ = dark grey, 3+ = black. HER2 CGH: amplified = black, not‐amplified = grey, missing data = white. HER2 mRNA: Dark colour represents high HER2 gene expression. Ki‐67: Ki‐67‐positive = black, Ki‐67‐negative = grey. EORTC: grade A = grey, grade B = dark grey, grade C = black. “DCIS type” indicates the DCIS subgroup: type I = black, type II = grey. PAM50 represent the different “intrinsic” molecular subtypes previously identified for invasive breast cancer. Dark blue = luminal A, light blue = luminal B, purple = ERBB2+, red = basal‐like and green = normal‐like. ER, PR and Ki‐67 status determined by IHC.
Table S1 . Gene lists corresponding to the red and blue bars illustrated in Figure S2.
Table S2 . SAM of the DCIS type I (n = 7) vs. type II (n = 24) subgroups identified 455 genes (FDR = 0%).
Table S3 . 492 genes independent of ER, HER2 and grade identified by logistic regression to be predictive of the DCIS type I subgroup.
Table S4 . SAM of the DCIS type II (n = 24) vs. IDC (n = 36) identified 474 genes (FDR = 0%).
Table S5 . Gene sets enriched in the IDC compared to DCIS type II subgroup with FDR q‐value <0.05.
Table S6 . SAM analysis of the DCIS type I (n = 7) vs. the grade III IDC (n = 6) identified 13 genes (FDR = 0%).
Acknowledgements
We thank Joel Parker and Chuck Perou for performing the molecular subtyping using PAM50 and Jørgen Aarøe for help with aCGH data. The Fresh Tissue Biobank at the Department of Pathology, Uppsala University Hospital, was supported by the Swedish National Biobank Program funded by Wallenberg Consortium North and Swegene.
Supplementary data associated with this article can be found, in the online version, at doi:10.1016/j.molonc.2010.06.007.
Chua Boon Tin, Lim Shu Jing, Tham Su Chin, Poh Wei Jie, Ullrich Axel, Ullrich Axel, Ullrich Axel, Ullrich Axel, Ullrich Axel, Ullrich Axel, Ullrich Axel, (2010), Molecular diversity in ductal carcinoma in situ (DCIS) and early invasive breast cancer, Molecular Oncology, 4, doi: 10.1016/j.molonc.2010.06.007.
Contributor Information
Aslaug Aamodt Muggerud, Email: aslauam@gmail.com.
Michael Hallett, Email: hallett@mcb.mcgill.ca.
Hilde Johnsen, Email: Hilde.Johnsen@rr-research.no.
Kristine Kleivi, Email: kristine.kleivi@gmail.com.
Wenjing Zhou, Email: wenjing.zhou@surgsci.uu.se.
Simin Tahmasebpoor, Email: simin.tahmasebpoor@akademiska.se.
Rose-Marie Amini, Email: Rose-Marie.Amini@genpat.uu.se.
Johan Botling, Email: johan.botling@akademiska.se.
Anne-Lise Børresen-Dale, Email: a.l.borresen-dale@medisin.uio.no.
Therese Sørlie, Email: tsorlie@rr-research.no.
Fredrik Wärnberg, Email: fredrik.warnberg@akademiska.se.
References
- Allred, D.C. , Wu, Y. , Mao, S. , Nagtegaal, I.D. , Lee, S. , Perou, C.M. , Mohsin, S.K. , O'Connell, P. , Tsimelzon, A. , Medina, D. , 2008. Ductal carcinoma in situ and the emergence of diversity during breast cancer evolution. Clin. Cancer Res. 14, 370–378. [DOI] [PubMed] [Google Scholar]
- Bethwaite, P. , Smith, N. , Delahunt, B. , Kenwright, D. , 1998. Reproducibility of new classification schemes for the pathology of ductal carcinoma in situ of the breast. J. Clin. Pathol. 51, 450–454. [DOI] [PMC free article] [PubMed] [Google Scholar]
- Bhati, R. , Patterson, C. , Livasy, C.A. , Fan, C. , Ketelsen, D. , Hu, Z. , Reynolds, E. , Tanner, C. , Moore, D.T. , Gabrielli, F. , Perou, C.M. , Klauber-DeMore, N. , 2008. Molecular characterization of human breast tumour vascular cells. Am. J. Pathol. 172, 1381–1390. [DOI] [PMC free article] [PubMed] [Google Scholar]
- Blick, T. , Widodo, E. , Hugo, H. , Waltham, M. , Lenburg, M.E. , Neve, R.M. , Thompson, E.W. , 2008. Epithelial mesenchymal transition traits in human breast cancer cell lines. Clin. Exp. Metastasis. 25, 629–642. [DOI] [PubMed] [Google Scholar]
- Casey, T. , Bond, J. , Tighe, S. , Hunter, T. , Lintault, L. , Patel, O. , Eneman, J. , Crocker, A. , White, J. , Tessitore, J. , Stanley, M. , Harlow, S. , Weaver, D. , Muss, H. , Plaut, K. , 2009. Molecular signatures suggest a major role for stromal cells in development of invasive breast cancer. Breast Cancer Res. Treat. 114, 47–62. [DOI] [PubMed] [Google Scholar]
- Celis, J.E. , Gromova, I. , Cabezon, T. , Gromov, P. , Shen, T. , Timmermans-Wielenga, V. , Rank, F. , Moreira, J.M. , 2007. Identification of a subset of breast carcinomas characterized by expression of cytokeratin 15: relationship between CK15+ progenitor/amplified cells and pre-malignant lesions and invasive disease. Mol. Oncol. 1, 321–349. [DOI] [PMC free article] [PubMed] [Google Scholar]
- Chang, H.Y. , Sneddon, J.B. , Alizadeh, A.A. , Sood, R. , West, R.B. , Montgomery, K. , Chi, J.T. , van de Rijn, M. , Botstein, D. , Brown, P.O. , 2004. Gene expression signature of fibroblast serum response predicts human cancer progression: similarities between tumours and wounds. PLoS Biol. 2, E7 [DOI] [PMC free article] [PubMed] [Google Scholar]
- Collins, L.C. , Tamimi, R.M. , Baer, H.J. , Connolly, J.L. , Colditz, G.A. , Schnitt, S.J. , 2005. Outcome of patients with ductal carcinoma in situ untreated after diagnostic biopsy: results from the Nurses' Health Study. Cancer. 103, 1778–1784. [DOI] [PubMed] [Google Scholar]
- Cuzick, J. , 2003. Treatment of DCIS–results from clinical trials. Surg. Oncol. 12, 213–219. [DOI] [PubMed] [Google Scholar]
- Dennis, G. , Sherman, B.T. , Hosack, D.A. , Yang, J. , Gao, W. , Lane, H.C. , Lempicki, R.A. , 2003. DAVID: Database for Annotation, Visualization, and Integrated Discovery. Genome Biol. 4, P3 [PubMed] [Google Scholar]
- Elston, E.W. , Ellis, I.O. , 1993. Method for grading breast cancer. J. Clin. Pathol. 46, 189–190. [DOI] [PMC free article] [PubMed] [Google Scholar]
- Emdin, S.O. , Granstrand, B. , Ringberg, A. , Sandelin, K. , Arnesson, L.G. , Nordgren, H. , Anderson, H. , Garmo, H. , Holmberg, L. , Wallgren, A. , 2006. SweDCIS: Radiotherapy after sector resection for ductal carcinoma in situ of the breast. Results of a randomised trial in a population offered mammography screening. Acta Oncol. 45, 536–543. [DOI] [PubMed] [Google Scholar]
- Fisher, B. , Land, S. , Mamounas, E. , Dignam, J. , Fisher, E.R. , Wolmark, N. , 2001. Prevention of invasive breast cancer in women with ductal carcinoma in situ: an update of the National Surgical Adjuvant Breast and Bowel Project experience. Semin. Oncol. 28, 400–418. [DOI] [PubMed] [Google Scholar]
- Gentleman, R.C. , Carey, V.J. , Bates, D.M. , Bolstad, B. , Dettling, M. , Dudoit, S. , Ellis, B. , Gautier, L. , Ge, Y. , Gentry, J. , Hornik, K. , Hothorn, T. , Huber, W. , Iacus, S. , Irizarry, R. , Leisch, F. , Li, C. , Maechler, M. , Rossini, A.J. , Sawitzki, G. , Smith, C. , Smyth, G. , Tierney, L. , Yang, J.Y. , Zhang, J. , 2004. Bioconductor: open software development for computational biology and bioinformatics. Genome Biol. 5, R80 [DOI] [PMC free article] [PubMed] [Google Scholar]
- Hannemann, J. , Velds, A. , Halfwerk, J.B. , Kreike, B. , Peterse, J.L. , van de Vijver, M.J. , 2006. Classification of ductal carcinoma in situ by gene expression profiling. Breast Cancer Res. 8, R61 [DOI] [PMC free article] [PubMed] [Google Scholar]
- Holland, R. , Peterse, J.L. , Millis, R.R. , Eusebi, V. , Faverly, D. , van de Vijver, M.J. , Zafrani, B. , 1994. Ductal carcinoma in situ: a proposal for a new classification. Semin. Diagn. Pathol. 11, 167–180. [PubMed] [Google Scholar]
- Houghton, J. , George, W.D. , Cuzick, J. , Duggan, C. , Fentiman, I.S. , Spittle, M. , 2003. Radiotherapy and tamoxifen in women with completely excised ductal carcinoma in situ of the breast in the UK, Australia, and New Zealand: randomised controlled trial. Lancet. 362, 95–102. [DOI] [PubMed] [Google Scholar]
- Hu, M. , Polyak, K. , 2008. Microenvironmental regulation of cancer development. Curr. Opin. Genet. Dev. 18, 27–34. [DOI] [PMC free article] [PubMed] [Google Scholar]
- Hu, M. , Yao, J. , Carroll, D.K. , Weremowicz, S. , Chen, H. , Carrasco, D. , Richardson, A. , Violette, S. , Nikolskaya, T. , Nikolsky, Y. , Bauerlein, E.L. , Hahn, W.C. , Gelman, R.S. , Allred, C. , Bissell, M.J. , Schnitt, S. , Polyak, K. , 2008. Regulation of in situ to invasive breast carcinoma transition. Cancer Cell. 13, 394–406. [DOI] [PMC free article] [PubMed] [Google Scholar]
- Hugo, H. , Ackland, M.L. , Blick, T. , Lawrence, M.G. , Clements, J.A. , Williams, E.D. , Thompson, E.W. , 2007. Epithelial–mesenchymal and mesenchymal–epithelial transitions in carcinoma progression. J. Cell Physiol. 213, 374–383. [DOI] [PubMed] [Google Scholar]
- Irizarry, R.A. , Bolstad, B.M. , Collin, F. , Cope, L.M. , Hobbs, B. , Speed, T.P. , 2003. Summaries of Affymetrix GeneChip probe level data. Nucleic Acids Res. 31, e15 [DOI] [PMC free article] [PubMed] [Google Scholar]
- Irizarry, R.A. , Hobbs, B. , Collin, F. , Beazer-Barclay, Y.D. , Antonellis, K.J. , Scherf, U. , Speed, T.P. , 2003. Exploration, normalization, and summaries of high density oligonucleotide array probe level data. Biostatistics. 4, 249–264. [DOI] [PubMed] [Google Scholar]
- Jechlinger, M. , Grunert, S. , Tamir, I.H. , Janda, E. , Ludemann, S. , Waerner, T. , Seither, P. , Weith, A. , Beug, H. , Kraut, N. , 2003. Expression profiling of epithelial plasticity in tumour progression. Oncogene. 22, 7155–7169. [DOI] [PubMed] [Google Scholar]
- Lagios, M.D. , Westdahl, P.R. , Margolin, F.R. , Rose, M.R. , 1982. Duct carcinoma in situ. Relationship of extent of noninvasive disease to the frequency of occult invasion, multicentricity, lymph node metastases, and short-term treatment failures. Cancer. 50, 1309–1314. [DOI] [PubMed] [Google Scholar]
- Leonard, G.D. , Swain, S.M. , 2004. Ductal carcinoma in situ, complexities and challenges. J. Natl. Cancer Inst. 96, 906–920. [DOI] [PubMed] [Google Scholar]
- Lien, H.C. , Hsiao, Y.H. , Lin, Y.S. , Yao, Y.T. , Juan, H.F. , Kuo, W.H. , Hung, M.C. , Chang, K.J. , Hsieh, F.J. , 2007. Molecular signatures of metaplastic carcinoma of the breast by large-scale transcriptional profiling: identification of genes potentially related to epithelial–mesenchymal transition. Oncogene. 26, 7859–7871. [DOI] [PubMed] [Google Scholar]
- Ma, X.J. , Salunga, R. , Tuggle, J.T. , Gaudet, J. , Enright, E. , McQuary, P. , Payette, T. , Pistone, M. , Stecker, K. , Zhang, B.M. , Zhou, Y.X. , Varnholt, H. , Smith, B. , Gadd, M. , Chatfield, E. , Kessler, J. , Baer, T.M. , Erlander, M.G. , Sgroi, D.C. , 2003. Gene expression profiles of human breast cancer progression. Proc. Natl. Acad. Sci. U S A. 100, 5974–5979. [DOI] [PMC free article] [PubMed] [Google Scholar]
- Naume, B. , Zhao, X. , Synnestvedt, M. , Borgen, E. , Russnes, H.G. , Lingjaerde, O.C. , Stromberg, M. , Wiedswang, G. , Kvalheim, G. , Karesen, R. , Nesland, J.M. , Borresen-Dale, A.L. , Sorlie, T. , 2007. Presence of bone marrow micrometastasis is associated with different recurrence risk within molecular subtypes of breast cancer. Mol. Oncol. 1, 160–171. [DOI] [PMC free article] [PubMed] [Google Scholar]
- Navin, N. , Hicks, J. , 2010. Tracing the tumour lineage. Mol. Oncol. 4, 267–283. [DOI] [PMC free article] [PubMed] [Google Scholar]
- Parker, J.S. , Mullins, M. , Cheang, M.C. , Leung, S. , Voduc, D. , Vickery, T. , Davies, S. , Fauron, C. , He, X. , Hu, Z. , Quackenbush, J.F. , Stijleman, I.J. , Palazzo, J. , Marron, J.S. , Nobel, A.B. , Mardis, E. , Nielsen, T.O. , Ellis, M.J. , Perou, C.M. , Bernard, P.S. , 2009. Supervised risk predictor of breast cancer based on intrinsic subtypes. J. Clin. Oncol. 27, 1160–1167. [DOI] [PMC free article] [PubMed] [Google Scholar]
- Patani, N. , Cutuli, B. , Mokbel, K. , 2008. Current management of DCIS: a review. Breast Cancer Res. Treat. 111, 1–10. [DOI] [PubMed] [Google Scholar]
- Perou, C.M. , Sorlie, T. , Eisen, M.B. , van de Rijn, M. , Jeffrey, S.S. , Rees, C.A. , Pollack, J.R. , Ross, D.T. , Johnsen, H. , Akslen, L.A. , Fluge, O. , Pergamenschikov, A. , Williams, C. , Zhu, S.X. , Lonning, P.E. , Borresen-Dale, A.L. , Brown, P.O. , Botstein, D. , 2000. Molecular portraits of human breast tumours. Nature. 406, 747–752. [DOI] [PubMed] [Google Scholar]
- Polyak, K. , Hu, M. , 2005. Do myoepithelial cells hold the key for breast tumour progression?. J. Mammary Gland Biol. Neoplasia. 10, 231–247. [DOI] [PubMed] [Google Scholar]
- Porter, D. , Lahti-Domenici, J. , Keshaviah, A. , Bae, Y.K. , Argani, P. , Marks, J. , Richardson, A. , Cooper, A. , Strausberg, R. , Riggins, G.J. , Schnitt, S. , Gabrielson, E. , Gelman, R. , Polyak, K. , 2003. Molecular markers in ductal carcinoma in situ of the breast. Mol. Cancer Res. 1, 362–375. [PubMed] [Google Scholar]
- Rice, A. , Quinn, C.M. , 2002. Angiogenesis, thrombospondin, and ductal carcinoma in situ of the breast. J. Clin. Pathol. 55, 569–574. [DOI] [PMC free article] [PubMed] [Google Scholar]
- Sarrio, D. , Rodriguez-Pinilla, S.M. , Hardisson, D. , Cano, A. , Moreno-Bueno, G. , Palacios, J. , 2008. Epithelial–mesenchymal transition in breast cancer relates to the basal-like phenotype. Cancer Res. 68, 989–997. [DOI] [PubMed] [Google Scholar]
- Schuetz, C.S. , Bonin, M. , Clare, S.E. , Nieselt, K. , Sotlar, K. , Walter, M. , Fehm, T. , Solomayer, E. , Riess, O. , Wallwiener, D. , Kurek, R. , Neubauer, H.J. , 2006. Progression-specific genes identified by expression profiling of matched ductal carcinomas in situ and invasive breast tumours, combining laser capture microdissection and oligonucleotide microarray analysis. Cancer Res. 66, 5278–5286. [DOI] [PubMed] [Google Scholar]
- Sharma, M. , Beck, A.H. , Webster, J.A. , Espinosa, I. , Montgomery, K. , Varma, S. , van de Rijn, M. , Jensen, K.C. , West, R.B. , 2009. Analysis of stromal signatures in the tumour microenvironment of ductal carcinoma in situ. Breast Cancer Res. Treat. [DOI] [PMC free article] [PubMed] [Google Scholar]
- Smyth, G.K. , Speed, T. , 2003. Normalization of cDNA microarray data. Methods. 31, 265–273. [DOI] [PubMed] [Google Scholar]
- Sorlie, T. , Perou, C.M. , Tibshirani, R. , Aas, T. , Geisler, S. , Johnsen, H. , Hastie, T. , Eisen, M.B. , van de Rijn, M. , Jeffrey, S.S. , Thorsen, T. , Quist, H. , Matese, J.C. , Brown, P.O. , Botstein, D. , Eystein Lonning, P. , Borresen-Dale, A.L. , 2001. Gene expression patterns of breast carcinomas distinguish tumour subclasses with clinical implications. Proc. Natl. Acad. Sci. U S A. 98, 10869–10874. [DOI] [PMC free article] [PubMed] [Google Scholar]
- Sorlie, T. , Tibshirani, R. , Parker, J. , Hastie, T. , Marron, J.S. , Nobel, A. , Deng, S. , Johnsen, H. , Pesich, R. , Geisler, S. , Demeter, J. , Perou, C.M. , Lonning, P.E. , Brown, P.O. , Borresen-Dale, A.L. , Botstein, D. , 2003. Repeated observation of breast tumour subtypes in independent gene expression data sets. Proc. Natl. Acad. Sci. U S A. 100, 8418–8423. [DOI] [PMC free article] [PubMed] [Google Scholar]
- Subramanian, A. , Tamayo, P. , Mootha, V.K. , Mukherjee, S. , Ebert, B.L. , Gillette, M.A. , Paulovich, A. , Pomeroy, S.L. , Golub, T.R. , Lander, E.S. , Mesirov, J.P. , 2005. Gene set enrichment analysis: a knowledge-based approach for interpreting genome-wide expression profiles. Proc. Natl. Acad. Sci. U S A. 102, 15545–15550. [DOI] [PMC free article] [PubMed] [Google Scholar]
- Teo, N.B. , Shoker, B.S. , Jarvis, C. , Martin, L. , Sloane, J.P. , Holcombe, C. , 2003. Angiogenesis and invasive recurrence in ductal carcinoma in situ of the breast. Eur. J. Cancer. 39, 38–44. [DOI] [PubMed] [Google Scholar]
- Tlsty, T.D. , Hein, P.W. , 2001. Know thy neighbor: stromal cells can contribute oncogenic signals. Curr. Opin. Genet. Dev. 11, 54–59. [DOI] [PubMed] [Google Scholar]
- Turley, E.A. , Veiseh, M. , Radisky, D.C. , Bissell, M.J. , 2008. Mechanisms of disease: epithelial–mesenchymal transition – does cellular plasticity fuel neoplastic progression?. Nat. Clin. Pract. Oncol. 5, 280–290. [DOI] [PMC free article] [PubMed] [Google Scholar]
- Tusher, V.G. , Tibshirani, R. , Chu, G. , 2001. Significance analysis of microarrays applied to the ionizing radiation response. Proc. Natl. Acad. Sci. U S A. 98, 5116–5121. [DOI] [PMC free article] [PubMed] [Google Scholar]
- van 't Veer, L.J. , Dai, H. , van de Vijver, M.J. , He, Y.D. , Hart, A.A. , Mao, M. , Peterse, H.L. , van der Kooy, K. , Marton, M.J. , Witteveen, A.T. , Schreiber, G.J. , Kerkhoven, R.M. , Roberts, C. , Linsley, P.S. , Bernards, R. , Friend, S.H. , 2002. Gene expression profiling predicts clinical outcome of breast cancer. Nature. 415, 530–536. [DOI] [PubMed] [Google Scholar]
- Vincent-Salomon, A. , Lucchesi, C. , Gruel, N. , Raynal, V. , Pierron, G. , Goudefroye, R. , Reyal, F. , Radvanyi, F. , Salmon, R. , Thiery, J.P. , Sastre-Garau, X. , Sigal-Zafrani, B. , Fourquet, A. , Delattre, O. , 2008. Integrated genomic and transcriptomic analysis of ductal carcinoma in situ of the breast. Clin. Cancer Res. 14, 1956–1965. [DOI] [PubMed] [Google Scholar]
- Wang, Y. , Klijn, J.G. , Zhang, Y. , Sieuwerts, A.M. , Look, M.P. , Yang, F. , Talantov, D. , Timmermans, M. , Meijer-van Gelder, M.E. , Yu, J. , Jatkoe, T. , Berns, E.M. , Atkins, D. , Foekens, J.A. , 2005. Gene-expression profiles to predict distant metastasis of lymph-node-negative primary breast cancer. Lancet. 365, 671–679. [DOI] [PubMed] [Google Scholar]
- West, R.B. , Nuyten, D.S. , Subramanian, S. , Nielsen, T.O. , Corless, C.L. , Rubin, B.P. , Montgomery, K. , Zhu, S. , Patel, R. , Hernandez-Boussard, T. , Goldblum, J.R. , Brown, P.O. , van de Vijver, M. , van de Rijn, M. , 2005. Determination of stromal signatures in breast carcinoma. PLoS Biol. 3, e187 [DOI] [PMC free article] [PubMed] [Google Scholar]
- Willipinski-Stapelfeldt, B. , Riethdorf, S. , Assmann, V. , Woelfle, U. , Rau, T. , Sauter, G. , Heukeshoven, J. , Pantel, K. , 2005. Changes in cytoskeletal protein composition indicative of an epithelial–mesenchymal transition in human micrometastatic and primary breast carcinoma cells. Clin. Cancer Res. 11, 8006–8014. [DOI] [PubMed] [Google Scholar]
- Yu, M. , Tang, Z. , Alousi, S. , Berk, R.S. , Miller, F. , Kosir, M.A. , 2007. Expression patterns of lymphangiogenic and angiogenic factors in a model of breast ductal carcinoma in situ. Am. J. Surg. 194, 594–599. [DOI] [PubMed] [Google Scholar]
Associated Data
This section collects any data citations, data availability statements, or supplementary materials included in this article.
Supplementary Materials
The following are the supplementary data related to this article:
Fig. S1. Hierarchical clustering of 740 genes showing at least 2 fold variation in expression across the whole dataset (31 DCIS, 36 invasive and 42 mixed cases). Colour coding: Diagnosis: White = normal tissue, light grey = DCIS, dark grey = invasive and black = mixed. “DCIS type” indicates the type of DCIS: type I = black, type II = grey. ER: ER‐positive = grey, ER‐negative = black. PR: PR‐positive = grey, PR‐negative = black. HER2 IHC: 1+ = grey, 2+ = dark grey, 3+ = black. HER2 CGH: amplified = black, not‐amplified = grey, missing data = white. HER2 mRNA: Black indicates high HER2 gene expression. Ki‐67: Ki‐67‐positive = black, Ki‐67‐negative = grey. EORTC/ELSTON: grade A/I = grey, grade B/II = dark grey, grade C/III = black. PAM50 represent the different “intrinsic” molecular subtypes previously identified for invasive breast cancer. Dark blue = luminal A, light blue = luminal B, purple = ERBB2+, red = basal‐like and green = normal‐like. ER, PR and Ki‐67 status determined by IHC.
Fig. S2. Hierarchical clustering of the 31 DCIS across the most variable genes (>2 fold = 605 genes). Colour coding: ER: ER‐positive = grey, ER‐negative = black. PR: PR‐positive = grey, PR‐negative = black. HER2 IHC: 1+ = grey, 2+ = dark grey, 3+ = black. HER2 CGH: amplified = black, not‐amplified = grey, missing data = white. HER2 mRNA: Dark colour represents high HER2 gene expression. Ki‐67: Ki‐67‐positive = black, Ki‐67‐negative = grey. EORTC: grade A = grey, grade B = dark grey, grade C = black. PAM50 represent the different “intrinsic” molecular subtypes previously identified for invasive breast cancer. Dark blue = luminal A, light blue = luminal B, purple = ERBB2+, red = basal‐like and green = normal‐like. Red and blue horizontal bars represent upregulated and down‐regulated genes in the DCIS type I subgroup, respectively. Genes are listed in Supplementary Table S1. ER, PR and Ki‐67 status determined by IHC.
Fig. S3. Hierarchical clustering of the 31 DCIS using the top 100 genes independent of ER, HER2 and grade identified by logistic regression. Colour coding: ER: ER‐positive = grey, ER‐negative = black. PR: PR‐positive = grey, PR‐negative = black. HER2 IHC: 1+ = grey, 2+ = dark grey, 3+ = black. HER2 CGH: amplified = black, not‐amplified = grey, missing data = white. HER2 mRNA: Dark colour represents high HER2 gene expression. Ki‐67: Ki‐67‐positive = black, Ki‐67‐negative = grey. EORTC: grade A = grey, grade B = dark grey, grade C = black. PAM50 represent the different “intrinsic” molecular subtypes previously identified for invasive breast cancer. Dark blue = luminal A, light blue = luminal B, purple = ERBB2+, red = basal‐like and green = normal‐like. ER, PR and Ki‐67 status determined by IHC.
Fig. S4A. Hierarchical clustering of 1724 genes identified by SAM between the non‐invasive‐like DCIS and IDCs (FDR < 5%). Colour coding: Diagnosis: light grey = DCIS and dark grey = invasive. “DCIS type” indicates the DCIS subgroup: type I = black, type II = grey. ER: ER‐positive = grey, ER‐negative = black. PR: PR‐positive = grey, PR‐negative = black. HER2 IHC: 1+ = grey, 2+ = dark grey, 3+ = black. HER2 CGH: amplified = black, not‐amplified = grey, missing data = white. HER2 mRNA: Black indicates high HER2 gene expression. Ki‐67: Ki‐67‐positive = black, Ki‐67‐negative = grey. EORTC/ELSTON: grade A/I = grey, grade B/II = dark grey, grade C/III = black. PAM50 represent the different “intrinsic” molecular subtypes previously identified for invasive breast cancer. Dark blue = luminal A, light blue = luminal B, purple = ERBB2+, red = basal‐like and green = normal‐like. ER, PR and Ki‐67 status determined by IHC.
Fig. S4B. Hierarchical clustering of all DCIS and IDCs in the validation dataset (Hannemann et al., 2006) using genes identified by SAM between the non‐invasive‐like DCIS and IDCs (FDR = 0%). Only 279 of the 474 genes were matched on the cDNA array platform. Colour coding: DCIS grade EORTC: light grey = well‐differentiated, grey = intermediate differentiated, black = poorly‐differentiated. Invasive grade ELSTON: light grey = well‐differentiated, grey = intermediate differentiated, black = poorly‐differentiated. HER2 and = ER: grey = positive by IHC and black = negative by IHC.
Fig. S5. Hierarchical clustering of the 31 DCIS using the 43‐gene classifier published by Hannemann et al. (2006). Colour coding: ER: ER‐positive = grey, ER‐negative = black. PR: PR‐positive = grey, PR‐negative = black. HER2 IHC: 1+ = grey, 2+ = dark grey, 3+ = black. HER2 CGH: amplified = black, not‐amplified = grey, missing data = white. HER2 mRNA: Dark colour represents high HER2 gene expression. Ki‐67: Ki‐67‐positive = black, Ki‐67‐negative = grey. EORTC: grade A = grey, grade B = dark grey, grade C = black. “DCIS type” indicates the DCIS subgroup: type I = black, type II = grey. PAM50 represent the different “intrinsic” molecular subtypes previously identified for invasive breast cancer. Dark blue = luminal A, light blue = luminal B, purple = ERBB2+, red = basal‐like and green = normal‐like. ER, PR and Ki‐67 status determined by IHC.
Fig. S6A. Hierarchical clustering of the 31 DCIS using tumour specific vascular genes published by Bhati et al. (2008) (Willipinski‐Stapelfeldt et al., 2005). (41 of the 55 genes could be matched to our array platform).
Fig. S6B. Hierarchical clustering of EMT‐related genes published by Jechlinger et al. (2003) (131 of 148 genes could be matched to our array platform). Colour coding Fig. S6A and B: ER: ER‐positive = grey, ER‐negative = black. PR: PR‐positive = grey, PR‐negative = black. HER2 IHC: 1+ = grey, 2+ = dark grey, 3+ = black. HER2 CGH: amplified = black, not‐amplified = grey, missing data = white. HER2 mRNA: Dark colour represents high HER2 gene expression. Ki‐67: Ki‐67‐positive = black, Ki‐67‐negative = grey. EORTC: grade A = grey, grade B = dark grey, grade C = black. “DCIS type” indicates the DCIS subgroup: type I = black, type II = grey. PAM50 represent the different “intrinsic” molecular subtypes previously identified for invasive breast cancer. Dark blue = luminal A, light blue = luminal B, purple = ERBB2+, red = basal‐like and green = normal‐like. ER, PR and Ki‐67 status determined by IHC.
Table S1 . Gene lists corresponding to the red and blue bars illustrated in Figure S2.
Table S2 . SAM of the DCIS type I (n = 7) vs. type II (n = 24) subgroups identified 455 genes (FDR = 0%).
Table S3 . 492 genes independent of ER, HER2 and grade identified by logistic regression to be predictive of the DCIS type I subgroup.
Table S4 . SAM of the DCIS type II (n = 24) vs. IDC (n = 36) identified 474 genes (FDR = 0%).
Table S5 . Gene sets enriched in the IDC compared to DCIS type II subgroup with FDR q‐value <0.05.
Table S6 . SAM analysis of the DCIS type I (n = 7) vs. the grade III IDC (n = 6) identified 13 genes (FDR = 0%).