

Abstract
Breast cancer is a heterogeneous disease that can be divided in subtypes based on histology, gene expression profiles as well as differences in genomic aberrations. Distinct global DNA methylation profiles have been reported in normal breast epithelial cells as well as in breast tumors. However, the influence of the tumor methylome on the previously described subgroups of breast cancer is not fully understood. Here we report the DNA methylation profiles of 80 breast tumors using a panel of 807 cancer related genes interrogating 1505 CpG sites. We identified three major clusters based on the methylation profiles; one consisting of mainly tumors of myoepithelial origin and two other clusters with tumors of predominantly luminal epithelial origin. The clusters were different with respect to estrogen receptor status, TP53 status, ErbB2 status and grade. The most significantly differentially methylated genes including HDAC1, TFF1, OGG1, BMP3, FZD9 and HOXA11 were confirmed by pyrosequencing. Gene Ontology analysis revealed enrichment for genes involved in developmental processes including homeobox domain genes (HOXA9, HOXA11, PAX6, MYBL2, ISL1 and IPF1) and (ETS1, HDAC1, CREBBP, GAS7, SPI1 and TBX1). Extensive correlation to mRNA expression was observed. Pathway analyses identified a significant association with canonical (curated) pathways such as hepatic fibrosis including genes like EGF, NGFR and TNF, dendritic cell maturation and the NF‐κB signaling pathway. Our results show that breast tumor expression subtypes harbor major epigenetic differences and tumors with similar gene expression profiles might belong to epigenetically different subtypes. Some of the transcription factors identified, with key roles in differentiation and development might play a role in inducing and maintaining the different phenotypes.
Keywords: Breast cancer, DNA methylation, Homeobox genes, TP53, Epigenetics, Molecular classification, Gene expression
1. Introduction
DNA methylation, histone modifications and other epigenetic modifications shape the chromatin topology which determines the cellular phenotype and controls its gene expression patterns (Jovanovic et al., 2010). Best studied in cancer is the aberrant DNA methylation that occurs in CpG islands in the proximity of promoters and that is considered a major mechanism for the loss of gene function (Jones and Baylin, 2007). More than one hundred genes have been shown to be either hypermethylated or hypomethylated in breast carcinomas (Hinshelwood and Clark, 2008). Gene expression analysis of breast tumors has identified different breast cancer subgroups belonging to estrogen receptor (ER) negative basal‐like and the ER positive luminal subgroups (Perou et al., 2000) with differences in outcome (Sorlie et al., 2001). DNA methylation analysis using methylation‐specific digital karyotyping of normal breast tissue has identified cell‐type and differentiation specific DNA methylation and gene expression patterns that are also found in breast carcinomas (Bloushtain‐Qimron et al., 2008).
Global DNA hypomethylation of breast tumors has been associated to stage, tumor size and tumor grade (Soares et al., 1999). Single gene studies revealed that methylation of CDH1 and BRCA1 were associated with ER status (Birgisdottir et al., 2006; Caldeira et al., 2006). Tumors with ESR1 and CDH1 methylation were also associated with significantly lower hormone receptor levels, younger age at diagnosis and the presence of mutant TP53 (Li et al., 2006). CDH1 methylation was also significantly associated with primary breast tumors with lymphovascular invasion, as well as tumors with infiltrating ductal histology, that were ER negative (Shinozaki et al., 2005). Hypermethylation of CDKN2A tended to be more frequent among ER negative cases than ER positive cases and hypermethylation of RARβ2 was inversely associated with histological and nuclear grade of breast cancer (Tao et al., 2009). A panel of 35 genes analyzed for their DNA methylation status formed two clusters which differed in function of the hormone receptor status, with RASSF1A, SOCS1 and BCL2 being the best predictors of the hormone receptor status, and PGR, TFF1 and CDH13 most significantly associated with ER status (Widschwendter et al., 2004). Methylation patterns of a panel of five genes including CDH13, MYOD1, PGR, BRCA1 and HSD17B4 were shown to be different according to ErbB2 status (Fiegl et al., 2006). Our studies on the methylation of selected genes including RASSF1A, FOXC1, ABCB1, GSTP1, RARβ2, and CDH1 suggest that methylation events occurs as early as in ductal carcinoma in situ (DCIS). In DCIS and early invasive breast cancer, FOXC1, GSTP1, ABCB1 and RASSF1A methylation were found to be associated with TP53 status and FOXC1, ABCB1, PPP2R2B and PTEN methylation to be associated to ER status (Muggerud et al., 2010). In locally advanced breast cancer patients treated with doxorubicin, methylation of GSTP1 and ABCB1 were found to be independent prognostic factors and we found DNA methylation patterns in single genes to be associated to TP53 and ER status as well as tumor expression subtypes (Dejeux et al., 2010; Ronneberg et al., 2008). A concomitant methylation status was observed for several genes although residing on different chromosomes. With this in mind we conducted a higher throughput methylation analysis approach to investigate the methylation status of 1505 CpG sites in 807 cancer related genes including tumor suppressor genes, oncogenes, genes involved in DNA repair, cell cycle control, differentiation, apoptosis, X‐linked, and imprinted genes in a series of 80 primary breast carcinomas from the Oslo Micrometastases study. The full study comprises over 900 breast cancer cases with information about presence of disseminated tumor cells (DTC), long term follow‐up for recurrence and overall survival. A subset of approximately 140 patients is represented with fresh frozen samples from the primary tumor, matched blood, and micrometastases and has been used in parallel pilot studies of (Borgen et al., 1998), whole genome mRNA expression (Naume et al., 2007), array CGH (Russnes et al., 2010), whole genome SNP and SNP‐CGH (Enerly et al., 2010), whole genome miRNA expression analyses (Enerly et al., 2010) and high throughput sequencing (Stephens et al., 2009). In this paper we report the results of one of two independent DNA methylation studies performed on this information‐rich set employing the Illumina GoldenGate array. The complementary results of a parallel study, using MOMA microarray methodology are reported in the concurrently submitted paper by Kamalakaran et al (Kamalakaran et al., 2010). The main objectives of the study were to identify 1) breast tumor sub‐classification based on methylation profiles 2) differentially methylated genes as independent prognostic markers for survival 3) differentially methylated genes associated with hormone receptor status, TP53 mutation status, ErbB2 positivity and regulation of mRNA expression in cis.
2. Results
2.1. Tumor classification based on DNA methylation and comparison to classification based on gene expression
Unsupervised hierarchical clustering grouped the tumors based on their methylation profiles in 664 cancer related genes into three major clusters (Figure. 1A). This classification was compared to the breast tumor subtypes as previously determined by gene expression profiling (Naume et al., 2007). Each tumor had been assigned to a tumor subclass based on the correlation to previously defined expression centroids (Sorlie et al., 2003). Cluster 1 (n = 27) contained 68.0% Luminal‐A tumors, 20.0% Luminal‐B tumors, and 12.0% Normal‐like tumors. Cluster 2 (n = 29) contained 41.5% ErbB2‐like tumors and 24.1% Basal‐like tumors, 17.2% Luminal‐B tumors, 10.3% Normal‐like tumors and 6.9% Luminal‐A tumors. This cluster also contained the 4 normal breast samples. Cluster 3 (n = 24) contained 69.6% Luminal‐A tumors, 17.5% Basal‐like tumors, 4.3% ErbB2‐like tumors, 4.3% Luminal‐B and 4.3% Normal‐like tumors. A strong concordance between the methylation and expression based classification was observed (Table 1A, p = 2.29 × 10‐6 and Figure. 1B), with the ErbB2 positive tumors almost exclusively found in methylation Cluster 2. Interestingly, Luminal‐A were split between Cluster 1 and 3 as well as basal‐like tumors between Cluster 2 and 3 suggesting that despite the strong concordance to the mRNA expression clusters additional information was provided by the clustering by methylation. This is illustrated by the trend that Luminal‐A tumors with different methylation profiles (Cluster 1 or 3) differ in survival (Figure. 1E; p = 0.084) (Fleischer et al., 2010). Further we have reanalyzed the association between methylation and mRNA expression clusters with the PAM50 classification (Table 1B). What one can observe is that while the number of Luminal‐A tumors is reduced by the PAM50 classification, it does not remove the split of the Luminal‐A cases between Cluster 1 and Cluster 2. The difference in survival is also observable, yet not significant due to low number of samples in each group (results not shown). A subsequent validation of the clustering by an absolute quantitative methylation analysis by pyrosequencing (see below) recapitulated the observed classification and its association to expression subclasses (Figure. 1G). All normal samples examined here showed low variability and clustered together (Figure. 1).
Figure 1.

Hierarchical clustering by DNA methylation. (A) Hierarchical clustering of 80 breast tumors and 4 normal breast tissue samples using 1016 CpG sites in 664 genes. DNA methylation separates the tumors in 3 major clusters. (B) Primary tumor characteristics are indicted: tumor subclass: Dark blue (Luminal‐A), light blue (Luminal‐B), pink (ErbB2‐like), red (Basal‐like), green/teal (Normal‐like), white (not classified); nodal status: node negative (white), node positive (black); histological grade: grade 1 (white), grade 2 (grey), grade 3 (black); estrogen receptor status: ER negative (white), ER positive (black); ErbB2 status: negative (white), positive (black); TP53 mutation status: wild type (white), mutated (black); Disseminated tumor cell (DTC) status: white (negative), black (positive). (C) Nodes of CpG sites with high nodal correlation that are differentially methylated within the clusters. High degree of methylation (red), low degree of methylation (green). The first node (blue bar) is highly methylated in Cluster 1. The second node (red bar) is highly methylated in Cluster 2. (D) Overall survival for all 80 patients divided between the three array based methylation clusters. (E) Overall survival of only the luminal‐A tumors belonging to either methylation Cluster 1 or 3. (F) Hierarchical cluster showing all genes. (G) Hierarchical clustering was recapitulated with pyrosequencing methylation analysis of 27 validated genes in 120 patients (a subset of the same 84 samples shown in figure). The colour of the branches corresponds to where the sample belonged in the original clusters. Samples that fell into different clusters dependent on the method are also marked with an asterisk (∗). Tumor subclass is indicated below the tree: Dark blue (Luminal‐A), light blue (Luminal‐B), pink (ErbB2‐like), red (Basal‐like), green/teal (Normal‐like). (H) Overall survival for all 80 patients divided between the three clusters based on methylation analyses by pyrosequencing.
Table 1.
Distribution of the breast tumor subtypes between the methylation clusters for both the (A) intrinsic gene list classifier and the (B) PAM50 gene list classifier. P‐value is determined by chi‐square test.
| Cluster 1 | Cluster 2 | Cluster 3 | Total | |
|---|---|---|---|---|
| A | ||||
| Luminal‐A | 17 | 2 | 16 | 35 |
| Luminal‐B | 5 | 5 | 1 | 11 |
| ErbB2‐like | 0 | 12 | 1 | 13 |
| Basal‐like | 0 | 7 | 4 | 11 |
| Normal‐like | 3 | 3 | 1 | 7 |
| Unclassified | 2 | 0 | 1 | 3 |
| Total | 27 | 29 | 24 | 80 |
| p‐value 2.29E–06 | ||||
| B | ||||
| Luminal‐A | 10 | 1 | 8 | 19 |
| Luminal‐B | 12 | 0 | 5 | 17 |
| ErbB2‐like | 2 | 8 | 2 | 12 |
| Basal‐like | 0 | 14 | 4 | 18 |
| Normal‐like | 1 | 3 | 2 | 6 |
| Unclassified | 2 | 3 | 3 | 8 |
| Total | 27 | 29 | 24 | 80 |
| p‐value 1.85E–06. | ||||
2.2. Survival analysis
Kaplan–Meier analyses revealed a significant difference for a number of single genes (listed in Supplementary Table 1). Since we observed concomitant methylation of a large number of apparently unrelated genes it might be arbitrary which genes will display strongest effect on survival when analyzed individually in each studied patient material. We therefore considered it as more appropriate to apply a weighted approach to all genes in a multiple regression model with correlated predictors indicating how well the entire set predicts the outcome variable. Therefore the entire sets and not single genes were used to perform both unsupervised (Figure. 1D, E and H) and supervised (Figure. 2) survival analysis to examine the potential differences in overall survival (OS) for the different clusters of patients.
Figure 2.
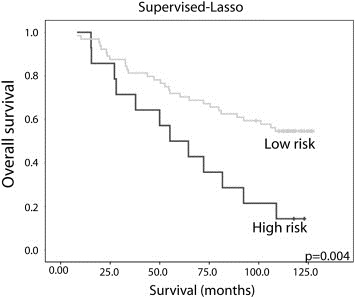
Kaplan–Meyer plots for the high and low risk patient clusters defined by supervised LASSO regression on weighted clustering of the genes.
For clusters based both on all genes and 27 genes analyzed by pyrosequencing, survival analyses show a trend for Cluster 2 to have shorter survival compared to the other clusters (Figure. 1D and H) (Fleischer et al., 2010). Including a supervised approach using a family of penalties according to the LASSO method we computed Cox regression coefficients from LASSO. Using this method we could identify a list that collectively influences overall survival (Supplementary Table 2). Then we applied a weighted clustering of these coefficients to divide the patients into “high risk” and “low risk” patient groups. Thus we identified clusters of genes the methylation of which could collectively be associated with differences in survival (Figure. 2).
Multivariate survival analysis was performed to study the influence of known survival factors such as ER, TP53 mutation, lymph node status, grade and tumor size on the observed survival differences in both breast cancer specific death and relapse free survival in the three methylation clusters as well as for the two clusters obtained by Ridge and LASSO. The analyses show that the Hazard ratios for the methylation clusters are influenced by TP53 and ER status as well as grade (which is the only independent marker in this analysis). ErbB2 and tumor size did not change the coefficients of the cluster markers meaning that the observed differences in survival are not influenced by ErbB2 and size (results not shown).
2.3. Identification of differentially methylated genes between the clusters
The two most notable cluster nodes with apparent differences in methylation profiles are shown in Figure. 1C. The first node (node correlation = 0.56, illustrated at the upper panel in Figure. 1C and blue vertical bar on Figure. 1F) consists of 36 CpG sites with higher methylation in methylation Cluster 1. The second node (node correlation = 0.53, lower panel Figure. 1C and red vertical bar on Figure. 1F) containing 44 CpG sites is characterized by higher methylation in Cluster 2 compared to Cluster 1 and Cluster 3. To identify all genes accounting for the epigenetic differences between the clusters we performed multiclass SAM on the 3 major clusters. The analysis revealed 265 CpG sites representing 211 different Entrez GeneIDs to be differentially methylated between the three clusters. The 10 CpG sites in 8 genes with the highest score included CpGs in the promoter regions of WNT1, ASCL2, LYN, IRAK and ETS1 and the first exon of COL1A2, SFRP1, LAT. Gene family members were differentially methylated between the clusters such as HOX family members HOXA5 and HOXA11, as well as other members of the wingless family such as WNT10B and WNT2. These CpG sites were all hypomethylated in Cluster 2 and Cluster 3 compared to Cluster 1. The full list of genes differentially methylated between the clusters is given in Supplementary Table 3. All genes (n = 123) with FDR <5% at SAM list of most differentially methylated and unique, i.e. associated only to methylation class were subjected to GO and pathway analysis .We performed a GO term analysis using the differentially methylated genes between the clusters identifying 15 different significantly enriched GO terms (Supplementary Table 4). These terms included processes related to extracellular matrix, membranes and collagen. Other processes were related to developmental, neurological and multiorganismal processes as well as ion transport and protein secretion. A pathway analysis of a subset of 141 CpG islands representing 123 Entrez GeneIDs uniquely linked to the methylation clusters, i.e. associated only to methylation status and not to TP53 mutation or ER status, identified a significant association with canonical (curated) pathways such as hepatic fibrosis/hepatic stellate cell activation, dendritic cell maturation and the NF‐κB signaling pathway (the five most significantly associated canonical pathways are included in Supplementary Table 5A).
2.4. Correlation to mRNA expression in cis
2.4.1. Spearman correlation
First we matched the exact gene names from the methylation (Illumina) and mRNA expression (Agilent) arrays through the Accession code/UID on each array. Like this matching pairs were identified for 807 CpGs that were individually associated in cis to one of the 537 unique reference genes present on the array. We then correlated the estimated methylation percentages (β‐values) of these 807 CpG sites (using both promoter and exonic CpGs). The individual Spearman correlation for each CpG transcript pair was calculated and was in a normal‐like distribution around zero (Supplementary Figure. 1A). Plotting the p‐values for these correlations against their correlation values also yielded a normal‐like distribution around zero but with a tail towards negative correlations with low p‐values (Supplementary Figure. 1B). Using a false discovery rate (FDR) threshold of 5% we identified a list 20 CpG transcript pairs where 18 of these showed a strong negative correlation. The full list of all associations is given in (Supplementary Table 6A).
2.4.2. eQTL analysis
Correlation analyses of the exact matching CpG‐methylation pairs would reveal only the dependencies between changes in expression and methylation in the same gene. We therefore performed a more broad analysis in cis, where we allowed a CpG‐ to be with a maximum distance of 1 mega base from a transcript, resulting in an input file of 1324 CpG sites and 665 transcripts. The eQTL analysis revealed a total of 4676 significant hits (p ≤ 0.05) (Figure. 3A). The p‐value density plot displayed an overrepresentation of p‐values below the nominal p‐value threshold (Figure. 3B), with the best p‐value (p = 1.9 × 10⁻⁸) being for a CpG site in the BCR gene (Breakpoint Cluster Region gene) whose methylation pattern associated with the mRNA expression level of several immunoglobulin genes residing in close proximity to the CpG site. The eQTL results visualized as a scatter plot with location of CpG cites on the X‐axis and transcript location on the Y‐axis (sorted by genomic position) are given in Figure. 3C. Different levels of significance are plotted using different colors. Figure. 3D gives the number of CpG sites linked to each transcript in cis. The hotspot threshold (the dotted line) is set at > 10 transcripts, and the CpG sites are sorted by their genomic location. Since 1 mega base can be too liberal window of analysis we further restricted the analysis to the significant cis associations whose CpG transcript pairs matched by their HUGO gene symbol and identified 226 significant hits in 157 different genes (Supplementary Table 6B). A single CpG site could be found to maximum associate with the expression of 4 different probes from the same transcript all coding for the same immune related gene, HFE. For a single transcript, the highest number of association to different methylation sites was seen for RUNX3 and P2RX7 gene (3 CpG sites each).
Figure 3.
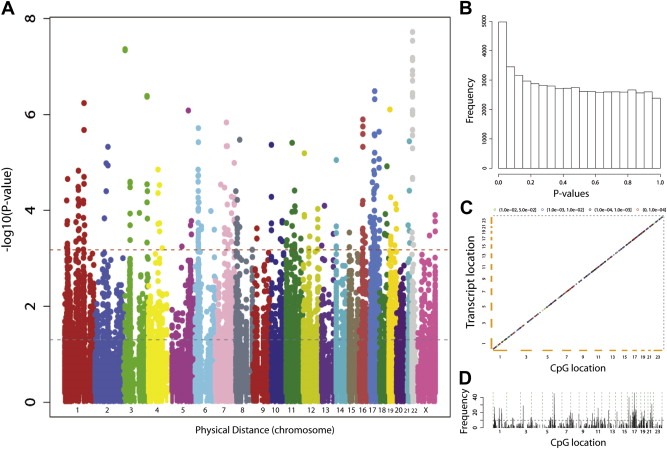
(A) Manhattan plot displaying the genome‐wide result of the linear regression assaying the association between methylation and mRNA expression in cis. The x‐axis displays the location of CpGs sites sorted by chromosomal position, and y‐axis gives the negative log10 p‐value. While the grey dotted line denotes the nominal p‐value threshold, the red dotted lines indicates the Bonferroni threshold. A total of 4676 significant associations (p‐value ≤ 0.05) in cis (by position) were observed. The grey dotted peak on chromosome 22 is the CpG probe residing in the breakpoint cluster region gene (BCR), associated with the expression of several immunoglobulin genes residing in close proximity to the CpG site. On chromosome 6 the light blue peak represent two CpGs site in DDR1 and LY6G6E, located in the major histocompatibility complex (MHC) class III region, whose methylation pattern associate with expression of several surrounding genes, including members of the HLA family. The rusty red peak on chromosome 16p is caused by the association with methylation of PRSS8 and expression of several integrins including ITGAD, ITGAL, ITGAM and ITGAX. The blue peak on chromosome 17q is for a CpG site in CSF3 whose methylation level significantly correlate with the expression of several genes in the ErbB2 amplicon including ERBB2 and GRB7 (CSF3 is commonly amplified together with ErbB2 amplification). (B) The p‐value distribution of the linear regression analysis, demonstrating an overrepresentation of p‐values below the nominal p‐value threshold. (C) eQTL results visualized as a scatter plot with location of CpG cites on the x‐axis and transcript location on the y‐axis (sorted by genomic position). Different levels of significance are plotted using different colors. (D) The number of CpG sites linked to each transcript in cis. The hotspot threshold (the dotted line) is set at > 10 transcripts, and the CpG sites are sorted by their genomic location.
2.5. Primary tumor characteristics, disseminated tumor cell (DTC) status and nodal status in relation to methylation clusters
We compared the methylation based clusters to the corresponding primary tumor characteristics as well as presence of DTC and nodal status. Cluster 1 and Cluster 2 were significantly different when comparing the distribution of grade 3 tumors (vs. grade 1 and grade 2 tumors combined) (p = 0.0009). No difference was seen between Cluster 2 and Cluster 3 with respect to grade. Significant differences in the distribution of ER and ErbB2 were identified in analogy to what is known for the mRNA based classification with Cluster 1 containing more estrogen receptor positive tumors when comparing to Cluster 2 (p = 1.0 × 10⁻⁵) and Cluster 3 (p = 0.0068) (Figure. 1B and Table 2). TP53 mutation status was significantly different between methylation Cluster 1 and Cluster 2 (p = 0.005) but not between the Cluster 1 and Cluster 3 (p = 0.34) and Cluster 2 and Cluster 3 (p = 0.097). No difference in DTC status or nodal status was seen between the clusters.
Table 2.
Associations of primary tumor characteristics and the different tumor subtypes. Asterisks indicate from which Fisher Exacts test the p‐value is derived.
| Cluster 1 | Cluster 2 | Cluster 3 | p‐value | |
|---|---|---|---|---|
| TP53 status | ||||
| WT | 22∗∗ | 12∗∗ | 17 | |
| MT | 5∗∗ | 16∗∗ | 8 | p = 0.0051∗∗ |
| ErbB2 status | ||||
| Neg | 20∗∗ | 15∗∗ | 19 | |
| Pos | 2∗∗ | 10∗∗ | 3 | p = 0.040∗∗ |
| ER status | ||||
| Neg | 2∗∗/∗ | 18∗∗ | 10∗ | |
| Pos | 25∗∗/∗ | 9∗∗ | 14∗ | p = 1.0 × 10‐5∗∗/p = 0.0068∗ |
| Grade | ||||
| 1 + 2 | 22∗∗ | 10∗∗ | 14 | |
| 3 | 5∗∗ | 18∗∗ | 8 | p = 9.1 × 10‐4∗∗ |
2.6. Methylation profiling in relation to estrogen receptor status and TP53 mutation status
SAM analysis was performed dividing the tumors into groups based on their ER status and TP53 mutation status. A total of 109 CpG sites (in 85 unique Entrez GeneIDs) were differentially methylated between TP53 mutated and TP53 wild type tumors at FDR 5%. The CpG sites with the highest scores included the promoter CpG sites of HDAC1, PROM1, TMEFF1, TWIST, CCL3, CCNA1, OSM, TRIM29 and MFAP4 as well as the first exon of SLC14A1. These CpG sites were all hypomethylated in tumors with mutations in TP53. There were also 5 CpG sites that were significantly hypermethylated in TP53 mutated tumors including the promoter CpGs in EPHX1, P2RX7, RARA and SPI1 as well as the CpG site in the first exon of THPO. The full list of CpG sites is given in Supplementary Table 7. The GO terms extracted from the TP53 list contained many processes related to transcription, transcription factor activity and DNA binding as well as receptor binding. Similar to the terms related to the clusters this list also contained terms related to developmental processes, multiorganismal processes and ion transport (Supplementary Table 8). Pathway analysis of 25 genes representing 26 CpG islands unique to the TP53 list, i.e. associated only to TP53 mutation status (Figure. 4) revealed a significant association with the canonical (curated) pathway hepatic fibrosis/hepatic stellate cell activation, GM‐CSF signaling and TGF‐β signaling (the five most significantly associated canonical pathways are included in Supplementary Table 5B).
Figure 4.

Venn diagram showing the comparison between the methylation clusters (multiclass list), TP53 mutation and ER status with number of overlapping CpG sites as obtained from the SAM analysis at FDR 5%. Within each circle we find illustrated the top 5 canonical pathways significantly overrepresented in the list of CpG islands unique to the methylation cluster, ER and TP53 list respectively.
A total of 171 CpG sites representing 151 Entrez GeneIDs were differentially methylated between estrogen positive and negative tumors at FDR 5%. The 10 CpG sites with the highest score included the CpG sites in the promoter region of STAT5A, WNT1, DAPK1, ALPL, IFNGR2, IGFBP7, ST6GAL1 and TMEFF1 as well as CpG sites in the first exon of FZD9 and RASSF1. These CpG sites were all hypermethylated in ER positive tumors compared to ER negative tumors. There were also CpG sites in P2RX7, SPI1 and LMTK2 (one per gene) that were hypomethylated in ER negative tumors. The full list of CpG sites differentially methylated between ER negative versus ER positive tumors is given in Supplementary Table 9. The ER list was significantly enriched in GO processes related to the extracellular matrix, cell cycle arrest, transcription factor activity and DNA binding as well as processes related to development (Supplementary Table 10). A unique subset of the ER list containing 51 CpG islands representing 50 genes (Figure. 4) associated only to ER status (and not TP53 mutation or methylation class) revealed in pathway analysis a significant association to canonical pathways such as VDR/RXR activation, acting cytoskeleton signaling and macropinocytosis signaling (for the five most significantly associated canonical pathways see Supplementary Table 5C).
2.7. Combined analyses of differentially methylated genes common to both multiclass, ER and TP53 related SAM lists
Given the significantly different distribution of TP53 and ER status in the three methylation subclasses described above we observed a not unexpected extensive overlap in the SAM lists derived from the comparison between the methylation clusters (multiclass list), TP53 mutation and ER status with 53 CpG sites being found on all three lists at FDR 5% (Figure. 4). At FDR 5% we could also identify CpG sites that were common between the multiclass list, and the TP53 or ER list (16 and 53 CpG sites, respectively).
A combined GO analysis using only the 53 unique overlapping Entrez GeneIDs that were common to all three (multiclass, ER and TP53 related) SAM analysis was performed (Figure. 4). This analysis revealed enrichment of processes related to development and differentiation only (Table 3A). There was a substantial overlap in these developmental and differentiation gene lists where 60% of the genes being represented in 4 of the 6 GO terms. If genes appearing in at least two of the gene lists (Figure. 4, n = 124) were used in GO term analysis, the most significantly enriched biological process was related to the term developmental processes (Table 3B). Several other terms related to multicellular or skeletal development as well as cell differentiation were also significantly enriched as well as terms related to the cellular component category including the terms collagen and extracellular matrix. Two terms related to molecular function were also significantly enriched, notably transcription factor activity and sequence specific DNA binding. Of the 20 genes related to transcription factor activity (also present in the GO term developmental process) 6 were homeobox domain genes namely, HOXA9, HOXA11, PAX6, MYBL2, ISL1 and IPF1. Several other transcription factors with important functions in differentiation or developmental processes could be identified including ETS1, HDAC1, CREBBP, GAS7, SPI1 and TBX1. 10 of the transcription factors are known Suz12 targets in ES stem cells (ISL1, CEBPA, HOXA11, IPF1, HOXA9, RUNX3, ERG, RARA, TBX1 and PAX6) (Huang et al., 2009). We performed a t‐test comparison between the RNA expression of some of these transcription factors in the different methylation clusters. The results for some genes are illustrated in Supplementary Figure. 1C. RUNX3, ISL1 and RARA were significantly differentially expressed between the clusters with high expression of ISL1 and RUNX3 in the Cluster 2 whereas RARA exhibited higher expression in Cluster 1 and Cluster 2 (Supplementary Figure. 1C).
Table 3.
GO terms significantly enriched (A) for the 53 genes that were common for the 3 different SAM analysis performed and (B) for the 124 genes that where overlapping in the Multiclass analysis and ER and TP53 analysis.
| Category | Term | Count | p‐value | Fold Enrichment |
|---|---|---|---|---|
| A | ||||
| GOTERM_BP_ALL | GO:0007275∼multicellular organismal development | 31 | 0.005 | 1.46 |
| GOTERM_BP_ALL | GO:0032502∼developmental process | 36 | 0.007 | 1.34 |
| GOTERM_BP_ALL | GO:0032501∼multicellular organismal process | 34 | 0.014 | 1.32 |
| GOTERM_BP_ALL | GO:0030154∼cell differentiation | 25 | 0.021 | 1.45 |
| GOTERM_BP_ALL | GO:0051179∼localization | 20 | 0.029 | 1.54 |
| GOTERM_BP_ALL | GO:0048731∼system development | 25 | 0.046 | 1.36 |
| B | ||||
| GOTERM_BP_ALL | GO:0032502∼developmental process | 72 | 0.005 | 1.22 |
| GOTERM_BP_ALL | GO:0007275∼multicellular organismal development | 58 | 0.014 | 1.25 |
| GOTERM_CC_ALL | GO:0044420∼extracellular matrix part | 7 | 0.017 | 3.06 |
| GOTERM_MF_ALL | GO:0003700∼transcription factor activity | 20 | 0.020 | 1.65 |
| GOTERM_MF_ALL | GO:0043565∼sequence‐specific DNA binding | 14 | 0.022 | 1.89 |
| GOTERM_BP_ALL | GO:0001501∼skeletal development | 13 | 0.031 | 1.87 |
| GOTERM_BP_ALL | GO:0032501∼multicellular organismal process | 66 | 0.032 | 1.17 |
| GOTERM_CC_ALL | GO:0005581∼collagen | 4 | 0.034 | 4.95 |
| GOTERM_BP_ALL | GO:0030154∼cell differentiation | 47 | 0.036 | 1.25 |
| GOTERM_CC_ALL | GO:0031012∼extracellular matrix | 13 | 0.043 | 1.79 |
2.8. Chromosome wide islands of methylation
The correlation between the degree of methylation in all studied CpG islands was calculated and a heatmap of the correlation coefficients is shown in Figure. 5. Although the array did include only selected genes related to carcinogenesis one can observe concomitant methylation of different loci on different chromosomes, as well as clustered in particular loci.
Figure 5.

Genome wide correlation in methylation sorted by chromosomal position. Blue indicates no correlation, green low and red complete correlation as determined using Spearman's rho statistic. The overall correlation in methylation between CpG sites is low, with notable exceptions being clusters of co‐methylated loci on chromosome 5, 7, 8, 11, 12, 16 and X.
2.9. Validation of array based methylation analysis by pyrosequencing
In order to confirm the findings from the Illumina GoldenGate microarray study we designed a validation assay both to obtain more quantitative data and to increase sample size. A total of 120 samples (including the 80 cases and 4 controls analyzed by microarray) were used to re‐analyze by pyrosequencing 27 genes chosen from the array results because they were differentially methylated according to clusters, ER/PR status or survival. The overall clustering was recapitulated as shown above (Figure. 1G). For each gene, association analyses were done comparing methylation levels between different categories within clinical parameters. The genes (15) that were differentially methylated and contributed most significantly to the formation of methylation clusters assessed by array showed associations to mRNA subclasses and histological grade when analyzed by pyrosequencing as well (Table 4). The validation of the clustering by this absolute quantitative methylation analysis by pyrosequencing of only 27 genes recapitulated the observed classification and its association to expression subclasses (Figure. 1G). Direct correlation between pyrosequencing and Illumina GoldenGate was performed and all genes were significantly correlated with a correlation r ranging from 0.6 to 0.8 (Figure. 6) except for IL8 where poor correlation was observed. For this gene we discovered an SNP underlying the primer. A significant negative correlation was obtained when comparing levels of DNA methylation with levels of mRNA expression for all genes (R < −0.216, p < 0.027) except BMP3 (R = 0.14, p = 0.027).
Table 4.
Validation by pyrosequencing: genes (15) that were differentially methylated and contributed significantly to the formation of methylation clusters assessed by Golden Gate array were reanalyzed in a larger dataset by pyrosequencing. The association to mRNA expression derived classes and grade was confirmed. Kruskal–Wallis H test was used to determine the statistical significance.
| Subtypes (mRNA expression) | Histological grade | |
|---|---|---|
| p‐value | ||
| BMP3 | 0.000 | 0.002 |
| GUCY2D | 0.000 | 0.001 |
| GUCY2F | 0.000 | 0.148 |
| HDAC1 | 0.000 | 0.000 |
| OGG1 | 0.000 | 0.000 |
| TFF1 | 0.000 | 0.000 |
| ASCL2 | 0.326 | 0.344 |
| HOXA11 | 0.000 | 0.000 |
| IGFBP7 | 0.000 | 0.003 |
| LYN | 0.000 | 0.000 |
| ROR2 | 0.009 | 0.102 |
| HCK | 0.101 | 0.000 |
| BCAP31 | 0.000 | 0.000 |
| FZD9 | 0.000 | 0.001 |
| ST6GAL1 | 0.000 | 0.000 |
Figure 6.
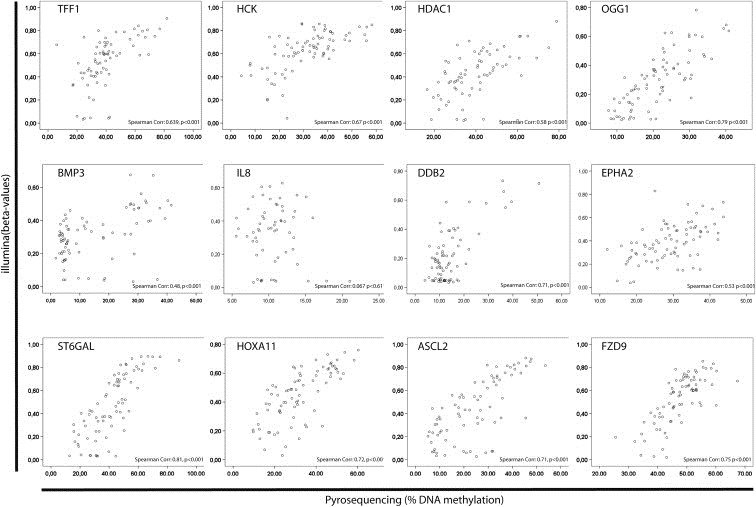
Scatter plots of the correlation between the Illumina data and the pyrosequencing data for 12 of the 27 genes selected for validation.
3. Discussion
Gene expression analysis of breast tumors has identified different breast cancer subgroups (Perou et al., 2000) that display differences in outcome (Sorlie et al., 2001). DNA methylation analysis of 1505 CpG islands in a panel of 807 cancer related genes performed here shows that breast tumors have different epigenetic profiles that relate to those previously identified by gene expression subgroups of breast cancer but might yield additional information. The same result was obtained by another independent DNA methylation study of this material despite a different methodology (MOMA, exploiting MspI represented CpG islands on Nimblegene arrays) resulting in 600 features summarizing the top 500 most differentially methylated loci in the breast cancer dataset as well as the top 100 breast cancer methylation loci most different from normal breast from previous studies (Kamalakaran et al., 2010). The cluster with the majority of Luminal‐tumors (Cluster 1) and that of Basal‐like and ErbB2‐like tumors (Cluster 2) are significantly different when it comes to traditional phenotypic characteristics such as TP53 and estrogen receptor status (ER). In Cluster 3 however all the molecular subtypes are present but Luminal‐A‐like tumors are in majority. This cluster is not significantly different from the two other clusters when it comes to TP53 mutation status but contains slightly more ER positive tumors than Cluster 2. Also Grade 3 tumor distribution was significantly different between Cluster 1 and Cluster 2 with Cluster 2 containing the majority of grade 3 tumors. SAM analysis identified a large number of CpG sites that were differentially methylated between the clusters including CpG sites in the WNT pathway in genes such as WNT1, ASCL2, LYN, IRAK and ETS1 and the first exon of COL1A2, SFRP1, LAT. RASSF1 (Ras association domain family 1 isoform D) and retinoic receptors were other genes strongly associated to methylation clusters as well as ER status in this study. RASSF1A and RARβ2 hypermethylation have previously been found to be significantly more frequent in ER positive and human ErbB2 tumors. Frequent DNA methylation in RARβ2, CDH1, ESR1, BRCA1, CCND2, CDKN2A and TWIST tumors was more often found in poorly differentiated breast cancers (Chow et al., 2005). In agreement we observed differential methylation for RARβ2, CCND2 and TWIST between the methylation classes, which also had different distribution of grade 3.
We and others (Holm et al. (Holm et al., 2010) Bediaga et al. (Bediaga et al., 2010) and Fleischer et al. (Fleischer et al., 2010)) recently published a similar classification of breast cancer by DNA methylation. Holm et al. also identify three methylation clusters with different survival although the ErbB2 group seems less defined. Similarly to our study, targets of the polycomb repressor genes are found methylated. Our analysis provides in addition methylation profiles associated with TP53 mutation status and ER status per se and identify possible targeted pathways. Given that we demonstrate methylation patterns associated to given types of mutations, the differences to the study of Flanagan et al. (Flanagan et al., 2010) focuses on familial cancers carriers of BRCA1 and BRCA2 mutations are not unexpected. Furthermore we performed association of methylation clusters to mRNA classification by both “intrinsic” gene list and Pam50. What one can observe is that while the number of Luminal‐A tumors is indeed reduced, it does not remove the split of the Luminal‐A cases between Cluster 1 and Cluster 2. The difference in survival is also observable, yet not significant due to low number of samples in each group. The most profound effect the choice of mRNA classification had was on the distribution of the luminal‐B cases between the clusters. When using the intrinsic gene classification, the Luminal‐B cases were equally distributed between Cluster 1 and 2 and very few in Cluster 3, while with the Pam50 classification they were exclusively in Cluster 1 and 3 and the difference in survival was again observable. Whether this difference in reclassification carries a biological meaning remains to be seen.
The distribution of the breast tumor subclasses in epigenetically distinct subpopulations has also been shown by grouping of tumors according to different histone modifications in breast cancer (Elsheikh et al., 2009) as breast tumors were grouped into 3 clusters based on their levels of histone modifications. The distribution of the breast tumor subclasses in their study is very similar to what we here observe when clustering the tumors based on their DNA methylation profile suggesting that differences in chromatin modifications between the clusters is mirrored in the DNA methylation profiles of breast cancer. This report of global histone modifications revealed differences between luminal‐like and Basal/ErbB2‐like tumors. Global histone acetylation and methylation was associated with Luminal‐A‐like tumors and low levels of lysine acetylation, lysine methylation were associated to basal carcinomas and ErbB2 positive tumors. Since Elsheikh et al. also identified associations between histone modifications and traditional markers such as estrogen receptor status, ErbB2 status and TP53 receptor status and grade (Elsheikh et al., 2009) one may hypothesize that the epigenetic changes are in a strong interplay between these markers. It remains of interest to identify the concordance between the methylation profiles and histone modification profiles in terms of profiling of breast cancer.
Genome‐wide DNA methylation analysis using methylation‐specific digital karyotyping of normal breast tissue has identified cell‐type and differentiation specific DNA methylation and gene expression patterns that are also found in breast carcinomas. CD44 + cells express genes with known stem cell‐function and are hypomethylated compared to the more differentiated CD24 + cells. Most recently, the existence of three distinct populations of breast stem cells with putative carcinogenic potential has been described: ER positive, luminal type, which can give rise to only luminal types of cells, ER negative, resulting in basal type and mixed, ER positive with the potential to develop into ER negative type (Park et al., 2010, 2010). Interestingly, based on the profiling of differentially methylated genes, many of which with key functions in development, we also observe 3 clusters of methylation, which according to gene expression resemble these three stem cell types, luminal, basal and mixed. Methylation profiling of stem cell components is required to confirm this hypothesis. It is noteworthy that the normal samples examined here showed low variability and clustered together with the basal‐like tumors. This observation deserves further studies of the nature of the methylation profile in normal breast tissues.
We show here that the different subtypes of breast cancer have a different underlying biology reflected in both methylation and mRNA expression patterns and is strongly influenced by TP53 mutation and ER status. Associations between DNA methylation levels of candidate genes and the status of well known tumor characteristics such as estrogen receptor status and TP53 mutation status has been reported by our group (Dejeux et al., 2010; Ronneberg et al., 2008) and others. We here report a large number of CpG sites in different genes that are differentially methylated in tumors with different ER and TP53 mutation status. It has proven difficult to disentangle the ER and TP53 dependent determinants of breast cancer profiles based on mRNA expression, since there has been a large number of overlapping genes, whose expression correlates to both ER expression and TP53 mutation status. In this study TP53 mutation and ER status shared a large number of genes in common with the methylation sub‐classification, suggesting that both molecular factors contribute to the methylation profile by distinct molecular pathways. This was also confirmed by the GO analysis with the ER association being explained through methylated genes involved in extracellular matrix and cell‐to‐cell communication, while the TP53 association being mediated by methylated genes involved in transcriptional regulation and growth factors. Whether TP53 mutation and ER status are directly regulating gene expression patterns in the tumors or if they are conferring their effects through a methylation phenotype, remains to be elucidated. We have previously shown on the example of the GSTP1 promoter that the activity of a promoter by actively binding transcription factors (Myb) is inversely correlated to the degree of methylation in an ER status dependent manner (Ronneberg et al., 2008). This may also be the case for other genes under ER and TP53 regulation. Despite these interdependencies, we have demonstrated that methylation of certain genes (GSTP1, ABCB1) can be independent prognostic factors (Dejeux et al., 2010).
In this study as well as in the parallel analysis of Kamalakaran et al. (Kamalakaran et al., 2010) we have expanded the list of genes whose methylation profile can be used as a factor of survival. The genes from both studies need to be confirmed in different patient data setswith different treatment regimens. Our previous analyses (Dejeux et al., 2010; Ronneberg et al., 2008) suggest that in locally advanced breast cancer patients treated with doxorubicin, methylation of GSTP1 and ABCB1 was associated to survival possibly via treatment response since both GSTP1 and ABCB1 have direct effect on the therapeutic dose of the drug. Therefore on the background of a vast concomitant methylation of functionally and topologically unrelated genes, the question of which methylation gene profiles are of predictive and which of prognostic value needs to be addressed by studies specifically designed for this purpose.
Since both whole genome expression and methylation data was available for this dataset we examined the impact of differential DNA methylation on gene expression by correlation and linear regression analysis. Worth noting is the in cis association between degree of methylation of the breast cancer risk gene FGFR2 and its expression (p = 0.035, Supplementary Table S4). FGFR2 has been identified from genome‐wide association studies to be a breast cancer susceptibility gene (Easton et al., 2007; Hunter et al., 2007) and an SNP in its promoter has previously been reported associated with expression in cis (Nordgard et al., 2007). Also, expression of CyclinD1 on chromosome 11q, targeted by 2 different expression probes, was found significantly associated with the methylation level in cis (p = 0.028 and p = 0.029, respectively). The Spearman correlation analysis revealed most notably a significant association of DNA methylation to expression for KRT5, ELK1, GSTP1, TFF2, C4B, CCNE1, NRG1, SEMA3C which are also present on the “intrinsic” gene list initially reported as discriminating between breast cancer subtypes by gene expression according to Perou et al. (Perou et al., 2000). When comparing the list from the SAM analysis identifying the genes most strongly differentiating between the methylation classes at FDR 5% (the multiclass 265 SAM list) with the genes for which methylation and expression were found significantly associated by the eQTL analysis (the 226 gene list based on HUGO symbols), we identified 60 genes (more than one third of the list) to be both associated with expression and defining the methylation clusters. Further, the following 11 genes from the multiclass 265 SAM list are on the 561 intrinsic list defining the expression clusters: SGCE, NRG1, LOX, KIT, GSTP1, GSTM2, GSTM1, GRB7, FLT1, CCND1, ACTG2. Of these KIT, GSTP1, GSTM2, CCND1 and ACTG2 are also on the eQTL list. Furthermore at least 38 unique genes were inversely associated to expression in both our and the Kamalakaran et al study that uses MOMA (Kamalakaran et al., 2010) (Supplementary Table S11) which allows us to conclude that DNA methylation must be an important factor of gene silencing for at least these genes. All these overlaps suggest that the large degree of concordance between the two classifications based on mRNA expression or DNA methylation is not surprising and provides a potential mechanism for the differential gene expression in breast cancer.
The correlation in methylation of CDH1 and BRCA1 and estrogen receptor status (Birgisdottir et al., 2006; Caldeira et al., 2006) has been reported previously and we report here a similar result for ESR1 and CDH1 (rho = 0.45), but not for BRCA1. Also, methylation patterns of BRCA1, ESR1 and CDH1 have been shown to differentiate depending on ErbB2 status, and our data implies a correlation in methylation of CDH1 with amplification of ErbB2 with (rho = 0.43), but not with ESR1 or BRCA1. Similarly, despite their presence on the array, none of the previously defined genes predicting ER status by Widschwendter et al (Widschwendter et al., 2004) was found to differentiate ER positive from ER negative cells in our study using stringent controls for multiple testing. Members of the tumor necrosis factor receptor superfamily on chromosome 8p21.3 (TNFRSF10C, TNFRSF10D and TNFRSF10A) displayed a correlated methylation pattern, and methylation of TNFRSF10C was found associated with expression in cis. TNFRSF10C expression has previously been reported elevated in normal tissues as opposed to tumor cell lines (Sheridan et al., 1997).
Pathway analysis permitted to identify specific pathways to be differentially activated in the methylation clusters and/or in function of the TP53 mutation and the ER status. These results should be interpreted with caution since they were obtained on the background of already selected genes. However within this selection of genes the differences were still significant. One of the pathways that differed between the methylation clusters was NF‐kB signaling. NF‐kB – a complex of inducible transcription factors – promotes pro‐inflammation, pro‐angiogenesis, cell adhesion and migration through up‐regulation of the corresponding pathways and is critical for the normal development of the mammary gland (Cao and Karin, 2003). The constitutive activation of NF‐κb has been shown to be required for the transition from hormone dependent to hormone independent cancer growth (Nakshatri et al., 1997), but recent results also indicate a synergistic action of ER with NF‐κb (Frasor et al., 2009). Interestingly, mutant TP53 can induce NF κB signaling favoring tumor progression (Weisz et al., 2007), identifying NF‐κbNF‐κB as a factor at the crossroad of the pathways of the major determinants of breast cancer. We also found an overlap of 14‐3‐3 signaling in function of the ER and TP53 status in correlation with the previously reported estrogen dependent TP53 activation (Lu et al., 2008). The Vitamin D receptor (VDR) signaling pathway was found to be differentially activated dependent on ER status and as VDR signaling results in the downstream modulation of the canonical Wnt pathway, the latter was also found to be altered depending on the methylation profile. The effect on the Wnt pathway might also be due to the common transactivation of Wnt and ER target genes by the polycomb protein EZH2 commonly overexpressed in breast cancer (Shi et al., 2007). Polycomb target genes and genes involved in human embryonic stem cell pluripotency were also found to be enriched in the analyzed dataset. Recently, it has been shown that the TGF‐β signaling pathway leads to the induction of the HDM2 leading to a destabilization of TP53 promoting breast carcinogenesis (Araki et al., 2010) which might perhaps not be required in the presence of mutated TP53 where genes of the TGF‐β pathway were found to be less methylated. Genes involved in Osteopontin (OPN) signaling were found to be differentially methylated depending on the methylation cluster, ER as well as the TP53 mutation status. Osteopontin is a secreted phosphoprotein which mediates tumorigenesis, local growth, and metastasis in a variety of cancers (Wai and Kuo, 2008). Our results are in concordance with those obtained by immunohistochemical staining showing a differential expression in function of the TP53 (Rudland et al., 2002) and ER status (Barraclough et al., 2009). In conclusion, the pathways identified through DNA methylation analysis concern the same pathways previously identified through genetic and transcriptomic studies but might provide novel targets for therapeutic intervention.
4. Conclusion
In the current study we define the subclasssification of human breast tumors based on their DNA methylation profile using a high‐throughput approach. The clusters differed in function of their ER and TP53 status and genes driving the separation had a significant overlap with genes of the intrinsic gene list providing a molecular explanation for the differential gene expression. It will be interesting to compare the DNA methylation profiles obtained in this study to genome‐wide profiles in different breast cell types and progenitors to confirm a possibility of cell‐type specific methylation signature in the different clusters.
4.1. Materials and clinical endpoints
DNA from fresh frozen tumor tissue was available from 91 tumors of a series of 123 tumor samples. These were part of a collection of 920 patients collected at Ullevål University Hospital, The Norwegian Radium Hospital, Baerum Hospital, Aker University Hospital and Buskerud Hospital between 1995 and 1998 (Naume et al., 2007). DNA from normal breast tissue (N = 4) were collected at the Akershus University Hospital and included as control to identify tumor specific methylation events. Patients were treated according to the National Guidelines where postmenopausal hormone receptor (HR) positive patients received tamoxifen only. Postmenopausal HR negative patients received CMF and premenopausal patients received CMF followed by tamoxifen if HR positive. After primary therapy the patients were followed at 6–12 months intervals. Lymph nodes were examined for metastatic cells by light microscopy of hematoxylin and eosin sections. ER and PgR status was assessed by immunostaining. Positive staining was reported if ≥10% of the tumor cell nuclei were stained. ErbB2 amplification was assessed by FISH on tissue microarray sections. ErbB2 positivity was scored if ErbB2/centromere ratio was ≥2.0. DTC status was evaluated by microscopy from cytospins and scored as positive if the morphology of the cells was compatible with tumor cell morphology. For a detailed description see (Wiedswang et al., 2003). TP53 mutation status was studied by TTGE analysis and dideoxy sequencing (AB340, Applied Biosystems) covering exon 2 through 11 (Naume et al., 2007).
4.2. DNA methylation analysis, array format
Tumor and non‐tumor DNA was isolated using standard phenol/chloroform protocols. One microgram of DNA was bisulphite treated using the EpiTect 96 Bisulfite Kit (Qiagen GmbH, Germany). 500 ng of bisulphite treated DNA was analyzed using the GoldenGate Methylation Cancer Panel I (Illumina Inc, CA, USA) that simultaneously analyses 1505 CpG sites in 807 cancer related genes. Typically 2 CpG sites were analyzed per gene were one CpG site is in the promoter region and one CpG site is in the 1st exon. The samples were analyzed according to the manufacturer's protocol. Bead studio software was used for the initial processing of the methylation data. The detection p‐value for each CpG site was used to validate sample performance and 11 samples that were considered to be numerically distant from the rest of the samples were removed from further analysis. The dataset was filtered based on the detection p‐value were CpG sites with a detection p‐value> 0.05 was omitted from analysis. Pyrosequencing was analyzed as previously described (Tost and Gut, 2007). A table with primer sequences is available in Supplementary Table 12.
4.3. mRNA analysis
Total RNA isolation was performed using TRIZOL (Invitrogen) as described previously (Sorlie et al., 2006). mRNA profiling were performed on Agilent catalogue design whole human genome 4 × 44K oligo array. Scanning was performed on Agilent scanner G2565A and signals were extracted using Feature Extraction v9.5. Data were log2 transformed, non‐uniform spots were excluded, and when averaging replicated probes, population outliers were excluded. Probes that are missing on more than 10 arrays were excluded. Quantile normalization was performed in R using normalizeBetweenArrays from the LIMMA library (Smyth, 2005) and missing values imputed using LLS imputation (R: LLSimpute from the pcaMethod library with k = 20) (Kim et al., 2005). The mRNA expression data has been submitted to the Gene Expression Omnibus (GEO).
5. Statistical analysis
5.1. Clustering and SAM analysis
The filtered β‐values for fluorescent signal calculated as described above were used in unsupervised hierarchical clustering analysis using the Cluster software package (Eisen et al., 1998). Only CpG sites with more than 90% data were used resulting in a list of 1016 CpG sites in 664 genes. Missing values were imputed using the K‐nearest neighbor algorithm before clustering. The CpG sites were mean centered and Spearman Rank correlation was used in an Average Linking Clustering approach. Visualization was done using TreeView (http://rana.lbl.gov/EisenSoftware.htm). SAM analysis (Tusher et al., 2001) was used to find genes that were significantly differentially methylated between tumors of different TP53 status, Estrogen Receptor status, grade, BM status as well as to find differences between methylation clusters. Two‐class SAM was performed using Wilcoxon‐test for identifying differentially methylated genes with 100 permutations. Multiclass SAM was performed using T‐test statistics. Missing values in the SAM analysis were permutated using the K‐nearest neighbor algorithm. A 5% FDR threshold was used in the SAM analysis.
5.2. Survival analysis
Kaplan–Meier analyses for a significant difference to single genes were performed by Matlab. Ridge and LASSO regression analysis (van Houwelingen et al., 2006) present a weighted approach indicating how well the entire set of predictors predicts the outcome variables. For the analysis, ‘Microsurv’ package by R and Matlab scripts (Bovelstad et al., 2007) was used. The package has been developed for some dimension reduction or parameter shrinkage estimation technique to obtain gene parameter estimates and adopt the Cox proportional hazard's model. These coefficients were then subjected to hierarchical clustering as described above. Log Rank test was performed in Matlab and SPSS version 15.0.
5.3. GO term enrichment analysis on differentially methylated genes
We used the David Database (Dennis, Jr. et al., 2003; Huang et al., 2009) to determine the enrichment of gene ontology terms in the genes that were common for the lists of genes differentially methylated between the clusters, TP53 and estrogen receptor status. David calculates an enrichment score and enrichment p‐value for each GO term to highlight the most relevant GO terms associated with the gene list in use. We used the unique Entrez GeneIDs from each list and compared to the unique GeneIDs representing the total list of genes on the Illumina array. Genes with more than one CpG site were listed only once in the analysis. We used the Illumina 807 gene list as background; a list that is already enriched for cancer related genes. We performed functional annotation clustering with default settings. Terms with an enrichment score p‐value <0.05 were listed.
5.4. Ingenuity pathway analysis
Data was analyzed utilizing Ingenuity Pathway Analysis (IPA, http://www.ingenuity.com/). To assess the level of representation of our selected gene sets in already defined, canonical (curated) pathways we performed a core analysis as described by IPA. The only filter used for this analysis was “only consider molecules and/or relationships where species = Human”. The analysis included both direct and indirect relationship as well as endogenous chemicals. The significance of the association between our defined datasets and the canonical pathways are assessed in two manners by the software: 1) the ratio of the number of molecules from our gene lists that map to a given canonical pathway and 2) Fisher's exact test p‐value, indicating the likelihood that the association between the genes in our gene sets and a specific canonical pathway are explained by chance alone.
5.5. eQTL analysis
The potential association between methylation and expression was investigated using assayed by the linear regression model function as implemented in the eMap library (http://www.bios.unc.edu/∼wsun/software.htm) and run in R version 2.10. Probes with more than 20% undetermined spots were excluded from the analysis. A transcript and a methylation site was regarded as being in cis if the distance between the center of the transcript and the CpG site was less than one mega base apart. Potential cis associations were also investigated by matching with HUGO gene symbols. A multiple‐comparison correction was performed by using Bonferroni correction. The eQTL analysis included n = 40,996 transcription probes, i.e. all probes with annotation data from Agilent expression arrays (i.e. chromosome and position information).
5.6. Spearman correlation
Spearman correlation was used to estimate the correlation between matched exact gene names from the methylation (Illumina) and mRNA expression (Agilent) arrays through the Accession code/UID on each array and was performed in Matlab. Spearman's rho statistic was also used to estimate a rank‐based measure of association between methylation sites across all chromosomes through the genome. In the case of missing values, the ranks were calculated based on pairwise completeness with re‐ranking for each pair (R version 2.10). The result was visualized (Figure. 5) using a custom Python script. Probes with more than 90% undetermined spots (n = 56) were excluded from the analysis.
Supporting information
The following are the Supplementary data related to this article:
Impact of DNA methylation on mRNA expression. (A) Distribution of Spearman correlation coefficients for the comparisons of 807 CpG sites (both promoter and exonic CpGs) and their corresponding mRNA (537 unique reference transcripts). (B) Normality plot showing the p‐value distribution for the different Spearman correlations. (C) Box plots showing differences in mRNA expression between the clusters for the three transcription factors (ISL1, RUNX3 and RARA).
Supplementary data
Supplementary data
Supplementary data
Supplementary data
Supplementary data
Supplementary data
Supplementary data
Supplementary data
Supplementary data
Supplementary data
Supplementary data
Supplementary data
Acknowledgements
JAR and TF are fellows of the Faculty Division the Norwegian Radium Hospital, University of Oslo. This work was supported by grant D‐03067 from The Norwegian Cancer Society (VNK), grant 152004/150 from The Functional Genomics Program (FUGE) of the Norwegian Research Council (NFR) (VNK) and the French‐Norwegian cooperation program Aurora grant 15842WE (JAR, JT, VNK). HE and SHN are postdoctoral fellows of the Norwegian Cancer association. Study design: VNK and JT. Expression analysis: HJ. Pyrosequencing analysis CD, Statistical analysis: JAR, SHN and HS. IPA analysis: HE. Writing of the manuscript: JAR, ALBD, JT and VNK.
Appendix. Supplementary data 1.
Supplementary data related to this article can be found online at doi:10.1016/j.molonc.2010.11.004
Rønneberg Jo Anders, Fleischer Thomas, Solvang Hiroko Kato, Nordgard Silje H., Edvardsen Hege, Potapenko Ivan, Nebdal Daniel, Daviaud Christian, Gut Ivo, Bukholm Ida, Naume Bjørn, Børresen-Dale Anne-Lise, Tost Jörg, Kristensen Vessela, (2011), Methylation profiling with a panel of cancer related genes: Association with estrogen receptor, TP53 mutation status and expression subtypes in sporadic breast cancer, Molecular Oncology, 5, doi: 10.1016/j.molonc.2010.11.004.
References
- Araki, S. , Eitel, J.A. , Batuello, C.N. , Bijangi-Vishehsaraei, K. , Xie, X.J. , Danielpour, D. , Pollok, K.E. , Boothman, D.A. , Mayo, L.D. , 2010. TGF-beta1-induced expression of human Mdm2 correlates with late-stage metastatic breast cancer. J. Clin. Invest. 120, (1) 290–302. [DOI] [PMC free article] [PubMed] [Google Scholar]
- Barraclough, D.L. , Platt-Higgins, A. , De Silva, R.S. , Barraclough, R. , Winstanley, J. , West, C.R. , Rudland, P.S. , 2009. The metastasis-associated anterior gradient 2 protein is correlated with poor survival of breast cancer patients. Am. J. Pathol. 175, (5) 1848–1857. [DOI] [PMC free article] [PubMed] [Google Scholar]
- Bediaga, N. , Acha, A. , Guerra, I. , Viguri, A. , Albaina, M.D.C. , Ruiz, I. , Rezola, R. , Alberdi, M.J. , Dopazo, J. , Montaner, D. , Renobales, M. , Fernandez, A. , John, F. , Fraga, M. , Liloglou, T. , Pancorbo, M.D. , 2010. DNA methylation epigenotypes in breast cancer molecular subtypes. Breast Cancer Res. 12, (5) R77 [DOI] [PMC free article] [PubMed] [Google Scholar]
- Birgisdottir, V. , Stefansson, O.A. , Bodvarsdottir, S.K. , Hilmarsdottir, H. , Jonasson, J.G. , Eyfjord, J.E. , 2006. Epigenetic silencing and deletion of the BRCA1 gene in sporadic breast cancer. Breast Cancer Res. 8, (4) R38 [DOI] [PMC free article] [PubMed] [Google Scholar]
- Bloushtain-Qimron, N. , Yao, J. , Snyder, E.L. , Shipitsin, M. , Campbell, L.L. , Mani, S.A. , Hu, M. , Chen, H. , Ustyansky, V. , Antosiewicz, J.E. , Argani, P. , Halushka, M.K. , Thomson, J.A. , Pharoah, P. , Porgador, A. , Sukumar, S. , Parsons, R. , Richardson, A.L. , Stampfer, M.R. , Gelman, R.S. , Nikolskaya, T. , Nikolsky, Y. , Polyak, K. , 2008. Cell type-specific DNA methylation patterns in the human breast. Proc. Natl. Acad. Sci. U. S. A. 105, (37) 14076–14081. [DOI] [PMC free article] [PubMed] [Google Scholar]
- Borgen, E. , Beiske, K. , Trachsel, S. , Nesland, J.M. , Kvalheim, G. , Herstad, T.K. , Schlichting, E. , Qvist, H. , Naume, B. , 1998. Immunocytochemical detection of isolated epithelial cells in bone marrow: non-specific staining and contribution by plasma cells directly reactive to alkaline phosphatase. J. Pathol. 185, (4) 427–434. [DOI] [PubMed] [Google Scholar]
- Bovelstad, H.M. , Nygard, S. , Storvold, H.L. , Aldrin, M. , Borgan, O. , Frigessi, A. , Lingjaerde, O.C. , 2007. Predicting survival from microarray data–a comparative study. Bioinformatics. 23, (16) 2080–2087. [DOI] [PubMed] [Google Scholar]
- Caldeira, J.R. , Prando, E.C. , Quevedo, F.C. , Neto, F.A. , Rainho, C.A. , Rogatto, S.R. , 2006. CDH1 promoter hypermethylation and E-cadherin protein expression in infiltrating breast cancer. BMC. Cancer. 6, 48 [DOI] [PMC free article] [PubMed] [Google Scholar]
- Cao, Y. , Karin, M. , 2003. NF-kappaB in mammary gland development and breast cancer. J. Mammary Gland. Biol. Neoplasia. 8, (2) 215–223. [DOI] [PubMed] [Google Scholar]
- Chow, L.W. , Zhu, L. , Loo, W.T. , Lui, E.L. , 2005. Aberrant methylation of cyclooxygenase-2 in breast cancer patients. Biomed. Pharmacother. 59, (2) S264–S267. [DOI] [PubMed] [Google Scholar]
- Dejeux, E. , Ronneberg, J.A. , Solvang, H. , Bukholm, I. , Geisler, S. , Aas, T. , Gut, I.G. , Borresen-Dale, A.L. , Lonning, P.E. , Kristensen, V.N. , Tost, J. , 2010. DNA methylation profiling in doxorubicin treated primary locally advanced breast tumors identifies novel genes associated with survival and treatment response. Mol. Cancer. Submitted [DOI] [PMC free article] [PubMed] [Google Scholar]
- Dennis, G. , Sherman, B.T. , Hosack, D.A. , Yang, J. , Gao, W. , Lane, H.C. , Lempicki, R.A. , 2003. DAVID: database for annotation, Visualization, and Integrated discovery. Genome Biol. 4, (5) 3 [PubMed] [Google Scholar]
- Easton, D.F. , Pooley, K.A. , Dunning, A.M. , Pharoah, P.D. , Thompson, D. , Ballinger, D.G. , Struewing, J.P. , Morrison, J. , Field, H. , Luben, R. , Wareham, N. , Ahmed, S. , Healey, C.S. , Bowman, R. , Meyer, K.B. , Haiman, C.A. , Kolonel, L.K. , Henderson, B.E. , Le, M.L. , Brennan, P. , Sangrajrang, S. , Gaborieau, V. , Odefrey, F. , Shen, C.Y. , Wu, P.E. , Wang, H.C. , Eccles, D. , Evans, D.G. , Peto, J. , Fletcher, O. , Johnson, N. , Seal, S. , Stratton, M.R. , Rahman, N. , Chenevix-Trench, G. , Bojesen, S.E. , Nordestgaard, B.G. , Axelsson, C.K. , Garcia-Closas, M. , Brinton, L. , Chanock, S. , Lissowska, J. , Peplonska, B. , Nevanlinna, H. , Fagerholm, R. , Eerola, H. , Kang, D. , Yoo, K.Y. , Noh, D.Y. , Ahn, S.H. , Hunter, D.J. , Hankinson, S.E. , Cox, D.G. , Hall, P. , Wedren, S. , Liu, J. , Low, Y.L. , Bogdanova, N. , Schurmann, P. , Dork, T. , Tollenaar, R.A. , Jacobi, C.E. , Devilee, P. , Klijn, J.G. , Sigurdson, A.J. , Doody, M.M. , Alexander, B.H. , Zhang, J. , Cox, A. , Brock, I.W. , MacPherson, G. , Reed, M.W. , Couch, F.J. , Goode, E.L. , Olson, J.E. , Meijers-Heijboer, H. , van den, O.A. , Uitterlinden, A. , Rivadeneira, F. , Milne, R.L. , Ribas, G. , Gonzalez-Neira, A. , Benitez, J. , Hopper, J.L. , McCredie, M. , Southey, M. , Giles, G.G. , Schroen, C. , Justenhoven, C. , Brauch, H. , Hamann, U. , Ko, Y.D. , Spurdle, A.B. , Beesley, J. , Chen, X. , Mannermaa, A. , Kosma, V.M. , Kataja, V. , Hartikainen, J. , Day, N.E. , Cox, D.R. , Ponder, B.A. , 2007. Genome-wide association study identifies novel breast cancer susceptibility loci. Nature. 447, (7148) 1087–1093. [DOI] [PMC free article] [PubMed] [Google Scholar]
- Eisen, M.B. , Spellman, P.T. , Brown, P.O. , Botstein, D. , 1998. Cluster analysis and display of genome-wide expression patterns. Proc. Natl. Acad. Sci. U S A. 95, (25) 14863–14868. [DOI] [PMC free article] [PubMed] [Google Scholar]
- Elsheikh, S.E. , Green, A.R. , Rakha, E.A. , Powe, D.G. , Ahmed, R.A. , Collins, H.M. , Soria, D. , Garibaldi, J.M. , Paish, C.E. , Ammar, A.A. , Grainge, M.J. , Ball, G.R. , Abdelghany, M.K. , Martinez-Pomares, L. , Heery, D.M. , Ellis, I.O. , 2009. Global histone modifications in breast cancer correlate with tumor phenotypes, prognostic factors, and patient outcome. Cancer Res. 69, (9) 3802–3809. [DOI] [PubMed] [Google Scholar]
- Enerly, E. , Steinfeld, I. , Kleivi, G.K. , Leivonen, S.K. , Aure, M.R. , Russnes, H.G. , Ronneberg, J.A. , Johnsen, H. , Navon, R. , Rodlan, E. , Mäkalä, R. , Naume, B. , Perälä, M. , Kallioniemi, O. , Kristensen, V.N. , Yakhini, Z. , Borresen-Dale, A.L. , 2010. Molecular characterization of breast cancer derived from joint analysis of high throughput miRNA data. Mol. Syst. Biol. Submitted [Google Scholar]
- Fiegl, H. , Millinger, S. , Goebel, G. , Muller-Holzner, E. , Marth, C. , Laird, P.W. , Widschwendter, M. , 2006. Breast cancer DNA methylation profiles in cancer cells and tumor stroma: association with HER-2/neu status in primary breast cancer. Cancer Res. 66, (1) 29–33. [DOI] [PubMed] [Google Scholar]
- Flanagan, J.M. , Cocciardi, S. , Waddell, N. , Johnstone, C.N. , Marsh, A. , Henderson, S. , Simpson, P. , da Silva, L. , Khanna, K. , Lakhani, S. , Boshoff, C. , Chenevix-Trench, G. , 2010. DNA methylome of familial breast cancer identifies distinct profiles defined by mutation status. Am. J. Hum. Genet. 86, (3) 420–433. [DOI] [PMC free article] [PubMed] [Google Scholar]
- Fleischer, T. , Ronneberg, J.A. , Edvardsen, H. , Jovanovic, J. , Alnaes, G.I. , Solvang, H. , Naume, B. , Borresen-Dale, A.L. , Tost, J. , Kristensen, V.N. , 2010. Methylation and mRNA expression profile provide supplementary information about the molecular characteristics of breast cancer with clinical implications (abstract). Eur. J. Cancer Suppl. 8, (5) 221 [Google Scholar]
- Frasor, J. , Weaver, A. , Pradhan, M. , Dai, Y. , Miller, L.D. , Lin, C.Y. , Stanculescu, A. , 2009. Positive cross-talk between estrogen receptor and NF-kappaB in breast cancer. Cancer Res. 69, (23) 8918–8925. [DOI] [PMC free article] [PubMed] [Google Scholar]
- Hinshelwood, R.A. , Clark, S.J. , 2008. Breast cancer epigenetics: normal human mammary epithelial cells as a model system. J. Mol. Med. 86, (12) 1315–1328. [DOI] [PubMed] [Google Scholar]
- Holm, K. , Hegardt, C. , Staaf, J. , Vallon-Christersson, J. , Jonsson, G. , Olsson, H. , Borg, A. , Ringner, M. , 2010. Molecular subtypes of breast cancer are associated with characteristic DNA methylation patterns. Breast Cancer Res. 12, (3) R36 [DOI] [PMC free article] [PubMed] [Google Scholar]
- Huang, D.W. , Sherman, B.T. , Lempicki, R.A. , 2009. Systematic and integrative analysis of large gene lists using DAVID bioinformatics resources. Nat. Protoc. 4, (1) 44–57. [DOI] [PubMed] [Google Scholar]
- Hunter, D.J. , Kraft, P. , Jacobs, K.B. , Cox, D.G. , Yeager, M. , Hankinson, S.E. , Wacholder, S. , Wang, Z. , Welch, R. , Hutchinson, A. , Wang, J. , Yu, K. , Chatterjee, N. , Orr, N. , Willett, W.C. , Colditz, G.A. , Ziegler, R.G. , Berg, C.D. , Buys, S.S. , McCarty, C.A. , Feigelson, H.S. , Calle, E.E. , Thun, M.J. , Hayes, R.B. , Tucker, M. , Gerhard, D.S. , Fraumeni, J.F. , Hoover, R.N. , Thomas, G. , Chanock, S.J. , 2007. A genome-wide association study identifies alleles in FGFR2 associated with risk of sporadic postmenopausal breast cancer. Nat. Genet. 39, (7) 870–874. [DOI] [PMC free article] [PubMed] [Google Scholar]
- Jones, P.A. , Baylin, S.B. , 2007. The epigenomics of cancer. Cell. 128, (4) 683–692. [DOI] [PMC free article] [PubMed] [Google Scholar]
- Jovanovic, J. , Ronneberg, J.A. , Tost, J. , Kristensen, V. , 2010. The epigenetics of breast cancer. Mol. Oncol. 4, (3) 242–254. [DOI] [PMC free article] [PubMed] [Google Scholar]
- Kamalakaran, S. , Russnes, H.G. , Varadan, V. , Levy, D. , Kendall, J. , Janevski, A. , Riggs, M. , Banerjee, N. , Synnestvedt, M. , Schlichting, E. , Kåresen, R. , Lucito, R. , Wigler, M. , Dimitrova, N. , Naume, B. , Borresen-Dale, A.L. , Hicks, J.B. , 2010. Subtype dependent alterations of the DNA methylation landscape in breast cancer and implications for prognosis. Mol. Oncol. Submitted [Google Scholar]
- Kim, H. , Golub, G.H. , Park, H. , 2005. Missing value estimation for DNA microarray gene expression data: local least squares imputation. Bioinformatics. 21, (2) 187–198. [DOI] [PubMed] [Google Scholar]
- Li, S. , Rong, M. , Iacopetta, B. , 2006. DNA hypermethylation in breast cancer and its association with clinicopathological features. Cancer Lett. 237, (2) 272–280. [DOI] [PubMed] [Google Scholar]
- Lu, S. , Becker, K.A. , Hagen, M.J. , Yan, H. , Roberts, A.L. , Mathews, L.A. , Schneider, S.S. , Siegelmann, H.T. , MacBeth, K.J. , Tirrell, S.M. , Blanchard, J.L. , Jerry, D.J. , 2008. Transcriptional responses to estrogen and progesterone in mammary gland identify networks regulating p53 activity. Endocrinology. 149, (10) 4809–4820. [DOI] [PMC free article] [PubMed] [Google Scholar]
- Muggerud, A.A. , Ronneberg, J.A. , Warnberg, F. , Botling, J. , Busato, F. , Jovanovic, J. , Solvang, H. , Bukholm, I. , Borresen-Dale, A.L. , Kristensen, V.N. , Sorlie, T. , Tost, J. , 2010. Frequent aberrant DNA methylation of ABCB1, FOXC1, PPP2R2B and PTEN in ductal carcinoma in situ and early invasive breast cancer. Breast Cancer Res. 12, (1) R3 [DOI] [PMC free article] [PubMed] [Google Scholar]
- Nakshatri, H. , Bhat-Nakshatri, P. , Martin, D.A. , Goulet, R.J. , Sledge, G.W. , 1997. Constitutive activation of NF-kappaB during progression of breast cancer to hormone-independent growth. Mol. Cell Biol. 17, (7) 3629–3639. [DOI] [PMC free article] [PubMed] [Google Scholar]
- Naume, B. , Zhao, X. , Synnestvedt, M. , Borgen, E. , Russnes, H.G. , Lingjaerde, O.C. , Stromberg, M. , Wiedswang, G. , Kvalheim, G. , Karesen, R. , Nesland, J.M. , Borresen-Dale, A.L. , Sorlie, T. , 2007. Presence of bone marrow micrometastasis is associated with different recurrence risk within molecular subtypes of breast cancer. Mol. Oncol. 1, (2) 160–171. [DOI] [PMC free article] [PubMed] [Google Scholar]
- Nordgard, S.H. , Johansen, F.E. , Alnaes, G.I. , Naume, B. , Borresen-Dale, A.L. , Kristensen, V.N. , 2007. Genes harbouring susceptibility SNPs are differentially expressed in the breast cancer subtypes. Breast Cancer Res. 9, (6) 113 [DOI] [PMC free article] [PubMed] [Google Scholar]
- Park, S.Y. , Gonen, M. , Kim, H.J. , Michor, F. , Polyak, K. , 2010. Cellular and genetic diversity in the progression of in situ human breast carcinomas to an invasive phenotype. J. Clin. Invest. 120, (2) 636–644. [DOI] [PMC free article] [PubMed] [Google Scholar]
- Park, S.Y. , Lee, H.E. , Li, H. , Shipitsin, M. , Gelman, R. , Polyak, K. , 2010. Heterogeneity for stem cell-related markers according to tumor subtype and histologic stage in breast cancer. Clin. Cancer Res. 16, (3) 876–887. [DOI] [PMC free article] [PubMed] [Google Scholar]
- Perou, C.M. , Sorlie, T. , Eisen, M.B. , van de, R.M. , Jeffrey, S.S. , Rees, C.A. , Pollack, J.R. , Ross, D.T. , Johnsen, H. , Akslen, L.A. , Fluge, O. , Pergamenschikov, A. , Williams, C. , Zhu, S.X. , Lonning, P.E. , Borresen-Dale, A.L. , Brown, P.O. , Botstein, D. , 2000. Molecular portraits of human breast tumours. Nature. 406, (6797) 747–752. [DOI] [PubMed] [Google Scholar]
- Ronneberg, J.A. , Tost, J. , Solvang, H.K. , Alnaes, G.I. , Johansen, F.E. , Brendeford, E.M. , Yakhini, Z. , Gut, I.G. , Lonning, P.E. , Borresen-Dale, A.L. , Gabrielsen, O.S. , Kristensen, V.N. , 2008. GSTP1 promoter haplotypes affect DNA methylation levels and promoter activity in breast carcinomas. Cancer Res. 68, (14) 5562–5571. [DOI] [PubMed] [Google Scholar]
- Rudland, P.S. , Platt-Higgins, A. , El-Tanani, M. , De Silva, R.S. , Barraclough, R. , Winstanley, J.H. , Howitt, R. , West, C.R. , 2002. Prognostic significance of the metastasis-associated protein osteopontin in human breast cancer. Cancer Res. 62, (12) 3417–3427. [PubMed] [Google Scholar]
- Russnes, H.G. , Vollan, H.K.M. , Lingjaerde, O.C. , Krasnitz, A. , Lundin, P. , Naume, B. , Sorlie, T. , Borgen, E. , Rye, I.H. , Langerod, A. , Chin, S.-F. , Teschendorff, A.E. , Stephens, P.J. , Månèr, S. , Schlichting, E. , Baumbusch, L.O. , Kåresen, R. , Stratton, M.P. , Wigler, M. , Caldas, C. , Zetterberg, A. , Hicks, J. , Borresen-Dale, A.L. , 2010. Genomic architecture characterizes tumor progression paths and fate in breast cancer patients. Sci. Transl. Submitted [DOI] [PMC free article] [PubMed] [Google Scholar]
- Sheridan, J.P. , Marsters, S.A. , Pitti, R.M. , Gurney, A. , Skubatch, M. , Baldwin, D. , Ramakrishnan, L. , Gray, C.L. , Baker, K. , Wood, W.I. , Goddard, A.D. , Godowski, P. , Ashkenazi, A. , 1997. Control of TRAIL-induced apoptosis by a family of signaling and decoy receptors. Science. 277, (5327) 818–821. [DOI] [PubMed] [Google Scholar]
- Shi, B. , Liang, J. , Yang, X. , Wang, Y. , Zhao, Y. , Wu, H. , Sun, L. , Zhang, Y. , Chen, Y. , Li, R. , Zhang, Y. , Hong, M. , Shang, Y. , 2007. Integration of estrogen and Wnt signaling circuits by the polycomb group protein EZH2 in breast cancer cells. Mol. Cell. Biol. 27, (14) 5105–5119. [DOI] [PMC free article] [PubMed] [Google Scholar]
- Shinozaki, M. , Hoon, D.S. , Giuliano, A.E. , Hansen, N.M. , Wang, H.J. , Turner, R. , Taback, B. , 2005. Distinct hypermethylation profile of primary breast cancer is associated with sentinel lymph node metastasis. Clin. Cancer Res. 11, (6) 2156–2162. [DOI] [PubMed] [Google Scholar]
- Smyth, G.K. , 2005. Limma: Linear Models for Microarray Data Springer; New York: pp. 397–420 [Google Scholar]
- Soares, J. , Pinto, A.E. , Cunha, C.V. , Andre, S. , Barao, I. , Sousa, J.M. , Cravo, M. , 1999. Global DNA hypomethylation in breast carcinoma: correlation with prognostic factors and tumor progression. Cancer. 85, (1) 112–118. [PubMed] [Google Scholar]
- Sorlie, T. , Perou, C.M. , Tibshirani, R. , Aas, T. , Geisler, S. , Johnsen, H. , Hastie, T. , Eisen, M.B. , van de, R.M. , Jeffrey, S.S. , Thorsen, T. , Quist, H. , Matese, J.C. , Brown, P.O. , Botstein, D. , Eystein, L.P. , Borresen-Dale, A.L. , 2001. Gene expression patterns of breast carcinomas distinguish tumor subclasses with clinical implications. Proc. Natl. Acad. Sci. U. S. A. 98, (19) 10869–10874. [DOI] [PMC free article] [PubMed] [Google Scholar]
- Sorlie, T. , Tibshirani, R. , Parker, J. , Hastie, T. , Marron, J.S. , Nobel, A. , Deng, S. , Johnsen, H. , Pesich, R. , Geisler, S. , Demeter, J. , Perou, C.M. , Lonning, P.E. , Brown, P.O. , Borresen-Dale, A.L. , Botstein, D. , 2003. Repeated observation of breast tumor subtypes in independent gene expression data sets. Proc. Natl. Acad. Sci. U. S. A. 100, (14) 8418–8423. [DOI] [PMC free article] [PubMed] [Google Scholar]
- Sorlie, T. , Wang, Y. , Xiao, C. , Johnsen, H. , Naume, B. , Samaha, R.R. , Borresen-Dale, A.L. , 2006. Distinct molecular mechanisms underlying clinically relevant subtypes of breast cancer: gene expression analyses across three different platforms. BMC. Genomics. 7, 127 [DOI] [PMC free article] [PubMed] [Google Scholar]
- Stephens, P.J. , McBride, D.J. , Lin, M.L. , Varela, I. , Pleasance, E.D. , Simpson, J.T. , Stebbings, L.A. , Leroy, C. , Edkins, S. , Mudie, L.J. , Greenman, C.D. , Jia, M. , Latimer, C. , Teague, J.W. , Lau, K.W. , Burton, J. , Quail, M.A. , Swerdlow, H. , Churcher, C. , Natrajan, R. , Sieuwerts, A.M. , Martens, J.W. , Silver, D.P. , Langerod, A. , Russnes, E. , Foekens, J.A. , Reis-Filho, J.S. , van, V. , Richardson, A.L. , Borresen-Dale, A.L. , Campbell, P.J. , Futreal, P.A. , Stratton, M.R. , 2009. Complex landscapes of somatic rearrangement in human breast cancer genomes. Nature. 462, (7276) 1005–1010. [DOI] [PMC free article] [PubMed] [Google Scholar]
- Tao, M.H. , Shields, P.G. , Nie, J. , Millen, A. , Ambrosone, C.B. , Edge, S.B. , Krishnan, S.S. , Marian, C. , Xie, B. , Winston, J. , Vito, D. , Trevisan, M. , Freudenheim, J.L. , 2009. DNA hypermethylation and clinicopathological features in breast cancer: the Western New York Exposures and breast cancer (WEB) study. Breast Cancer Res. Treat. 114, (3) 559–568. [DOI] [PMC free article] [PubMed] [Google Scholar]
- Tost, J. , Gut, I.G. , 2007. DNA methylation analysis by pyrosequencing. Nat. Protoc. 2, (9) 2265–2275. [DOI] [PubMed] [Google Scholar]
- Tusher, V.G. , Tibshirani, R. , Chu, G. , 2001. Significance analysis of microarrays applied to the ionizing radiation response. Proc. Natl. Acad. Sci. U. S. A. 98, (9) 5116–5121. [DOI] [PMC free article] [PubMed] [Google Scholar]
- van Houwelingen, H.C. , Bruinsma, T. , Hart, A.A. , Van't Veer, L.J. , Wessels, L.F. , 2006. Cross-validated Cox regression on microarray gene expression data. Stat. Med. 25, (18) 3201–3216. [DOI] [PubMed] [Google Scholar]
- Wai, P.Y. , Kuo, P.C. , 2008. Osteopontin: regulation in tumor metastasis. Cancer Metastasis Rev. 27, (1) 103–118. [DOI] [PubMed] [Google Scholar]
- Weisz, L. , Damalas, A. , Liontos, M. , Karakaidos, P. , Fontemaggi, G. , Maor-Aloni, R. , Kalis, M. , Levrero, M. , Strano, S. , Gorgoulis, V.G. , Rotter, V. , Blandino, G. , Oren, M. , 2007. Mutant p53 enhances nuclear factor kappaB activation by tumor necrosis factor alpha in cancer cells. Cancer Res. 67, (6) 2396–2401. [DOI] [PubMed] [Google Scholar]
- Widschwendter, M. , Siegmund, K.D. , Muller, H.M. , Fiegl, H. , Marth, C. , Muller-Holzner, E. , Jones, P.A. , Laird, P.W. , 2004. Association of breast cancer DNA methylation profiles with hormone receptor status and response to tamoxifen. Cancer Res. 64, (11) 3807–3813. [DOI] [PubMed] [Google Scholar]
- Wiedswang, G. , Borgen, E. , Karesen, R. , Kvalheim, G. , Nesland, J.M. , Qvist, H. , Schlichting, E. , Sauer, T. , Janbu, J. , Harbitz, T. , Naume, B. , 2003. Detection of isolated tumor cells in bone marrow is an independent prognostic factor in breast cancer. J. Clin. Oncol. 21, (18) 3469–3478. [DOI] [PubMed] [Google Scholar]
Associated Data
This section collects any data citations, data availability statements, or supplementary materials included in this article.
Supplementary Materials
The following are the Supplementary data related to this article:
Impact of DNA methylation on mRNA expression. (A) Distribution of Spearman correlation coefficients for the comparisons of 807 CpG sites (both promoter and exonic CpGs) and their corresponding mRNA (537 unique reference transcripts). (B) Normality plot showing the p‐value distribution for the different Spearman correlations. (C) Box plots showing differences in mRNA expression between the clusters for the three transcription factors (ISL1, RUNX3 and RARA).
Supplementary data
Supplementary data
Supplementary data
Supplementary data
Supplementary data
Supplementary data
Supplementary data
Supplementary data
Supplementary data
Supplementary data
Supplementary data
Supplementary data