

Abstract
Previous studies have implicated vestigial like 3 (VGLL3), a chromosome 3p12.3 gene that encodes a putative transcription co‐factor, as a candidate tumor suppressor gene (TSG) in high‐grade serous ovarian carcinomas (HGSC), the most common type of epithelial ovarian cancer. A complementation analysis based on microcell‐mediated chromosome transfer (MMCT) using a centric fragment of chromosome 3 (der3p12‐q12.1) into the OV‐90 ovarian cancer cell line haploinsufficient for 3p and lacking VGLL3 expression was performed to assess the effect on tumorigenic potential and growth characteristics. Genetic characterization of the derived MMCT hybrids revealed that only the hybrid that contained an intact VGLL3 locus exhibited alterations of tumorigenic potential in a nude mouse xenograft model and various in vitro growth characteristics. Only stable OV‐90 transfectant clones expressing low levels of VGLL3 were derived. These clones exhibited an altered cytoplasmic morphology characterized by numerous single membrane bound multivesicular‐bodies (MVB) that were not attributed to autophagy. Overexpression of VGLL3 in OV‐90 was achieved using a lentivirus‐based tetracycline inducible gene expression system, which also resulted in MVB formation in the infected cell population. Though there was no significant differences in various in vitro and in vivo growth characteristics in a comparison of VGLL3‐expressing clones with empty vector transfectant controls, loss of VGLL3 expression was observed in tumors derived from mouse xenograft models. VGLL3 gene and protein expression was significantly reduced in HGSC samples (>98%, p < 0.05) relative to either normal ovarian surface epithelial cells or epithelial cells of the fallopian tube, possible tissues of origin of HGSC. Also, there appeared to be to be more cases with higher staining levels in stromal tissue component from HGSC cases that had a prolonged disease‐free survival. The results taken together suggest that VGLL3 is involved in tumor suppressor pathways, a feature that is characterized by the absence of VGLL3 expression in HGSC samples.
Keywords: High-grade ovarian serous carcinomas, Microcell-mediated chromosome transfer, VGLL3, Tumor suppressor gene, Chromosome 3, 3p12, Gene transfection, Gene expression
Highlights
-
►
Microcell mediated transfer of chromosome 3p12.3‐pcen affects tumorigenic potential.
-
►
Loss of VGLL3 expression in tumors formed in vivo from transfectant clones.
-
►
VGLL3 expression significantly reduced in high grade serous ovarian carcinomas.
-
►
VGLL3 expressed in normal epithelial cells of fallopian tube and ovarian surface.
Abbreviations
- HGSC
high-grade serous carcinomas
- MMCT
microcell-mediated chromosome transfer
- MVB
multivesicular-bodies
- TSG
tumor suppressor gene
- chr
chromosome
- s.c.
sub-cutaneous
- i.p.
intraperitoneal
1. Introduction
Ovarian cancer is the fifth leading cause of cancer‐related deaths in women in the developed world, where high‐grade ovarian serous carcinomas (HGSC) account for the majority of all epithelial ovarian cancer cases (Chen et al., 2003; Seidman et al., 2004). Though highly responsive to the standard of care involving cytoreductive surgery and platinum‐taxane chemotherapy, overall survival is less than 30% and this has been attributed to advanced stage at diagnosis, repeated recurrences, and the development of drug resistance for the majority of HGSC cases (Aletti et al., 2007). Thus, elucidating the factors important in the development and progression of HGSC has been a major focus of research in order to develop more effective treatment strategies. Though HGSCs share in common a high frequency (>90%) of TP53 mutations and a highly disorganized genome with common chromosomal (chr) anomalies (Ahmed et al., 2010; Gorringe and Campbell, 2009; Singer et al., 2005; Wojnarowicz et al., 2012b), significant heterogeneity exists suggesting that they may develop through different molecular pathways. Our research group has been interested in investigating the possibility that the short arm (p) of chr 3 harbors tumor suppressor genes (TSG) important in ovarian cancer as suggested by loss of heterozygosity (LOH) studies (Lounis et al., 1998; Manderson et al., 2002). As more than one 3p interval was identified by LOH analyses (Lounis et al., 1998), we applied a genetic complementation approach to guide our search and gather further functional evidence in support of 3p TSGs. Through the transfer of normal chr 3 fragments into the OV‐90 ovarian cancer cell line, our group identified 3p14‐pcen as a candidate TSG containing region (Cody et al., 2007, 2009). We used the tumorigenic OV‐90 cell line as model for our studies as this cell line is haploinsufficient for 3p and exhibits all of the major features of HGSCs such as a TP53 mutation and chr anomalies (Provencher et al., 2000). OV‐90 is tumorigenic in mouse xenograft models with ascites formation at intraperitoneal sites, and is able to form colonies in soft agarose and spheriods in hanging drop cultures (Cody et al., 2007; Provencher et al., 2000). It is these in vivo and in vitro growth characteristics that were abrogated in our OV‐90 hybrids containing normal chr 3p fragments (Cody et al., 2007). Whole genome transcriptome analyses, which also included an interrogation of data from HGSC transcriptomes, suggested that molecular networks characteristic of HGSC had been affected in these non‐tumorigenic hybrids (Cody et al., 2009; Quinn et al., 2009a). Though 3p14‐pcen contains a number of plausible TSGs, molecular genetic analyses ranked VGLL3 at 3p12.3 as a top candidate to pursue based on comparative gene expression profiles of HGSCs and various ovarian cancer cell lines that differed in their tumorigenic potential (Cody et al., 2007, 2009).
VGLL3 overlaps an anonymous cDNA clone (AF099505) that was identified using the technique of mRNA differential display of colorectal cancers, and thus originally referred to as “colon carcinoma related protein” gene (Wang et al., 1999). VGLL3 cDNA was subsequently identified in placental tissues by similarity to the transcription enhancer 1 (TEAD1) interaction domain (Maeda et al., 2002). In Drosophila, the TEAD homolog, scalloped (Sg) interacts with the co‐factor vestigial (Vg) to drive differentiation of wings and indirect flight muscles (Legent et al., 2006). Other than our initial gene expression analysis in ovarian cancer related model systems, which showed low or absent VGLL3 expression in HGSC relative to normal cells (Birch et al., 2008; Cody et al., 2007, 2009; Quinn et al., 2009a), the mammalian ortholog has not been investigated.
In this report, we began our analyses with functional gene complementation assays using a microcell‐mediated chromosome transfer (MMCT) technique with a unique derivative chr 3, der3p12‐q11, which has been shown to suppress the tumorigenic potential of renal cell carcinoma cell lines in MMCT assays (Lott et al., 1998). We describe the results of our analyses of the MMCT hybrids, which reaffirmed VGLL3 as a top candidate to pursue. Then we describe the targeted analysis of VGLL3 in the context of cell transfection assays, where most notably expression was lost in tumors resulting from mouse xenograft models. We also describe an unusual cytoplasmic phenotype characterized by presence of numerous single membrane bound multivesicular‐bodies (MVB) found only in VGLL3 transfectant clones and cells expressing VGLL3 using an inducible lentiviral system. Finally, we relate VGLL3 protein expression to clinical parameters and demonstrate absent or low levels of VGLL3 expression in cancer specimens relative to normal tissues and a trend toward an improved progression‐free survival outcome in patients exhibiting evidence of VGLL3 expression in the stromal compartment of the tumor.
2. Materials and methods
2.1. MMCT of der3p12‐q11
The MMCT assays were performed using a modified method (Killary et al., 1992). Briefly, the mouse‐human hybrid HA(3)IIaa cells containing a derivative of human chr 3, der3p12‐q12.1 tagged with pSV2neo (Lott et al., 1998; Sanchez et al., 1994), were incubated 48‐h in colcemid at 0.06 μg/ml to induce micronucleation. Enucleation of micronucleate populations was achieved using 10 μg/ml cytochalasin B and centrifugation at 27,000 × g for 30 min (28–32 °C). Microcell populations were enriched upon filtration through 5‐ and 3‐μm nucleopore filters. Microcells were then resuspended with phytohemagglutinin P and added to a monolayer of the recipient cells, the human OV‐90 ovarian cancer cell line haploinsufficient for 3p (Provencher et al., 2000), in a 25‐cm2 flask for 15–20‐min at 37 °C. One ml of 50% polyethylene glycol (PEG 1500) was added as a fusing agent for 90 s. The MMCT hybrids were selected in OSE complete medium (Wisent Inc., St‐Bruno, QC, Canada) containing 800 μg/ml of G418 (Wisent Inc). Four microcell hybrid clones, OVHA3‐1, OVHA3‐2, OVHA3‐3 and OVHA3‐4 were derived from this fusion and maintained and expanded in G418 containing medium for further analysis. The hybrids were assessed for both mouse chr and der3p12‐q11 content by fluorescent in situ hybridization (FISH) analysis as described in Figure S1.
2.2. Genotyping analyses
PCR‐based genotyping assays were performed as previously described (Cody et al., 2009) using polymorphic microsatellite markers and conditions described in Table S1. Genotyping was also performed using the Infinium™ HumanHap610 genotyping BeadChip technology (Illumina Inc., San Diego, CA, USA) as described previously (Birch et al., 2011), which contained 1544 markers mapping to 3p12‐pcen. Genotyping and imaging using the BeadStudio Data Analysis software (Illumina Inc.) were performed at the McGill University and Genome Quebec Innovation Centre (Montreal, QC). The map coordinates were determined using the Feb. 2009 GRCh7/hg19 assembly of the human reference sequence (genome.ucsc.edu/cgi‐bin/hgGateway).
2.3. Spheroid formation, soft agar and clonogenic assays
The capacity to form spheroids in hanging drop cultures and the ability to grow in anchorage independent conditions in soft agar were assessed as previously described (Cody et al., 2007; Zietarska et al., 2007). Clonogenic assays were performed with 500 cells seeded per well in a six‐well plate, and allowed to grow for a period of about two weeks. Media was removed, cells washed with PBS and fixed in methanol. Post‐fixation, the cells were stained with Giemsa stain modified solution overnight (Sigma–Aldrich, Oakville, ON, Canada) and colonies counted. The surface area of the colonies were measured and the total surface area calculated for each well in the six‐well plate for each experiment using ImageJ software version IJ 1.46r (Schneider et al., 2012). Differences in the area measure between groups were assessed by a student's t‐test using Simple Interactive Statistical Analysis (http://www.quantitativeskills.com/sisa/). All assays were performed in triplicate.
2.4. Tumorigenicity assays
The tumorigenic potential of the cell lines was assessed based on their ability to form tumors in 42 day‐old female SCID CB17 mice (Charles River Laboratories, Saint‐Constant, QC, Canada) at subcutaneous (s.c.) left gluteal (n = 6 mice) and intraperitoneal (i.p.) injection sites (n = 6 mice). Each mouse was injected at the s.c. site with 1 × 10⁶ cells suspended in a mix of 1:1 PBS and matrigel (BD Biosciences, Mississauga, ON, Canada) or at the i.p. site with 1 × 10⁶ cells suspended PBS. Mice were also injected with PBS (n = 4, for each site). Data on weight of the mice and tumor dimensions (for s.c. experiments) were measured twice a week. Animals were housed under sterile conditions with ad‐lib access to food and water. Animals were sacrificed and tumors collected before neoplastic masses reached greater than 2500 mm3 occurring at s.c. sites, or maximal tumor burden and ascites formation occurring at i.p. sites, according to the guidelines of the Canadian Council on Animal Care. Differences in the kinetics of tumor growth were assessed by Mann–Whitney U‐test for s.c. experiments. A Kaplan–Meier survival curve analysis was performed for the i.p. experiment. Survival measured as the time to sacrifice for both s.c. and i.p. experiments was also evaluated by an one‐way Anova with Tukey's post hoc test. All statistical tests were performed using SPSS software (Statistical Product and Service Solution Package, SPSS, 16.0).
2.5. VGLL3 expression analysis in cell lines and tumor xenografts
Gene expression analysis was performed from cDNA prepared from total RNA from cell lines, frozen tumor xenografts or HGSC samples by RT‐PCR analyses essentially as described (Cody et al., 2007; Presneau et al., 2003). VGLL3 expression was also assessed by Real‐Time RT‐PCR using SYBR‐Green PCR Master Mix (Qiagen Inc., Toronto, ON, Canada) on a Rotor‐gene 3000 Real‐Time Centrifugal DNA Amplification System (Corbett Research, Montreal Biotech Inc., Dorval, QC, Canada) according to the manufacturer's instructions. The cDNA samples were diluted 1:25 in water and 5 μl of the dilution were mixed with 10 pg of primers and 12.5 μl QuantiFast SYBR® Green PCR kit (Qiagen) for a final volume of 25 μl. The relative amount of VGLL3 to ERK‐1 (control) and the fold stimulation was calculated by using equation (2)−ΔΔCT, where ΔCT = CTVGLL3 − CTERK1 and ΔΔCT = ΔCTsamples − ΔCTOV‐90. The primers are listed in Table S1.
2.6. Generation of VGLL3‐expressing stable clones
VGLL3‐expressing clones were generated by transfecting OV‐90 cells with the commercially available pDream2.1 vector containing the (sequence verified) VGLL3 coding sequence in frame with the Flag tag sequence or empty pDream2.1 vector (GeneScript USA Inc., Piscataway, NJ, USA) using lipofectamine 2000 and Opti‐MEM® (both from Life Technologies Inc., Burlington, ON, Canada). The VGLL3‐expressing and empty vector clones were each selected and maintained in the presence of 800 μg/ml and 400 μg/ml of G418 (Wisent Inc.), respectively, in OSE complete medium.
2.7. Western blot analyses
Cells were lysed in RIPA buffer (Sigma–Aldrich, Oakville, Ontario, Canada) containing appropriate amounts of protease inhibitor cocktail (Roche Diagnostics, Laval, QC, Canada). Fifty μg of total protein were resolved by SDS‐PAGE and transferred using iBlot® Gel Transfer Stacks (Life Technologies Inc.) onto a nitrocellulose membrane. The membranes were blocked with 5% milk and then incubated with the appropriate antibody (Table S2). Proteins were visualized using the ECL system (EMD Millipore, Billerica, MA, USA).
2.8. Lentivirus production and cell infection
The stable OV‐90 clone expressing the tetracycline repressor (TetR), OV‐906/TR, was generated by transfection of the pcDNA6/TR vector (Life Technologies Inc., cat. No. V1025‐20) with Lipofectamine (Life Technologies Inc.) and maintained in OSE complete medium supplemented with blasticidin (Wisent Inc.) at 12 μg/ml. VGLL3 inducible clones were generated by transfecting OV‐906/TR with pLenti‐CMV Puro that expresses the Flag‐Tagged VGLL3, when grown in the presence of doxycycline (Enzo Life Sciences Inc., Farmingdale, NY, USA). The Gateway®Technology system (Life Technologies Inc.) was used to subclone the Flag‐Tagged VGLL3 coding sequence from pDream vector used in our transfection assays into a pDONR221 vector by a BP recombination followed by an LR recombination between pDONR221‐VGLL3‐Flag vector and the pLenty CMV/TO Puro DEST destination vector (670‐1; Addegene #17293) (Campeau et al., 2009) and the construct was verified by sequencing. Lentiviruses were produced by co‐transfecting the pLenty CMV/TO Puro DEST‐VGLL3‐Flag and the ViraPower Lentiviral Packaging Mix (Life Technologies Inc.) in the 293FT packaging cell line. The supernatant containing the viral particles was collected, concentrated by ultracentrifugation and then used to infect about 2 × 10⁵ OV‐906/TR cells per well of a 6‐well plate containing 2 ml of culture medium with 5 μg/ml polybrene. Media was changed 16 h after infection and puromycin (Wisent Inc.) added after 48 h at 0.5 μg/ml. Infected OV‐906/TR cells were induced by adding 20 ng/ml of doxycycline to the medium.
2.9. Immunocytochemistry
Cells were grown on coverslips in a 24‐well culture plate for three days in complete OSE medium with or without 20 ng/ml of doxycycline, and then fixed in 1 ml of cold methanol (−20 °C) for 20 min. After three PBS washes cells were incubated with PBS containing 3% bovine serum albumin (Wisent Inc.) for an hour at room temperature. They were then stained with primary antibodies (Table S2) for 60 min in 3% PBS‐BSA, washed, and incubated with secondary antibodies in 3% PBS‐BSA for 60 min (Table S2). The cell nuclei were stained with Hoeschst 33342 bis benzimide (Sigma–Aldrich). Mounted coverslips were analyzed under a Nikon Eclipse E600 microscope with objective lenses plan APO 20×: 20/0.6 NA (Nikon Canada, Mississauga, ON, Canada). Images were acquired with a cool snap HQ2 camera piloted by the NIS elements AR 3.0 acquisition software (Leica Camera Inc., Allendale, NJ, USA). Negative controls omitted the use of primary antibodies.
2.10. Tissue specimens
The HGSC and normal fallopian tube tissue samples were collected with informed written consent and granted approval from from patients undergoing surgeries performed at the Centre hospitalier de l'Université de Montréal (CHUM) – Hôpital Notre‐Dame. Clinical features such as disease stage, and tumor characteristics such as grade and histopathological subtype, were assigned by a gynecologic‐oncologist and/or gynecologic‐pathologist according to the criteria established by the International Federation of Gynecology and Obstetrics. Disease‐free survival, defined according to the Response Evaluation Criteria in Solid Tumors (Therasse et al., 2000), as time to doubling of the upper normal limit of the serum cancer antigen marker CA‐125 or the detection of a new lesion by ultrasound or CT‐scan imaging, and overall survival, were extracted from the Système d'Archivage des Données en Oncologie. Written informed consent from all participants was in accordance with the Declaration of Helsinki and in compliance with the Research Ethics Boards of Centre hospitalier de l'Université de Montréal‐Hôpital Notre‐Dame and The McGill University Health Centre.
2.11. VGLL3 expression analyses in normal tissues and HGSC samples
VGLL3 expression was assessed using a custom Ziplex® gene expression array (Axela, Inc. Toronto, ON, Canada) for 11 primary cultures of normal ovarian surface epithelial (NOSE) samples prepared as described previously (Quinn et al., 2009b), a commercially available RNA sample from a normal whole ovary sample (Agilent Technologies Canada Inc., Mississauga, ON, Canada) and 79 HGSCs. Details of array and probe design, and methodology have been described in detail (Quinn et al., 2009b). An independent sample t‐test, not assuming equal variance, was performed to determine if VGLL3 expression in the NOSE samples was significantly different from that of the HGSC samples using SPSS software (16.1) (Statistical Product and Service Solution Package, SPSS, 16.0, Chicago, IL, USA).
Immunohistochemistry (IHC) was preformed on a tissue microarray (TMA), containing 0.6 mm tissue cores from 196 HGSCs and 11 normal fallopian tube samples from paraffin embedded tissue blocks selected based on a review of hematoxylin and eosin‐stained slides (Wojnarowicz et al., 2012a). The cores were arrayed 1 mm apart onto a single paraffin block. IHC analysis was performed using 5 micron sections mounted onto frosted plus slides. Staining was performed with an antibody against human VGLL3 (Table S2) using the Ventana Benchmark XT system (©Ventana Medical Systems, Inc., Tucson, AZ, USA). The TMA was scanned and the images were viewed using Olympus OlyVIA software 2.3 (Build 8529). Two observers examined the images independently and scored both the epithelial (n = 182) and the stromal (n = 180) components of each core based on staining intensity and ranked it as negative, low or high. The inter‐observer correlation coefficient was 0.785 for the epithelial component and 0.918 for the stromal component, and was calculated using SPSS software. The relationship between VGLL3 immunostaining (absent, low and/or high) and disease‐free survival as defined above were evaluated using Kaplan–Meier survival curve analyses coupled to the Mantel–Cox log‐rank test, and performed using SPSS software. P‐values less than 0.05 were considered statistically significant.
2.12. Mutation analysis of VGLL3
Mutation analysis was performed by sequencing genomic DNA of the protein coding region and intron/exon splice junctions of HGSCs as previously described (Cody et al., 2009). The sequence variants were compared with those reported in the Single Nucleotide Polymorphism (dbSNP) database (www.ncbi.nlm.nih.gov/projects/SNP/). Variants resulting in amino acid substitutions were examined by PolyPhen (genetics.bwh.harvard.edu/pph), Panther (www.pantherdb.org/tools/csnpScoreForm.jsp), SNP effect (snpeffect.vib.be) and SIFT dbSNP (sift.jcvi.org/www/SIFT_dbSNP.html), and aligned to orthologous and homologous genes from various species using the UCSC Human Genome Browser Gateway hg19 assembly (genome.ucsc.edu) (Karolchik et al., 2003) in order to predict the possible impact on the structure and function of the encoded protein.
2.13. Electron microscopy
Cultures of OV‐90, OV‐90:VGLL311, OV‐90:VGLL320, OV‐90:EV, OV‐906/TR‐VGLL3, OV‐906/TR‐ccDB with or without doxycycline treatment, plated in eight‐well Nunc Lab‐Tek tissue culture chamber slides (Sigma–Aldrich), were grown to confluency and then washed in phosphate‐buffered saline and fixed in situ with 3% glutaraldehyde in 0.1 M sodium cacodylate buffer (pH 7.4). After being washed several times with cacodylate buffer, the cell layers were treated with 1% osmium tetroxide in buffer, washed in buffer and then treated with 2% tannic acid in buffer, each for 30 min. Cell layers were then dehydrated in a graded series of ethanol to 70%, treated for 1 h with 2% uranyl acetate in 70% ethanol, and then washed in 70% ethanol. Cell layers were further dehydrated to 100% ethanol and then infiltrated with ethanol:Epon mixtures (1:1 and 1:3) and embedded in pure Epon (MECALAB, Ltd., Montreal, QC, Canada). En face thin sections (60 nm) were placed on formvar‐coated grids and counterstained with 7% methanolic uranyl acetate followed by lead citrate. Sections were examined in a Tecnai 12 transmission electron microscope at an accelerating voltage of 120 kV, and images were digitally captured.
3. Results
3.1. Successful generation of OV‐90 hybrids by MMCT of der3p12q12.1
To gather further evidence in support of a 3p12‐pcen TSG, a functional gene complementation assay involving the MMCT of der3p12‐q11 chr into OV‐90 was performed. The hybrids OVHA3‐1, OVHA3‐2, OVHA3‐3 and OVHA3‐4 were generated and stably maintained in cell culture, all lacking contaminating mouse chrs by FISH analyses (Figure S1). Genotype analyses using selected polymorphic microsatellite markers confirmed the presence of the transferred der3p12‐pcen alleles (data not shown). A FISH analysis using a human chr 3 painting probe verified the presence of a small derivative chr 3 in all MMCT hybrids (Figure S1).
3.2. The MMCT hybrids exhibited different growth characteristics
The MMCT hybrids were compared with OV‐90 for differences in cell morphology, and various in vitro and in vivo growth characteristics. All hybrids exhibited no overt differences in their cell morphology based on light microscopy (Figure 1A). In cell culture they propagated as a monolayer of tightly packed cells with a cobblestone‐like appearance typified by epithelial cells, as demonstrated by OV‐90 (Provencher et al., 2000). However, only OVHA3‐1 exhibited a lower, but not significantly different, viability (data not shown) relative to OV‐90 and the other hybrids, and has lost the capacity to form spheroids in hanging drop cultures (Figure 1B). Moreover, this hybrid as well as OVHA3‐4 was unable to form colonies in soft agar, a feature suggesting that loss of anchorage independence of growth had occurred (Figure 1C). Although OV‐90 and the hybrids were tumorigenic at s.c. and i.p. sites in a tumor xenograft mouse model (Figure 1D–F), OVHA3‐1 tumor growth appeared to be significantly slower at s.c. sites (p < 0.001) (Figure 1D). Survival as measured by the time‐to‐sacrifice in both the s.c. and i.p. xenograft experiments was also significantly longer for OVHA3‐1 (p < 0.001) (Figure 1E and F). At i.p. sites, the OV‐90 derived tumors appeared vascularized and tumor formation was accompanied with bloody ascites. Although this was also the case with the tumors derived from OVHA3‐2, OVHA3‐3 and OVHA3‐4, both the tumors and the accompanying ascites appeared noticeably less vascularized in experiments with OVHA3‐1 (Figure 1F and S2).
Figure 1.
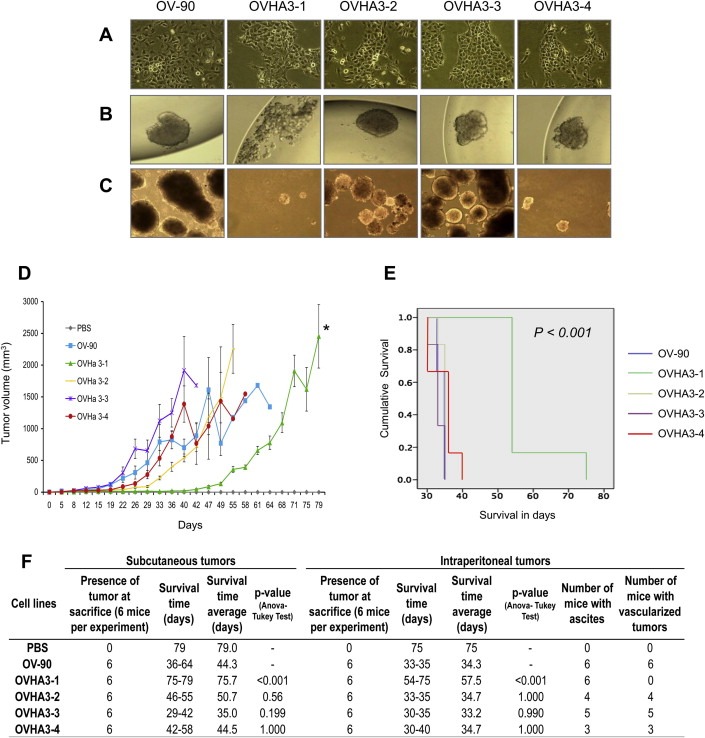
Characterization of MMCT hybrids. (A) Morphological appearance of the OV‐90 and MMCT hybrid cell lines, OVHA3‐1, OVHA3‐2, OVHA3‐3 and OVHA3‐4 (×20). (B) The capacity of the cells to form spheroids in hanging droplets was tested after 4 days (×20). (C) The colony forming ability of the cells in soft agar was monitored after 3 weeks (×40). (D) Tumor growth kinetics (mean of tumor sizes ± SE) of OV‐90 and the MMCT hybrids at subcutaneous (s.c.) injection site (to follow results of each group values were connected with lines) showing that OVHA3‐1 tumor growth was significantly different than from OV‐90 (*) (p‐value <0.05, Mann–Withney U‐test). (E) Kaplan–Maier survival curves for OV‐90 and the MMCT hybrids at intraperitoneal (i.p.) injection site. (F) Data for s.c. and i.p. in vivo tumorigenicity assays of OV‐90 and the four MMCT hybrids. Phosphate‐buffer saline (PBS).
3.3. Genetic analysis of the hybrids identified VGLL3 as TSG candidate
The MMCT hybrids were characterized for their chr 3p genetic content by a comparative analysis with OV‐90 and the donor cell initially using polymorphic microsatellite markers, and then by genome‐wide high‐density SNP array analysis. Our genotyping results of the HA(3)IIaa donor hybrid cell line using polymorphic microsatellite markers suggested that the 3p centric fragment is defined by D3S2323 (3p12.3) and D3S1603 (3q12.1) consistent with independent findings (Sanchez et al., 1994; Zhang et al., 2007) (Figure 2A and S3). The combined analyses suggested that OVHA3‐1 acquired and maintained the entire 3p interval of the derivative chr. This interval contains 10 known genes and only the first 2 exons of ROBO1 (Figure S4 and Table S3). In contrast, the other hybrids appeared to have acquired and/or maintained only a portion of the transferred chr. Hybrid OVHA3‐3 appeared to have maintained a fragment containing the 3′ end of CHMP2B (5 exons), POU1F1, HTR1F, CGGBP1, ZNF654, C3orf38 and EPHA3, as well as a fragment containing the 5′ end of CADM2 but excluding exons 6 to 10. Although the hybrid OVHA3‐3 also maintained two other fragments, neither is known to contain an intact gene. The hybrid OVHA3‐4 maintained a fragment containing only GBE1. It was difficult to properly assess the content of transferred genes in OVHA3‐2, as this hybrid exhibited evidence of genomic instability and loss of transferred alleles (Figure 2A and S3). A comparative genetic analysis of hybrids suggested that, only OVHA3‐1 had uniquely acquired apparently uninterrupted CADM2, VGLL3 and CHMP2B loci as a consequence of MMCT (Figure 2B, C and Table S3). As OVHA3‐1 was the only hybrid exhibiting evidence of altered tumorigenic potential (Figure 1), it is possible that the introduction and expression of these genes contributed to the tumor suppressor phenotype exhibited by this hybrid.
Figure 2.
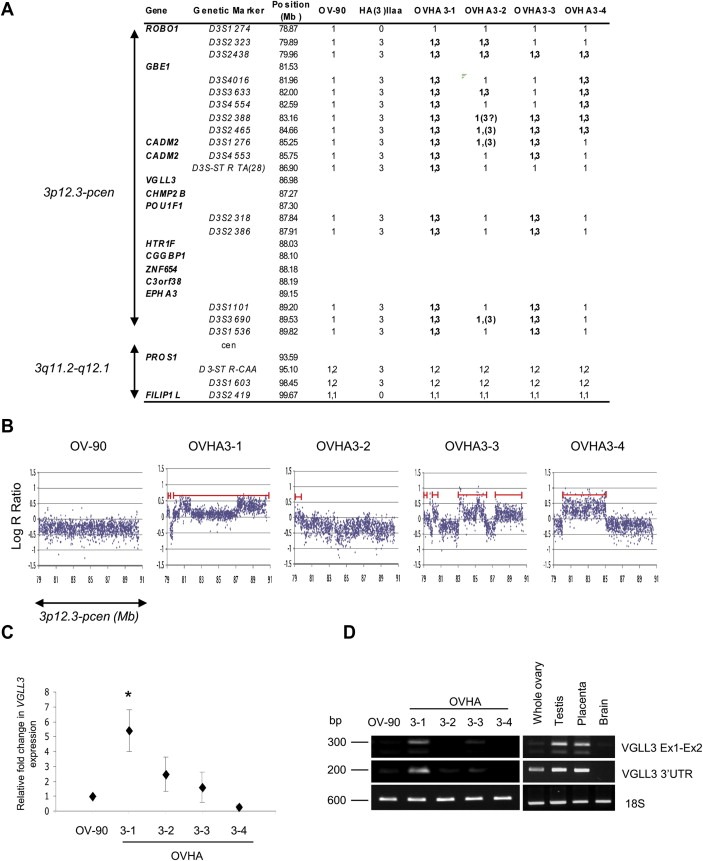
Genetic analyses of the 3p12‐q12 region in the MMCT hybrids. (A) Genotypes of the MMCT hybrids, parental OV‐90 cell line and HA(3)IIaa 3p12‐q12 donor cell line based on polymorphic microsatellite markers analyses. The data is aligned according to genomic position based on Human Genome Browser Gateway hg19 assembly where distance megabases (Mb) is relative to 3p‐telomere. Alleles (1,2) derived from the OV‐90 were distinguished from the HA(3)IIaa allele (3). Alleles exhibiting imbalance are in brackets. (B) Genotyping data from SNP BeadArray analyses of OV‐90 and the MMCT hybrids showing copy number (highlighted with red line) represented as Log R Ratio using the BeadStudio Data Analysis software of 3p12.3‐pcen interval aligned to chromosomal position (Mb, x‐axis). (C) Quantitative real time PCR analysis of VGLL3 in the MMCT hybrids (OVHA‐1, OVHA‐2 OVHA‐3, and OVHA‐4) normalized to expression values (±SE of four experiments performed in duplicate; significant differences (*p < 0.05) evaluated by t‐test) observed in OV‐90 parental cell line. (D) Semi‐quantitative RT‐PCR analysis of VGLL3 in OV‐90 and 4 MMCT (OVHA‐1, OVHA‐2 OVHA‐3, and OVHA‐4) hybrids using oligonucleotide primers that amplified either a portion of 3′UTR or message spanning exons 1 and 2 of VGLL3, where the expression of 18S is shown as a control for RNA quality. PCR products are shown relative to size markers (in basepairs (Bp)).
3.4. Loss of der3p12‐pcen donor alleles in the OVHA3‐1 xenografts
We investigated the genetic content of the xenografts derived from OVHA3‐1 to determine if the transferred alleles were retained in the tumors. Whole genome genotyping analyses were performed on independently derived tumor samples, XT1 and XT2, from s.c. sites and compared to that of hybrid OVHA3‐1, which was maintained under G418 selection in tissue culture (to select for cells harboring the der(3) neor tagged chr) and genotyped prior to performing the in vivo tumorigenicity assays (Figure S5A). The genotyping results suggested that loss of the introduced fragment had occurred in a subpopulation among the tumor cells. To explore this notion further, XT1 cells were assayed for sensitivity to G418 and assays demonstrated loss of 50% of cells in culture when grown in the presence of G418 (Figure S5B). The cells from five independently derived tumor xenografts from s.c. sites were also assayed for their ability to form spheroids in hanging drop culture, as this feature was altered in OVHA3‐1 (Figure 1). The capacity to form spheroids in the presence of G418 appeared unchanged (Figure S5C). However, in the absence of G418, the cells from OVHA3‐1 derived tumor xenografts formed a number of small aggregates rather than large defined spheroids. All of these results raise the possibility that the delay in tumor formation could have been due to the selection of hybrid cells that have lost the introduced alleles.
3.5. VGLL3 expression in MMCT hybrids
The comparative genetic analysis and tumorigenicity experiments involving the MMCT hybrids suggested that the CADM2, VGLL3 and CHMP2B loci as potential candidates to pursue as tumor suppressors. These findings are consistent with our previous chromosome 3 fragment transfer experiments involving OV‐90 cell line which also showed loss of tumorigenic potential in the hybrids that had acquired these loci (Cody et al., 2007). However, we pursued VGLL3 as the primary candidate as our previous comparative gene expression analyses of CADM2 and CHMP2B, which is contiguous with VGLL3 do not support a role for these genes as tumor suppressors in ovarian cancers (Cody et al., 2009).
VGLL3 expression was investigated in the MMCT hybrids using qRT‐PCR in order to confirm that the introduced alleles were transcriptionally active as have been observed in our previous analyses of chromosome 3 transfer experiments (Cody et al., 2007, 2009). OVHA3‐1 exhibited the highest level of expression of VGLL3 relative to OV‐90, and this was significantly different as compared with OV‐90 and the other hybrids (Figure 2C). RT‐PCR analyses also indicated low level of VGLL3 expression in OVHA3‐3. Moreover, differential RT‐PCR analyses showed two distinct bands associated with VGLL3 amplification that we have attributed to the expression of a full‐length transcript and an alternative shorter length transcript in OVHA3‐1 (Figure 2D). The alternative size transcript is consistent in size with our previous VGLL3 expression analyses in chromosome 3 transfer OV‐90 derived hybrids, ovarian cancer specimens (at low levels) and normal tissues, and has been verified by DNA sequencing (Cody et al., 2009). The function of the alternative transcript is unknown, however relative to the full‐length sequence, it harbors in‐frame deletion of 159 nucleotides that is predicted to result in an absence of 59 amino acids overlapping the putative TEAD1 interaction domain in the encoded protein (Cody et al., 2009).
3.6. Generation of VGLL3 expressing OV‐90 derived transfectant clones
To assess the biological effect of highly expressing VGLL3 in OV‐90, we used a commercially available construct, where VGLL3 expression was controlled by the CMV promoter and the encoded protein detectable by an anti‐Flag antibody. We used this construct as attempts at generating stable VGLL3 expressing OV‐90 clones using a pcDNA3 expression vector were unsuccessful though transient transfection assays demonstrated robust VGLL3 expression had occurred as referred to in our previous study (Cody et al., 2009). About 50% (27 of 50) of clones were successfully maintained as clonal expansions in tissue culture, as compared with the 16 empty vector derived clones where all were maintained in culture. The VGLL3‐expressing clones exhibited variable expression as compared with OV‐90, OVHA3‐1 and the transiently transfected OV‐90 cells, with 21 of 27 clones exhibiting at least a 2‐fold level of VGLL3 expression by qRT‐PCR analyses (Figure 3A). The OV‐90:VGLL311 and OV‐90:VGLL320 clones were selected for further analysis as they exhibited the highest levels of VGLL3 expression (Figure 3B). Two empty vector clones were randomly selected for comparative analyses. Notable is that VGLL3 expression by RT‐PCR was significantly less detectable (relative to qRT‐PCR analysis) for the VGLL3‐expressing clones as compared with the transiently transfected OV‐90 cells (Figure 3C). Western blot analysis using an anti‐Flag antibody detected variable but noticeably lower levels of encoded VGLL3‐Flag protein in OV‐90:VGLL311 and OV‐90:VGLL320 and other selected VGLL3 transfectant clones compared with transiently transfected cells (Figure 3D). These findings combined with our previous attempt using pcDNA3, suggest that deriving stable transfectant clones expressing high levels of VGLL3 in OV‐90 cells may be difficult to achieve.
Figure 3.
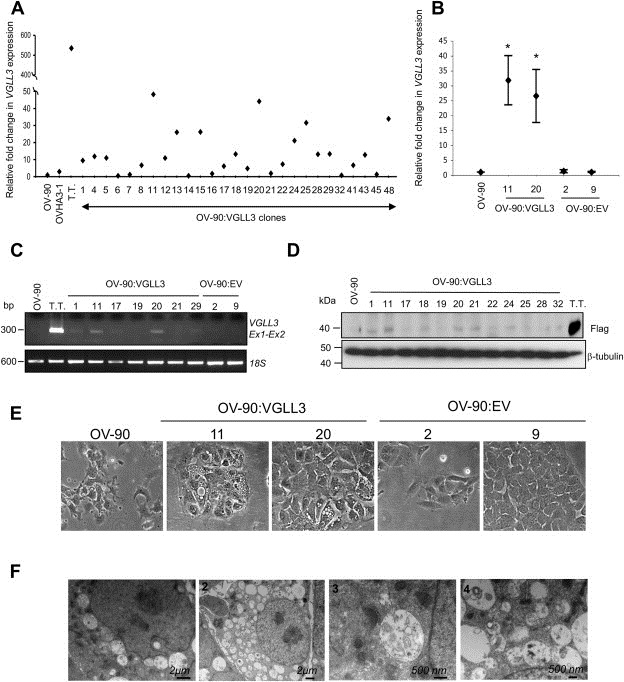
Generation of stable VGLL3‐expressing clones and cell morphology. (A) VGLL3 expression levels based on quantitative real time PCR analysis of OV‐90:VGLL3 clones (numbered), MMCT hybrid OVHA3‐1, transiently transfected OV‐90 cells (T.T.) relative to OV‐90 cell line. (B) VGLL3 expression levels (mean of three independent experiments) based on quantitative real time PCR analysis of OV‐90:VGLL311, OV‐90:VGLL320, OV‐90:EV2 and OV‐90:EV9 relative to OV‐90 cell line (significant differences (*p < 0.05) evaluated by t‐test). (C) Semi‐quantitative RT‐PCR analysis of VGLL3 in OV‐90:VGLL3 and OV‐90:EV stable clones where expression of 18S is shown as a control for RNA quality. PCR products are shown relative to size markers (in basepairs (Bp). (D) Western blot analysis of OV‐90, OV‐90:VGLL3 stable clones and OV‐90 transiently transfected cells (T.T) using an anti‐Flag antibody. β‐tubulin was used as loading control. (E) Light microscope (×40) photographs of OV‐90, OV‐90:VGLL311, OV‐90:VGLL320, OV‐90:EV2 and OV‐90:EV9 cells showing cytoplasmic vacuoles in the VGLL3‐expressing clones: OV‐90:VGLL311 and OV‐90:VGLL320. (F) Electronic microscopy images of OV‐90:VGLL311.
3.7. The VGLL3 expressing OV‐90 clones exhibited a unique intracellular morphology
In contrast to OV‐90, the VGLL3‐expressing transfectant clones exhibited a distinctive intra‐cellular morphology typified by the presence of numerous vacuole‐like structures in the cytoplasm that were clearly visible by light microscopy (Figure 3E). These vacuoles did not appear to stain intensely with Oil Red O by visual assessment beyond background levels, indicating that they did not contain a significant lipid content as compared with control cells known to express a high lipid content (Figure S6). As these vacuoles have been reported in the context of autophagy (Codogno et al., 2011), we investigated by western blot analysis, the accumulation of the microtubules associated protein light chains LC3‐II relative to LC3‐I which has been described as a marker of autophagy (Kabeya et al., 2004). There appeared to be no visible difference in LC3‐II relative to LC3‐I levels in the VGLL3 expressing clones as compared with assays of OV‐90 and the empty vector clones (Figure S7A). Electron microscopy was performed to characterize the vacuole‐like structures, as cytoplasmic autophagic vacuoles result from the sequestration of cytosol or cytoplasmic organelles and thus have a double membrane (Codogno et al., 2011). The majority of the vacuoles lacked the characteristic double membrane typified by autophagic vacuoles, although there were many examples where they contained membranous structures (Figure 3F). These structures appear to be unique to the VGLL3 expressing transfectant clones as they were not visible in our MMCT derived hybrids nor our previously derived chr 3 fragment transfer hybrids (Cody et al., 2007).
3.8. The VGLL3 expressing OV‐90 clones exhibited modest alterations in growth phenotypes
To further assess the biological effect of expressing VGLL3 in OV‐90, we investigated several of the in vitro growth characteristics that were shown altered in the MMCT hybrids. The cell viability appeared unchanged between the different clones and the parental OV‐90 cell line (data not shown). We then assessed the spheroid formation capacity for each clone and compared results with two randomly selected empty vector derived transfectant clones. Interestingly, both the VGLL3‐expressing clones and the empty vector clones had lost their ability to fully form spheroids with defined margins in hanging drop assays (Figure 4A). However, the empty vector clones formed larger multicellular aggregates (particularly OV‐90:EV2) than those observed with the VGLL3‐expressing clones. We were puzzled by these observations and performed spheroid formation assays on additional empty clones (n = 5), which yielded similar results (data not shown). While control empty vector clones still formed large multicellular aggregates instead of spheroids with defined margins as observed with OV‐90, this capacity to do so was completely lost in the VGLL3‐expressing clones.
Figure 4.
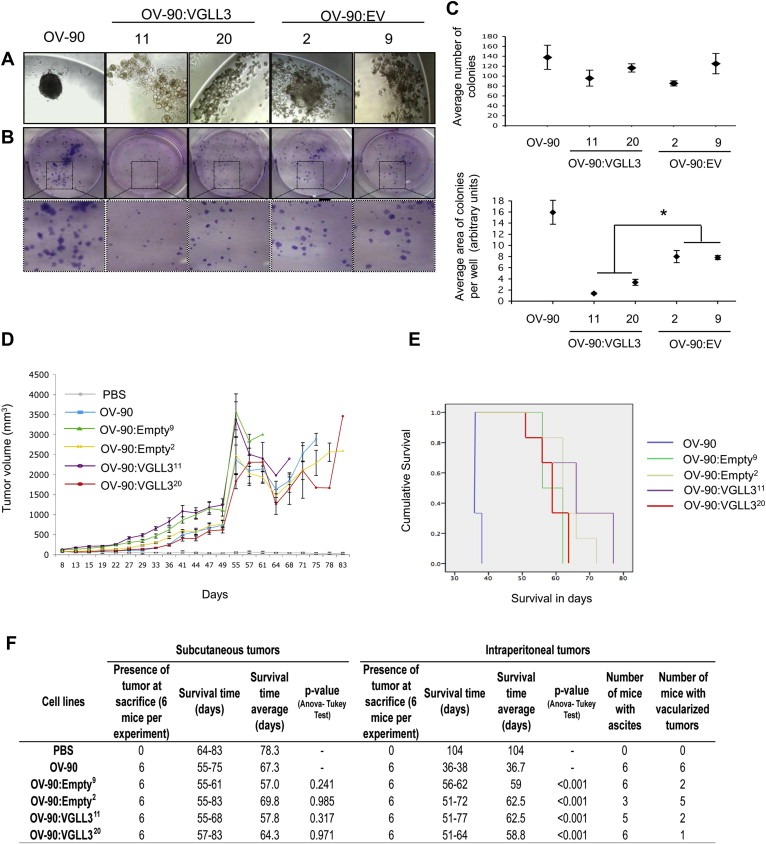
Characterization of the VGLL3‐stable clones. (A) Light microscopy images (×20) of cells in hanging drop cultures for spheroid formation assays of OV‐90, and the OV‐90:VGLL3 and OV‐90:EV stable clones. (B) Images of results from clonogenic assays (1× and 4×). (C) Average number of colonies (values represent the mean ± SE of number of colonies for each group in four experiments) and the total surface area of the colonies (values represent the mean ± SE of the total colony area per well for each group of three independent experiments) formed in clonogenic assays. (D) Tumor growth kinetics of OV‐90, OV‐90:VGLL311, OV‐90:VGLL320, OV‐90:EV2 and OV‐90:EV9 at subcutaneous injection (s.c.) site in mouse tumor xenograft assays. The mean of tumor sizes ± SE is reported on the graph for each group. Mann–Withney U‐test indicates no significant difference in the tumor growth kinetics. (E) Kaplan‐Maier survival curves of OV‐90, OV‐90:VGLL311, OV‐90:VGLL320, OV‐90:EV2 and OV‐90:EV9 at i.p. injection site. A post hoc Tukey test indicated a significant difference with a p‐value <0.001 in the survival time between OV‐90 and each of OV‐90:VGLL311, OV‐90:VGLL320, OV‐90:EV2 and OV‐90:EV9 at i.p. injection sites, but no significant difference between OV‐90:VGLL311 and OV‐90:VGLL320 with OV‐90:EV2 and OV‐90:EV9. Information related to survival time range and average of mice, the presence of tumors, ascites and evidence of vascularization are reported (F).
The VGLL3‐expressing clones were also compared with the empty‐vector clones in clonogenic assays. There were no significant differences in the number of colonies formed in this assay between the different clones. However, it is interesting to observe that the VGLL3‐expressing clones gave rise to colonies that were significantly smaller in size when compared with the empty vector clones (Figure 4B and C).
To assess whether VGLL3 expression in OV‐90 cell line background would affect tumor forming capacity, we performed in vivo tumorigenic assays at both s.c. and i.p. sites using a xenograft mouse model. The capacity to form tumors was not significantly different when the VGLL3 expressing transfectant clones were compared with the empty vector clones at s.c. sites (Figure 4D and F). At i.p. injection site, there was no significant difference in survival time between the VGLL3‐expressing group and the empty vector control group. Notable was that both of these groups were significantly different when compared with OV‐90 parental cell line at i.p. injection sites (Figure 4E). While we attribute these differences to selection of clones, our comparative analyses of transfectant clones derived from OV‐90 do not support the notion that expressing VGLL3 in OV‐90 cell affected tumorigenic potential.
As our previous MMCT assays showed loss of the transferred 3p fragment in the resulting xenograft tumors, we examined the VGLL3 expression in the xenograft tumors derived from the VGLL3‐expressing clones. Interestingly, VGLL3 expression was no longer detectable in any of the OV‐90:VGLL311 and OV‐90:VGLL320 tumor xenografts (derived at both s.c. or i.p. sites) tested by RT‐PCR (Figure S8). These results strongly support the notion that deregulation or silencing of VGLL3‐expression in OV‐90 transfectant clones was required for tumor formation.
3.9. Lentivirus inducible VGLL3‐expressing OV‐90 cells also exhibited unique intracellular morphology
We turned to a lentivirus inducible system to try to induce higher levels of VGLL3 expression in OV‐90, as all of our stable clones expressed VGLL3 at modest levels despite the use of a vector construct with the strong CMV promoter. First, OV‐906/TR clones were derived from the transfection of pcDNA6/TR, a vector that expressed the tetracycline repressor (TetR). A OV‐906/TR clone was then transfected with pLenti‐CMV Puro (OV‐906/TR ccDB, used as negative control) or pLenti‐CMV Puro‐VGLL3 vector that expresses Flag‐tagged VGLL3 (OV‐906/TR‐VGLL3) when such cells were grown in the presence of doxycycline. RT‐PCR analysis showed that OV‐906/TR‐VGLL3 transfected cells exhibited noticeably higher levels of VGLL3 expression even in absence of doxycycline (Figure 5A). However, VGLL3 protein expression was noticeably different in induced cells by both western blot and immunocytochemistry analyses using both anti‐Flag and anti‐VGLL3 antibodies, which became available during the course of this study (Figure 5B and C). The induction of VGLL3 expression did not appear to have overtly affected cell survival (data not shown). However, OV‐906/TR‐VGLL3 induced to express VGLL3 contained a larger proportion of cells with numerous intracellular vacuoles (Figure 5C) reminiscent of the morphological features observed with the VGLL3‐expressing transfectant clones (Figure 3E). Electron microscopy also revealed cytoplasmic structures similar to those found in the VGLL3‐expressing transfectant clones (data not shown). The paucity of vacuoles with double membranes combined with insignificant differences in the LC3‐II:LC3‐I levels suggested that autophagy was also unlikely induced in these cells (Figure S7B). Moreover, OV‐906/TR‐VGLL3 induction of VGLL3 expression did not exhibit increased apoptotic activity as measured by cleavage of caspase‐3 by immunoblot assay (data not shown).
Figure 5.
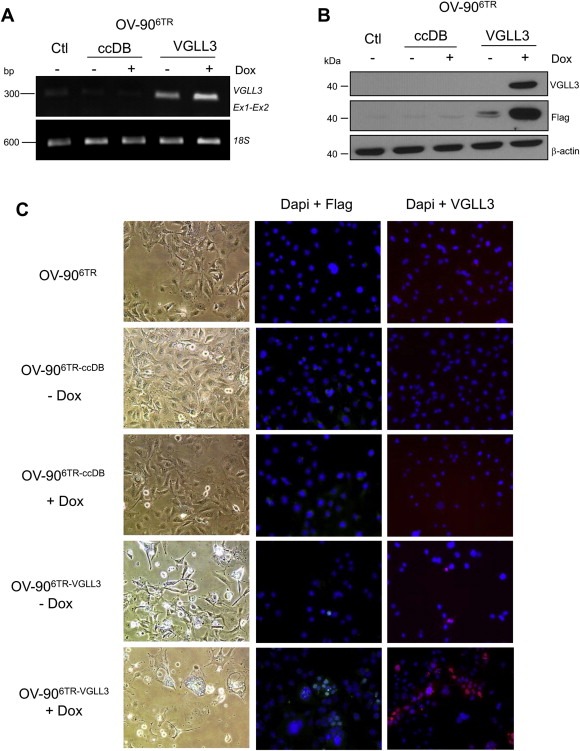
VGLL3 gene and protein expression in OV‐90, OV‐906/TR‐VGLL3 and OV‐906/TR‐ccDB inducible clones. (A) Semi‐quantitative RT‐PCR analysis of VGLL3 in the absence (−) or presence (+) (3 days) of doxycycline (Dox). (B) Western blot analysis of protein extracted from cells in the absence (−) or presence (+) (3 days) of doxycycline detected using anti‐Flag and anti‐VGLL3 antibodies. (C) Cell morphology of OV‐90, OV‐906/TR‐VGLL3 and OV‐906/TR‐ccDB inducible clones without (−) or with (+) (10 days) doxycycline. VGLL3 expression resulted in cells with cytoplasmic vacuoles and a more elongated cell shape. Immunofluorescence detection of VGLL3 without (−) or in presence (+) (3 days) of doxycline detected using anti‐Flag, or anti‐VGLL3 antibodies.
3.10. VGLL3 protein expression and cell localization
Until recently, studies of VGLL3 protein expression were hampered by the lack of a specific VGLL3 antibody, and our attempts to have an antibody commercially synthesized were not successful (data not shown). As mentioned above, a commercial polyclonal rabbit anti‐VGLL3 antibody, ab83555, became available during the course of our study. Initial western blot analyses revealed low levels of reactivity of OV‐90:VGLL3 expressing transfectant clones as compared with OV‐90 (data not shown), possibly due to the low expression levels of VGLL3 expression as inferred by RT‐PCR analysis or western blot analysis using an anti‐Flag antibody (see Figure 3C and D). However, the new VGLL3‐antibody appears to detect a VGLL3 Flag‐tagged protein of predicted size as indicated by western blot analysis of doxycycline induced OV‐906/TR‐VGLL3 cells (Figure 5B). Immunofluorescence images of doxycycline exposed OV‐906/TR‐VGLL3 cells exhibited clear evidence of immunoreactivity with anti‐VGLL3 antibody, as compared to the control cells regardless of exposure to the inducer. The modest immunoreactivity observed in the OV‐906/TR‐VGLL3 cells grown in the absence of the inducer, is consistent with the ‘leaky’ phenotype of this construct (Figure 5A and C). Immunocytochemistry (ICC) suggests both a nuclear and perinuclear localization of VGLL3 protein in overexpressing cells (Figure 5C and S9), which is consistent with its purported function as a transcription co‐factor (Maeda et al., 2002).
3.11. VGLL3 gene and protein was underexpressed in HGSCs and this was not attributed to somatic intragenic mutations
Previous gene expression analyses suggested low levels of VGLL3 expression in a limited set of HGSCs relative to NOSE (Cody et al., 2009). Using a custom‐made gene expression array platform (Quinn et al., 2009b), we have extended the sample set to include 79 TP53 mutation‐positive HGSCs (Wojnarowicz et al., 2012b). About 76% HGSCs exhibited expression levels lower than that observed in whole ovary (Figure 6A). Relative to the mean of expression in the NOSE samples, VGLL3 was significantly underexpressed in 99% of HGSCs (p = 0.007) (Figure 6A).
Figure 6.
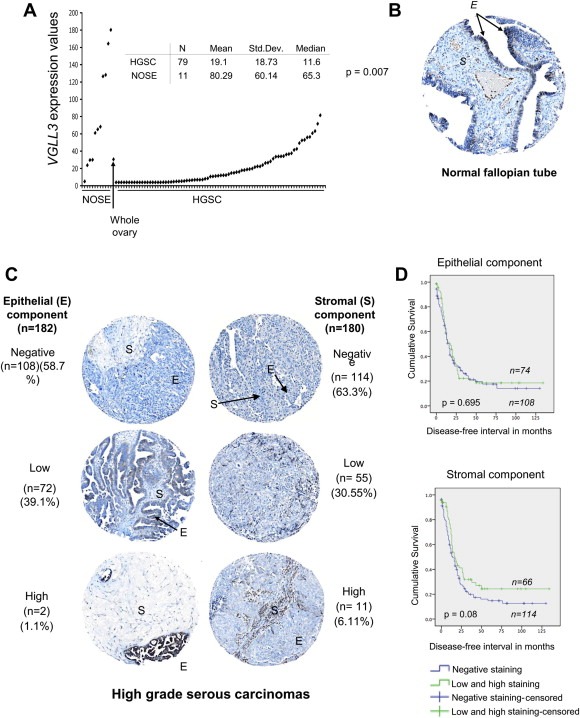
VGLL3 gene and protein expression in high grade serous ovarian carcinomas (HGSC). (A) VGLL3 expression in NOSE samples (n = 11), normal whole ovary and HGSC samples (n = 79) as assayed by Ziplex Research System expression array. (B) An example of immunohistochemistry analysis of VGLL3 protein using anti‐VGLL3 antibody of a paraffin embedded normal fallopian tube tissue core from a tissue microarray. (C) Examples of different staining patterns of immunohistochemistry analysis of VGLL3 protein using anti‐VGLL3 antibody of a paraffin embedded HGSC tumor (epithelial (E) or stromal (S) components) tissue core from tissue microarray. (D) Kaplan–Meier survival curve analysis of HGSC cases for disease‐free survival (in months) of patients whose tumors showed negative staining (blue curve) compared with patients whose tumors showed low or high staining (green curve) for VGLL3 protein in the epithelial or stromal components of the tumor (p‐values were derived from log‐rank tests).
We also investigated protein expression by IHC of a TMA that contained 196 HGSCs that included cores from 61 HGSCs examined by gene expression. The vast majority (98.9%) of the epithelial tumor cell components of the HGSCs exhibited either no or low levels of staining (Figure 6C). There were no significant differences in the relationship between the overall or disease‐free survival time of HGSCs with the intensity levels of VGLL3 immunostaining in both the epithelial and the stromal component of the core (Figure 6D), though there appeared to be more cases with evidence of higher staining levels in stromal tissue component from HGSC cases that had a prolonged disease‐free survival (p = 0.08). The majority (90.5%) of the stromal components of the tumor also exhibited no or low staining levels (Figure 6C). Although no cores were available from whole ovary with intact NOSE, the tissue array contained cores containing normal fallopian tube samples, which is a recently posited origin of some HGSCs (Salvador et al., 2009). Notable was that VGLL3 staining was also evident in the fallopian tube epithelial (FTE) cells (Figure 6B).
To determine if VGLL3 expression was associated with an intragenic alteration, we sequenced the protein encoding regions and splice sites of VGLL3 in the HGSCs that were investigated by both gene and protein expression. With the exception of c.578 A > T variant found in exon 3 in one sample no other variants were identified. This variant, reported in the dbSNP Database as rs79345443, is predicted to confer an amino acid substitution of His (CAT) for Leu (CTT) at position 193 in VGLL3, and has been found in 3.5% of the European population tested (2n = 1324 chromosomes) [http://www.ncbi.nlm.nih.gov/SNP/snp_ss.cgi?ss=ss491837946]. The consequences of this alteration are unknown, however the His193Leu variant and immediately flanking amino acids appear to reside in a highly conserved region among primates as determined by Vertebrate Multiz Alignment and Conservation analysis of 46 species (genome.ucsc.edu). The computational tools PolyPhen, Panther and SIFT dbSNP predicted that this substitution had a functional effect, whereas SNP effect did not. The variant was also found in the germline DNA of this same patient. Notable is that our previous genetic analysis of OV‐90 also did not identify any evidence for somatic inactivation of VGLL3 (Cody et al., 2009). These results suggest that an alternative mechanism accounts for deregulating VGLL3 expression in HGSC.
4. Discussion and conclusions
Our microcell mediated chromosome 3p12‐q12 transfer experiments have provided further support for the notion that this genomic region contains at least one gene that confers a tumor suppressor phenotype. Our previous molecular genetic analyses of genes in 3p12 interval suggested that VGLL3 was a strong candidate to pursue (Cody et al., 2007,2009). This is further supported by the observation that only OVHA3‐1 MMCT hybrid that had acquired the der3p12‐pcen chr containing the VGLL3 locus, exhibited alterations in both in vitro growth characteristics and in vivo tumorigenic potential in a mouse tumor xenograft model, where a delay in tumor formation was observed. These findings differ in part from our previous studies in that OV‐90 hybrids generated by chr 3 fragment transfer experiments exhibited complete suppression of tumorigenicity (Cody et al., 2007). The failure of MMCT hybrid cells that retained der3p12‐pcen to thrive in vivo could have accounted for our observations, as suggested by the loss of transferred alleles in OVHA3‐1 derived xenografts.
Our inability to derive stable OV‐90 transfectant clones that highly express VGLL3 is intriguing. Only stable low‐level VGLL3‐expressing clones were derived despite the use of a vector with a strong CMV promoter. Though there were visible differences in the capacity to form spheroids in hanging drop cultures or colonies in clonogenic assays, the VGLL3‐expressing and the empty vector clones did not significantly differ in tumorigenic potential in mouse xenograft models. Notable however, is that loss of VGLL3 expression was observed in tumors derived from mouse xenografts. Though there was no delay in tumor formation in vivo as was observed with OVHA3‐1, these results strongly suggest that deregulation or silencing of VGLL3‐expression in OV‐90 transfectant clones was required for tumor formation. The context wherein which VGLL3 expression occurs in cDNA expressing clones and from a derivative chromosome 3 in OVHA3‐1 could explain these differences in tumorigenic potential, where the latter could be subject to cis‐regulatory elements as well as the possibility that other genes co‐transferred may have contributed to the phenotype as discussed further below. While our cell transfectant experiments may be equivocal, they raise the possibility that expression of VGLL3 in OV‐90 cells, even at the modest levels observed in the stable transfectant clones, is incompatible with tumor formation.
Another interesting observation is that the VGLL3‐expressing clones exhibited an unexpected intracellular phenotype consistent with MVB. The vacuoles in our clones are reminiscent of MVB as has been described in the context of the Endosomal Sorting Complex Required for Transport (ESCRT) pathway (Henne et al., 2011; Katzmann et al., 2002). We have attributed MVB formation to VGLL3 expression in this experimental context, as this phenotype was not observed in the empty vector clones but was also observed in the context of VGLL3 expression induced in the lentiviral system. MVBs were not observed in our MMCT assays or previous experiments involving chromosome 3 fragment transfer in OV‐90. It is possible that expression derived from the protein encoding sequences representing only the full‐length transcript from a strong CMV promoter may have contributed to this phenotype in this context. Though speculative, overexpression of a putative transcription factor, which is the purported function of VGLL3 based on the presence of a sequence with similarity to a TEAD1 transcription enhancer factor interaction domain protein motif (Legent et al., 2006; Maeda et al., 2002; Vaudin et al., 1999), may have strongly invoked the expression of genes whereby the consequences were observed inducing the ESCRT pathway. Moreover, VGLL3 expression from the introduced derivative chromosome 3p12.3‐q12 would include cis‐regulatory elements, which may have affected expression in this context. This includes an unusually long 10 kb 3′UTR of unknown function. Interestingly, RT‐PCR analysis of VGLL3 expression also indicated that the expression of alternative smaller transcript occurred in the OVHA3.1 hybrid. The alternative size transcript is consistent in size with our previous VGLL3 expression analyses in chromosome 3 transfer OV‐90 derived hybrids, ovarian cancer specimens (both at low levels when detected) and normal tissues, and has been verified by DNA sequencing (Cody et al., 2009). Relative to the full‐length transcript, it harbors in‐frame deletion of 159 nucleotides that is predicted to result in an absence of 59 amino acids overlapping the putative TEAD1 interaction domain in the encoded protein (Cody et al., 2009). The role of this alternative transcript is unknown, however, it was not detected in the RT‐PCR analysis of the VGLL3 expressing transfectant clones. Further studies are warranted to investigate the role of alternative transcripts and other potential cis‐acting genetic elements regulation of VGLL3 expression.
We have demonstrated that VGLL3 gene and protein expression was low or absent in the majority HGSCs. Our gene expression results are consistent with various global gene expression profiling studies of ovarian cancer specimens that include HGSCs as compared with either NOSE or FTE where different gene expression platforms were applied (Anglesio et al., 2008; Birch et al., 2008; Bonome et al., 2005; Bowen et al., 2009; Cody et al., 2007; Jiang et al., 2010; Pejovic et al., 1992; TCGA, 2011; Tung et al., 2009) (see Table S4). Our gene expression results are consistent with our immunohistochemistry expression assays of HGSCs. These results, together with the gene expression observed in NOSE and protein expression observed in FTE, which are both the purported cells of origin for HGSC (Auersperg et al., 2001; Salvador et al., 2009), suggest the intriguing possibility that VGLL3 expression is repressed in this cancer. The near ubiquitous suppression of VGLL3 may be important in the disease development as has been proposed in regards to the near ubiquitous presence of TP53 mutations in HGSCs (Singer et al., 2005). The consistent absence or low level of VGLL3 expression in clinical specimens relative to normal tissue is compatible with the notion that VGLL3 is involved in tumor suppressor pathways.
Genetic mechanisms targeting the VGLL3 locus are unlikely to account for the repression of its expression, as mutations were not identified in our HGSCs. Intragenic mutations were also not found in a recently reported whole exome sequencing analysis of 316 HGSCs by the TCGA Network (TCGA, 2011). As reported previously by our group, LOH of the VGLL3 locus was observed in 10–30% of ovarian cancer samples including HGSCs (Cody et al., 2009; Dion et al., 2000; Lounis et al., 1998; TCGA, 2011). Thus, epigenetic or other regulatory mechanisms could have affected VGLL3 expression. Notable is that hypermethylation of CpGs in the promoter region of the VGLL3 locus was not observed in our previous analysis of OV‐90 (Cody et al., 2009). Though the TCGA Network study of HGSCs examined global patterns of DNA methylation, the platform used did not have coverage of the VGLL3 locus (TCGA, 2011). Thus future studies investigating this possibility may be warranted, though the VGLL3 locus does not appear to be enriched for CpG islands (Karolchik et al., 2003).
During the course of our investigation, several groups reported amplification of the 3p12 locus with VGLL3 as the proposed target in the context of myxoinflammatory fibroblastic sarcomas (MIFS), hemosiderotic fibrolipomatous tumors (HFLT), and soft tissue sarcomas (Antonescu et al., 2011; Hallor et al., 2009; Helias‐Rodzewicz et al., 2010). One of these reports also described the inhibition of proliferation and migration of a sarcoma tumor derived cell line harboring an amplified VGLL3 locus, as a consequence of suppressing VGLL3 expression by shRNA, though the results were not statistically significant (Helias‐Rodzewicz et al., 2010). About 5% of the 404 soft tissue sarcomas examined by array‐CGH exhibited amplification of the VGLL3 locus, where the samples were largely high‐grade de‐differentiated liposarcomas or undifferentiated pleomorphic sarcomas (Helias‐Rodzewicz et al., 2010). Though the same group reported a 4.5% frequency of VGLL3 amplification by whole genome SNP array analysis of a different set of 132 sarcomas, there was no reported association with aggressivity or invasiveness of disease in this context (Helias‐Rodzewicz et al., 2010). MIFSs, rare low‐grade sarcomas that often arise in the subcutaneous tissues of distal extremities, are associated with repeated local recurrences but rarely metastasize, and exhibit a distinct morphological feature characterized by mucin‐containing pseudolipoblasts (Meis‐Kindblom and Kindblom, 1998; Montgomery et al., 1998). HFLT, which often arise in the ankles of middle‐aged women, have a propensity for local recurrences, exhibit a distinct morphology and are predominantly fatty lesions (Browne and Fletcher, 2006; Marshall–Taylor and Fanburg–Smith, 2000). The lipid‐containing vacuoles observed in HFLT resemble the unusual vacuoles that developed in our stable VGLL3‐expressing transfectant clones and lentivirus inducible system. However, the vacuoles observed in our experiments did not appear to contain lipids and fats based on the results of Oil Red O assays but are reminiscent of MVB as described in the context of the ESCRT pathway (Henne et al., 2011; Katzmann et al., 2002). As mentioned these vacuoles appeared to be a consequence of expressing VGLL3 in our cell transfection and lentiviral inducible system, have not been observed in our MMCT or chromosome 3 fragment transfer experiments nor to our knowledge appear in normal tissues such as OSE or FTE. The overall indolent nature of MIFS and HFLT is in stark contrast to the aggressive and often lethal nature of HGSCs.
Although VGLL3 is unlikely a “classical” tumor suppressor gene (TSG), there are numerous examples of transfected genes exerting tumor suppressor effects, which have not complemented somatically mutated endogenous alleles, but rather exert their effects via dosage compensation (Payne and Kemp, 2005; Santarosa and Ashworth, 2004; Smilenov, 2006). Classical TSGs have also been shown to confer susceptibility to cancer, often as a result of haploinsufficiency as consequence of a germline mutation (Berger et al., 2011). Although germline VGLL3 variants associated with hereditary syndromes have not been described, rare reports of individuals harboring hemizygous or homozygous deletions that include the VGLL3 locus have been described. At least two reports have described very rare instances of neonatal or pediatric manifestations involving facial dysmorphology, psychomotor delay, intellectual disabilities and/or pituitary hormone deficiencies (Gat‐Yablonski et al., 2011; Lalli et al., 2007). Overall lifetime cancer risk as a result of complete loss or haploinsufficiency is unknown as most reports involving structural abnormalities of 3p12 described pediatric or neonatal cases without long‐term follow‐up.
Our experiments do not exclude the possibility that other genes or microRNAs contiguous with VGLL3 chromosomal segments transferred in our MMCT assays also conferred a tumor suppressor phenotype. Our previous comparative gene expression assays of CHMP2B and CADM2, which are directly contiguous with VGLL3, in ovarian cancer specimens and normal tissues do not support a strong role for these genes as tumor suppressors in ovarian cancer (Cody et al., 2009). However, our previous chr 3p fragment transfer experiments, and transcriptome analyses from our group, suggested that GBE1 may also play a role based on gene expression analyses involving HGSCs (Birch et al., 2008; Cody et al., 2007). This is interesting in light of the observation that OVHA3‐4, which was the only other MMCT hybrid derived that had an intact GBE1 locus from donor cells, demonstrated an alteration in growth characteristics in its inability to form colonies in soft agar. This could explain the delay in in vivo tumor formation observed in assays involving OVHA3‐1 but not in the assays involving the VGLL3 expressing transfectant clones. Thus it is possible that the expression of this gene, which encodes glucan (1,4‐alpha‐) branching enzyme 1 and has been associated with glycogen storage disease type IV, may have also contributed to growth phenotypes.
As VGLL3 was expressed in NOSE and FTE cells, developing assays that would perturb its expression in this normal cell context are warranted to determine how protein function intersects tumor suppressor pathways in the OV‐90 cell line and HGSC. Thus, developing appropriate models of NOSE or FTE cells that are amenable to manipulation is warranted (Vanderhyden et al., 2003). Our research highlights the merits of genetically manipulating ovarian cancer cell line models to modify gene expression of candidate genes using genomic fragments that contain native cis‐regulatory elements. However, it was through the investigation of overexpressing VGLL3 using established methods involving cell transfection assays that unusual cellular phenotypes were revealed which could explain the inability to obtain stable high level expressing clones in a cancer cell line background. The MVB‐like structures that developed in such a context is intriguing as VGLL3 is suspected to encode a transcription co‐factor based on the presence of a sequence with similarity to a TEAD1 transcription enhancer factor interaction domain protein motif (Legent et al., 2006; Maeda et al., 2002; Vaudin et al., 1999). As VGLL3 also has an unusually long 3′UTR of 10 Kb with an unknown regulatory function, as well as encodes an alternative shorter transcript that encodes a protein lacking 53 amino acid of unknown function (Cody et al., 2009), use of reengineered BAC constructs containing the entire VGLL3 locus may prove useful in further elucidating its effect on cell growth of ovarian cancer cells.
Conflict of interest
The authors declare that there are no conflicts of interest.
Supporting information
The following are the supplementary data related to this article:
Supplementary data
Supplementary data
Supplementary data
Supplementary data
Figure S1 Cytogenetic analyses of the OVHA(3)IIaa chromosome 3 donor cells, OV‐90 recipient cell line and the OV‐90 derived MMCT hybrids (OVHA3‐1, OVHA3‐2, OVHA3‐3 and OVHA3‐4). (A) Mouse chromosome content was visualized by FISH analysis using Spectrum Orange‐labeled mouse Cot‐1 DNA (positive orange fluorescence). (B) Human chromosome 3 content was visualized by FISH analysis using FITC‐labeled whole human chr 3 painting probe (positive green fluorescence). Hybridization signals in the hybrids were consistent with presence of the transferred of the chr3p12‐cen derivative chromosome from the donor OVHA(3)IIaa cell line, (indicated by arrows). The FISH analysis also showed that the presence of at least two copies of chr 3 and two other derivatives of chr 3, where one of chr 3 arms was detectable in OV‐90 and most hybrids. These other derivative chr 3 is consistent with the presence in OV‐90 of chr 3 translocation event involving described previously chromosome 22 amplicon (Arcand et al., 2004; Provencher et al., 2000).
Figure S2 Photograph of intraperitoneal derived tumor xenografts from OV‐90 and the hybrids (OVHA3‐1, OVHA3‐2, OVHA3‐3 and OVHA3‐4) obtained at the time of sacrificed. Note that OVHA3‐1 derived tumor was less bloody than others suggesting it was less vascularized that other tumors.
Figure S3 Genetic analyses of the 3p12‐q12 region in the MMCT hybrids (OVHA3‐1, OVHA3‐2, OVHA3‐3 and OVHA3‐4). Genotypes of the MMCT hybrids, parental OV‐90 cell line and HA(3)IIaa 3p12‐q12 donor cell line based on polymorphic microsatellite markers analyses. The data is aligned according to genomic position based on Human Genome Browser Gateway hg19 assembly (genome.ucsc.edu/cgi‐bin/hgGateway) where distance (megabases (MB) is relative to 3p‐telomere. Alleles (1,2) derived from the OV‐90 were distinguished from the HA(3)IIaa (3). Alleles exhibiting imbalance are in brackets.
Figure S4 Genotyping data from SNP BeadArray analyses of OV‐90 and the MMCT hybrids (OVHA3‐1, OVHA3‐2, OVHA3‐3 and OVHA3‐4) showing copy number differences represented as Log R Ratio using the BeadStudio Data Analysis software of 3p12.3‐pcen interval aligned to chromosomal position (Mb, x‐axis). The genomic region highlighted in red is unique in copy number to OVHA3‐1 (gain of copy number) relative to other hybrids and OV‐90.
Figure S5 Characterization of tumor xenografts derived from OVHA3‐1. (A) Genotyping data from SNP BeadArray analyses showing copy number differences represented as Log R Ratio using the BeadStudio Data Analysis software of 3p aligned to chromosomal position (Mb, x‐axis) of independent derived tumor xenografts from subcutaneous (s.c.) sites from OVHA3‐1 (XT1 and XT2) and OV‐90 (XT1), and from OVHA3‐1 hybrid cell line (pre‐tumorigenecity assay). The bar highlights the location of the 3p12‐pcen region of interest. The drop in Log R ratio around 60 Mb reflects known homozygous deletion in FHIT locus described previously (Manning et al., 1999). (B) Drug selection resistance test of OVHA3‐1 subcutaneous (s.c.) xenografts tumor cells was performed with a subset tumors derived from one mouse in the OV‐90 group (XT1) and from all mice (n = 6) in the OVHA3‐1 group (XT1‐to‐XT6) that were cultured and then cultured in the presence or absence of G418 (5 days). Cells were then trypsinized and counted. (C) The capacity of the cells from subcutaneous (s.c.) tumor xenografts from OV‐90 (XT1) group and OVHA3‐1 (XT1‐to‐XT4) group cultured in the presence or absence of G418 (5 days) to form spheroids in hanging droplets was tested after 4 days (×20 magnification).
Figure S6 Oil Red O staining for intracellular lipid content of vesicles was performed on OV‐90, OV‐906/TR, OV‐90:VGLL311, OV‐90:VGLL320, OV‐90:EV2, OV‐90:EV9, OV‐906/TR‐VGLL3 and OV‐906/TR‐ccDB cells treated with doxycline (+Dox) for 10 days or not (−Dox). Differentiated Chinese Hamster Cell (CHO) fibroblasts were used as positive (shown to stained red) control. Nuclei are counterstained with hematoxylin (blue) (×40).
Figure S7 Investigating for evidence of autophagy in VGLL3‐stable clones and VGLL3‐pLenti infected OV‐90 cells. Western blot analysis of LC3‐I and LC3‐II expression in OV‐90:VGLL311, OV‐90:VGLL320, OV‐90:EV2, OV‐90:EV9 and OV‐90 (A) and in OV‐906/TR, OV‐906/TR‐VGLL3, OV‐906/TR‐ccDB cells treated with doxycycline (+Dox) for 5 days or not (−Dox). β‐actin was used as a loading control.
Figure S8 VGLL3 expression in xenograft tumors. Semi‐quantitative RT‐PCR analysis of VGLL3 of tumor xenografts derived from intraperitoneal and subcutaneous injection sites from tumorigenecity assays of OV‐90, VGLL3 expression clones (OV‐90:VGLL311 and OV‐90:VGLL320) and OV‐90 empty vector clones (OV90:Empty2 and OV90:Empty9), and from VGLL3 expression clones (OV‐90:VGLL311 and OV‐90:VGLL320) prior to tumorigenecity assays and OV‐90 transiently transfected with VGLL3‐expression vector. (T.T.). RT‐PCR assays used oligonucleotide primers that amplified a message spanning exons 1 and 2 of VGLL3, and the expression of 18S is shown as a control for RNA quality.
Figure S9 Immunofluorescence detection of VGLL3 protein in OV‐906/TR‐VGLL3 in presence (3 days) of doxycline detected using anti‐Flag (green) and anti‐VGLL3 (red) antibodies. Enlargements of original photographs (×20) are provided to facilitate the visualization of the localization of VGLL3.
Acknowledgments
We are grateful to Zhen Shen, Kim Leclerc Désaulniers, Liliane Meunier and Jason Madore for technical assistance. We thank David Englert from Alexa Incorporated for assisting with the gene expression assays involving the Ziplex® system. We thank Luca Cavallone, Ashley H. Birch, and Samuel Smillie for helpful expertise and discussion. The Research Institute of the McGill University Health Center (RI‐MUHC) and the Centre de recherche du Centre hospitalier de l'Université de Montréal received support from the Fonds de recherche du Québec‐Santé (FRQS). Clinical specimens were provided by the Banque de tissus et de données of the Réseau de recherche sur le cancer of the FRQS affiliated with the Canadian Tumor Repository Network. This research was supported by grants from the Canadian Institute of Health Research and The Terry Fox Research Institute to P.N.T., D.M.P. and A.‐M.M.‐M.
Supplementary data 1.
Appendix A.
1. Materials and methods
1.1. Cytogenetic analysis of the OV‐90 HA(3)IIaa cell lines and OVHA hybrids
The hybrids, donor and recipient cell lines were assessed for human chromosome (chr) 3 content and mouse chr content by fluorescence in situ hybridization (FISH). The following probes were used: FITC‐labeled whole human chr 3 painting probe (Cytocell Technologies, Rainbow Scientific Inc, Connecticut, USA) and Spectrum Orange‐labeled mouse cot‐1 DNA (The Centre for Applied Genomics Resource, www.tcag.ca/facilities/cytogenomicsGenome.html). Chr preparation and FISH were carried out using standard techniques. FISH analysis using the whole human chr 3 painting probe (Cytocell Technologies) was performed according to the manufacturer's instructions. For FISH using the mouse cot‐1 DNA probe, the chr preparation was denatured in 70% (v/v) formamide/2× SSC pH 7, for 2 min at 70 °C and then dehydrated in a 70%/80%/100% ethanol series at 4 °C. The probe mixture was denatured at 75 °C for 5 min and placed into a 37 °C water bath before being added onto the slide. A coverslip was then placed onto the slide and the slides incubated overnight in a humidified chamber at 37 °C. The slides were washed twice using 50% formamide/2× SSC at 42 °C for 5 min, three times in 2× SSC/0.5% Tween‐20 at 62 °C for 5 min and three times in 4× SSC/0.1% Tween‐20 at 42 °C for 5 min and allowed to air dry before adding DAPI II (Vysis FISH Technology, Abbott Molecular, Ontario, Canada) counterstain to the target area.
1.2. Geneticin sensitivity assays of tumor xenografts derived from VGLL3 expressing transfectant clones
A subset of subcutaneous tumor xenografts harvested from one mouse injected with OV‐90 (OV‐90 XT1) and from each of six mice injected with OVHA3‐1 (XT1, XT2, XT3, XT4, XT5 and XT6) were grown in culture. About 105 cells were plated in a 75 cm2 flask and cultured in presence or absence of 800 μg/ml of G418 in OSE complete medium (Wisent Inc., St‐Bruno. QC, Canada). After 8 days the cells were trypsinized and then counted.
1.3. Oil Red O staining
The lipid content of vacuoles were assayed using the Oil Red O (Alfa Aesar, Ward Hill, MA, USA) detection method essentially as described in (Fink and Zachar, 2011). Chinese hamster ovary (CHO) fibroblasts, kindly provided by Dr. Michel Tremblay, were used as positive control (DiDonato and Brasaemle, 2003; Puck et al., 1958). They were maintained in HAM's F12 medium supplemented by 10% fetal bovine serum. Lipid loading of CHO fibroblasts was assessed by adding oleic acid (400 μM) mixed to fatty acid‐free bovine serum albumin (6:1 mol of oleate:mole of albumin) for 24 h to increase the synthesis and storage of triacylglycerols (Brasaemle et al., 2000). Cells were visualized by phase contrast microscopy for the presence of red stain, which would indicate the presence of lipids.
Appendix A.
Supplementary data related to this article can be found at http://dx.doi.org/10.1016/j.molonc.2012.12.006.
Gambaro Karen, Quinn Michael C.J., Wojnarowicz Paulina M., Arcand Suzanna L., de Ladurantaye Manon, Barrès Véronique, Ripeau Jean-Sébastien, Killary Ann M., Davis Elaine C., Lavoie Josée, Provencher Diane M., Mes-Masson Anne-Marie, Chevrette Mario, Tonin Patricia N., (2013), VGLL3 expression is associated with a tumor suppressor phenotype in epithelial ovarian cancer, Molecular Oncology, 7, doi: 10.1016/j.molonc.2012.12.006.
References
- Ahmed, A.A. , Etemadmoghadam, D. , Temple, J. , Lynch, A.G. , Riad, M. , Sharma, R. , Stewart, C. , Fereday, S. , Caldas, C. , Defazio, A. , Bowtell, D. , Brenton, J.D. , 2010. Driver mutations in TP53 are ubiquitous in high grade serous carcinoma of the ovary. J. Pathol. 221, 49–56. [DOI] [PMC free article] [PubMed] [Google Scholar]
- Aletti, G.D. , Gallenberg, M.M. , Cliby, W.A. , Jatoi, A. , Hartmann, L.C. , 2007. Current management strategies for ovarian cancer. Mayo Clin. Proc. 82, 751–770. [DOI] [PubMed] [Google Scholar]
- Anglesio, M.S. , Arnold, J.M. , George, J. , Tinker, A.V. , Tothill, R. , Waddell, N. , Simms, L. , Locandro, B. , Fereday, S. , Traficante, N. , Russell, P. , Sharma, R. , Birrer, M.J. , deFazio, A. , Chenevix-Trench, G. , Bowtell, D.D. , 2008. Mutation of ERBB2 provides a novel alternative mechanism for the ubiquitous activation of RAS-MAPK in ovarian serous low malignant potential tumors. Mol. Cancer Res. 6, 1678–1690. [DOI] [PMC free article] [PubMed] [Google Scholar]
- Antonescu, C.R. , Zhang, L. , Nielsen, G.P. , Rosenberg, A.E. , Dal Cin, P. , Fletcher, C.D. , 2011. Consistent t(1;10) with rearrangements of TGFBR3 and MGEA5 in both myxoinflammatory fibroblastic sarcoma and hemosiderotic fibrolipomatous tumor. Genes Chromosomes Cancer 50, 757–764. [DOI] [PMC free article] [PubMed] [Google Scholar]
- Arcand, S.L. , Mes-Masson, A.M. , Provencher, D. , Hudson, T.J. , Tonin, P.N. , 2004. Gene expression microarray analysis and genome databases facilitate the characterization of a chromosome 22 derived homogeneously staining region. Mol. Carcinog 41, 17–38. [DOI] [PubMed] [Google Scholar]
- Auersperg, N. , Wong, A.S. , Choi, K.C. , Kang, S.K. , Leung, P.C. , 2001. Ovarian surface epithelium: biology, endocrinology, and pathology. Endocr. Rev. 22, 255–288. [DOI] [PubMed] [Google Scholar]
- Berger, A.H. , Knudson, A.G. , Pandolfi, P.P. , 2011. A continuum model for tumour suppression. Nature 476, 163–169. [DOI] [PMC free article] [PubMed] [Google Scholar]
- Birch, A.H. , Quinn, M.C. , Filali-Mouhim, A. , Provencher, D.M. , Mes-Masson, A.M. , Tonin, P.N. , 2008. Transcriptome analysis of serous ovarian cancers identifies differentially expressed chromosome 3 genes. Mol. Carcinog. 47, 56–65. [DOI] [PubMed] [Google Scholar]
- Birch, A.H. , Arcand, S.L. , Oros, K.K. , Rahimi, K. , Watters, A.K. , Provencher, D. , Greenwood, C.M. , Mes-Masson, A.M. , Tonin, P.N. , 2011. Chromosome 3 anomalies investigated by genome wide SNP analysis of benign, low malignant potential and low grade ovarian serous tumours. PLoS One 6, e28250 [DOI] [PMC free article] [PubMed] [Google Scholar]
- Bonome, T. , Lee, J.Y. , Park, D.C. , Radonovich, M. , Pise-Masison, C. , Brady, J. , Gardner, G.J. , Hao, K. , Wong, W.H. , Barrett, J.C. , Lu, K.H. , Sood, A.K. , Gershenson, D.M. , Mok, S.C. , Birrer, M.J. , 2005. Expression profiling of serous low malignant potential, low-grade, and high-grade tumors of the ovary. Cancer Res. 65, 10602–10612. [DOI] [PubMed] [Google Scholar]
- Bowen, N.J. , Walker, L.D. , Matyunina, L.V. , Logani, S. , Totten, K.A. , Benigno, B.B. , McDonald, J.F. , 2009. Gene expression profiling supports the hypothesis that human ovarian surface epithelia are multipotent and capable of serving as ovarian cancer initiating cells. BMC Med. Genomics 2, 71 [DOI] [PMC free article] [PubMed] [Google Scholar]
- Brasaemle, D.L. , Rubin, B. , Harten, I.A. , Gruia-Gray, J. , Kimmel, A.R. , Londos, C. , 2000. Perilipin A increases triacylglycerol storage by decreasing the rate of triacylglycerol hydrolysis. J. Biol. Chem. 275, 38486–38493. [DOI] [PubMed] [Google Scholar]
- Browne, T.J. , Fletcher, C.D. , 2006. Haemosiderotic fibrolipomatous tumour (so-called haemosiderotic fibrohistiocytic lipomatous tumour): analysis of 13 new cases in support of a distinct entity. Histopathology 48, 453–461. [DOI] [PubMed] [Google Scholar]
- Campeau, E. , Ruhl, V.E. , Rodier, F. , Smith, C.L. , Rahmberg, B.L. , Fuss, J.O. , Campisi, J. , Yaswen, P. , Cooper, P.K. , Kaufman, P.D. , 2009. A versatile viral system for expression and depletion of proteins in mammalian cells. PLoS One 4, e6529 [DOI] [PMC free article] [PubMed] [Google Scholar]
- Chen, V.W. , Ruiz, B. , Killeen, J.L. , Cote, T.R. , Wu, X.C. , Correa, C.N. , 2003. Pathology and classification of ovarian tumors. Cancer 97, 2631–2642. [DOI] [PubMed] [Google Scholar]
- Codogno, P. , Mehrpour, M. , Proikas-Cezanne, T. , 2011. Canonical and non-canonical autophagy: variations on a common theme of self-eating?. Nat. Rev. Mol. Cell. Biol. 13, 7–12. [DOI] [PubMed] [Google Scholar]
- Cody, N.A. , Ouellet, V. , Manderson, E.N. , Quinn, M.C. , Filali-Mouhim, A. , Tellis, P. , Zietarska, M. , Provencher, D.M. , Mes-Masson, A.M. , Chevrette, M. , Tonin, P.N. , 2007. Transfer of chromosome 3 fragments suppresses tumorigenicity of an ovarian cancer cell line monoallelic for chromosome 3p. Oncogene 26, 618–632. [DOI] [PubMed] [Google Scholar]
- Cody, N.A. , Shen, Z. , Ripeau, J.S. , Provencher, D.M. , Mes-Masson, A.M. , Chevrette, M. , Tonin, P.N. , 2009. Characterization of the 3p12.3-pcen region associated with tumor suppression in a novel ovarian cancer cell line model genetically modified by chromosome 3 fragment transfer. Mol. Carcinog. 48, 1077–1092. [DOI] [PubMed] [Google Scholar]
- DiDonato, D. , Brasaemle, D.L. , 2003. Fixation methods for the study of lipid droplets by immunofluorescence microscopy. J. Histochem. Cytochem. 51, 773–780. [DOI] [PubMed] [Google Scholar]
- Dion, F. , Mes-Masson, A.M. , Seymour, R.J. , Provencher, D. , Tonin, P.N. , 2000. Allelotyping defines minimal imbalance at chromosomal region 17q25 in non-serous epithelial ovarian cancers. Oncogene 19, 1466–1472. [DOI] [PubMed] [Google Scholar]
- Fink, T. , Zachar, V. , 2011. Adipogenic differentiation of human mesenchymal stem cells. Methods Mol. Biol. 698, 243–251. [DOI] [PubMed] [Google Scholar]
- Gat-Yablonski, G. , Frumkin-Ben David, R. , Bar, M. , Potievsky, O. , Phillip, M. , Lazar, L. , 2011. Homozygous microdeletion of the POU1F1, CHMP2B, and VGLL3 genes in chromosome 3 – A novel syndrome. Am. J. Med. Genet. A 155A, 2242–2246. [DOI] [PubMed] [Google Scholar]
- Gorringe, K.L. , Campbell, I.G. , 2009. Large-scale genomic analysis of ovarian carcinomas. Mol. Oncol. 3, 157–164. [DOI] [PMC free article] [PubMed] [Google Scholar]
- Hallor, K.H. , Sciot, R. , Staaf, J. , Heidenblad, M. , Rydholm, A. , Bauer, H.C. , Astrom, K. , Domanski, H.A. , Meis, J.M. , Kindblom, L.G. , Panagopoulos, I. , Mandahl, N. , Mertens, F. , 2009. Two genetic pathways, t(1;10) and amplification of 3p11-12, in myxoinflammatory fibroblastic sarcoma, haemosiderotic fibrolipomatous tumour, and morphologically similar lesions. J. Pathol. 217, 716–727. [DOI] [PubMed] [Google Scholar]
- Helias-Rodzewicz, Z. , Perot, G. , Chibon, F. , Ferreira, C. , Lagarde, P. , Terrier, P. , Coindre, J.M. , Aurias, A. , 2010. YAP1 and VGLL3, encoding two cofactors of TEAD transcription factors, are amplified and overexpressed in a subset of soft tissue sarcomas. Genes Chromosomes Cancer 49, 1161–1171. [DOI] [PubMed] [Google Scholar]
- Henne, W.M. , Buchkovich, N.J. , Emr, S.D. , 2011. The ESCRT pathway. Dev. Cell. 21, 77–91. [DOI] [PubMed] [Google Scholar]
- Jiang, X. , Zhu, T. , Yang, J. , Li, S. , Ye, S. , Liao, S. , Meng, L. , Lu, Y. , Ma, D. , 2010. Identification of novel epithelial ovarian cancer biomarkers by cross-laboratory microarray analysis. J. Huazhong Univ. Sci. Technolog. Med. Sci. 30, 354–359. [DOI] [PubMed] [Google Scholar]
- Kabeya, Y. , Mizushima, N. , Yamamoto, A. , Oshitani-Okamoto, S. , Ohsumi, Y. , Yoshimori, T. , 2004. LC3, GABARAP and GATE16 localize to autophagosomal membrane depending on form-II formation. J. Cell. Sci. 117, 2805–2812. [DOI] [PubMed] [Google Scholar]
- Karolchik, D. , Baertsch, R. , Diekhans, M. , Furey, T.S. , Hinrichs, A. , Lu, Y.T. , Roskin, K.M. , Schwartz, M. , Sugnet, C.W. , Thomas, D.J. , Weber, R.J. , Haussler, D. , Kent, W.J. , 2003. The UCSC genome browser database. Nucleic Acids Res. 31, 51–54. [DOI] [PMC free article] [PubMed] [Google Scholar]
- Katzmann, D.J. , Odorizzi, G. , Emr, S.D. , 2002. Receptor downregulation and multivesicular-body sorting. Nat. Rev. Mol. Cell. Biol. 3, 893–905. [DOI] [PubMed] [Google Scholar]
- Killary, A.M. , Wolf, M.E. , Giambernardi, T.A. , Naylor, S.L. , 1992. Definition of a tumor suppressor locus within human chromosome 3p21-p22. Proc. Natl. Acad. Sci. USA 89, 10877–10881. [DOI] [PMC free article] [PubMed] [Google Scholar]
- Lalli, C. , Galasso, C. , Lo Castro, A. , Nardone, A.M. , Di Paolo, A. , Curatolo, P. , 2007. Interstitial deletion of a proximal 3p: a clinically recognisable syndrome. Brain Dev. 29, 312–316. [DOI] [PubMed] [Google Scholar]
- Legent, K. , Dutriaux, A. , Delanoue, R. , Silber, J. , 2006. Cell cycle genes regulate vestigial and scalloped to ensure normal proliferation in the wing disc of Drosophila melanogaster . Genes Cells 11, 907–918. [DOI] [PubMed] [Google Scholar]
- Lott, S.T. , Lovell, M. , Naylor, S.L. , Killary, A.M. , 1998. Physical and functional mapping of a tumor suppressor locus for renal cell carcinoma within chromosome 3p12. Cancer Res. 58, 3533–3537. [PubMed] [Google Scholar]
- Lounis, H. , Mes-Masson, A.M. , Dion, F. , Bradley, W.E. , Seymour, R.J. , Provencher, D. , Tonin, P.N. , 1998. Mapping of chromosome 3p deletions in human epithelial ovarian tumors. Oncogene 17, 2359–2365. [DOI] [PubMed] [Google Scholar]
- Maeda, T. , Chapman, D.L. , Stewart, A.F. , 2002. Mammalian vestigial-like 2, a cofactor of TEF-1 and MEF2 transcription factors that promotes skeletal muscle differentiation. J. Biol. Chem. 277, 48889–48898. [DOI] [PubMed] [Google Scholar]
- Manderson, E.N. , Presneau, N. , Provencher, D. , Mes-Masson, A.M. , Tonin, P.N. , 2002. Comparative analysis of loss of heterozygosity of specific chromosome 3, 13, 17, and X loci and TP53 mutations in human epithelial ovarian cancer. Mol. Carcinog. 34, 78–90. [DOI] [PubMed] [Google Scholar]
- Manning, A.P. , Mes-Masson, A.M. , Seymour, R.J. , Tetrault, M. , Provencher, D.M. , Tonin, P.N. , 1999. Expression of FHIT in primary cultures of human epithelial ovarian tumors and malignant ovarian ascites. Mol. Carcinog. 24, 218–225. [DOI] [PubMed] [Google Scholar]
- Marshall-Taylor, C. , Fanburg-Smith, J.C. , 2000. Fibrohistiocytic lipoma: twelve cases of a previously undescribed benign fatty tumor. Ann. Diagn. Pathol. 4, 354–360. [DOI] [PubMed] [Google Scholar]
- Meis-Kindblom, J.M. , Kindblom, L.G. , 1998. Acral myxoinflammatory fibroblastic sarcoma: a low-grade tumor of the hands and feet. Am. J. Surg. Pathol. 22, 911–924. [DOI] [PubMed] [Google Scholar]
- Montgomery, E.A. , Devaney, K.O. , Giordano, T.J. , Weiss, S.W. , 1998. Inflammatory myxohyaline tumor of distal extremities with virocyte or Reed-Sternberg-like cells: a distinctive lesion with features simulating inflammatory conditions, Hodgkin's disease, and various sarcomas. Mod. Pathol. 11, 384–391. [PubMed] [Google Scholar]
- Payne, S.R. , Kemp, C.J. , 2005. Tumor suppressor genetics. Carcinogenesis 26, 2031–2045. [DOI] [PubMed] [Google Scholar]
- Pejovic, T. , Himmelmann, A. , Heim, S. , Mandahl, N. , Floderus, U.M. , Furgyik, S. , Elmfors, B. , Helm, G. , Willen, H. , Mitelman, F. , 1992. Prognostic impact of chromosome aberrations in ovarian cancer. Br. J. Cancer 65, 282–286. [DOI] [PMC free article] [PubMed] [Google Scholar]
- Presneau, N. , Mes-Masson, A.M. , Ge, B. , Provencher, D. , Hudson, T.J. , Tonin, P.N. , 2003. Patterns of expression of chromosome 17 genes in primary cultures of normal ovarian surface epithelia and epithelial ovarian cancer cell lines. Oncogene 22, 1568–1579. [DOI] [PubMed] [Google Scholar]
- Provencher, D.M. , Lounis, H. , Champoux, L. , Tetrault, M. , Manderson, E.N. , Wang, J.C. , Eydoux, P. , Savoie, R. , Tonin, P.N. , Mes-Masson, A.M. , 2000. Characterization of four novel epithelial ovarian cancer cell lines. In Vitro Cell. Dev. Biol. Anim. 36, 357–361. [DOI] [PubMed] [Google Scholar]
- Puck, T.T. , Cieciura, S.J. , Robinson, A. , 1958. Genetics of somatic mammalian cells. III. Long-term cultivation of euploid cells from human and animal subjects. J. Exp. Med. 108, 945–956. [DOI] [PMC free article] [PubMed] [Google Scholar]
- Quinn, M.C. , Filali-Mouhim, A. , Provencher, D.M. , Mes-Masson, A.M. , Tonin, P.N. , 2009. Reprogramming of the transcriptome in a novel chromosome 3 transfer tumor suppressor ovarian cancer cell line model affected molecular networks that are characteristic of ovarian cancer. Mol. Carcinog. 48, 648–661. [DOI] [PubMed] [Google Scholar]
- Quinn, M.C. , Wilson, D.J. , Young, F. , Dempsey, A.A. , Arcand, S.L. , Birch, A.H. , Wojnarowicz, P.M. , Provencher, D. , Mes-Masson, A.M. , Englert, D. , Tonin, P.N. , 2009. The chemiluminescence based Ziplex automated workstation focus array reproduces ovarian cancer Affymetrix GeneChip expression profiles. J. Transl. Med. 7, 55 [DOI] [PMC free article] [PubMed] [Google Scholar]
- Salvador, S. , Gilks, B. , Kobel, M. , Huntsman, D. , Rosen, B. , Miller, D. , 2009. The fallopian tube: primary site of most pelvic high-grade serous carcinomas. Int. J. Gynecol. Cancer 19, 58–64. [DOI] [PubMed] [Google Scholar]
- Sanchez, Y. , el-Naggar, A. , Pathak, S. , Killary, A.M. , 1994. A tumor suppressor locus within 3p14-p12 mediates rapid cell death of renal cell carcinoma in vivo. Proc. Natl. Acad. Sci. USA 91, 3383–3387. [DOI] [PMC free article] [PubMed] [Google Scholar]
- Santarosa, M. , Ashworth, A. , 2004. Haploinsufficiency for tumour suppressor genes: when you don't need to go all the way. Biochim. Biophys. Acta 1654, 105–122. [DOI] [PubMed] [Google Scholar]
- Schneider, C.A. , Rasband, W.S. , Eliceiri, K.W. , 2012. NIH Image to ImageJ: 25 years of image analysis. Nat. Methods 9, 671–675. [DOI] [PMC free article] [PubMed] [Google Scholar]
- Seidman, J.D. , Horkayne-Szakaly, I. , Haiba, M. , Boice, C.R. , Kurman, R.J. , Ronnett, B.M. , 2004. The histologic type and stage distribution of ovarian carcinomas of surface epithelial origin. Int. J. Gynecol. Pathol. 23, 41–44. [DOI] [PubMed] [Google Scholar]
- Singer, G. , Stohr, R. , Cope, L. , Dehari, R. , Hartmann, A. , Cao, D.F. , Wang, T.L. , Kurman, R.J. , Shih Ie, M. , 2005. Patterns of p53 mutations separate ovarian serous borderline tumors and low- and high-grade carcinomas and provide support for a new model of ovarian carcinogenesis: a mutational analysis with immunohistochemical correlation. Am. J. Surg. Pathol. 29, 218–224. [DOI] [PubMed] [Google Scholar]
- Smilenov, L.B. , 2006. Tumor development: haploinsufficiency and local network assembly. Cancer Lett. 240, 17–28. [DOI] [PubMed] [Google Scholar]
- TCGA, 2011. Integrated genomic analyses of ovarian carcinoma. Nature 474, 609–615. [DOI] [PMC free article] [PubMed] [Google Scholar]
- Therasse, P. , Arbuck, S.G. , Eisenhauer, E.A. , Wanders, J. , Kaplan, R.S. , Rubinstein, L. , Verweij, J. , Van Glabbeke, M. , van Oosterom, A.T. , Christian, M.C. , Gwyther, S.G. , 2000. New guidelines to evaluate the response to treatment in solid tumors. European Organization for Research and Treatment of Cancer, National Cancer Institute of the United States, National Cancer Institute of Canada. J. Natl. Cancer Inst. 92, 205–216. [DOI] [PubMed] [Google Scholar]
- Tung, C.S. , Mok, S.C. , Tsang, Y.T. , Zu, Z. , Song, H. , Liu, J. , Deavers, M.T. , Malpica, A. , Wolf, J.K. , Lu, K.H. , Gershenson, D.M. , Wong, K.K. , 2009. PAX2 expression in low malignant potential ovarian tumors and low-grade ovarian serous carcinomas. Mod. Pathol. 22, 1243–1250. [DOI] [PMC free article] [PubMed] [Google Scholar]
- Vanderhyden, B.C. , Shaw, T.J. , Ethier, J.F. , 2003. Animal models of ovarian cancer. Reprod. Biol. Endocrinol. 1, 67 [DOI] [PMC free article] [PubMed] [Google Scholar]
- Vaudin, P. , Delanoue, R. , Davidson, I. , Silber, J. , Zider, A. , 1999. TONDU (TDU), a novel human protein related to the product of vestigial (vg) gene of Drosophila melanogaster interacts with vertebrate TEF factors and substitutes for Vg function in wing formation. Development 126, 4807–4816. [DOI] [PubMed] [Google Scholar]
- Wang, L. , Lu, W. , Chen, Y.G. , Zhou, X.M. , Gu, J.R. , 1999. Comparison of gene expression between normal colon mucosa and colon carcinoma by means of messenger RNA differential display. World J. Gastroenterol. 5, 533–534. [DOI] [PMC free article] [PubMed] [Google Scholar]
- Wojnarowicz, P. , Gambaro, K. , de Ladurantaye, M. , Quinn, M.C.J. , Provencher, D. , Mes-Masson, A.-M. , Tonin, P.N. , 2012. Overexpressing the CCL2 chemokine in an epithelial ovarian cancer cell line results in latency of in vivo tumourigenicity. Oncogenesis 1, [DOI] [PMC free article] [PubMed] [Google Scholar]
- Wojnarowicz, P.M. , Oros, K.K. , Quinn, M.C.J. , Arcand, S.L. , Gambaro, K. , Madore, J. , Birch, A.H. , de Ladurantaye, M. , Rahimi, K. , Provencher, D.M. , Mes-Masson, A.-M. , Greenwood, C.M.T. , Tonin, P.N. , 2012. The genomic landscape of TP53 and p53 annotated high grade ovarian serous carcinomas from a defined founder population associated with patient outcome. PLoS ONE 7, [DOI] [PMC free article] [PubMed] [Google Scholar]
- Zhang, K. , Lott, S.T. , Jin, L. , Killary, A.M. , 2007. Fine mapping of the NRC-1 tumor suppressor locus within chromosome 3p12. Biochem. Biophys. Res. Commun. 360, 531–538. [DOI] [PubMed] [Google Scholar]
- Zietarska, M. , Maugard, C.M. , Filali-Mouhim, A. , Alam-Fahmy, M. , Tonin, P.N. , Provencher, D.M. , Mes-Masson, A.M. , 2007. Molecular description of a 3D in vitro model for the study of epithelial ovarian cancer (EOC). Mol. Carcinog. 46, 872–885. [DOI] [PubMed] [Google Scholar]
Associated Data
This section collects any data citations, data availability statements, or supplementary materials included in this article.
Supplementary Materials
The following are the supplementary data related to this article:
Supplementary data
Supplementary data
Supplementary data
Supplementary data
Figure S1 Cytogenetic analyses of the OVHA(3)IIaa chromosome 3 donor cells, OV‐90 recipient cell line and the OV‐90 derived MMCT hybrids (OVHA3‐1, OVHA3‐2, OVHA3‐3 and OVHA3‐4). (A) Mouse chromosome content was visualized by FISH analysis using Spectrum Orange‐labeled mouse Cot‐1 DNA (positive orange fluorescence). (B) Human chromosome 3 content was visualized by FISH analysis using FITC‐labeled whole human chr 3 painting probe (positive green fluorescence). Hybridization signals in the hybrids were consistent with presence of the transferred of the chr3p12‐cen derivative chromosome from the donor OVHA(3)IIaa cell line, (indicated by arrows). The FISH analysis also showed that the presence of at least two copies of chr 3 and two other derivatives of chr 3, where one of chr 3 arms was detectable in OV‐90 and most hybrids. These other derivative chr 3 is consistent with the presence in OV‐90 of chr 3 translocation event involving described previously chromosome 22 amplicon (Arcand et al., 2004; Provencher et al., 2000).
Figure S2 Photograph of intraperitoneal derived tumor xenografts from OV‐90 and the hybrids (OVHA3‐1, OVHA3‐2, OVHA3‐3 and OVHA3‐4) obtained at the time of sacrificed. Note that OVHA3‐1 derived tumor was less bloody than others suggesting it was less vascularized that other tumors.
Figure S3 Genetic analyses of the 3p12‐q12 region in the MMCT hybrids (OVHA3‐1, OVHA3‐2, OVHA3‐3 and OVHA3‐4). Genotypes of the MMCT hybrids, parental OV‐90 cell line and HA(3)IIaa 3p12‐q12 donor cell line based on polymorphic microsatellite markers analyses. The data is aligned according to genomic position based on Human Genome Browser Gateway hg19 assembly (genome.ucsc.edu/cgi‐bin/hgGateway) where distance (megabases (MB) is relative to 3p‐telomere. Alleles (1,2) derived from the OV‐90 were distinguished from the HA(3)IIaa (3). Alleles exhibiting imbalance are in brackets.
Figure S4 Genotyping data from SNP BeadArray analyses of OV‐90 and the MMCT hybrids (OVHA3‐1, OVHA3‐2, OVHA3‐3 and OVHA3‐4) showing copy number differences represented as Log R Ratio using the BeadStudio Data Analysis software of 3p12.3‐pcen interval aligned to chromosomal position (Mb, x‐axis). The genomic region highlighted in red is unique in copy number to OVHA3‐1 (gain of copy number) relative to other hybrids and OV‐90.
Figure S5 Characterization of tumor xenografts derived from OVHA3‐1. (A) Genotyping data from SNP BeadArray analyses showing copy number differences represented as Log R Ratio using the BeadStudio Data Analysis software of 3p aligned to chromosomal position (Mb, x‐axis) of independent derived tumor xenografts from subcutaneous (s.c.) sites from OVHA3‐1 (XT1 and XT2) and OV‐90 (XT1), and from OVHA3‐1 hybrid cell line (pre‐tumorigenecity assay). The bar highlights the location of the 3p12‐pcen region of interest. The drop in Log R ratio around 60 Mb reflects known homozygous deletion in FHIT locus described previously (Manning et al., 1999). (B) Drug selection resistance test of OVHA3‐1 subcutaneous (s.c.) xenografts tumor cells was performed with a subset tumors derived from one mouse in the OV‐90 group (XT1) and from all mice (n = 6) in the OVHA3‐1 group (XT1‐to‐XT6) that were cultured and then cultured in the presence or absence of G418 (5 days). Cells were then trypsinized and counted. (C) The capacity of the cells from subcutaneous (s.c.) tumor xenografts from OV‐90 (XT1) group and OVHA3‐1 (XT1‐to‐XT4) group cultured in the presence or absence of G418 (5 days) to form spheroids in hanging droplets was tested after 4 days (×20 magnification).
Figure S6 Oil Red O staining for intracellular lipid content of vesicles was performed on OV‐90, OV‐906/TR, OV‐90:VGLL311, OV‐90:VGLL320, OV‐90:EV2, OV‐90:EV9, OV‐906/TR‐VGLL3 and OV‐906/TR‐ccDB cells treated with doxycline (+Dox) for 10 days or not (−Dox). Differentiated Chinese Hamster Cell (CHO) fibroblasts were used as positive (shown to stained red) control. Nuclei are counterstained with hematoxylin (blue) (×40).
Figure S7 Investigating for evidence of autophagy in VGLL3‐stable clones and VGLL3‐pLenti infected OV‐90 cells. Western blot analysis of LC3‐I and LC3‐II expression in OV‐90:VGLL311, OV‐90:VGLL320, OV‐90:EV2, OV‐90:EV9 and OV‐90 (A) and in OV‐906/TR, OV‐906/TR‐VGLL3, OV‐906/TR‐ccDB cells treated with doxycycline (+Dox) for 5 days or not (−Dox). β‐actin was used as a loading control.
Figure S8 VGLL3 expression in xenograft tumors. Semi‐quantitative RT‐PCR analysis of VGLL3 of tumor xenografts derived from intraperitoneal and subcutaneous injection sites from tumorigenecity assays of OV‐90, VGLL3 expression clones (OV‐90:VGLL311 and OV‐90:VGLL320) and OV‐90 empty vector clones (OV90:Empty2 and OV90:Empty9), and from VGLL3 expression clones (OV‐90:VGLL311 and OV‐90:VGLL320) prior to tumorigenecity assays and OV‐90 transiently transfected with VGLL3‐expression vector. (T.T.). RT‐PCR assays used oligonucleotide primers that amplified a message spanning exons 1 and 2 of VGLL3, and the expression of 18S is shown as a control for RNA quality.
Figure S9 Immunofluorescence detection of VGLL3 protein in OV‐906/TR‐VGLL3 in presence (3 days) of doxycline detected using anti‐Flag (green) and anti‐VGLL3 (red) antibodies. Enlargements of original photographs (×20) are provided to facilitate the visualization of the localization of VGLL3.