

Abstract
Colorectal cancer (CRC) is a heterogeneous disease in terms of clinical behavior and response to therapy. Increasing evidence suggests that long noncoding RNAs (lncRNAs) are frequently aberrantly expressed in cancers, and some of them have been implicated in CRC biogenesis and prognosis. Using an lncRNA‐mining approach, we constructed lncRNAs expression profiles in approximately 888 CRC samples. By applying unsupervised consensus clustering to LncRNA expression profiles, we identified five distinct molecular subtypes of CRC with different biological pathways and phenotypically distinct in their clinical outcome in both univariate and multivariate analysis. The prognostic significance of the lncRNA‐based classifier was confirmed in independent patient cohorts. Further analysis revealed that most of the signature lncRNAs positively correlated with somatic copy number alterations (SCNAs). This lncRNAs‐based classification schema thus provides a molecular classification applicable to individual tumors that has implications to influence treatment decisions.
Keywords: lncRNA, Consensus clustering, Colorectal cancer, Gene expression profiling, Somatic copy number alterations, Survival, Gene set enrichment analysis
Highlights
lncRNAs based consensus clustering classified into five molecular subtypes of CRC.
The biological pathways are differentiating between each subtypes.
Phenotypically distinct clinical outcome of five subtypes was observed.
The classifier lncRNAs positively correlations with their corresponding CNAs.

1. Introduction
Colorectal cancer (CRC) is the third most commonly diagnosed cancer with an estimated 50,000 deaths per year in the United States (Siegel et al., 2014). The current AJCC TNM histopathological classification system has offered a valuable basis for defining groups of patients for clinical assessment, and predicts the clinical behavior of the respective neoplasm with direct impact on the applied treatment regimes (Marisa et al., 2013; O'Connell et al., 2004). A remarkable feature of CRC is the difference in prognosis of the early and late stages of the disease: stage I and II have moderate risk of relapse after surgical resection, whereas patients with stage III have a higher chance of recurrence. Recognized clinical risk factors for recurrence are emergency presentation, poorly differentiated tumor, depth of tumor invasion, and adjacent organ involvement (T4) (Dotan and Cohen, 2011; Gill et al., 2004; McMillan et al., 2010). However, these factors are insufficient to identify those patients with stage II CRC at high risk of recurrence and posterior metastasis or those patients with stage III CRC at low risk (Dotan and Cohen, 2011), leading to potential under‐treatment or over‐treatment (Gill et al., 2004).
Molecular markers such as mutations in Kirsten ras gene (KRAS) and BRAF as well as chromosome and microsatellite instability (MSI) have been systematically analyzed for prognostic potential in CRC. So far, only KRAS mutation analysis has been used in clinical practice as a predictive marker for the effect of EGFR antibodies in metastatic disease (Farina‐Sarasqueta et al., 2010; Popat et al., 2005; Roth et al., 2010; Walther et al., 2008). Gene‐expression profiling‐based assays have been successful as prognostic tool in breast cancer (Prat and Perou, 2011; Reis‐Filho and Pusztai, 2011; Weigelt et al., 2010). However, no signature has been adopted in routine clinical practice in CRC despite a large number of gene expression profiling studies on prognosis have been performed (De Sousa et al., 2013; Marisa et al., 2013; Sadanandam et al., 2013; Sanz‐Pamplona et al., 2012). Currently, the roles of dysregulated functional long non‐coding RNAs (lncRNAs) in human cancers have received considerable attention (Gibb et al., 2011; Mercer et al., 2009; Mitra et al., 2012; Prensner and Chinnaiyan, 2011; Villegas et al., 2014). LncRNAs are mRNA‐like transcripts ranging in length from 200 nucleotides (nt) to ∼100 kilobases (kb) that lack significant protein‐coding abilities (Lipovich et al., 2010; Mercer et al., 2009). Increasing evidence suggests that these transcripts are frequently aberrantly expressed in cancers, and some of them have been implicated in diagnosis and prognostication (Qi and Du, 2013). As lncRNAs do not encode proteins, their functions are closely associated with their transcript abundance (Du et al., 2013). It has been reported that lncRNAs demonstrated higher specificity than protein‐coding mRNAs (Hessels et al., 2003; Prensner et al., 2011), and had the advantages of being detectable in the blood (Lin et al., 2007) and urine (Hessels et al., 2003; Tinzl et al., 2004) of cancer patients by conventional PCR methods. Several mRNA expression based molecular classification systems have been established for CRC (Budinska et al., 2013; De Sousa et al., 2013; Marisa et al., 2013; Sadanandam et al., 2013; Wang et al., 2013). The perturbation of lncRNA expression can result in the development and progression of CRC (Ge et al., 2013; Li et al., 2013), whereas few approaches take the lncRNA molecular abnormalities into consideration.
Currently, lncRNA profiles in most human cancers remain largely unknown, mainly due to the lack of such arrays. Previous study demonstrated that lncRNA profiling could be achieved by mining previously published gene expression microarray data because a large group of lncRNA‐specific probes were fortuitously represented on the commonly used microarray platforms (Du et al., 2013; Li et al., 2014). In the present study, GATExplorer (Genomic and Transcriptomic Explorer) (Risueno et al., 2010) was used to process microarrays on a local computer for gene expressions of lncRNAs profiling on a cohort of 556 patients from GSE39582 as well as three independent datasets from the Gene Expression Omnibus (GEO). By applying unsupervised consensus clustering on LncRNA expression profiles, we identified five distinct molecular subtypes of CRC with differentiating biological signatures, which could be distinguished using Gene Set Enrichment Analysis (GSEA) and are also phenotypically distinct in their DFS (disease free survival) in both univariate and multivariate analysis.
2. Materials and methods
2.1. CRC datasets preparation
Microarray data from GSE39582, GSE17536/GSE17537, GSE14333 and GSE33113 databases were directly downloaded from Gene Expression Omnibus (http://www.ncbi.nlm.nih.gov/geo/). These datasets corresponded to all available public datasets fulfilling the following criteria: available gene expression data obtained using the same chip platform (Affymetrix U133 Plus 2.0 chips) with raw data CEL files, and patient outcome data available. After initial quality check, the majority samples in GSE14333 were overlapping with GSE17536/GSE17537, which were not included in the further analysis. The CRC samples in GSE39582 were split into a discovery set (n = 443) and an internal validation set (n = 123) as described before (Marisa et al., 2013). Within the discovery (n = 443) and the validation (n = 445) sets, 359 and 336 patients with stage II–IIICC and documented relapse‐free survival (RFS) were available for survival analysis, respectively.
2.2. Microarray data processing and lncRNA profile mining
The raw CEL files were downloaded from GEO database and background adjusted using Robust Multichip Average. GATExplorer (Risueno et al., 2010) was used to process microarrays on a local computer for gene expressions of lncRNAs. This GATExplorer provides a series of R packages, designed to be used with BioConductor tools, that allow to apply in a simple way the probe mapping data included in GATExplorer. A type of files called ncRNA Mapper were also obtained from GATExplorer, which include the probes that do not map to any coding region but that were mapped to a database for non‐coding RNA of human and mouse derived from RNAdb (Pang et al., 2007). A customized R scripts was used to perform a microarray expression calculation according to the re‐mapping data (file ncrnamapperhgu133plus2cdf_3.0). Each LncRNA should include at least a minimum of 3 probes mapping in the corresponding ncRNAs entity. In our previous work (Hu et al., 2014), we have also validated this re‐annotation method using experimental procedures. Six lncRNAs that were extracted by re‐annotation of microarrays were experimentally validated by RT‐qPCR in our CRC tissue samples, and the results were highly consistent with the microarray‐derived data.
2.3. NearestTemplatePrediction algorithm
We used the NearestTemplatePrediction (NTP) algorithm (Hoshida, 2010) from GenePattern to predict the class of a given sample by a predefined set of markers that are specific to each subtype.
2.4. Molecular subtype characterization
The published supervised signatures including Stem cell signature up regulated tumors (Merlos‐Suarez et al., 2011), Cell from crypt signature up regulated tumors (Kosinski et al., 2007), Popovici BRAF mutated like tumors (Popovici et al., 2012), Laiho et al. Serrated CRC tumors (Laiho et al., 2007), were annotated as described before (Marisa et al., 2013). Wnt pathway activity (Vermeulen et al., 2010) and FOLFIRI response signatures (Graudens et al., 2006) were predicted by using the NTP algorithm as described by Sadanandam et al. (2013).
2.5. CGH alteration frequency profiles
CGH array data were downloaded via the NCBI Gene Expression Omnibus (http://www.ncbi.nlm.nih.gov/geo/; accession number GSE40966). The raw copy‐number data for each sample provided by array CGH was analyzed using the GISTIC2 algorithm (Mermel et al., 2011).
2.6. Identification of biological pathways distinguishing each subtypes
GSEA was performed by the JAVA program (http://www.broadinstitute.org/gsea) using MSigDB C2 CP: Canonical pathways gene set collection (1320 gene sets available). The GSEA outputs, visualized in Cytoscape (version 2.8.2), and the Enrichment Map software (Merico et al., 2010), were used to identify the biological processes discriminating one subtype from others. To simplify the network map, a stringent threshold of gene‐set permutations with a FDR cutoff of 0.5% and p‐value cutoff of 0.01 was used in Enrichment Map software as described (Merico et al., 2010).
2.7. Statistical analysis
The Chi‐squared test and logistic regression were used to study associations between anatomo‐clinical features, common DNA alterations, previously published supervised signatures and subtypes. Survival analysis was intentionally restricted to the subgroup of patients with stage II–III tumors because reliable prognostic biomarkers are most needed for these patients as suggested (Marisa et al., 2013). Indeed, most stage I patients will not derive benefit from adjuvant chemotherapy because of their excellent prognosis after curative surgery, and most stage IV patients, already metastatic, will die from their disease and therefore should be analyzed independently for progression‐free survival. RFS was defined as the time from surgery to the first recurrence and was censored at 5 y. Survival was analyzed according to the Kaplan–Meier method, and differences between survival distributions were assessed with the log‐rank test. Univariate and multivariate models were computed using Cox proportional‐hazards regression (R package survival).
3. Results
3.1. Unsupervised lncRNAs selection
The GSE39582 dataset containing a large sample size with 556 cases was adapted as primary data source in this study. The patient and tumor characteristics of the different sets were described previously (Marisa et al., 2013). To remove potential multicenter batch effects, data were corrected using ComBat method (Johnson et al., 2007) implemented in the R package sva as described by Marisa et al. (2013). The probes showing little variation over the patients were commonly removed from the expression data as part of the preprocessing. Here, we only keep the 50% most varying probes. The subtypes of CRC were identified in row median centered microarray datasets using the non‐negative matrix factorization (NMF) algorithm (Brunet et al., 2004). According to the cophenetic coefficient score (greater than 0.99) from the NMF consensus clustering of discovery set of GSE39582, we chose k = 5 (five) subtypes (Figure 1a) as discussed elsewhere in Brunet et al. (2004). Silhouette width (Rousseeuw, 1987) was computed to identify the most representative samples within each cluster (Figure 1b). Finally, we retained samples with positive silhouette width (n = 376) as core CRC dataset to build the classifier.
Figure 1.
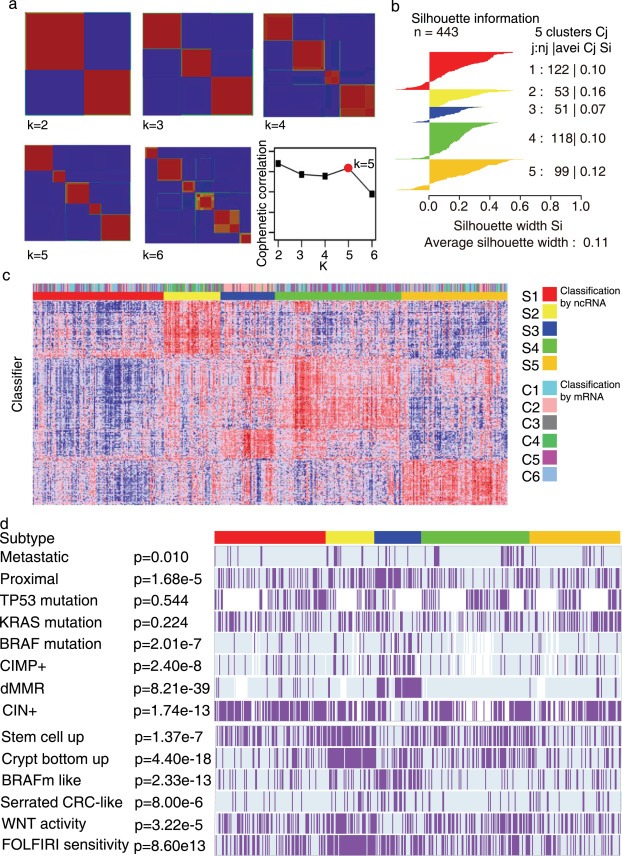
Unsupervised lncRNAs expression profiling analysis of the discovery set of 443 colorectal cancers. (a) NMF consensus clustering analysis and cophenetic coefficient for cluster k = 2 to k = 6 of discovery dataset of GSE39582. Maximum cophenetic coefficient occurred for k = 5. (b) Silhouette plot for the discovery dataset of GSE39582 showing samples from different subtypes and those with positive and negative silhouette score.(c) Heatmap showing 5 subtypes (k = 5) from NMF consensus clustering of the discovery dataset of GSE39582. (d) The heatmap of the 229 lncRNAs ordered by subtype, with annotations associated with each subtype.
3.2. Generation of the colorectal cancer classifier
To build the CRC classifier, we applied two filtering steps to select the most representative and predictive genes as described by De Sousa et al. (2013). Briefly, significance analysis of microarrays (SAM) (Tusher et al., 2001) (R package siggenes version 1.32.0) was used to identify genes significantly differentially expressed (false discovery rate (FDR) < 0.001) between each subtype and the other four. AUC (area under ROC curve, R package ROCR version 1.0–4) was calculated to assess each gene's ability to separate one subtype from the others. This retained 229 genes with AUC >0.85 were trained by prediction analysis for microarrays (PAM) (Tibshirani et al., 2002) to build a classifier. To select the optimal threshold for centroid shrinkage, we performed tenfold cross‐validation over a range of thresholds for 1000 iterations and selected the one yielding a good performance (error rate < 2%) with the least number of genes. Of note, the gene filtering steps do not significantly affect the selection of signature genes, as observed from PAM classification using various cutoffs on SAM FDR and AUC (data not shown). Using this strategy, we built a classifier of 229 unique genes and used it to classify the CRC samples in validation dataset (Supplementary Table A.1).
3.3. Identification of molecular subtypes of CRC by lncRNAs expression profiling
The non‐negative matrix factorization consensus unsupervised analysis of the LncRNA data from the 443 samples of the discovery set of GSE39582 revealed five clusters of samples based on the most variant probe sets (n = 2817): S1 (n = 122, 27.5%), S2 (n = 53, 12%), S3 (n = 51, 11.5%), S4 (n = 118, 26.6%) and S5 (n = 99,22.3%) (Figure 1c). These samples have been classified as C1–C6 based mRNA expression profile by previous study (Marisa et al., 2013). We found the subtype distribution classified by lncRNAs was significantly different from the one derived by mRNA using Chi‐square test (p = 3.36E‐55).Notably, we also observed considerable overlap between these two classification systems, as 60.2% (32 in 53) S2 samples were classified as C4 subtype and 72.5% (37 in 51) S3 were C2.
3.4. Clinical and molecular relevance and signaling pathways of colorectal cancer subtypes
Associations with clinical characteristics and DNA alterations data are shown in Figure 1d and Supplementary Table A.2. Tumors classified as S2 and S4 were more frequently metastatic (18.9 and 18.6%, versus 4.9%, 11.8% and 10.1% in S1, S3 and S5, respectively). CRC classified as S3 was enriched for dMMR (78.0%), CIMP+ (53.5%), BRAF‐mutant (37.0%) and proximal (70.6%) tumors, whereas CIN+ tumors less frequently in S3 than other clusters (31.9% in S3 versus >75% in other clusters). No association between clusters and TP53 and KRAS mutation was found. We performed Gene Set Enrichment Analysis (Subramanian et al., 2005) to identify biological processes and signaling pathways distinguishing certain subtype from others. Gene sets were compiled from the BIOCARTA, Kyoto Encyclopedia of Genes and Genomes (KEGG), REACTOME pathway databases. Significant gene sets (FDR < 0.005, p < 0.001) were visualized as interaction networks with Cytoscape and Enrichment Map (Figure 2) (Merico et al., 2010). The network map was manually curated removing general and uninformative sub‐networks and nodes, resulting in a shown in Figure 2. In S1, DNA repair pathway and cell growth were up‐regulated and focal adhesion was down‐regulated. Similar to previous report (Marisa et al., 2013), in S3, the subtype enriched for dMMR tumors, immune system and cell growth pathways were up‐regulated. S2 showed up‐regulation of focal adhesion, angiogenesis and Extracelluar matrix adhesion pathway and down‐regulation of DNA repair and cell growth pathway. Most signaling pathways were down‐regulated in S4 and S5.
Figure 2.
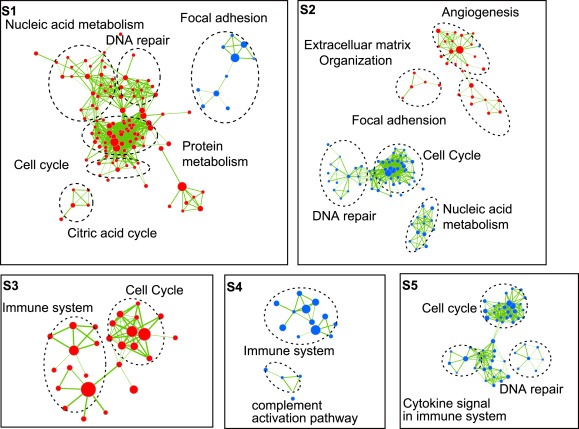
GSE39582 (a), GSE39582, GSE33113GSE17536/GSE17537 Gene set enrichment analysis delineates biological pathways and processes that define five distinct subtypes. Cytoscape and Enrichment Map were used for visualization of the GSEA results. Nodes represent enriched gene sets, which are grouped and annotated by their similarity according to related gene sets. Enrichment results were mapped as a network of gene sets (nodes). Node size is proportional to the total number of genes within each gene set. Proportion of shared genes between gene sets is represented as the thickness of the green line between nodes. This network map was manually curated removing general and uninformative sub‐networks, resulting in a simplified network map.
These five molecular subtypes were further investigated using previously published supervised signatures to explore the subtype origins. As observed in Figure 1d, S2 appeared highly enriched for tumors displaying “stem cell phenotype‐like” gene expression profiling (79.2%) and up‐regulating of the bottom crypt signature (96.2%). Most of the tumors classified as S2 and S3 displayed a “serrated CRC phenotype‐like” gene expression profiling, whereas those in S1, S4 and S5 displayed a “conventional CRC phenotype‐like” gene expression profiling. A strong association between stem‐like‐subtype tumors and high Wnt activity signature (Vermeulen et al., 2010) and FOLFIRI (FOLFIRI, a combination of irinotecan, 5‐fluorouracil, and leukovorin) response signature (Graudens et al., 2006) has been reported (Sadanandam et al., 2013). Similarly, the FOLFIRI response signature was significantly associated with 94.3% (n = 50 in 53) of stem cell phenotype‐like CRC samples, as compared to only 30–60% in other subtypes as assessed using the NTP algorithm.
A schematic summary of the subtype characteristics is shown in Table 1. The five subtypes were named according to their main respective biological characteristic as follows: S1, “Proliferation CRC”; S2, “stem‐cell liked CRC”; S3, “BRAF mutant CRC”; S4 “Immune‐system down CRC”; and S5 “KRAS mutant CRC”.
Table 1.
Characteristics of the five Subtypes of CRC.

3.5. Prognostic value of the five‐subtype classification
Further investigation of the clinical relevance of our classification included a prognostic analysis based on RFS is restricted to stage II and III tumors as discussed in Marisa et.al's report (Marisa et al., 2013). The prognostic value of the five‐subtype classification was significant in the discovery set (n = 359) (p = 0.00998) and the validation set (n = 336) (p = 0.0147) (Figure 3a), with a worse prognosis confirmed for patients with S2 tumors (Figure 3b); The five‐subtype classification was also significant for the discovery and the validation sets combined (p = 0.00139) (Figure 3c). Multivariate analysis (discovery and validation sets analyzed separately and merged) revealed that the LncRNA derived subtypes, together with TNM stage, remained an independent prognostic factor (Table 2 and Supplementary Table A.3).
Figure 3.
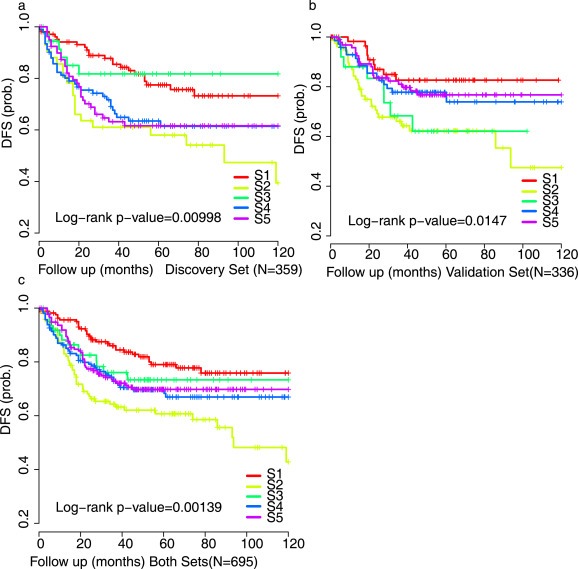
DFS comparison of five CRC subtypes. Kaplan‐Meier Survival curve depicting differential survival for the discovery dataset of GSE39582 (a), validation dataset of GSE39582, GSE33113 and GSE17536/GSE17537 (b) and all the dataset combined (c).
Table 2.
Univariate and Multivariate Cox Analyses including the classification and clinical annotations.
| Variables | Ref | Univariate analysis | Multivariate analysis | |||||||
|---|---|---|---|---|---|---|---|---|---|---|
| n | n.event | H.R. | 95% C.I. | P value | H.R. | 95% C.I. | P value | |||
| Discovery + validation datasets | TNM.Stage | II | 695 | 191 | 1.91 | 1.44–2.54 | 7.69E‐06 | 1.92 | 1.44–2.55 | 9.50E‐06 |
| ncRNA classification | S1 | 169 | 31 | Ref | – | – | Ref | – | – | |
| S2 | 123 | 49 | 2.53 | 1.61–3.95 | 5.45E‐05 | 2.55 | 1.62–4.00 | 5.45E‐05 | ||
| S3 | 65 | 14 | 1.44 | 0.76–2.70 | 0.2592 | 1.45 | 0.77–2.72 | 0.248 | ||
| S4 | 163 | 48 | 1.7 | 1.08–2.66 | 0.0214 | 1.63 | 1.04–2.57 | 0.0345 | ||
| S5 | 175 | 49 | 1.59 | 1.02–2.49 | 0.0439 | 1.64 | 1.05–2.58 | 0.0317 | ||
| Sex | F | 695 | 191 | 1.24 | 0.93–1.65 | 0.142 | 1.3 | 0.97–1.74 | 0.0772 | |
| Age | – | 694 | 191 | 1.001 | 0.99–1.01 | 0.821 | 1.009 | 0.99–1.02 | 0.1444 | |
H.R.: Cox Hazard Ratio, 95% C.I.: 95 Percent Confidence Interval of HR. The bold values mean the P value is less than 0.05.
3.6. Functional annotation of signature lncRNAs
Studies have suggested that the genes with causal roles in oncogenesis are often located in the SCNAs that are frequently altered across tumors (Beroukhim et al., 2010; Garraway et al., 2005). To reveal the lncRNAs that may have tumor‐promoting or ‐suppressing functions, we identified most of lncRNAs that map to regions of recurrent somatic copy number alterations (SCNAs) (Figure 4a). The driver lncRNAs with SCNAs should result in corresponding gene expression changes (Akavia et al., 2010), as only those SCNAs that cause changes in transcript abundance could possibly alter lncRNA activity. We integrated SCNA and expression profiles of lncRNAs in tumors. Integrated Circos plot shows signature ncRNA regulated by copy number (CN). The next outermost histogram represents lncRNAs expression as a function of genomic coordinates: Red represents ncRNAs which positively correlate with expression level changes and green represents ncRNAs does not correlate with expression level changes. Here, we found among the 229 ncRNAs used to build the classifier, 38.9% (89/229) ncRNAs were positively correlated with expression level changes (Figure 4a). As seen in Figure 4b, two representative lncRNAs, AK022220 and BC017275, showed a positive correlation with SCNA (p < 0.001). This may suggest that most of the ncRNAs selected to build the classifier are potential cancer drivers.
Figure 4.
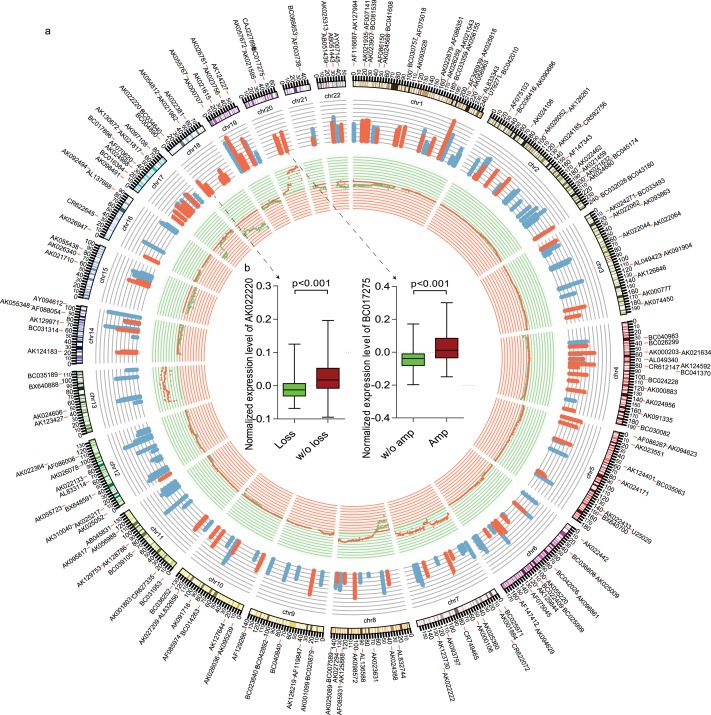
Integrated view of signature lncRNAs regulated by Copy Number. (a) An ideogram of a normal karyotype is shown in the outer ring. The next outermost ring represents the lncRNAs expression levels(Red represents ncRNAs which positively correlates with expression level changes and green represents ncRNAs does not correlate with expression level changes.). The next ring represents copy number as a function of genomic coordinates. (Red represents amplification and green represents deletion).(b) In the center of the figure, the box plot showed two representative lncRNAs, AK022220 and BC017275, positively correlates with SCNA (p < 0.001).
4. Discussion
CRC of varying histological subtypes and grades of malignancy are traditionally diagnosed based on their histopathological features. In the past few decades, molecular expression profiles using microarray analyses have provided additional information to help distinguish the CRC subtypes (Budinska et al., 2013; De Sousa et al., 2013; Marisa et al., 2013; Sadanandam et al., 2013; Wang et al., 2013). Aberrantly expressed molecular markers have also been used to elucidate the mechanisms of CRC progression and malignant transformation. lncRNAs, as a novel class of functional molecules involved in cancer biology, may similarly yield valuable information (Ge et al., 2013; Kogo et al., 2011).
In this study, to investigate the molecular features that best define subsets of CRC, we applied unsupervised consensus clustering to the lncRNA expression data of CRC tumors, without applying biologic or clinical information. The clinical heterogeneity of CRC, coupled with previous gene expression studies (Budinska et al., 2013; De Sousa et al., 2013; Marisa et al., 2013; Sadanandam et al., 2013; Wang et al., 2013), suggests that at least three molecular subtypes of CRC exist. Here we demonstrated that there are likely five primary subtypes of CRC by profiling LncRNA expression, although further subclassifications within these subtypes may be identified in much larger datasets.
The subtypes derived by lncRNAs profiling were associated with a significant difference in survival outcome, with S2 patients having a markedly worse prognosis. While the TNM stage proved to be an independent predictor of survival, the LnRNAs based molecular classification had a similar effect size and was statistically significant at the P = 0.01 level in the multivariable analysis. Future studies on larger numbers of patients are needed to validate the results of the preliminary multivariate analysis reported herein.
The functions of lncRNAs were more likely to closely correlate with their transcript abundance as they do not encode proteins (Du et al., 2013). Thus lncRNAs may have higher specificity than protein‐coding mRNAs in Hessels et al. (2003); Prensner et al. (2011), and be more suitable to serve as prognostic and/or predictive markers for CRC. In this study, using a set of 229 lncRNAs, the CRC samples could be successfully classified into five distinct molecular subtypes with differentiating biological pathways and phenotypically distinct in their clinical outcome. SCNAs is an important form of somatic genetic alteration in cancer, and within that a genomic region is either amplified or deleted. Some of the genes within amplified (or deleted) regions exhibit increased (or decreased) expression levels resulting in altered activity in cancer cells. The most of the signature lncRNAs showed a positive correlation between their SCNAs and expression levels, which we reasoned could possibly lead to altered lncRNA activity in CRC.
The limitations should be acknowledged for this study. First, we lack information on the mechanisms behind the signature lncRNAs, and experimental studies on these lncRNAs might provide important information to further our understanding of their functional roles. Second, Affymetrix HG‐U133 Plus 2.0 arrays represent part but not all of the possible lncRNAs present. The lncRNAs candidates identified here may not represent the complete lncRNA populations underlying CRC biological behavior. To accurately and comprehensively elucidate the role of lncRNAs in classification of CRC, more comprehensive profiling studies and laboratory and clinical researches are needed. Last but not least, all the lncRNAs were derived through the re‐annotation algorithm in this study and should be validated in the further studies.
In summary, five molecular subtypes in CRC based on the lncRNA profiles were identified. Although the possible functional pathways of many identified lncRNA genes are still little understood, our results of the classification based on the lncRNA profiles may provide an efficient classification tool for clinical prognosis evaluation and selection of the target of gene therapy of CRC.
Supporting information
The following is the supplementary data related to this article:
Supplementary data
Acknowledgments
We thank all the subjects of this study for their participation. This study is sponsored by Shanghai Natural Science Foundation(Grant No. 13ZR14244000) and National Natural Science Foundation of China(Grant No: 31371273) to HYC and the grants from the Nataional Natural Science Foundation of Key Program (No. 81320108024), the Ministry of Public Health, China (No. 200802094), the Ministry of Education (No. 20120073110078) to JYF;
Supplementary data 1.
Supplementary data related to this article can be found at http://dx.doi.org/10.1016/j.molonc.2014.05.010.
Chen Haoyan, Xu Jie, Hong Jie, Tang Ruqi, Zhang Xi, Fang Jing-Yuan, (2014), Long noncoding RNA profiles identify five distinct molecular subtypes of colorectal cancer with clinical relevance, Molecular Oncology, 8, doi: 10.1016/j.molonc.2014.05.010.
Contributor Information
Haoyan Chen, Email: chenhaoyan@gmail.com.
Jie Xu, Email: jiexu@yahoo.com.
Jing-Yuan Fang, Email: jingyuanfang@yahoo.com.
References
- Akavia, U.D. , Litvin, O. , Kim, J. , Sanchez-Garcia, F. , Kotliar, D. , Causton, H.C. , Pochanard, P. , Mozes, E. , Garraway, L.A. , Pe'er, D. , 2010. An integrated approach to uncover drivers of cancer. Cell. 143, 1005–1017. [DOI] [PMC free article] [PubMed] [Google Scholar]
- Beroukhim, R. , Mermel, C.H. , Porter, D. , Wei, G. , Raychaudhuri, S. , Donovan, J. , Barretina, J. , Boehm, J.S. , Dobson, J. , Urashima, M. , Mc Henry, K.T. , Pinchback, R.M. , Ligon, A.H. , Cho, Y.J. , Haery, L. , Greulich, H. , Reich, M. , Winckler, W. , Lawrence, M.S. , Weir, B.A. , Tanaka, K.E. , Chiang, D.Y. , Bass, A.J. , Loo, A. , Hoffman, C. , Prensner, J. , Liefeld, T. , Gao, Q. , Yecies, D. , Signoretti, S. , Maher, E. , Kaye, F.J. , Sasaki, H. , Tepper, J.E. , Fletcher, J.A. , Tabernero, J. , Baselga, J. , Tsao, M.S. , Demichelis, F. , Rubin, M.A. , Janne, P.A. , Daly, M.J. , Nucera, C. , Levine, R.L. , Ebert, B.L. , Gabriel, S. , Rustgi, A.K. , Antonescu, C.R. , Ladanyi, M. , Letai, A. , Garraway, L.A. , Loda, M. , Beer, D.G. , True, L.D. , Okamoto, A. , Pomeroy, S.L. , Singer, S. , Golub, T.R. , Lander, E.S. , Getz, G. , Sellers, W.R. , Meyerson, M. , 2010. The landscape of somatic copy-number alteration across human cancers. Nature. 463, 899–905. [DOI] [PMC free article] [PubMed] [Google Scholar]
- Brunet, J.P. , Tamayo, P. , Golub, T.R. , Mesirov, J.P. , 2004. Metagenes and molecular pattern discovery using matrix factorization. Proc. Natl. Acad. Sci. U.S.A.. 101, 4164–4169. [DOI] [PMC free article] [PubMed] [Google Scholar]
- Budinska, E. , Popovici, V. , Tejpar, S. , D'Ario, G. , Lapique, N. , Sikora, K.O. , Di Narzo, A.F. , Yan, P. , Hodgson, J.G. , Weinrich, S. , Bosman, F. , Roth, A. , Delorenzi, M. , 2013. Gene expression patterns unveil a new level of molecular heterogeneity in colorectal cancer. J. Pathology. 231, 63–76. [DOI] [PMC free article] [PubMed] [Google Scholar]
- De Sousa, E.M.F. , Wang, X. , Jansen, M. , Fessler, E. , Trinh, A. , de Rooij, L.P. , de Jong, J.H. , de Boer, O.J. , van Leersum, R. , Bijlsma, M.F. , Rodermond, H. , van der Heijden, M. , van Noesel, C.J. , Tuynman, J.B. , Dekker, E. , Markowetz, F. , Medema, J.P. , Vermeulen, L. , 2013. Poor-prognosis colon cancer is defined by a molecularly distinct subtype and develops from serrated precursor lesions. Nat. Medicine. 19, 614–618. [DOI] [PubMed] [Google Scholar]
- Dotan, E. , Cohen, S.J. , 2011. Challenges in the management of stage II colon cancer. Semin. Oncology. 38, 511–520. [DOI] [PMC free article] [PubMed] [Google Scholar]
- Du, Z. , Fei, T. , Verhaak, R.G. , Su, Z. , Zhang, Y. , Brown, M. , Chen, Y. , Liu, X.S. , 2013. Integrative genomic analyses reveal clinically relevant long noncoding RNAs in human cancer. Nat. Struct. Molecular Biol.. 20, 908–913. [DOI] [PMC free article] [PubMed] [Google Scholar]
- Farina-Sarasqueta, A. , van Lijnschoten, G. , Moerland, E. , Creemers, G.J. , Lemmens, V.E. , Rutten, H.J. , van den Brule, A.J. , 2010. The BRAF V600E mutation is an independent prognostic factor for survival in stage II and stage III colon cancer patients. Ann. Oncol.: Off. J. Eur. Soc. Med. Oncol./ESMO. 21, 2396–2402. [DOI] [PubMed] [Google Scholar]
- Garraway, L.A. , Widlund, H.R. , Rubin, M.A. , Getz, G. , Berger, A.J. , Ramaswamy, S. , Beroukhim, R. , Milner, D.A. , Granter, S.R. , Du, J. , Lee, C. , Wagner, S.N. , Li, C. , Golub, T.R. , Rimm, D.L. , Meyerson, M.L. , Fisher, D.E. , Sellers, W.R. , 2005. Integrative genomic analyses identify MITF as a lineage survival oncogene amplified in malignant melanoma. Nature. 436, 117–122. [DOI] [PubMed] [Google Scholar]
- Ge, X. , Chen, Y. , Liao, X. , Liu, D. , Li, F. , Ruan, H. , Jia, W. , 2013. Overexpression of long noncoding RNA PCAT-1 is a novel biomarker of poor prognosis in patients with colorectal cancer. Med. Oncol.. 30, 588 [DOI] [PubMed] [Google Scholar]
- Gibb, E.A. , Brown, C.J. , Lam, W.L. , 2011. The functional role of long non-coding RNA in human carcinomas. Mol. Cancer. 10, 38 [DOI] [PMC free article] [PubMed] [Google Scholar]
- Gill, S. , Loprinzi, C.L. , Sargent, D.J. , Thome, S.D. , Alberts, S.R. , Haller, D.G. , Benedetti, J. , Francini, G. , Shepherd, L.E. , Francois Seitz, J. , Labianca, R. , Chen, W. , Cha, S.S. , Heldebrant, M.P. , Goldberg, R.M. , 2004. Pooled analysis of fluorouracil-based adjuvant therapy for stage II and III colon cancer: who benefits and by how much?. J. Clin. Oncol.: Off. J. Am. Soc. Clin. Oncol.. 22, 1797–1806. [DOI] [PubMed] [Google Scholar]
- Graudens, E. , Boulanger, V. , Mollard, C. , Mariage-Samson, R. , Barlet, X. , Gremy, G. , Couillault, C. , Lajemi, M. , Piatier-Tonneau, D. , Zaborski, P. , Eveno, E. , Auffray, C. , Imbeaud, S. , 2006. Deciphering cellular states of innate tumor drug responses. Genome Biol.. 7, R19 [DOI] [PMC free article] [PubMed] [Google Scholar]
- Hessels, D. , Klein Gunnewiek, J.M. , van Oort, I. , Karthaus, H.F. , van Leenders, G.J. , van Balken, B. , Kiemeney, L.A. , Witjes, J.A. , Schalken, J.A. , 2003. DD3(PCA3)-based molecular urine analysis for the diagnosis of prostate cancer. Eur. Urol.. 44, 8–15. Discussion 15–16 [DOI] [PubMed] [Google Scholar]
- Hoshida, Y. , 2010. Nearest template prediction: a single-sample-based flexible class prediction with confidence assessment. PloS One. 5, e15543 [DOI] [PMC free article] [PubMed] [Google Scholar]
- Hu, Y. , Chen, H.Y. , Yu, C.Y. , Xu, J. , Wang, J.L. , Qian, J. , Zhang, X. , Fang, J.Y. , 2014. A long non-coding RNA signature to improve prognosis prediction of colorectal cancer. Oncotarget. 5, 2230–2242. [DOI] [PMC free article] [PubMed] [Google Scholar]
- Johnson, W.E. , Li, C. , Rabinovic, A. , 2007. Adjusting batch effects in microarray expression data using empirical Bayes methods. Biostatistics. 8, 118–127. [DOI] [PubMed] [Google Scholar]
- Kogo, R. , Shimamura, T. , Mimori, K. , Kawahara, K. , Imoto, S. , Sudo, T. , Tanaka, F. , Shibata, K. , Suzuki, A. , Komune, S. , Miyano, S. , Mori, M. , 2011. Long noncoding RNA HOTAIR regulates polycomb-dependent chromatin modification and is associated with poor prognosis in colorectal cancers. Cancer Res.. 71, 6320–6326. [DOI] [PubMed] [Google Scholar]
- Kosinski, C. , Li, V.S. , Chan, A.S. , Zhang, J. , Ho, C. , Tsui, W.Y. , Chan, T.L. , Mifflin, R.C. , Powell, D.W. , Yuen, S.T. , Leung, S.Y. , Chen, X. , 2007. Gene expression patterns of human colon tops and basal crypts and BMP antagonists as intestinal stem cell niche factors. Proc. Natl. Acad. Sci. U.S.A.. 104, 15418–15423. [DOI] [PMC free article] [PubMed] [Google Scholar]
- Laiho, P. , Kokko, A. , Vanharanta, S. , Salovaara, R. , Sammalkorpi, H. , Jarvinen, H. , Mecklin, J.P. , Karttunen, T.J. , Tuppurainen, K. , Davalos, V. , Schwartz, S. , Arango, D. , Makinen, M.J. , Aaltonen, L.A. , 2007. Serrated carcinomas form a subclass of colorectal cancer with distinct molecular basis. Oncogene. 26, 312–320. [DOI] [PubMed] [Google Scholar]
- Li, L. , Sun, R. , Liang, Y. , Pan, X. , Li, Z. , Bai, P. , Zeng, X. , Zhang, D. , Zhang, L. , Gao, L. , 2013. Association between polymorphisms in long non-coding RNA PRNCR1 in 8q24 and risk of colorectal cancer. J. Exp. Clin. Cancer Res.: CR. 32, 104 [DOI] [PMC free article] [PubMed] [Google Scholar]
- Li, R. , Qian, J. , Wang, Y.Y. , Zhang, J.X. , You, Y.P. , 2014. Long noncoding RNA profiles reveal three molecular subtypes in Glioma. CNS Neurosci. Therap.. 20, 339–343. [DOI] [PMC free article] [PubMed] [Google Scholar]
- Lin, R. , Maeda, S. , Liu, C. , Karin, M. , Edgington, T.S. , 2007. A large noncoding RNA is a marker for murine hepatocellular carcinomas and a spectrum of human carcinomas. Oncogene. 26, 851–858. [DOI] [PubMed] [Google Scholar]
- Lipovich, L. , Johnson, R. , Lin, C.Y. , 2010. MacroRNA underdogs in a microRNA world: evolutionary, regulatory, and biomedical significance of mammalian long non-protein-coding RNA. Biochim. Biophys. Acta. 1799, 597–615. [DOI] [PubMed] [Google Scholar]
- Marisa, L. , de Reynies, A. , Duval, A. , Selves, J. , Gaub, M.P. , Vescovo, L. , Etienne-Grimaldi, M.C. , Schiappa, R. , Guenot, D. , Ayadi, M. , Kirzin, S. , Chazal, M. , Flejou, J.F. , Benchimol, D. , Berger, A. , Lagarde, A. , Pencreach, E. , Piard, F. , Elias, D. , Parc, Y. , Olschwang, S. , Milano, G. , Laurent-Puig, P. , Boige, V. , 2013. Gene expression classification of colon cancer into molecular subtypes: characterization, validation, and prognostic value. PLoS Med.. 10, e1001453 [DOI] [PMC free article] [PubMed] [Google Scholar]
- McMillan, D.C. , McArdle, C.S. , Morrison, D.S. , 2010. A clinical risk score to predict 3-, 5- and 10-year survival in patients undergoing surgery for Dukes B colorectal cancer. Br. J. Cancer. 103, 970–974. [DOI] [PMC free article] [PubMed] [Google Scholar]
- Mercer, T.R. , Dinger, M.E. , Mattick, J.S. , 2009. Long non-coding RNAs: insights into functions. Nat. Rev. Genet.. 10, 155–159. [DOI] [PubMed] [Google Scholar]
- Merico, D. , Isserlin, R. , Stueker, O. , Emili, A. , Bader, G.D. , 2010. Enrichment map: a network-based method for gene-set enrichment visualization and interpretation. PloS One. 5, e13984 [DOI] [PMC free article] [PubMed] [Google Scholar]
- Merlos-Suarez, A. , Barriga, F.M. , Jung, P. , Iglesias, M. , Cespedes, M.V. , Rossell, D. , Sevillano, M. , Hernando-Momblona, X. , da Silva-Diz, V. , Munoz, P. , Clevers, H. , Sancho, E. , Mangues, R. , Batlle, E. , 2011. The intestinal stem cell signature identifies colorectal cancer stem cells and predicts disease relapse. Cell Stem Cell. 8, 511–524. [DOI] [PubMed] [Google Scholar]
- Mermel, C.H. , Schumacher, S.E. , Hill, B. , Meyerson, M.L. , Beroukhim, R. , Getz, G. , 2011. GISTIC2.0 facilitates sensitive and confident localization of the targets of focal somatic copy-number alteration in human cancers. Genome Biol.. 12, R41 [DOI] [PMC free article] [PubMed] [Google Scholar]
- Mitra, S.A. , Mitra, A.P. , Triche, T.J. , 2012. A central role for long non-coding RNA in cancer. Front. Genet.. 3, 17 [DOI] [PMC free article] [PubMed] [Google Scholar]
- O'Connell, J.B. , Maggard, M.A. , Ko, C.Y. , 2004. Colon cancer survival rates with the new American Joint Committee on Cancer sixth edition staging. J. Natl. Cancer Inst.. 96, 1420–1425. [DOI] [PubMed] [Google Scholar]
- Pang, K.C. , Stephen, S. , Dinger, M.E. , Engstrom, P.G. , Lenhard, B. , Mattick, J.S. , 2007. RNAdb 2.0–an expanded database of mammalian non-coding RNAs. Nucl. Acids Res.. 35, D178–D182. [DOI] [PMC free article] [PubMed] [Google Scholar]
- Popat, S. , Hubner, R. , Houlston, R.S. , 2005. Systematic review of microsatellite instability and colorectal cancer prognosis. J. Clin. Oncol.: Off. J. Am. Soc. Clin. Oncol.. 23, 609–618. [DOI] [PubMed] [Google Scholar]
- Popovici, V. , Budinska, E. , Tejpar, S. , Weinrich, S. , Estrella, H. , Hodgson, G. , Van Cutsem, E. , Xie, T. , Bosman, F.T. , Roth, A.D. , Delorenzi, M. , 2012. Identification of a poor-prognosis BRAF-mutant-like population of patients with colon cancer. J. Clin. Oncol.: Off. J. Am. Soc. Clin. Oncol.. 30, 1288–1295. [DOI] [PubMed] [Google Scholar]
- Prat, A. , Perou, C.M. , 2011. Deconstructing the molecular portraits of breast cancer. Molecular Oncol.. 5, 5–23. [DOI] [PMC free article] [PubMed] [Google Scholar]
- Prensner, J.R. , Chinnaiyan, A.M. , 2011. The emergence of lncRNAs in cancer biology. Cancer discovery. 1, 391–407. [DOI] [PMC free article] [PubMed] [Google Scholar]
- Prensner, J.R. , Iyer, M.K. , Balbin, O.A. , Dhanasekaran, S.M. , Cao, Q. , Brenner, J.C. , Laxman, B. , Asangani, I.A. , Grasso, C.S. , Kominsky, H.D. , Cao, X. , Jing, X. , Wang, X. , Siddiqui, J. , Wei, J.T. , Robinson, D. , Iyer, H.K. , Palanisamy, N. , Maher, C.A. , Chinnaiyan, A.M. , 2011. Transcriptome sequencing across a prostate cancer cohort identifies PCAT-1, an unannotated lincRNA implicated in disease progression. Nature Biotechnol.. 29, 742–749. [DOI] [PMC free article] [PubMed] [Google Scholar]
- Qi, P. , Du, X. , 2013. The long non-coding RNAs, a new cancer diagnostic and therapeutic gold mine. Modern Pathol.: Off. J. U.S. Canad. Acad. Pathol. Inc.. 26, 155–165. [DOI] [PubMed] [Google Scholar]
- Reis-Filho, J.S. , Pusztai, L. , 2011. Gene expression profiling in breast cancer: classification, prognostication, and prediction. The Lancet. 378, 1812–1823. [DOI] [PubMed] [Google Scholar]
- Risueno, A. , Fontanillo, C. , Dinger, M.E. , De Las Rivas, J. , 2010. GATExplorer: genomic and transcriptomic explorer; mapping expression probes to gene loci, transcripts, exons and ncRNAs. BMC Bioinform.. 11, 221 [DOI] [PMC free article] [PubMed] [Google Scholar]
- Roth, A.D. , Tejpar, S. , Delorenzi, M. , Yan, P. , Fiocca, R. , Klingbiel, D. , Dietrich, D. , Biesmans, B. , Bodoky, G. , Barone, C. , Aranda, E. , Nordlinger, B. , Cisar, L. , Labianca, R. , Cunningham, D. , Van Cutsem, E. , Bosman, F. , 2010. Prognostic role of KRAS and BRAF in stage II and III resected colon cancer: results of the translational study on the PETACC-3, EORTC 40993, SAKK 60-00 trial. J. Clin. Oncol.: Off. J. Am. Soc. Clin. Oncol.. 28, 466–474. [DOI] [PubMed] [Google Scholar]
- Rousseeuw, P.J. , 1987. Silhouettes: a graphical aid to the interpretation and validation of cluster analysis. J. Comput. Appl. Mathem.. 20, 53–65. [Google Scholar]
- Sadanandam, A. , Lyssiotis, C.A. , Homicsko, K. , Collisson, E.A. , Gibb, W.J. , Wullschleger, S. , Ostos, L.C. , Lannon, W.A. , Grotzinger, C. , Del Rio, M. , Lhermitte, B. , Olshen, A.B. , Wiedenmann, B. , Cantley, L.C. , Gray, J.W. , Hanahan, D. , 2013. A colorectal cancer classification system that associates cellular phenotype and responses to therapy. Nat. Med.. 19, 619–625. [DOI] [PMC free article] [PubMed] [Google Scholar]
- Sanz-Pamplona, R. , Berenguer, A. , Cordero, D. , Riccadonna, S. , Sole, X. , Crous-Bou, M. , Guino, E. , Sanjuan, X. , Biondo, S. , Soriano, A. , Jurman, G. , Capella, G. , Furlanello, C. , Moreno, V. , 2012. Clinical value of prognosis gene expression signatures in colorectal cancer: a systematic review. PloS One. 7, e48877 [DOI] [PMC free article] [PubMed] [Google Scholar]
- Siegel, R. , Ma, J. , Zou, Z. , Jemal, A. , 2014. Cancer statistics, 2014. CA: A Cancer J. Clinic.. 64, 9–29. [DOI] [PubMed] [Google Scholar]
- Subramanian, A. , Tamayo, P. , Mootha, V.K. , Mukherjee, S. , Ebert, B.L. , Gillette, M.A. , Paulovich, A. , Pomeroy, S.L. , Golub, T.R. , Lander, E.S. , Mesirov, J.P. , 2005. Gene set enrichment analysis: a knowledge-based approach for interpreting genome-wide expression profiles. Proc. Natl. Acad. Sci. U.S.A.. 102, 15545–15550. [DOI] [PMC free article] [PubMed] [Google Scholar]
- Tibshirani, R. , Hastie, T. , Narasimhan, B. , Chu, G. , 2002. Diagnosis of multiple cancer types by shrunken centroids of gene expression. Proc. Natl. Acad. Sci. U.S.A.. 99, 6567–6572. [DOI] [PMC free article] [PubMed] [Google Scholar]
- Tinzl, M. , Marberger, M. , Horvath, S. , Chypre, C. , 2004. DD3PCA3 RNA analysis in urine–a new perspective for detecting prostate cancer. Eur. Urol.. 46, 182–186. Discussion 187 [DOI] [PubMed] [Google Scholar]
- Tusher, V.G. , Tibshirani, R. , Chu, G. , 2001. Significance analysis of microarrays applied to the ionizing radiation response. Proc. Natl. Acad. Sci. U.S.A.. 98, 5116–5121. [DOI] [PMC free article] [PubMed] [Google Scholar]
- Vermeulen, L. , De Sousa, E.M.F. , van der Heijden, M. , Cameron, K. , de Jong, J.H. , Borovski, T. , Tuynman, J.B. , Todaro, M. , Merz, C. , Rodermond, H. , Sprick, M.R. , Kemper, K. , Richel, D.J. , Stassi, G. , Medema, J.P. , 2010. Wnt activity defines colon cancer stem cells and is regulated by the microenvironment. Nature Cell Biol.. 12, 468–476. [DOI] [PubMed] [Google Scholar]
- Villegas, V.E. , Rahman, M.F. , Fernandez-Barrena, M.G. , Diao, Y. , Liapi, E. , Sonkoly, E. , Stahle, M. , Pivarcsi, A. , Annaratone, L. , Sapino, A. , Ramirez Clavijo, S. , Burglin, T.R. , Shimokawa, T. , Ramachandran, S. , Kapranov, P. , Fernandez-Zapico, M.E. , Zaphiropoulos, P.G. , 2014. Identification of novel non-coding RNA-based negative feedback regulating the expression of the oncogenic transcription factor GLI1. Molecular Oncol. 8, 912–926. [DOI] [PMC free article] [PubMed] [Google Scholar]
- Walther, A. , Houlston, R. , Tomlinson, I. , 2008. Association between chromosomal instability and prognosis in colorectal cancer: a meta-analysis. Gut. 57, 941–950. [DOI] [PubMed] [Google Scholar]
- Wang, X. , Markowetz, F. , De Sousa, E.M.F. , Medema, J.P. , Vermeulen, L. , 2013. Dissecting cancer heterogeneity–an unsupervised classification approach. Int. J. Biochem. Cell Biol.. 45, 2574–2579. [DOI] [PubMed] [Google Scholar]
- Weigelt, B. , Baehner, F.L. , Reis-Filho, J.S. , 2010. The contribution of gene expression profiling to breast cancer classification, prognostication and prediction: a retrospective of the last decade. J. Pathol.. 220, 263–280. [DOI] [PubMed] [Google Scholar]
Associated Data
This section collects any data citations, data availability statements, or supplementary materials included in this article.
Supplementary Materials
The following is the supplementary data related to this article:
Supplementary data