

Abstract
We have previously reported the 2D PAGE‐based proteomic profiling of a prospective cohort of 78 triple negative breast cancer (TNBC) patients, and the establishment of a cumulative TNBC protein database. Analysis of this database identified a number of proteins as being specifically overexpressed in TNBC samples. One such protein was D‐3‐phosphoglycerate dehydrogenase (Phgdh), a candidate oncogene. We analysed expression of Phgdh in normal and TNBC mammary tissue samples by 2D gel‐based proteomics and immunohistochemistry (IHC), and show here that high‐level expression of Phgdh in mammary epithelial cells is primarily associated with cell lineage, as we found that Phgdh expression was predominant in CK5‐positive cells, normal as well as malignant, thus identifying an association of this protein with the basal phenotype. Quantitative IHC analysis of Phgdh expression in normal breast tissue showed high‐level expression of Phgdh in normal CK5‐positive mammary epithelial cells, indicating that expression of this protein was not associated with malignancy, but rather with cell lineage. However, proteomic profiling of Phgdh showed it to be expressed in two major protein forms, and that the ratio of expression between these variants was associated with malignancy. Overexpression of Phgdh in CK5‐positive cell lineages, and differential protein isoform expression, was additionally found in other tissues and cancer types, suggesting that overexpression of Phgdh is generally associated with CK5 cells, and that oncogenic function may be determined by isoform expression.
Keywords: Breast cancer, “Basal‐type” breast cancer, Proteomics, Phgdh, Serine biosynthesis
Highlights
Phgdh is upregulated in Triple Negative Breast Cancer.
High‐level expression of Phgdh is associated with cellular lineage rather than malignancy.
Phgdh overexpression is an intrinsic characteristic of a ER−PgR−CK5+ subpopulation of mammary epithelial cells.
High‐level expression of Phgdh was found to be associated with CK5‐positive cell lineage in other tissues and cancer types.
Abbreviations
- IHC
immunohistochemistry
- 2D PAGE
two-dimensional polyacrylamide gel electrophoresis
- Her2
human epidermal growth factor receptor 2
- ER
estrogen receptor
- PgR
progesterone receptor
1. Introduction
Breast cancer is a very heterogeneous disease, with various morphological and molecular features, natural history and response to therapy, and encompassing as many as ten distinct intrinsic molecular subtypes. Currently, molecular targeted therapies are in clinical use for estrogen receptor (ER) and human epidermal growth factor receptor 2 (Her2) positive breast tumors. However, a significant proportion (15–20%) of primary breast cancers are negative for ER, progesterone receptor (PgR), and Her2, comprising the so‐called triple negative breast cancer (TNBC) group (Anders and Carey, 2009; Chu and Anderson, 2002; Rastelli et al., 2010; Yamamoto and Iwase, 2010). Women with TNBC have a poor prognosis due to the generally aggressive nature of these tumors, and because of a lack of suitable molecular therapeutic targets, conventional chemotherapy remains the mainstay of treatment strategies for patients with TNBC. Because TNBC is an operational definition, this classification, rather than defining a single disease, encompasses a number of diseases entities, such as ductal not otherwise specified (NOS) (invasive ductal carcinoma [IDC]), apocrine, lobular, adenoid cystic, medullary, and metaplastic (Bertucci et al., 2006; Lehmann et al., 2011; Montagna et al., 2013). The combination of limited treatment options with clinicopathological heterogeneity of the disease makes clinical management of these lesions very demanding (reviewed in Irshad et al. (2011)), and as a consequence, identification of novel therapeutic targets and options for management of TNBCs is of vital importance. Using a systematic profiling strategy by two‐dimensional polyacrylamide gel electrophoresis (2D PAGE)/silver staining coupled with MS‐based identification of proteins, we performed proteomics analysis of tumor tissues from a prospective cohort of 78 TNBC patients (defined by lack of ER, PgR, and Her2 expression by IHC analysis) and established a cumulative database of proteins comprising all polypeptides identified by 2D PAGE–MS analysis (Cabezon et al., 2013). Comparison of the TNBC protein database with proteomic data obtained from other breast cancer subtypes in our laboratory (Celis et al., 2009, 2008, 2006), revealed a number of proteins distinctively expressed in TNBCs that could constitute therapeutic targets. One of these was the enzymatic activity D‐3‐phosphoglycerate dehydrogenase (Phgdh; EC 1.1.1.95) (Vander Heiden, 2011). Phgdh catalyzes the conversion of the glycolytic intermediate 3‐phosphoglycerate into 3‐phosphohydroxypyruvate, which is the first and rate‐limiting step in the phosphorylated pathway of serine biosynthesis (Pizer, 1963; Sugimoto and Pizer, 1968). Phgdh is linked to glycolysis, a process frequently deregulated in cancer cells, by controlling the flux from this pathway into the serine biosynthesis pathway. Recently, a number of studies have provided direct evidence for a role of Phgdh in cancer: PHGDH locates to a region showing frequent focal somatic copy‐number alterations in cancer specimens, and where no known oncogenes are present (Beroukhim et al., 2010), and increased expression of PHGDH was shown to be associated with tumorigenesis (Locasale et al., 2011). Also, deregulated expression of PHGDH was reported for ER‐negative breast cancer (Locasale et al., 2011; Possemato et al., 2011). Overall, these and other lines of evidence led to the suggestion that PHGDH is a candidate oncogene (Mullarky et al., 2011). We analysed expression of Phgdh in normal and malignant breast tissue, and show here that expression of Phgdh at high levels is associated with cellular lineage rather than malignancy, as we found high‐level expression of Phgdh in normal CK5‐positive mammary epithelial cells, at levels similar to those observed in tumor cells, thus identifying an association of this protein with the basal phenotype. Furthermore, we could allocate Phgdh overexpression to an ER−PgR‐CK5+ subpopulation of cells, which was previously reported to be associated with resistance to therapy (Haughian et al., 2012; Kabos et al., 2011).
2. Materials and methods
2.1. Cell culturing
MDA‐MB‐453 (ATCC HTB‐131) and MCF‐7 (ATCC HTB‐22) human breast carcinoma cell lines were obtained from ATCC, and cells were cultured according to ATCC's guidelines. MDA‐MB‐453 is a TNBC cell line, which was derived from an effusion of a 48 year old female patient with metastatic carcinoma of the breast, involving the nodes, brain and both pleural and pericardial cavities (Cailleau et al., 1978). MCF7‐p95Her2 cells express a constitutively active 95 kDa NH2‐terminally truncated form of ErbB2 (Egeblad et al., 2001) under control of the tetracycline repressor system. The MCF7‐p95Her2 cells were kindly provided by T. Kallunki (Denmark). Expression of p95Her2 was elicited in MCF7‐p95Her2 cells by washing off culture medium containing tetracycline (1 μg/ml) thrice with phosphate buffered saline buffer (PBS), and culturing cells in medium devoid of tetracycline. The human keratinocyte SVK14 is a cell line derived from neonatal foreskin keratinocytes transformed by the SV40 T antigen (Taylor‐Papadimitriou et al., 1982), and was cultured in Dulbecco's Modified Eagle's Medium (DMEM) containing 10% fetal bovine serum (FBS, Gibco BRL); SVK14 was kindly provided by J.E. Celis (Denmark). Normal primary epidermal keratinocytes were isolated and cultured as described (Olsen et al., 1995).
2.2. Sample collection and handling
Tissue samples from clinical high‐risk patients (high‐risk definition according to the Danish Breast Cooperative Group; www.dbcg.dk accessed 22.10.2009) that underwent mastectomy between 2003 and 2008, were collected within the Danish Center for Translational Breast Cancer Research program. All patients had no previous surgery to the breast and did not receive preoperative treatment. They presented a unifocal tumor of an estimated size of more than 20 mm. In addition, 78 non‐selected retrospective triple negative breast cancers (TNBCs) were provided by the Department of Pathology at the Copenhagen University Hospital. Tumors were classified as TNBCs according to the criteria set in the ASCO/CAP guidelines (ER<1%, PR<1%, HER2 0, 1+ or 2+ but FISH/CISH negative). The project was approved (KF 01‐069/03) by the Copenhagen and Frederiksberg regional division of the Danish National Committee on Biomedical Research Ethics. Formalin fixed paraffin‐embedded (FFPE) normal mammary tissue biopsies (n = 6) collected from reduction mammoplasty operations in patients without any clinical history of cancer were also procured from discarded anonymous excess tissue (Erichsens Privathospital, Denmark). Fourteen apocrine ductal carcinoma in situ (ADCIS) and 33 invasive apocrine carcinomas (IACs) diagnosed at the Cancer Institute Hospital, Tokyo were also analysed (Honma et al., 2007, 2005). The age range was 32–84 with a mean average of 59 years. Hematoxylin and eosin stained slides were reviewed by two pathologists. Apocrine carcinoma was defined as a carcinoma in which more than 90% of the tumor cells exhibited cytological features typical of apocrine cells.
2.3. Mass spectrometry analysis and protein identification
2D PAGE (isoelectric focusing, IEF) gels and analyses were performed essentially as previously described (Moreira et al., 2010). Briefly, after running the second dimension, gels were placed in 7.5% acetic acid, 50% ethanol, and 0.05% formalin for 1 h, washed 3 times for 30 min each in 7.5% acetic acid, 10% ethanol and stained with silver nitrate according to a procedure compatible with mass spectrometry. Silver stained gels were dried between cellophane followed by scanning for comparative protein and mass spectrometry analysis. All detected protein spots were excised from silver stained dry gels followed by re‐hydrating in water. In all cases a post‐silver de‐staining step was performed before in‐gel tryptic digestion, thus additionally improving peptide recovery from the gel. Gel pieces were detached from the cellophane film and cut into 1 mm2 pieces followed by “in‐gel” digestion and MS analysis using the same protocols and parameters as previously described (Cabezon et al., 2013). Briefly, MALDI‐TOF‐TOF data were acquired using an Ultraflex™ III 200 time‐of‐flight mass spectrometer (Bruker Daltonik, Germany) equipped with a Smart beam™ laser and a LIFT‐TOF/TOF unit. Data acquisition and data processing were performed by the Flex Control 3.0 and Flex Analysis 3.0 software (Bruker Daltonik, Germany). All of the spectra were obtained using reflector positive mode with an acceleration voltage of 25 kV, reflector voltage of 26.38 kV and detection suppressed up to 450 Da. A total of 2000 shots in steps of 200 shots were added to one spectrum in the mass range of m/z 600–4000 using peak detection algorithm: SNAP (Sort Neaten Assign and Place); S/N threshold: 3 and Quality Factor Threshold: 50.
2.4. 2D PAGE and 2D western immunoblotting
2D PAGE gels and 2D Western immunoblotting were performed as previously described (Celis et al., 2005). Briefly, twenty to thirty, six‐μm cryostat sections of frozen tissues were resuspended in 0.1 ml 2D gel lysis solution [9.5 M urea, 2% (w/v) NP‐40, 2% Ampholines (consisting of 1.6% pH range 5–7, and 0.4% pH ranges 3–10), and 5% β‐mercaptoethanol] and were kept at −20 °C until used. A total of 40 μl of lysate were resolved per gel. Isoelectric focusing gels were prepared and run in glass tubing and the second dimension was a discontinuous SDS gel system run in a slab gel. To identify the phosphorylation state of Phgdh, lysate samples were divided into two aliquots. One aliquot was treated for 30 min at 37 °C with Lambda Protein Phosphatase (Lambda PP), a Mn2+‐dependent protein phosphatase with activity towards phosphorylated serine, threonine and tyrosine residues. A second aliquot of each sample was mock‐treated prior to resolving by 2D gel electrophoresis. Dephosphorylation efficiency was confirmed by western blotting with antibodies against GGCT as previously described (Gromov et al., 2010).
2.5. Tissue microarrays (TMAs)
A large breast cancer cohort in TMA format from the Yale Tissue Microarray Facility (YTMA‐49; Yale University School of Medicine, New Haven, Connecticut) was employed in these studies in order to investigate correlations between Phgdh expression and clinicopathologic parameters. The breast cancer cohort in YTMA49 consists of 688 samples of invasive ductal carcinoma serially collected from the Yale University Department of Pathology archives as available from 1961 to 1983. The TMA was constructed with single 0.6‐mm‐diameter cores of each case and has been described in detail previously (Dolled‐Filhart et al., 2006). The mean follow‐up time of this cohort is 12.8 years and the mean age of diagnosis is 58.1 years. This cohort contains approximately half node‐positive specimens and half node‐negative specimens. In addition we used a set of four TMAs prepared at the Department of Pathology, Copenhagen University Hospital including 78 samples from the TNBC patients included in our proteomic analysis (Cabezon et al., 2013). For TMA construction, a haematoxylin and eosin‐stained (H&E) slide from each block was analysed by a pathologist (VTW) and regions of interest for each sample were defined. Tissue cores of 2 mm were punched from these defined areas and arrayed onto a recipient paraffin block using an automated computer controlled machine (3D Histotech, Budapest, Hungary). Two donor tissue cores were used per case. The slides were stained as above using an appropriate primary antibody. For detection of immune complexes we used a horseradish peroxidase‐labeled polymer (Envision + detection kit, DAKO, Denmark) as a secondary antibody. A third TMA, MTU951, was acquired from Pantomics (Pantomics Inc., USA). MTU951 contains 40 tumor types covering most of the common benign, malignant and metastatic tumors originated from 27 anatomic sites.
2.6. Antibodies
A commercially available mouse anti‐Human monoclonal antibody against Phgdh (clone 4A3‐1D6; used at a dilution of 0.5 μg/ml) was obtained from LifeSpan Biosciences (Seattle, WA USA). In addition, we used a monoclonal rabbit anti‐Human cytokeratin 5 antibody (clone EP24), and a monoclonal mouse anti‐human cytokeratin 19 antibody (clone 4E8), purchased from Epitomics (Burlingame, CA USA) and ThermoFischer Scientific (Rockford, IL USA), respectively. A polyclonal antibody recognizing Her2 (HercepTest) and monoclonal antibodies against p63 (clone 4A4), estrogen receptor (ER; clone 1D5), and Ki67 (clone MIB‐1) were purchased from DAKO (Glostrup, Denmark). Monoclonal antibodies recognizing CK14 (clone LL002), and CK17 (clone E3) were from NeoMarkers (LabVision, CA). The mouse monoclonal antibody against GATA‐3 (clone HG3‐31) was purchased from Santa Cruz Biotechnology Inc. Additional information for all antibodies used in this study (working dilution, clone identity, and vendors), are provided in Supplementary Table 1.
2.7. Immunohistochemistry analysis
Five‐μm sections were cut from the tissue blocks and mounted on Super Frost Plus slides (Menzel‐Gläser, Braunschweig, Germany), baked at 60 °C for 60 min, deparaffinized, and rehydrated through graded alcohol rinses. Heat induced antigen retrieval was performed by immersing the slides in Tris/EDTA pH 9.0 buffer (10 mM Tris, 1 mM EDTA) and heating them in a 750 W microwave oven for 10 min. The slides were then cooled at room temperature for 20 min and rinsed abundantly in tap water. Non‐specific staining of slides was blocked (10% Fetal calf serum in PBS buffer) for 15 min, and endogenous peroxidase activity quenched using 0.3% H2O2 in methanol for 30 min. Antigen was detected with the relevant primary antibody, followed by a species matched secondary antibody conjugated to a horseradish‐peroxidase polymer (Envision+; DAKO, Glostrup, Denmark). Finally, color development was done with 3,3ʹ‐diaminobenzidine (Pierce, IL, USA) as a chromogen to detect bound antibody complex. Slides were counterstained with hematoxylin. Standardization of the dilution, incubation, and development times appropriate for each antibody allowed an accurate comparison of expression levels in all cases. Normal rabbit or mouse sera instead of primary antibody were used as a negative control.
2.8. Specificity of antibodies for IHC‐based studies
The appropriate amount of antibody was diluted in TBS buffer to the final volume needed for staining of two section slides and divided equally into two tubes. Full‐length human recombinant Phgdh protein (Abnova Corporation, Taiwan) was added into one tube to a final concentration of 2.5 μg/ml giving app. 1:5 excess of blocking peptide. Both tubes were incubated at room temperature for 1 h with agitation. Tandem sections of tissue or cell pellets paraffin blocks were stained either with the blocked antibody or antibody alone and processed in parallel for antigen detection with an appropriate secondary antibody as described in the previous section.
2.9. Indirect multiple immunofluorescence analysis
Five‐μm sections cut from paraffin blocks of breast tissue samples were mounted on Super Frost Plus slides (Menzel‐Gläser, Braunschweig, Germany), baked at 60 °C for 60 min, deparaffinised, and rehydrated through graded alcohol rinses. Heat‐induced antigen retrieval was carried out as described above. Following antigen retrieval, sections were treated with Image‐iT FX™ signal enhancer (Molecular Probes, OR, USA) to block non‐specific staining and subsequently incubated with the relevant primary antibodies at the appropriate dilution. Detection of immune complexes was done with species‐specific secondary antibodies conjugated to Alexa Fluor® 488, Alexa Fluor® 568, and streptavidin conjugated Alexa Fluor® 647 (Molecular Probes). Nuclear material was counterstained with DAPI. The sections were washed three times with cold 1×PBS between incubations. Normal rabbit or mouse sera instead of primary antibody were used as a negative control. Sections were imaged using a Zeiss LSM510META confocal laser scanning microscope (Carl Zeiss MicroImaging Gmbh, Germany).
2.10. Quantitative assessment of immunohistochemistry (IHC) staining and data analysis
An automated cellular imaging system (ACIS III; ChromaVision Medical System Inc., CA, USA), was used to digitize and quantify IHC staining intensity of tissue sections. The ACIS system is capable of simultaneously detecting levels of hue (color), saturation (density) and luminosity (darkness). By using the ACIS proprietary software, users can define threshold values for each of these parameters thus allowing the system to separately recognize brown pixels (positive immunostaining) and blue pixels (hematoxylin; nuclear counterstaining). For each tissue section, five distributed representative areas (Ø250 μm) were manually defined, and staining intensity values determined for each area. The overall section staining intensity was calculated as the mean value of the five areas. For analysis of TMAs, the ACIS system was used to derive a score for each core. The digital images from scanned TMA sections were submitted to analysis by the TMA proprietary software module that is part of the ACIS system. A staining score which is a function of staining intensity and the percentage of cells showing immunoreactivity was generated in this manner for each core.
2.11. Statistical analysis
Pearson's product moment correlation coefficients were used to assess the relationship between Phgdh and CK5 expression; the Wilcoxon rank‐sum test or the Kruskal–Wallis analysis of variance test were utilized with categorical variables. In all analyses a two‐sided significance level of 0.05 was used. All statistical analyses were conducted using SAS statistical software (version. 9.3; SAS Institute, Inc., Cary, NC).
3. Results
3.1. Proteomic profiling and expression of Phgdh across breast cancer histological types
We have previously reported the 2D PAGE‐based proteomic profiling of a prospective cohort of 78 TNBC patients (defined by lack of ER, PgR, and Her2 expression by IHC analysis) with the concomitant establishment of a TNBC protein database (Cabezon et al., 2013). Analysis of this database and comparison with similar databases established in our laboratory for other breast cancer subtypes and normal mammary tissue (Celis et al., 2009, 2008, 2006, 2010), identified a number of proteins that were frequently overexpressed in the TNBC samples (Cabezon et al., 2013). One of these was D‐3‐phosphoglycerate dehydrogenase (Phgdh; EC 1.1.1.95), a putative oncogene. We found high level expression of Phgdh in 89% of cases examined, corresponding to 64 out of the 72 samples that exhibited consistent, good protein spot focusing in this particular region of the gels (illustrated in Figure 1A and B). Our results were consistent with previous studies that showed that Phgdh expression is elevated in breast cancer relative to normal breast tissue (Possemato et al., 2011), and significantly associated with ER‐negative status (Pollari et al., 2011; Possemato et al., 2011).
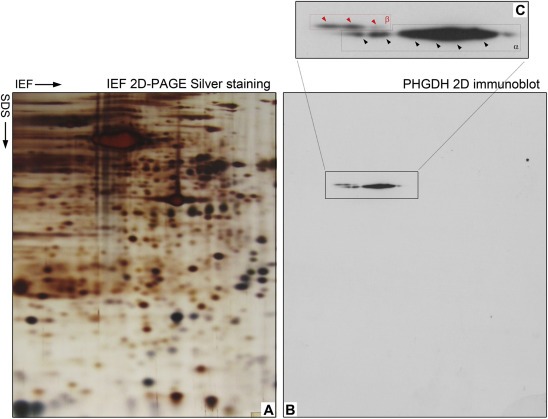
Figure 1.
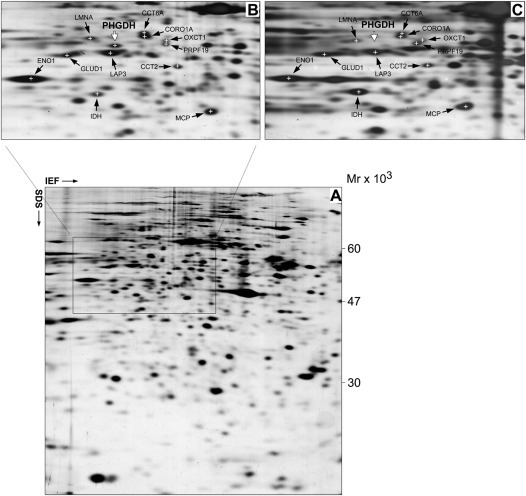
Proteomic profiling of Phgdh expression. (A) Representative silver stained 2D‐PAGE IEF gel of proteins extracted from a TNBC sample. The framed area in the gels, corresponding to the portion of the gel that contain Phgdh, is shown enlarged in panel (B), with the positions for the respective spots indicated. (C) 2D‐PAGE IEF gel of proteins extracted from a pure IAC specimen. The positions of the identified Phgdh protein spot (MALDI‐TOF/MS) in the TNBC gel and the extrapolated putative position in the IAC gel are indicated for reference. Several protein spots present in this area of the gels were identified by MALDI‐TOF/MS, independently in both gels, and used to infer the potential position of the Phgdh spot on the gel of the IAC sample more accurately. The position for each protein spot is marked by a cross, and identified by its UniGene name. CCT6A (T‐complex protein 1 subunit zeta), CORO1A (coronin1A), OXCT1 (succinyl‐CoA:3‐ketoacid‐coenzyme A transferase 1), PRPF19 (pre‐mRNA‐processing factor 19), ENO1 (alpha‐enolase), GLUD1 (glutamate dehydrogenase 1, mitochondrial), LMNA (lamin A/C), LAP3 (cytosol aminopeptidase), CCT2 (chaperonin containing TCP1, subunit 2), MCP (macrophage‐capping protein), IDH1 (isocitrate dehydrogenase [NADP] cytoplasmic).
We then performed the obverse analysis, looking at Phgdh expression across our cumulative proteomic databases from different breast cancer histological subtypes. We found that one of the databases, derived from six independent invasive apocrine carcinoma (IAC) samples, lacked Phgdh (illustrated in Figure 1C; compare Phgdh protein spot in Figure 1C with same region in 1B, white arrow). Pure histological apocrine carcinomas are very rare, the great majority of diagnosed IAC cases correspond to ductal NOS carcinomas with focal apocrine features. Clinically they correspond to high‐grade tumors, express androgen receptor (AR), but often lack ER and PgR (Dellapasqua et al., 2013; Leal et al., 2001; O'Malley and Bane, 2008). Consequently, Her2‐negative apocrine carcinomas are generally classified as TNBCs (Niemeier et al., 2010; Tsutsumi, 2012), with IAC often being considered a special histologic subtype of TNBC (Montagna et al., 2013). Our proteomic analysis indicated that although Phgdh overexpression presented a significant association with the TNBC subtype, this deregulation was not simply hinged on lack of ER expression, as IACs in general did not express Phgdh.
3.2. Expression patterns of Phgdh in normal breast epithelium
3.2.1. Immunoexpression and localization of Phgdh in normal breast epithelial cells
Recently, Possemato and colleagues demonstrated that Phgdh knockdown causes a strong decrease in cell proliferation in cancer cell lines with high levels of Phgdh expression – but not in those without – demonstrating that cancer cells with increased Phgdh expression may depend on it for proliferation and survival (Possemato et al., 2011). Extrapolation from this observation would suggest that TNBCs, which frequently express Phgdh at very high levels (89% of the samples in our TNBC dataset did so), may be sensitive to inhibitors of the serine synthesis pathway (Vander Heiden, 2011). To gain some additional insight as to which specific cells, and disease entities, were associated with Phgdh upregulation, we investigated the expression pattern of Phgdh in breast epithelial cells by immunohistochemistry (IHC) analysis of tissue biopsies. Because sensitivity and specificity of antibodies are critical parameters in the design and development of reliable IHC‐based assays for analysis and validation of potential biomarkers, we tested various commercially available antibodies for performance in IHC and immunofluorescence‐based assays. For this purpose we used a three‐pronged strategy, developed in our laboratory, consisting of (i) specificity analysis by 2D Western blotting (2D‐WB), (ii) mass spectrometry validation of detected spots in matched superimposed 2D silver‐stained gels and (iii) IHC experiments using samples pinpointed by 2D gel analysis as positive/negative for the analyte in question. This approach combines the cellular resolution of IHC, with the intrinsic sensitivity and specificity of 2D WB coupled to MS‐based identification (Cabezon et al., 2013). We identified one monoclonal antibody (clone 4A3‐1D6) that was ascertained to be specific for Phgdh (Supplementary Figures 1 and 9) – under the conditions of the assays‐ and used for all subsequent studies.
To define the baseline of expression for Phgdh in normal breast tissue, we first performed IHC analysis of Phgdh expression in formalin fixed paraffin‐embedded (FFPE) tissue sections of normal breast samples (n = 6) collected from reduction mammoplasty operations in patients without any clinical history of cancer. In all six cases, Phgdh immunoreactivity was generally restricted to the myoepithelial cell layer (Figure 2A, red arrow), with normal luminal cells being devoid of staining (Figure 2A, grey arrow). However, in all samples, we observed sporadic single cells present in the luminal compartment, with very high levels of immunoreactivity (Figure 2B, yellow arrows). In addition, in two of the samples we also observed groups of cells displaying very strong immunostaining, in a usual type ductal hyperplasia lesion (Figure 2C, yellow arrows), as well as in entire ductular/alveolar structures (Figure 2D, yellow arrows), respectively. These cells presented levels of Phgdh immunostaining that were considerably higher than those of nearby basal cells or luminal cells (Figure 2B and C, compare yellow arrows with red and grey arrows, respectively). To confirm these observations, we examined the expression pattern of Phgdh in normal mammary epithelium by indirect immunofluorescence analysis. We found that, as expected, myoepithelial cells displayed uniform, moderate immunostaining for Phgdh (Figure 3A and B, red arrowheads) whereas luminal cells showed, generally, no expression of Phgdh (Figure 3A, grey arrowhead) with occasional intraduct epithelial cells displaying very strong immunostaining (Figure 3A, yellow arrowhead). In a few ductal/alveolar structures, the number of luminally located Phgdh‐positive epithelial cells was quite substantial (Figure 3B, yellow arrowheads), but overall, luminal Phgdh‐positive epithelial cells were rare (≈1%).
Figure 2.
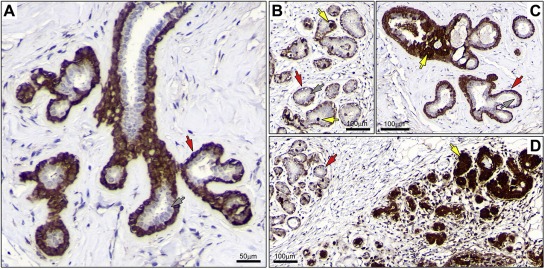
Immunohistochemical expression analysis of Phgdh in FFPE breast tissue samples. (A) Immunostaining of Phgdh protein in a normal breast tissue sample demonstrated the presence of the Phgdh antigen in myoepithelial cells with moderate cytoplasmic expression (red arrow). Luminal epithelial cells generally showed weak or no detectable expression of the protein (grey arrow). (B) Occasional luminal cells displayed very high levels of immunostaining (yellow arrows) relative to myoepithelial cells (red arrow), and in contrast to the majority of luminal cells that were devoid of immunoreactivity (grey arrow). (C) We also found groups of cells displaying very strong immunostaining, in usual type ductal hyperplasia lesions (yellow arrows), (D) or even entire ductular/alveolar structures (yellow arrows).
Figure 3.
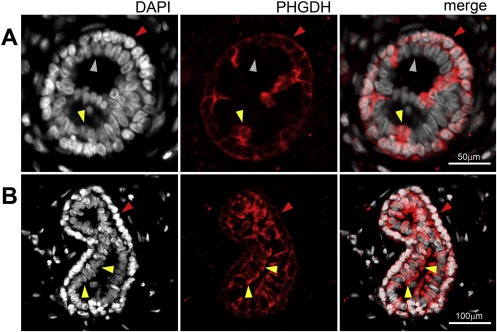
Indirect immunofluorescence analysis of normal breast tissue sections. Phgdh immunoexpression was observed in myoepithelial cells (red arrowheads) and sporadically in cells in the luminal compartment (yellow arrowheads) in (A) alveoli as well as (B) ductules.
3.2.2. Correlation of Phgdh protein expression with molecular phenotypic determinants of normal breast epithelial cells
Recently, Locosale and colleagues demonstrated that ectopic expression of Phgdh, in non‐malignant breast MCF‐10A cells grown in reconstituted basement membrane (Matrigel), induced phenotypic behavioral changes, disrupting normal breast ductal morphogenesis in this cellular model system and showing enhanced proliferation, phenotypes associated with tumorigenesis (Locasale et al., 2011). Consequently, the sporadic cells displaying very high levels of Phgdh, which we found in the luminal compartment in normal mammary tissue, as well as in hyperplastic lesions, could be construed to represent putative pre‐malignant cells. However, the fact that we found them in all six normal samples examined, made it unlikely that these cells constituted malignant precursors, and rather suggested that they represented an intrinsic cell subpopulation that was interspersed among luminal cells. In order to address the nature of the PHGDH‐positive mammary epithelial cells present in the luminal compartment, we used an immunophenotyping approach that enables one to characterize the molecular phenotypes of cells of interest – a method that we have previously established to phenotype cells and precursors that are present in normal and benign conditions of the breast (Moreira et al., 2010). The correlation of various cellular markers with Phgdh expression was assessed by a combined approach, using IHC and multiple indirect‐label immunofluorescence analysis of serial sections of histologically normal breast epithelia obtained from normal breast reductions (n = 6). The cells in question (luminal; very strong PHGDH staining) are clearly identifiable (Figure 2B, yellow arrows), but, due to the heterogeneity of PHGDH expression in luminal cells present in normal epithelium, which cannot be captured by scoring it in a standard fashion, we report them in a descriptive manner. Thus, the association between the various markers and PHGDH was examined not based on staining intensity per se, but on whether specific cells in recognizable structures that were positive for PHGDH in one section were positive for another marker(s). A total of 27 markers were examined, in parallel, in this manner: Phgdh, proliferation markers (Ki67, and Cyclin D), receptors (ER, PgR, Her2, and EGFR), cell lineage markers (CK5, CK7, CK8, CK14, CK17, CK19, CK18, smooth muscle actin, vimentin, and p63), differentiation markers (c‐kit, CK15, and GATA‐3), signaling molecules (p‐AKT, p‐ERK/JNK, p‐STAT3, pSTAT1, p‐STAT6, pSTAT5a), and transcription factors (p53). This is illustrated in Figure 4, for nine of these markers (Phgdh, p63, Ki67, CK17, CK14, CK5, ER, GATA‐3, and Her2) on a histologically normal lactiferous duct. Of the 27 markers examined, only one single marker, a basal cytokeratin, CK5, showed significant correlation to luminal Phgdh‐positivity (Figure 4, compare Phgdh and CK5 panels, red arrows). Co‐localization of these two proteins was verified by multicolor immunofluorescence analysis of normal tissue sections. In addition, the lack of obvious association to the other examined markers was confirmed by multicolor immunofluorescence analysis (illustrated in Figure 5C). We established that the strongly positive Phgdh cells present within the luminal compartment were CK5 positive cells (Figure 5A and B, yellow arrowhead). These cells encompassed two different subpopulations: one subpopulation was associated with basal epithelial markers such as CK14, indicating that these were basal cells interspersed among luminal epithelial cells, for example in intraductal benign epithelial proliferative lesions, and are, therefore, present in the luminal compartment (Figure 5A). The other cell subpopulation consisted of CK5+ Phgdh+ cells which lacked the basal epithelial marker CK14 (Figure 5B), as well as the myoepithelial markers p63 and smooth muscle actin (Figure 4 and data not shown, respectively), indicating that this may be a subpopulation of cells displaying some basal features that coexists with committed luminal cells (Stingl et al., 2005).
Figure 4.
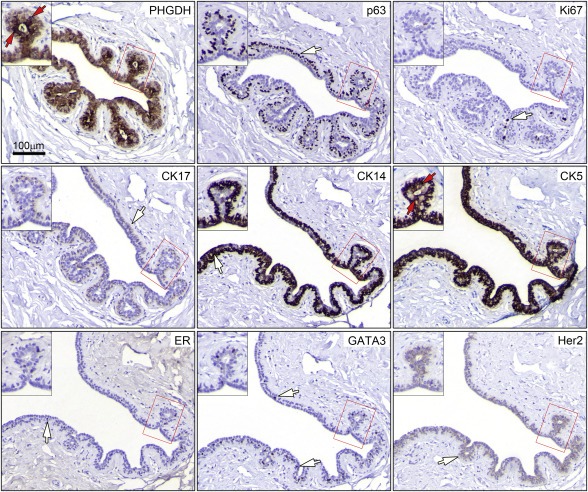
Immunophenotyping of Phgdh positive luminal cells. Tandem sections of normal breast tissue were stained with antibodies against Phgdh, p63, Ki67, CK17, CK14, CK5, ER, GATA3, and Her2, allowing identification of the Phgdh+ CK5+ cellular phenotype. Red arrows indicate cells with these phenotypes present in a single acinar structure (red square and inset) present throughout the different sections. White arrows indicate cells with immunoreactivity for the various markers, which do not show concomitant expression of Phgdh. Magnification, 20×.
Figure 5.
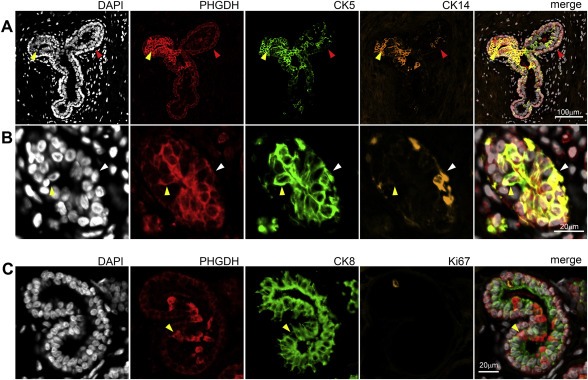
Immunophenotyping by indirect triple‐staining immunofluorescence analysis of normal breast tissue sections. (A) Phgdh immunoexpression was observed in myoepithelial cells (red arrowheads) and in CK5+ CK14+ cells present in the luminal compartment (yellow arrowheads), as well as (B) CK5+ CK14− luminal cells (yellow arrowhead). (C) Phgdh immunoexpression was observed in some luminal cells (yellow arrowhead) but was not associated with CK8 or Ki67 positivity.
3.3. Expression patterns of Phgdh in breast tumors
3.3.1. Immunoexpression and localization of Phgdh in breast cancer cells
To verify our proteomics‐based analysis, expression of Phgdh in breast tumors was examined by quantitative IHC analysis of full section slides using an automated cellular imaging system (ACIS), as described in the Methods section. For each tissue section, five independent areas of invasive cancer component (Ø250 μm) were quantitated to reduce potential sampling variations. The overall staining intensity for each section was calculated as the mean value of the five areas. We analysed in this manner 77 breast cancer samples that were part of our TNBC patient dataset (one of the 78 original samples was classified as apocrine and was therefore excluded from the dataset). Additionally, we examined expression of Phgdh in a set of tumors presenting apocrine differentiation. We analysed a large, well‐defined, cohort of apocrine ductal carcinoma in situ (ADCIS, 13 samples, of which 1 was ER−/PgR−/Her2+, all others were TNBCs) and pure IAC (33 samples, of which 24 were TNBC, 8 were ER−/PgR−/Her2+, and 1 was ER+/PgR−/Her2−) diagnosed at the Cancer Institute Hospital, Tokyo (Celis et al., 2009, 2007, 2005). We found that staining intensities were significantly lower in IACs (Figure 6A; P < 0.001) or ADCIS (Figure 6A; P < 0.001) as compared to TNBC samples; there was no significant difference in Phgdh IHC staining intensity between IACs and ADCIS (P = 0.940). These data showed that levels of expression of Phgdh were generally low in apocrine lesions (illustrated in Figure 7). At the cellular level, we found that cells displaying apocrine morphology features (Figure 7A, red arrow) did not express Phgdh or expressed it at much lower levels than neighbor basal cells without apocrine features (Figure 7A, yellow arrow). This difference in expression of Phgdh was independent of invasive potential, as tumor cells exhibiting cytological features typical of apocrine cells (Figure 7B, red arrow) expressed Phgdh at much lower levels than cells in adjacent CIS lesions that did not display apocrine differentiation features (Figure 7B, yellow arrow), or normal glands present in the same tissue section (inset Figure 7B, yellow arrow). The morphological evaluation of those samples has been performed independently by a trained pathologist (M‐LM). Indirect immunofluorescence analysis of benign apocrine metaplasia samples reiterated this observation, showing that non‐malignant cells displaying apocrine features (Figure 7C, yellow arrow) had much lower levels of Phgdh than neighbor non‐apocrine cells (Figure 7C, red arrow). The reverse phenotype was observed for cytokeratin 8 (CK8), a marker that is positive in apocrine lesions (Wells and El‐Ayat, 2007), and which frequently shows enhanced immunoreactivity in these benign changes (Julio Celis, personal communication).
Figure 6.
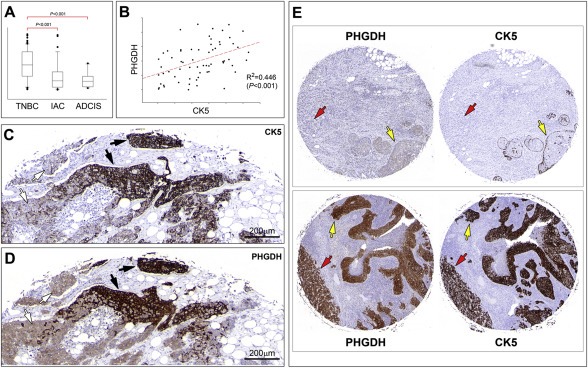
Immunohistochemistry analysis of Phgdh expression. (A) Quantitative analysis of Phgdh expression in TNBC (n = 77), IAC (n = 33), and ADCIS (n = 13) samples. Staining intensities were significantly lower in IACs (P < 0.001) or ADCIS (P < 0.001) as compared to TNBC samples. (B) Correlation analysis between Phgdh and CK5 in TNBC samples showed a positive significant association between the two markers (P < 0.001). (C and D) Stainings of tandem sections of the same sample illustrates the strong correlation between expression of Phgdh and CK5 at the cellular level. This lesion contained areas with CK5‐negative Phgdh‐low cells (white arrows) and areas with CK5‐positive Phgdh‐high cells (black arrows). (E) A strong correlation was also observed in the independent cohort included in YTMA‐49. (Upper panel) A sample that was CK5‐negative (lefthand core) presented low levels of Phgdh (righthand core), both in CIS lesions (yellow arrow) and invasive component (red arrow). (lower panel) A sample that was CK5‐positive (lefthand core) also showed strong Phgdh immunoreactivity (righthand core), both in CIS lesions (yellow arrow) and invasive component (red arrow). Magnification 20×.
Figure 7.
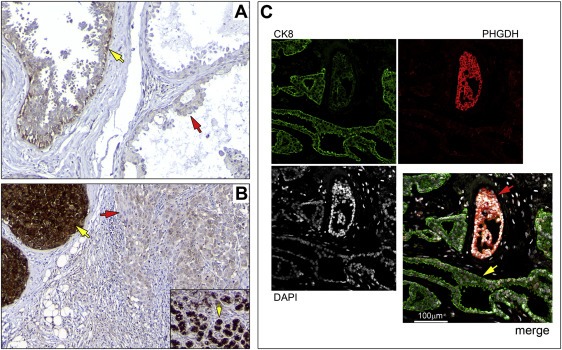
Expression patterns of Phgdh in apocrine samples. (A) Cells displaying apocrine morphology features (red arrow) did not express Phgdh or expressed it at much lower levels than neighbor basal cells without apocrine features (yellow arrow). (B) Tumor cells exhibiting cytological features typical of apocrine cells (red arrow) expressed Phgdh at much lower levels than cells in adjacent CIS lesions that did not display apocrine differentiation features (yellow arrow), or normal glands present in the same tissue section (inset, yellow arrow). (C) Indirect immunofluorescence analysis of benign apocrine metaplasia, with non‐malignant cells displaying apocrine features (yellow arrow) presenting much lower levels of Phgdh than neighbor non‐apocrine cells (red arrow). Magnification, 20×.
Having established the nature of normal PHGDH+ luminal cells, we investigated a possible association in cancer cells between Phgdh overexpression and the CK5+ phenotype we had observed for normal epithelial cells. We performed quantitative IHC analysis of serial sections of TNBC TMAs stained with Phgdh and CK5, in a same way as described above where the ACIS system was used to derive a score for each tumor. This score was an average of the scores obtained for the two 2 mm cores per tumor present in the TMA. This large core size was chosen as a compromise between number of samples and representativeness of tumor heterogeneity. Correlation analysis between Phgdh and CK5 scores showed a positive significant association between the two markers in TNBCs (Figure 6B; P < 0.001). This strong correlation was even more apparent at the cellular level and is illustrated in Figure 6 (C and D panels), with a heterogenous tumor sample that presented two distinct tumor cell populations. This tumor contained areas with CK5‐negative cells (Figure 6C, white arrows) and areas with CK5‐positive cells (Figure 6C, black arrows). The corresponding areas in a tandem section immunostained for Phgdh, showed expression of Phgdh at low, but detectable, levels in CK5‐negative areas (Figure 6D, white arrows), or very high levels of expression in CK5‐positive areas (Figure 6D, black arrows), respectively. Although there was a strong positive association between Phgdh and CK5 scores (Figure 6B; P < 0.001), this correlation was not absolute. Classification of samples into CK5 positive or negative (>=10% or <10% of tumor cells positive, respectively), and Phgdh overexpression or not (>=10% or <10% of tumor cells displaying strong immunoreactivity, respectively), showed that in 24 out of 77 cases (31%), expression of Phgdh and CK5 was discordant (Table 1). These cases probably reflect additional regulatory and molecular events that are superimposed on, but independent of, cell lineage affecting Phgdh expression, such as gene copy‐number changes, as PHGDH is in a genomic region of recurrent copy number gain in breast cancer (Beroukhim et al., 2010), and gene copy number gain is significantly associated with augmented gene expression in breast cancer (data not shown; cbioportal.org) (Cerami et al., 2012). Unfortunately, due to sample availability we were unable to determine if indeed gene copy‐number changes in PHGDH account for our discordant cases.
Table 1.
Correlation of Phgdh with CK5 expression in TNBCs.
| Phgdh∖CK5 | – | + |
|---|---|---|
| High | 13 | 42 |
| Low | 10 | 11 |
3.3.2. Phgdh expression in an independent sample set consisting of 688 breast tumors: correlation with the clinicopathologic parameters of tumors and prognostic relevance of Phgdh expression
To further elucidate the role of Phgdh in breast cancers and its possible correlation with survival outcome and multiple clinicopathological parameters, Phgdh expression was evaluated in a large cohort of breast cancers using a tissue microarray (TMA), YTMA‐49, containing 688 carcinomas for which we had clinical follow‐up data (Camp et al., 2003; Dolled‐Filhart et al., 2003). Analysis of the IHC staining results from the TMA showed that of the histopathological parameters we assessed, three ‐ tumor size, histologic grade, and ER status ‐ were significantly associated with Phgdh expression, whereas age, nodal status, and HER‐2/neu status were not (Table 2). The YTMA‐49 breast cancer cohort TMA has been extensively used by the Rimm laboratory and has been examined for expression of various proteins, with staining scores for these proteins evaluated by AQUA™ technology (Dolled‐Filhart et al., 2010). Correlation analysis of Phgdh ACIS staining scores of YTMA‐49 cores with AQUA scores available through the AQUAmine database, showed that Phgdh expression was weakly, but significantly, associated with expression of four proteins: CK5 (ρ = 0.268), carbonic anhydrase IX (CA IX) (ρ = 0.205), MMP11 (ρ = 0.142), and BRCA1 (ρ = 0.0939), with the most significantly correlated being CK5 (P < 0,0001), thus validating our results in an independent patient cohort (Table 3; proteins ranked by correlation significance). This association is illustrated in Figure 6E with two samples from YTMA‐49. One of the samples displayed areas of DCIS entrapped within an invasive carcinoma. This sample was CK5‐negative and presented low levels of Phgdh, both in CIS lesions (yellow arrows) and invasive component (red arrow). The few cells expressing CK5, which also moderately expressed Phgdh, were basal cells surrounding foci of DCIS (Figure 6E; upper panel). Conversely, a sample that was CK5‐positive also showed strong Phgdh immunoreactivity (Figure 6E; lower panel). In the case of the second most significantly correlated marker CA IX (P < 0,0001), CA IX expression in breast cancer is associated with the triple negative phenotype (Neumeister et al., 2012), and is associated specifically with cytokeratin 5/6 positivity (Jeon et al., 2013), thus it is not surprising that we found its expression to correlate with that of Phgdh. Analyses of overall survival (OS) were also performed on the results from the cores present in the YTMA‐49 for which clinical data and interpretable Phgdh staining were concurrently available (n = 585; corresponding to 451 registered events). Initially, Phgdh was analysed for prognostic value using the ACIS TMA score as a continuous variable, with univariate hazard ratios calculated by the Cox proportional hazards regression model. We found that overall Phgdh protein levels were not significantly associated with OS (P = 0.409; hazard ratio (HR) = 1.055; [95% confidence interval (95% CI) 0.929–1.198]) in this cohort. Previous reports identified a correlation between high PHGDH expression and poor 5‐year survival for breast cancer (Possemato et al., 2011), as well as time to relapse in 368 breast cancers (P < 0.001) and to overall survival (OS) time in 393 breast cancers (P = 0.002) (Pollari et al., 2011). However, a differing study found lack of tumoral Phgdh expression to be predictive of a shorter OS rate (hazard ratio 3.053, 95% CI 1.002–9.305, P = 0.05) in TNBC (Noh et al., 2014), which, together with our own results, raised some questions as to the rationale underlying these data. To clarify these apparently conflicting results, we interrogated the Kaplan–Meier‐plotter, an online survival analysis tool (KM plotter; http://www.kmplot.com), for effect of PHGDH expression on OS and relapse free survival (RFS) on breast cancer prognosis using microarray data from 4142 patients (Gyorffy et al., 2010). We found PHGDH expression to be associated with worse prognosis (OS and RFS, P < 0.001 and P < 0.0001, respectively) if all tumors were included (Supplementary Figure 2). However, when we repeated the analysis for each of the basal, luminal A, and Luminal B subtypes, respectively, we found no correlation to prognosis, OS or RFS, in Luminal A and Luminal B cancers, and an inverse correlation for OS in basal cancers (P = 0.044), indicating that the negative effect on survival in all cancers is driven by the basal cancers, due to the association between CK5 positivity and Phgdh expression, and that in basal cancers Phgdh expression has a positive effect on patient outcome.
Table 2.
Clinicopathological correlation of Phgdh expression in Yale Tissue MicroArray 49 (YTMA‐49).
| n | Phgdh score (median) | P | |
|---|---|---|---|
| Age (years) | |||
| ≤55 | 251 | 2.35 | 0.292a |
| >55 | 335 | 2.42 | |
| Tumor size (mm) | |||
| ≤25 | 295 | 2.35 | 0.009a |
| >25 | 240 | 2.45 | |
| Histologic grade (BRE) | |||
| Grade 1 | 91 | 2.15 | <0.001b |
| Grade 2 | 289 | 2.42 | |
| Grade 3 | 159 | 2.59 | |
| Lymph node status | |||
| Positive | 308 | 2.38 | 0.155a |
| Negative | 276 | 2.36 | |
| Estrogen status | |||
| Positive | 295 | 2.38 | 0.044a |
| Negative | 289 | 2.42 | |
| HER‐2/neu status | |||
| 0 | 348 | 2.38 | |
| 1 | 110 | 2.45 | 0.852b |
| 2 | 40 | 2.34 | |
| 3 | 53 | 2.42 | |
Wilcoxon rank‐sum test.
Kruskal–Wallis one way analysis of variance on ranks.
Table 3.
Phgdh associations with various protein markers previously evaluated on the Yale Tissue MicroArray 49 (YTMA‐49) breast cancer cohort.
| Marker | Correlation coefficient (ρ) | Pa |
|---|---|---|
| CK5 | 0.268 | <0.0001 |
| CA IX | 0.205 | <0.0001 |
| MMP11 | 0.142 | <0.01 |
| BRCA1 | 0.0939 | 0.0346 |
| GLI2 | −0.0787 | 0.0535 |
| EGFR | 0.0762 | 0.0660 |
| CXCR4 | −0.124 | 0.0713 |
| HuR | −0.108 | 0.0749 |
| BCL2 | 0.0749 | 0.112 |
| GRB7 | 0.0681 | 0.145 |
| CD68 | −0.0630 | 0.169 |
| CD44 | 0.0656 | 0.176 |
| NAT1 | 0.0496 | 0.230 |
| C‐myc | 0.0631 | 0.245 |
| ALDH1 | 0.0403 | 0.331 |
| AuroraB | 0.0429 | 0.340 |
| Bag1 | −0.0433 | 0.346 |
| HER4 | −0.0505 | 0.381 |
| ATF2 | 0.0530 | 0.410 |
| Chaperonin 10 | 0.0453 | 0.476 |
| GATA‐3 | 0.0493 | 0.523 |
| GSTM1 | −0.0291 | 0.527 |
| Caveolin 1 | −0.0309 | 0.576 |
| Fibronectin | −0.0258 | 0.629 |
| STK15 | 0.0204 | 0.639 |
| CD31 | 0.0197 | 0.670 |
| Cathepsin L2 | −0.0186 | 0.687 |
| Cyclin B1 | 0.0163 | 0.723 |
| TRAIL | −0.0165 | 0.745 |
| HER3 | 0.0176 | 0.771 |
| TIF2 | 0.00885 | 0.838 |
| AKT3 | −0.0102 | 0.840 |
| Matriptase normalized | 0.00738 | 0.894 |
| EGFR_15F8 | −0.00295 | 0.948 |
| p16 | 0.00129 | 0.979 |
Spearman rank order correlation.
3.4. Overexpression of Phgdh is a recurrent event in normal stratified epithelium and cancer cells
The data we present here clearly demonstrates that Phgdh is expressed at high levels in mammary epithelial cells that express the CK5 stratified‐epithelium marker. If high‐level expression of Phgdh in the basal epithelial cell lineage is an intrinsic feature of these cells, one might expect that other stratified epithelial tissues would also display high levels of Phgdh in basal cells. One obvious candidate was prostate tissue. Analogously to breast, prostate myoepithelial cells are CK5 positive, whereas the prostate glandular epithelium is generally CK5 negative (Moll et al., 1982; Wang et al., 2001). If lineage is indeed a major determinant of Phgdh high‐level expression, an analogous pattern of expression of Phgdh in prostate epithelium to that observed in breast epithelium was to be expected, and would be an weighty argument in favor of this hypothesis. We analysed a TMA, MTU951 (Pantomics Inc., USA), which contains 40 tumor types covering most of the common benign, malignant and metastatic tumors originated from 27 anatomic sites (H&E images and information for all cores available at www.pantomics.com/tissue‐arrays/multi‐system/multi‐organs/MTU951/; last accessed 05.11.2014). Normal prostate epithelium showed stronger expression of Phgdh in basal cells (Figure 8A, red arrows) with luminal cells presenting much lower levels of Phgdh immunoreactivity (Figure 8A, grey arrow). Notably, both prostate adenocarcinoma samples present in the TMA expressing Phgdh at high levels (illustrated in Figure 8B).
Figure 8.
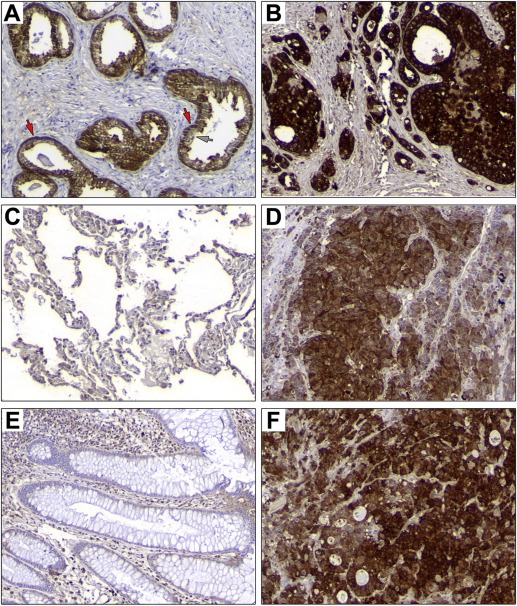
Phgdh expression patterns in normal human and corresponding cancers present in the MTU951 TMA. Immunohistochemical analysis of Phgdh expression in (A) normal prostate (core F07; 65 year old male, normal prostate with hyperplasia) and (B) a prostate carcinoma (core F08; 60 year old male, adenocarcinoma, grade II, stage T2N0M0). (C) Normal lung (core E01; 58 year old male) and (D) a lung cancer (core E05; 19 year old male, small cell carcinoma, stage T3N0M0), (E) normal colon (core C08; 27 year old female, normal colon) and (F) a colorectal carcinoma (core C12; 43 year old female, colon adenocarcinoma, grade III, stage T3N0M0). Magnification, 20×.
A corollary of the CK5+‐lineage restricted Phgdh expression hypothesis is that if the CK5+ epithelial cell lineage is a primary determinant of high‐level Phgdh expression, then one would expect that simple epithelial tissues, which do not have committed basal epithelial cells, would not present a significant number of normal cells displaying strong expression of Phgdh. Accordingly, we examined immunoexpression of Phgdh in normal lung alveoli and colonic epithelium, two tissue types that do not present CK5+ basal epithelial cells (Moll et al., 1982). We found no significant expression of Phgdh in lung or in colon epithelial cells in either of the normal samples present in the TMA (Figure 8C and D, respectively). Nonetheless, we found that some colon (1 out of 3) and lung (2 out of 4) tumors, (Figure 8E and F; colorectal adenocarcinoma and lung small cell carcinoma samples, respectively) expressed Phgdh, albeit at lower levels than those observed for CK5‐positive breast and prostate cancer.
Although rather useful for getting a broad overview of tissue expression, one needs to use caution when interpreting the staining results for this multi‐tissue array, as in general one single core is available for normal samples and very few anatomical site‐matched tumor cases are present for each cancer type. The human protein atlas (HPA) (Uhlen et al., 2010) is an initiative that combines high‐throughput generation of affinity‐purified antibodies with protein profiling in a multitude of tissues and cells, allowing one to verify, and expand, one's data using an independent source. In the case of Phgdh, tissue stainings were available for four different antibodies including two monoclonal antibodies, CAB003681 (clone 4A3‐1D6) and CAB068216 (clone CL0555), respectively. The two polyclonal antibodies, HPA021241 and HPA024031, reported low specificity (binding to 1–2 PrESTs >15% and <40%) in protein array validation assays and presence of additional bands in western blot validation assays, respectively, and as a consequence were not considered. Inspection of the images available at human protein atlas for Phgdh for the CAB068216 antibody (www.proteinatlas.org; last accessed 06.11.2014), showed an overall expression pattern for Phgdh reminiscent of the one we had observed. In breast tissue myoepithelial cells showed uniform, moderate immunostaining for Phgdh, and occasional intraduct epithelial cells displaying very strong immunostaining (Supplementary Figure 3A). Breast cancers showed high level expression (8 out of 10) (illustrated in Supplementary Figure 3B). Normal prostate epithelium showed strong expression of Phgdh in basal cells with luminal cells presenting much lower levels of Phgdh immunoreactivity (illustrated in Supplementary Figure 3C). All 10 prostate cancer samples examined expressed Phgdh at high levels (illustrated in Supplementary Figure 3D). Lung and colon epithelial cells showed only occasional staining in glandular cells (illustrated in Supplementary Figure 3E and G, respectively), whereas 5 out 11 and lung and 10 out of 12 colorectal cancers, respectively (illustrated in Supplementary Figure 3F and H, respectively), presented with high levels of Phgdh expression.
3.5. Patterns of Phgdh protein expression differ between normal and tumor cells
PKCζ was recently demonstrated to phosphorylate Phgdh at residues Ser55, Thr57, and Thr78, and that phosphorylation shown to directly regulate the enzymatic activity of Phgdh (Ma et al., 2013) in the SW480 colon cancer cell line. It was therefore conceivable that, despite the fact that we did not detect differences in overall expression of Phgdh between normal and malignant breast epithelial cells of the basal lineage, the protein could be modified differentially during carcinogenesis, with consequential functional differences. Gel‐based proteomics relies on the intrinsic resolving ability of 2D‐PAGE gels, which separate proteins orthogonally according to their pI and molecular mass. Accordingly, 2D‐PAGE is capable of detecting pI changes caused by post‐translational modifications (PTMs), insofar as these PTMs alter the net electric charge of the protein. This makes 2D gels particularly useful to investigate patterns of PTM changes, such as glycosylation and phosphorylation, in a given protein (Gorg et al., 2004; Rogowska‐Wrzesinska et al., 2013). Two‐dimensional Western blots of TNBC samples overexpressing Phgdh (illustrated in Figure 9A), revealed a complex pattern of expression for Phgdh, detected as chains of spots (Figure 9B and C). We observed essentially two main forms of protein variants (labeled α and β, respectively) that differed by approximately 3 kDa in size (Figure 9C, boxed in red stipled line and black stipled lines, respectively), with each form displaying multiple modifications (indicated by multiple black and red arrowheads, respectively). The identity of the spots as Phgdh was confirmed by mass spectrometry analysis. To determine whether the differences were due to Phgdh phosphorylation status, we performed in vitro dephosphorylation of protein lysates by λ‐phosphatase prior to 2D electrophoresis but found no difference in the patterns of expression for Phgdh (data not shown), which indicated that another PTM, rather than phosphorylation, is at play.
Figure 9.
Two‐dimensional Western blot (2D‐WB) profiling of Phgdh expression patterns. (A) Representative silver stained 2D‐PAGE IEF gel of proteins extracted from a TNBC sample and (B) corresponding 2D‐WB. The framed area in the 2D‐WB, corresponding to the portion of the gel that contain Phgdh, is shown enlarged in (C). The two main protein variants, α and β, are framed, and each spot corresponding to a modification of one of the variants are indicated by arrowheads, black for the α forms and red for the β forms, respectively.
To determine if the pattern of isoform expression differed between normal and tumor samples we analysed sets of matched samples. The amount of sample required for 2D western blot analysis was a limiting factor, such that due to sample availability issues we were only able to analyze six matched sets of TNBC samples (representative images are presented in Figure 10). In addition, we could analyze one matched luminal sample (Figure 10), and one matched IAC sample that expressed Phgdh, as well as five additional normal and 8 TNBC samples. The pattern of expression of Phgdh variants we observed differed between normal and tumor samples, since normal tissue samples did not exhibit the same number of variants (illustrated in Figure 10A, matched tumor and normal tissue samples from same patient). Normal samples generally did not express the β variant forms, or expressed it at low levels (Figure 10A and B, Normal panels, respectively), whereas tumors expressed the β variant forms at levels matching, or even surpassing, those of the α variants (Figure 10A and B, Tumor panels respectively). Lymph node metastasis samples displayed the same patterns as matched tumor samples (illustrated in Figure 10B, compare Tumor and Metastasis panels, respectively). Greater than normal expression of the β variant forms was consistently observed for tumor tissue samples, independently of breast cancer subtype (illustrated in Figure 10C for luminal cancer). Even the IAC sample we had, which expressed Phgdh, overexpressed the β variants in relation to matched normal tissue (Figure 10D, compare Normal with Tumor and Metastasis panels).
Figure 10.
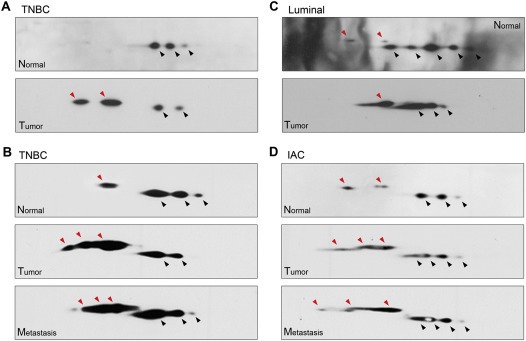
Two‐dimensional Western blot profiling of Phgdh expression patterns in matched samples. (A) Matched normal and tumor samples (TNBC) (B) 2D‐WB from another TNBC patient with matched normal, tumor, and lymph node metastasis. (C) Matched normal and tumor samples from a luminal sample. (D) 2D‐WB of normal, tumor, and lymph node metastasis from an IAC sample that expressed Phgdh by IHC. Spots corresponding to the two main protein variants, α and β, are indicated by arrowheads, black for the α forms and red for the β forms, respectively.
As mentioned above, the detailed analysis of Phgdh protein variants in clinical samples is not a trivial endeavor requiring substantial amounts of biological material and constitutes a study in its own right. However, to begin addressing this question we examined whether the same pattern could be observed in a model system. For this reason we tested the MCF7 breast cancer cell line, representing a less aggressive luminal breast cancer subtype, and a more aggressive counterpart, namely, MCF‐7 p95Her2 breast cancer cells, which express a constitutively active, truncated form of Her2 (p95Her2). We observed the same shift in ratios of expression between the α and β Phgdh protein variants in MCF‐7 p95Her2 breast cancer cells, which express a constitutively active, truncated form of Her2 (p95Her2), compared to MCF‐7 cells transfected with vector control alone (Figure 11A). The p95Her2 fragment expressed in these cells mimics the proteolytically cleaved form of ErbB2 commonly found in highly malignant, aggressive breast cancers (Saez et al., 2006; Scaltriti et al., 2007) that was found to lead to the progression of breast tumors far more aggressive and metastatic than those driven by high levels of full‐length Her2 (Pedersen et al., 2009; Rafn et al., 2012). To evaluate whether expression of the Phgdh β variants was associated with malignant transformation, we examined the expression pattern of Phgdh in normal primary epidermal keratinocytes and in SV40 transformed keratinocytes (SVK14). As was the case for breast tumors, we found that SVK14 cells expressed the β form of Phgdh abundantly, whereas normal keratinocytes only expressed the α form (Figure 11B, compare SVK14 with normal keratinocytes panels, respectively).
Figure 11.
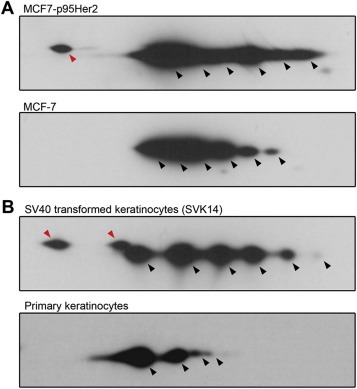
Two‐dimensional Western blot profiling of Phgdh expression patterns in (A) MCF‐7 cells expressing p95Her2 (MCF7‐p95Her2) or control vector (MCF‐7), and (B) in the human keratinocyte SVK14 cell line and normal primary epidermal keratinocytes. Spots corresponding to the two main protein variants, α and β, are indicated by arrowheads, black for the α forms and red for the β forms, respectively.
4. Discussion
Scrutiny of our proteomics database for TNBC‐specific proteins identified Phgdh (Figure 1A and B), a key regulatory activity in the serine biosynthetic pathway, as being highly expressed in a substantial fraction of samples (64 out of 72 samples, corresponding to 89%). This observation was consistent with a number of recent studies that have provided direct evidence for a role of Phgdh in breast cancer: Phgdh locates to a region that was identified as showing frequent focal somatic copy‐number alterations in breast cancer, with 6% of primary tumors showing amplifications in Phgdh (Beroukhim et al., 2010; Possemato et al., 2011), Phgdh is overexpressed in ER‐negative breast cancer (Locasale et al., 2011; Pollari et al., 2011; Possemato et al., 2011) and Phgdh expression is associated with TNBCs (Kim et al., 2014; Noh et al., 2014). Glucose flux towards glycine production, through de novo serine biosynthesis, can be substantial in cancer cells, and in some cases there is functional addiction to Phgdh, as two convergent studies have identified this protein as being critical for growth and survival of those cancer cells that overexpress it (Locasale et al., 2011; Possemato et al., 2011). Taken as a whole, these data are rather suggestive; altered tumor metabolism is a hallmark of cancer (Hanahan and Weinberg, 2011), and different tumors may harbor distinct metabolic alterations that are able to support their particular malignant phenotype. One such alteration could be increased Phgdh activity, as a consequence of overexpression due to, at least in a significant fraction of cases, gene copy number amplification. However, copy number analysis (GISTIC2) analysis of The Cancer Genome Atlas (TCGA) breast dataset (primary solid tumor cohort ‐ breast invasive carcinoma, 891 tumor samples), showed that Phgdh is not significantly focally amplified in this breast cancer cohort (http://gdac.broadinstitute.org/runs/analyses:2013_01_16/reports/cancer/BRCA‐TP/; last accessed 07.03.2013). Clearly then, a regulatory mechanism other than gene copy number amplification must be responsible for Phgdh upregulation in breast tumors. As overexpression of Phgdh was associated with ER‐negative disease (Table 2) (Kim et al., 2014; Locasale et al., 2011; Pollari et al., 2011; Possemato et al., 2011), it was conceivable that molecular factors that correlate with ER‐negative disease, such as EGFR (Corkery et al., 2009) played a role. However, analysis of our breast proteomic datasets, showed that, although we did identify Phgdh as being highly expressed in a significant fraction of TNBC samples, IAC, a breast cancer subtype normally presenting as TNBC (24 out of the 33 IAC samples examined were TNBC), was associated with lack of expression of Phgdh (1, 6A, and Figure 7). Thus, while overexpression of Phgdh was significantly associated with ER‐negative status (Table 2), the regulatory mechanism(s) underlying its enhanced expression may not be directly related to ER activity, or lack thereof, per se. Indeed, comparative analysis of Phgdh expression patterns with several molecular markers (Figure 4), showed that high level expression of Phgdh in mammary epithelium, be it in normal or malignant cells, was associated mainly with CK5 expression (4, 5, and Table 3). Expression of basal cytokeratins (CK5, 6 and 17) together with high expression of genes associated with cell proliferation are characteristic features of the basal‐like subtype of breast cancer (BLBC). Although there is a high degree of overlap between the TNBC and BLBC definitions, they are not synonymous entities (Carey et al., 2010; Gluz et al., 2009) – based on the observed concomitant Phgdh overexpression and CK5‐positivity, we would expect that Phgdh was associated with the basal subtype. Ostensibly, these data reiterate previous observations that Phgdh overexpression is associated with breast cancer of the basal subtype (Locasale et al., 2011; Noh et al., 2014; Pollari et al., 2011), however, our analysis of Phgdh expression further showed that normal mammary tissue also expressed Phgdh at high levels, in specific cell populations, namely CK5‐positive cells (2, 3, 5). Thus, overexpression of Phgdh in mammary epithelial cells is most likely not an acquired feature of basal‐type cancer, but rather an intrinsic property of the basal cell lineage, suggesting that cells, malignant or not, of this cellular lineage will generally express Phgdh at high levels. One simple rationalization of this effect is that Phgdh is under regulation of a basal cell specific factor, with a possible candidate being p73. P73 is a well‐known basal marker in breast cells (Puig et al., 2003) that is specifically expressed in myoepithelial cells (Yamamoto et al., 2001), and is able to regulate expression of Phgdh in human lung adenocarcinomas (Amelio et al., 2014).
Our observations have a number of implications. First, our data shows that Phgdh expression is cell lineage dependent, which to a large extent translates into associations with breast cancer subtype. Analysis of previously published gene expression data showed a correlation between high PHGDH expression and poor 5‐year survival for breast cancer (Possemato et al., 2011), as well as time to relapse in 368 breast cancers (P < 0.001) and to overall survival (OS) time in 393 breast cancers (P = 0.002) (Pollari et al., 2011). However, lack of tumoral Phgdh expression was shown to be predictive of a shorter OS rate (hazard ratio 3.053, 95% CI 1.002–9.305, P = 0.05) in TNBC (Noh et al., 2014). Although paradoxical at first sight, these observations can be rationalized by cell lineage effects. Our own analysis of the prognostic value of PHGDH expression on OS and RFS by breast cancer subtype (Supplementary Figure 2), supports this hypothesis.
Second, Phgdh overexpression appears to be a common defining characteristic of basal epithelial cells, valid for other tissues types, as prostate epithelium also displayed these same features (Figure 8A). Conversely, non‐stratified epithelium, which does not present basal differentiated cells, such as lung or colon (Figure 8C and D, respectively), does not display epithelial cells with high levels of Phgdh in normal tissue, although they can do so in cancer cells (Figure 8E and F).
Our results raise two questions: First, is there a function for Phgdh in basal cells that requires high level expression of this protein? One possibility is that Phgdh plays a non‐metabolic role in these cells. A recent study identified a non‐metabolic role for Phgdh in glioma cells, showing that Phgdh interacts with and stabilizes the forkhead box M1 (FoxM1) transcription factor at the protein level (Liu et al., 2013). In breast cells, FoxM1 regulates the transcriptional activity of ERα by co‐binding cognate genomic sites (Sanders et al., 2013), and a PARADIGM analysis of the gene expression signature of basal‐like tumors recognized hyperactivated FoxM1 as a transcriptional driver of the enhanced proliferation signature of these tumors (Cancer Genome Atlas, 2012). Therefore it is possible that Phgdh also plays a non‐metabolic role in breast basal epithelial cells, possibly through FoxM1.
Second, are high levels of expression of Phgdh an intrinsic feature of basal cells that enables tumorigenesis? In the absence of glucose, cancer cells can reprogram their cellular metabolism to utilize glutamine through the serine biosynthetic pathway, a process that may involve enhanced expression of Phgdh. Potentially, several mechanisms could be responsible for such increased levels of expression: one mechanism is PHGDH gene copy number amplification, which occurs, at least in some cases (Locasale et al., 2011). Another one is enhanced transcriptional activity, either by activation or loss of repression. Both cases have been reported, with transcriptional activation of PHGDH by cancer‐associated factors that regulate energy metabolism, such as Myc (Dang et al., 2009) or p53 (Maddocks et al., 2013), or by loss of PKCζ, a metabolic tumor suppressor (Ma et al., 2013). In addition, Phgdh activity is under multiple regulatory constraints, not only at the gene expression level but also at the protein level. Thus, PKCζ phosphorylates Phgdh at key residues to inhibit its enzymatic activity (Ma et al., 2013). Consequently, high‐level expression of Phgdh in normal CK5‐positive epithelial cells, may not necessarily result in metabolic reprograming and tumorigenesis. But one would expect that PKCζ deficiency alone would allow basal cells to reprogram their metabolism to utilize glutamine through the serine biosynthetic pathway under conditions of nutrient stress, thus obviating the need for an additional mechanism that can enhance expression of PHGDH. Hence, overexpression of Phgdh in normal CK5‐positive cells may be an intrinsic characteristic of basal cells in stratified epithelium that could function as an enabling trait for tumorigenesis.
Finally, it is conceivable that Phgdh activity, rather than overall expression, is associated with malignant phenotype, which would challenge the value of any simple expression analysis. A recent report has shown that simple overexpression of Phgdh is not sufficient to confer SW480 colon carcinoma cells the ability to survive and proliferate under nutrient‐scarce conditions (Ma et al., 2013). We showed here that Phgdh is expressed in two major protein variants that differed by approximately 3 kDa in size (Figure 9), which we termed α and β, with each form showing multiple modifications. The expression ratio between the α and β forms varied drastically in the six matched normal and tumor TNBC samples we analysed (illustrated in Figure 10), due to an apparent increase in expression of the β variants (Figure 10; compare normal with tumor samples, red arrows). We observed the same transition in samples of the luminal type (Figure 10C), and even in the single apocrine tumor we had that expressed PHGDH (Figure 10D). Expression of the β variants can be elicited by malignancy (Figure 11B) or by exacerbation of a malignant phenotype (Figure 11A), but it is unclear, at this point, what the relationship may be, and further studies determining a causal relationship and the actual nature of the α and β variants are needed. Also, due to sample availability issues we only were able to analyze six matched sets of TNBC samples (all showed the same alteration in expression ratio of Phgdh variants), as well as five different normal and 8 TNBC samples (again, all showed the same pattern of variant expression). Phgdh has seven known splice variants, two of which are protein coding (ENSEMBL transcripts ENST00000369409 and ENST00000369407). The latter translate into proteins of 533aa and 499aa, corresponding to 53.1 kDa and 56.6 kDa, respectively. The parallel between the expected sizes of these variants and the sizes of the observed α and β variants is very suggestive, and it is tempting to conclude that the α and β variants we detected by 2D Western correspond to ENST00000369409 and ENST00000369407, respectively, but to present we have been unable to confirm this. Finally, given the very limited number of samples analysed, a larger cohort needs to be examined to verify this finding.
Supporting information
The following are the supplementary data related to this article:
Supplementary data
Figure S1 Immunostaining of PFFE sections with anti‐Phgdh antibody (4A3‐1D6 clone) was abolished when the antibody was pre‐incubated with recombinant Phgdh protein prior to IHC assay. In all cases, we observed loss of immunoreactivity when tissue sections (DCTB131, compare left and right hand panels; serial sections stained with 4A3‐1D6 antibody alone or pre‐incubated with recombinant Phgdh protein, respectively), or cell lines (MDA‐MB‐453, compare left and right hand panels; serial sections stained with 4A3‐1D6 antibody alone or pre‐incubated with recombinant Phgdh protein, respectively) were reacted with mAb 4A3‐1D6 antibody that was pre‐incubated with full length recombinant Phgdh polypeptide (recPhgdh). Original magnification, ×20.
Figure S2 Kaplan–Meier survival curves relative to PHGDH expression were generated for breast cancer using KM‐plotter. Overall survival (OS) and relapse free survival (RFS) were selected for analysis of either all patients, or by subtypes (basal, luminal A, and luminal B) and patients dichotomized by the median of PHGDH expression. In all cases, a 10 year followup was selected, with data censored at threshold. Red and black lines indicate patients with higher and lower than median PHGDH expression, respectively. The total number of patients in each of the two categories is shown. Hazard ratios (HR) and p values (log rank P) are shown for each plot. Data was generated by KM‐plotter (www.kmplot.com).
Figure S3 Phgdh expression patterns in normal human and corresponding cancers present in the Human Protein Atlas database. Immunohistochemical analysis of Phgdh expression in (A) normal breast and (B) a breast cancer sample. (C) Normal prostate an (D) a prostate cancer sample, (E) normal lung and (F) a lung carcinoma. (G) Normal colon and (H) a colorectal carcinoma. Original cores are presented with available sample identification information as well as areas shown in higher magnification indicated by a red square. All cores and images were retrieved from Human Protein Atlas (www.proteinatlas.org; accessed 07.11.2014).
Acknowledgments
The authors wish to thank Genkichi Iwakoshi, Sofia Svensson, and Anni Handesten for expert technical assistance. We would also like to thank Niels Kroman, Department of Breast Surgery, Copenhagen University Hospital, Denmark, for his invaluable support. This work was supported by the Danish Cancer Society through the budget of the Danish Cancer Society Research Center, and by grants from the “Race against Breast Cancer” foundation, and the John and Birthe Meyer Foundation.
Supplementary data 1.
1.1.
Supplementary data related to this article can be found at http://dx.doi.org/10.1016/j.molonc.2015.05.003.
Gromova Irina, Gromov Pavel, Honma Naoko, Kumar Sudha, Rimm David, Talman Maj-Lis Møller, Timmermans Wielenga Vera, Moreira José M.A., (2015), High level PHGDH expression in breast is predominantly associated with keratin 5‐positive cell lineage independently of malignancy, Molecular Oncology, 9, doi: 10.1016/j.molonc.2015.05.003.
References
- Amelio, I. , Markert, E.K. , Rufini, A. , Antonov, A.V. , Sayan, B.S. , Tucci, P. , Agostini, M. , Mineo, T.C. , Levine, A.J. , Melino, G. , 2014. p73 regulates serine biosynthesis in cancer. Oncogene. 33, 5039–5046. [DOI] [PubMed] [Google Scholar]
- Anders, C.K. , Carey, L.A. , 2009. Biology, metastatic patterns, and treatment of patients with triple-negative breast cancer. Clin. Breast Cancer. 9, (Suppl 2) S73–S81. [DOI] [PMC free article] [PubMed] [Google Scholar]
- Beroukhim, R. , Mermel, C.H. , Porter, D. , Wei, G. , Raychaudhuri, S. , Donovan, J. , Barretina, J. , Boehm, J.S. , Dobson, J. , Urashima, M. , Mc Henry, K.T. , Pinchback, R.M. , Ligon, A.H. , Cho, Y.J. , Haery, L. , Greulich, H. , Reich, M. , Winckler, W. , Lawrence, M.S. , Weir, B.A. , Tanaka, K.E. , Chiang, D.Y. , Bass, A.J. , Loo, A. , Hoffman, C. , Prensner, J. , Liefeld, T. , Gao, Q. , Yecies, D. , Signoretti, S. , Maher, E. , Kaye, F.J. , Sasaki, H. , Tepper, J.E. , Fletcher, J.A. , Tabernero, J. , Baselga, J. , Tsao, M.S. , Demichelis, F. , Rubin, M.A. , Janne, P.A. , Daly, M.J. , Nucera, C. , Levine, R.L. , Ebert, B.L. , Gabriel, S. , Rustgi, A.K. , Antonescu, C.R. , Ladanyi, M. , Letai, A. , Garraway, L.A. , Loda, M. , Beer, D.G. , True, L.D. , Okamoto, A. , Pomeroy, S.L. , Singer, S. , Golub, T.R. , Lander, E.S. , Getz, G. , Sellers, W.R. , Meyerson, M. , 2010. The landscape of somatic copy-number alteration across human cancers. Nature. 463, 899–905. [DOI] [PMC free article] [PubMed] [Google Scholar]
- Bertucci, F. , Finetti, P. , Cervera, N. , Charafe-Jauffret, E. , Mamessier, E. , Adelaide, J. , Debono, S. , Houvenaeghel, G. , Maraninchi, D. , Viens, P. , Charpin, C. , Jacquemier, J. , Birnbaum, D. , 2006. Gene expression profiling shows medullary breast cancer is a subgroup of basal breast cancers. Cancer Res. 66, 4636–4644. [DOI] [PubMed] [Google Scholar]
- Cabezon, T. , Gromova, I. , Gromov, P. , Serizawa, R. , Timmermans Wielenga, V. , Kroman, N. , Celis, J.E. , Moreira, J.M. , 2013. Proteomic profiling of triple-negative breast carcinomas in combination with a three-tier orthogonal technology approach identifies Mage-A4 as potential therapeutic target in estrogen receptor negative breast cancer. Mol. Cell. Proteomics: MCP. 12, 381–394. [DOI] [PMC free article] [PubMed] [Google Scholar]
- Cailleau, R. , Olive, M. , Cruciger, Q.V. , 1978. Long-term human breast carcinoma cell lines of metastatic origin: preliminary characterization. In Vitro. 14, 911–915. [DOI] [PubMed] [Google Scholar]
- Camp, R.L. , Dolled-Filhart, M. , King, B.L. , Rimm, D.L. , 2003. Quantitative analysis of breast cancer tissue microarrays shows that both high and normal levels of HER2 expression are associated with poor outcome. Cancer Res. 63, 1445–1448. [PubMed] [Google Scholar]
- Cancer Genome Atlas, N. , 2012. Comprehensive molecular portraits of human breast tumours. Nature. 490, 61–70. [DOI] [PMC free article] [PubMed] [Google Scholar]
- Carey, L. , Winer, E. , Viale, G. , Cameron, D. , Gianni, L. , 2010. Triple-negative breast cancer: disease entity or title of convenience? Nature reviews. Clin. Oncol. 7, 683–692. [DOI] [PubMed] [Google Scholar]
- Celis, J.E. , Cabezon, T. , Moreira, J.M. , Gromov, P. , Gromova, I. , Timmermans-Wielenga, V. , Iwase, T. , Akiyama, F. , Honma, N. , Rank, F. , 2009. Molecular characterization of apocrine carcinoma of the breast: validation of an apocrine protein signature in a well-defined cohort. Mol. Oncol. 3, 220–237. [DOI] [PMC free article] [PubMed] [Google Scholar]
- Celis, J.E. , Gromov, P. , Cabezon, T. , Moreira, J.M. , Friis, E. , Jirstrom, K. , Llombart-Bosch, A. , Timmermans-Wielenga, V. , Rank, F. , Gromova, I. , 2008. 15-prostaglandin dehydrogenase expression alone or in combination with ACSM1 defines a subgroup of the apocrine molecular subtype of breast carcinoma. Mol. Cell. Proteomics: MCP. 7, 1795–1809. [DOI] [PubMed] [Google Scholar]
- Celis, J.E. , Gromov, P. , Moreira, J.M. , Cabezon, T. , Friis, E. , Vejborg, I.M. , Proess, G. , Rank, F. , Gromova, I. , 2006. Apocrine cysts of the breast: biomarkers, origin, enlargement, and relation with cancer phenotype. Mol. Cell. Proteomics: MCP. 5, 462–483. [DOI] [PubMed] [Google Scholar]
- Celis, J.E. , Trentemølle, S. , Gromov, P. , 2005. Gel-based proteomics: high-resolution two-dimensional gel electrophoresis of proteins. Isoelectric focusing (IEF) and nonequilibrium pH gradient electrophoresis (NEPHGE). In Celis J.E., Carter N., Hunter T., Shotton D., Simons K., Small J.V.(Eds.), Cell Biology. A Laboratory Handbook. third ed Elsevier; San Diego: 165–177. [Google Scholar]
- Cerami, E. , Gao, J. , Dogrusoz, U. , Gross, B.E. , Sumer, S.O. , Aksoy, B.A. , Jacobsen, A. , Byrne, C.J. , Heuer, M.L. , Larsson, E. , Antipin, Y. , Reva, B. , Goldberg, A.P. , Sander, C. , Schultz, N. , 2012. The cBio cancer genomics portal: an open platform for exploring multidimensional cancer genomics data. Cancer Discov. 2, 401–404. [DOI] [PMC free article] [PubMed] [Google Scholar]
- Chu, K.C. , Anderson, W.F. , 2002. Rates for breast cancer characteristics by estrogen and progesterone receptor status in the major racial/ethnic groups. Breast Cancer Res. Treat. 74, 199–211. [DOI] [PubMed] [Google Scholar]
- Corkery, B. , Crown, J. , Clynes, M. , O'Donovan, N. , 2009. Epidermal growth factor receptor as a potential therapeutic target in triple-negative breast cancer. Ann. Oncol. 20, 862–867. [DOI] [PubMed] [Google Scholar]
- Dang, C.V. , Le, A. , Gao, P. , 2009. MYC-induced cancer cell energy metabolism and therapeutic opportunities. Clin. Cancer Res. 15, 6479–6483. [DOI] [PMC free article] [PubMed] [Google Scholar]
- Dellapasqua, S. , Maisonneuve, P. , Viale, G. , Pruneri, G. , Mazzarol, G. , Ghisini, R. , Mazza, M. , Iorfida, M. , Rotmensz, N. , Veronesi, P. , Luini, A. , Goldhirsch, A. , Colleoni, M. , 2013. Immunohistochemically defined subtypes and outcome of apocrine breast cancer. Clin. Breast Cancer. 13, 95–102. [DOI] [PubMed] [Google Scholar]
- Dolled-Filhart, M. , Camp, R.L. , Kowalski, D.P. , Smith, B.L. , Rimm, D.L. , 2003. Tissue microarray analysis of signal transducers and activators of transcription 3 (Stat3) and phospho-Stat3 (Tyr705) in node-negative breast cancer shows nuclear localization is associated with a better prognosis. Clin. Cancer Res. 9, 594–600. [PubMed] [Google Scholar]
- Dolled-Filhart, M. , Gustavson, M. , Camp, R.L. , Rimm, D.L. , Tonkinson, J.L. , Christiansen, J. , 2010. Automated analysis of tissue microarrays. Methods Mol. Biol. 664, 151–162. [DOI] [PubMed] [Google Scholar]
- Dolled-Filhart, M. , McCabe, A. , Giltnane, J. , Cregger, M. , Camp, R.L. , Rimm, D.L. , 2006. Quantitative in situ analysis of beta-catenin expression in breast cancer shows decreased expression is associated with poor outcome. Cancer Res. 66, 5487–5494. [DOI] [PubMed] [Google Scholar]
- Egeblad, M. , Mortensen, O.H. , Jaattela, M. , 2001. Truncated ErbB2 receptor enhances ErbB1 signaling and induces reversible, ERK-independent loss of epithelial morphology. Int. J. Cancer. 94, 185–191. [DOI] [PubMed] [Google Scholar]
- Gluz, O. , Liedtke, C. , Gottschalk, N. , Pusztai, L. , Nitz, U. , Harbeck, N. , 2009. Triple-negative breast cancer–current status and future directions. Ann. Oncol. 20, 1913–1927. [DOI] [PubMed] [Google Scholar]
- Gorg, A. , Weiss, W. , Dunn, M.J. , 2004. Current two-dimensional electrophoresis technology for proteomics. Proteomics. 4, 3665–3685. [DOI] [PubMed] [Google Scholar]
- Gromov, P. , Gromova, I. , Friis, E. , Timmermans-Wielenga, V. , Rank, F. , Simon, R. , Sauter, G. , Moreira, J.M. , 2010. Proteomic profiling of mammary carcinomas identifies C7orf24, a gamma-glutamyl cyclotransferase, as a potential cancer biomarker. J. Proteome Res. 9, 3941–3953. [DOI] [PubMed] [Google Scholar]
- Gyorffy, B. , Lanczky, A. , Eklund, A.C. , Denkert, C. , Budczies, J. , Li, Q. , Szallasi, Z. , 2010. An online survival analysis tool to rapidly assess the effect of 22,277 genes on breast cancer prognosis using microarray data of 1,809 patients. Breast Cancer Res. Treat. 123, 725–731. [DOI] [PubMed] [Google Scholar]
- Hanahan, D. , Weinberg, R.A. , 2011. Hallmarks of cancer: the next generation. Cell. 144, 646–674. [DOI] [PubMed] [Google Scholar]
- Haughian, J.M. , Pinto, M.P. , Harrell, J.C. , Bliesner, B.S. , Joensuu, K.M. , Dye, W.W. , Sartorius, C.A. , Tan, A.C. , Heikkila, P. , Perou, C.M. , Horwitz, K.B. , 2012. Maintenance of hormone responsiveness in luminal breast cancers by suppression of Notch. Proc. Natl. Acad. Sci. U S A. 109, 2742–2747. [DOI] [PMC free article] [PubMed] [Google Scholar]
- Honma, N. , Takubo, K. , Akiyama, F. , Kasumi, F. , Sawabe, M. , Arai, T. , Hosoi, T. , Yoshimura, N. , Harada, N. , Younes, M. , Sakamoto, G. , 2007. Expression of oestrogen receptor-beta in apocrine carcinomas of the breast. Histopathology. 50, 425–433. [DOI] [PubMed] [Google Scholar]
- Honma, N. , Takubo, K. , Akiyama, F. , Sawabe, M. , Arai, T. , Younes, M. , Kasumi, F. , Sakamoto, G. , 2005. Expression of GCDFP-15 and AR decreases in larger or node-positive apocrine carcinomas of the breast. Histopathology. 47, 195–201. [DOI] [PubMed] [Google Scholar]
- Irshad, S. , Ellis, P. , Tutt, A. , 2011. Molecular heterogeneity of triple-negative breast cancer and its clinical implications. Curr. Opin. Oncol. 23, 566–577. [DOI] [PubMed] [Google Scholar]
- Jeon, H.M. , Kim do, H. , Jung, W.H. , Koo, J.S. , 2013. Expression of cell metabolism-related genes in different molecular subtypes of triple-negative breast cancer. Tumori. 99, 555–564. [DOI] [PubMed] [Google Scholar]
- Kabos, P. , Haughian, J.M. , Wang, X. , Dye, W.W. , Finlayson, C. , Elias, A. , Horwitz, K.B. , Sartorius, C.A. , 2011. Cytokeratin 5 positive cells represent a steroid receptor negative and therapy resistant subpopulation in luminal breast cancers. Breast Cancer Res. Treat. 128, 45–55. [DOI] [PMC free article] [PubMed] [Google Scholar]
- Kim, S.K. , Jung, W.H. , Koo, J.S. , 2014. Differential expression of enzymes associated with serine/glycine metabolism in different breast cancer subtypes. PLoS One. 9, e101004 [DOI] [PMC free article] [PubMed] [Google Scholar]
- Leal, C. , Henrique, R. , Monteiro, P. , Lopes, C. , Bento, M.J. , De Sousa, C.P. , Lopes, P. , Olson, S. , Silva, M.D. , Page, D.L. , 2001. Apocrine ductal carcinoma in situ of the breast: histologic classification and expression of biologic markers. Hum. Pathol. 32, 487–493. [DOI] [PubMed] [Google Scholar]
- Lehmann, B.D. , Bauer, J.A. , Chen, X. , Sanders, M.E. , Chakravarthy, A.B. , Shyr, Y. , Pietenpol, J.A. , 2011. Identification of human triple-negative breast cancer subtypes and preclinical models for selection of targeted therapies. J. Clin. Invest. 121, 2750–2767. [DOI] [PMC free article] [PubMed] [Google Scholar]
- Liu, J. , Guo, S. , Li, Q. , Yang, L. , Xia, Z. , Zhang, L. , Huang, Z. , Zhang, N. , 2013. Phosphoglycerate dehydrogenase induces glioma cells proliferation and invasion by stabilizing forkhead box M1. J. Neurooncol. 111, (3) 245–255. [DOI] [PMC free article] [PubMed] [Google Scholar]
- Locasale, J.W. , Grassian, A.R. , Melman, T. , Lyssiotis, C.A. , Mattaini, K.R. , Bass, A.J. , Heffron, G. , Metallo, C.M. , Muranen, T. , Sharfi, H. , Sasaki, A.T. , Anastasiou, D. , Mullarky, E. , Vokes, N.I. , Sasaki, M. , Beroukhim, R. , Stephanopoulos, G. , Ligon, A.H. , Meyerson, M. , Richardson, A.L. , Chin, L. , Wagner, G. , Asara, J.M. , Brugge, J.S. , Cantley, L.C. , Vander Heiden, M.G. , 2011. Phosphoglycerate dehydrogenase diverts glycolytic flux and contributes to oncogenesis. Nat. Genet. 43, 869–874. [DOI] [PMC free article] [PubMed] [Google Scholar]
- Ma, L. , Tao, Y. , Duran, A. , Llado, V. , Galvez, A. , Barger, J.F. , Castilla, E.A. , Chen, J. , Yajima, T. , Porollo, A. , Medvedovic, M. , Brill, L.M. , Plas, D.R. , Riedl, S.J. , Leitges, M. , Diaz-Meco, M.T. , Richardson, A.D. , Moscat, J. , 2013. Control of nutrient stress-induced metabolic reprogramming by PKCzeta in tumorigenesis. Cell. 152, 599–611. [DOI] [PMC free article] [PubMed] [Google Scholar]
- Maddocks, O.D. , Berkers, C.R. , Mason, S.M. , Zheng, L. , Blyth, K. , Gottlieb, E. , Vousden, K.H. , 2013. Serine starvation induces stress and p53-dependent metabolic remodelling in cancer cells. Nature. 493, 542–546. [DOI] [PMC free article] [PubMed] [Google Scholar]
- Moll, R. , Franke, W.W. , Schiller, D.L. , Geiger, B. , Krepler, R. , 1982. The catalog of human cytokeratins: patterns of expression in normal epithelia, tumors and cultured cells. Cell. 31, 11–24. [DOI] [PubMed] [Google Scholar]
- Montagna, E. , Maisonneuve, P. , Rotmensz, N. , Cancello, G. , Iorfida, M. , Balduzzi, A. , Galimberti, V. , Veronesi, P. , Luini, A. , Pruneri, G. , Bottiglieri, L. , Mastropasqua, M.G. , Goldhirsch, A. , Viale, G. , Colleoni, M. , 2013. Heterogeneity of triple-negative breast cancer: histologic subtyping to inform the outcome. Clin. Breast Cancer. 13, 31–39. [DOI] [PubMed] [Google Scholar]
- Moreira, J.M. , Cabezon, T. , Gromova, I. , Gromov, P. , Timmermans-Wielenga, V. , Machado, I. , Llombart-Bosch, A. , Kroman, N. , Rank, F. , Celis, J.E. , 2010. Tissue proteomics of the human mammary gland: towards an abridged definition of the molecular phenotypes underlying epithelial normalcy. Mol. Oncol. 4, 539–561. [DOI] [PMC free article] [PubMed] [Google Scholar]
- Mullarky, E. , Mattaini, K.R. , Vander Heiden, M.G. , Cantley, L.C. , Locasale, J.W. , 2011. PHGDH amplification and altered glucose metabolism in human melanoma. Pigment Cell Melanoma Res. 24, 1112–1115. [DOI] [PubMed] [Google Scholar]
- Neumeister, V.M. , Sullivan, C.A. , Lindner, R. , Lezon-Geyda, K. , Li, J. , Zavada, J. , Martel, M. , Glazer, P.M. , Tuck, D.P. , Rimm, D.L. , Harris, L. , 2012. Hypoxia-induced protein CAIX is associated with somatic loss of BRCA1 protein and pathway activity in triple negative breast cancer. Breast Cancer Res. Treat. 136, 67–75. [DOI] [PubMed] [Google Scholar]
- Niemeier, L.A. , Dabbs, D.J. , Beriwal, S. , Striebel, J.M. , Bhargava, R. , 2010. Androgen receptor in breast cancer: expression in estrogen receptor-positive tumors and in estrogen receptor-negative tumors with apocrine differentiation. Mod. Pathol. 23, 205–212. [DOI] [PubMed] [Google Scholar]
- Noh, S. , Kim do, H. , Jung, W.H. , Koo, J.S. , 2014. Expression levels of serine/glycine metabolism-related proteins in triple negative breast cancer tissues. Tumour Biol. 35, 4457–4468. [DOI] [PubMed] [Google Scholar]
- O'Malley, F.P. , Bane, A. , 2008. An update on apocrine lesions of the breast. Histopathology. 52, 3–10. [DOI] [PubMed] [Google Scholar]
- Olsen, E. , Rasmussen, H.H. , Celis, J.E. , 1995. Identification of proteins that are abnormally regulated in differentiated cultured human keratinocytes. Electrophoresis. 16, 2241–2248. [DOI] [PubMed] [Google Scholar]
- Pedersen, K. , Angelini, P.D. , Laos, S. , Bach-Faig, A. , Cunningham, M.P. , Ferrer-Ramon, C. , Luque-Garcia, A. , Garcia-Castillo, J. , Parra-Palau, J.L. , Scaltriti, M. , Ramon y Cajal, S. , Baselga, J. , Arribas, J. , 2009. A naturally occurring HER2 carboxy-terminal fragment promotes mammary tumor growth and metastasis. Mol. Cell. Biol. 29, 3319–3331. [DOI] [PMC free article] [PubMed] [Google Scholar]
- Pizer, L.I. , 1963. The pathway and control of serine biosynthesis in Escherichia coli . J. Biol. Chem. 238, 3934–3944. [PubMed] [Google Scholar]
- Pollari, S. , Kakonen, S.M. , Edgren, H. , Wolf, M. , Kohonen, P. , Sara, H. , Guise, T. , Nees, M. , Kallioniemi, O. , 2011. Enhanced serine production by bone metastatic breast cancer cells stimulates osteoclastogenesis. Breast Cancer Res. Treat. 125, 421–430. [DOI] [PubMed] [Google Scholar]
- Possemato, R. , Marks, K.M. , Shaul, Y.D. , Pacold, M.E. , Kim, D. , Birsoy, K. , Sethumadhavan, S. , Woo, H.K. , Jang, H.G. , Jha, A.K. , Chen, W.W. , Barrett, F.G. , Stransky, N. , Tsun, Z.Y. , Cowley, G.S. , Barretina, J. , Kalaany, N.Y. , Hsu, P.P. , Ottina, K. , Chan, A.M. , Yuan, B. , Garraway, L.A. , Root, D.E. , Mino-Kenudson, M. , Brachtel, E.F. , Driggers, E.M. , Sabatini, D.M. , 2011. Functional genomics reveal that the serine synthesis pathway is essential in breast cancer. Nature. 476, 346–350. [DOI] [PMC free article] [PubMed] [Google Scholar]
- Puig, P. , Capodieci, P. , Drobnjak, M. , Verbel, D. , Prives, C. , Cordon-Cardo, C. , Di Como, C.J. , 2003. p73 expression in human normal and tumor tissues: loss of p73alpha expression is associated with tumor progression in bladder cancer. Clin. Cancer Res. 9, 5642–5651. [PubMed] [Google Scholar]
- Rafn, B. , Nielsen, C.F. , Andersen, S.H. , Szyniarowski, P. , Corcelle-Termeau, E. , Valo, E. , Fehrenbacher, N. , Olsen, C.J. , Daugaard, M. , Egebjerg, C. , Bottzauw, T. , Kohonen, P. , Nylandsted, J. , Hautaniemi, S. , Moreira, J. , Jaattela, M. , Kallunki, T. , 2012. ErbB2-driven breast cancer cell invasion depends on a complex signaling network activating myeloid zinc finger-1-dependent cathepsin B expression. Mol. Cell. 45, 764–776. [DOI] [PubMed] [Google Scholar]
- Rastelli, F. , Biancanelli, S. , Falzetta, A. , Martignetti, A. , Casi, C. , Bascioni, R. , Giustini, L. , Crispino, S. , 2010. Triple-negative breast cancer: current state of the art. Tumori. 96, 875–888. [PubMed] [Google Scholar]
- Rogowska-Wrzesinska, A. , Le Bihan, M.C. , Thaysen-Andersen, M. , Roepstorff, P. , 2013. 2D gels still have a niche in proteomics. J. Proteomics. 88, 4–13. [DOI] [PubMed] [Google Scholar]
- Saez, R. , Molina, M.A. , Ramsey, E.E. , Rojo, F. , Keenan, E.J. , Albanell, J. , Lluch, A. , Garcia-Conde, J. , Baselga, J. , Clinton, G.M. , 2006. p95HER-2 predicts worse outcome in patients with HER-2-positive breast cancer. Clin. Cancer Res. 12, 424–431. [DOI] [PubMed] [Google Scholar]
- Sanders, D.A. , Ross-Innes, C.S. , Beraldi, D. , Carroll, J.S. , Balasubramanian, S. , 2013. Genome-wide mapping of FOXM1 binding reveals co binding with estrogen receptor alpha in breast cancer cells. Genome Biol. 14, R6 [DOI] [PMC free article] [PubMed] [Google Scholar]
- Scaltriti, M. , Rojo, F. , Ocana, A. , Anido, J. , Guzman, M. , Cortes, J. , Di Cosimo, S. , Matias-Guiu, X. , Ramon y Cajal, S. , Arribas, J. , Baselga, J. , 2007. Expression of p95HER2, a truncated form of the HER2 receptor, and response to anti-HER2 therapies in breast cancer. J. Natl. Cancer Inst. 99, 628–638. [DOI] [PubMed] [Google Scholar]
- Stingl, J. , Raouf, A. , Emerman, J.T. , Eaves, C.J. , 2005. Epithelial progenitors in the normal human mammary gland. J. Mammary Gland Biol. Neoplasia. 10, 49–59. [DOI] [PubMed] [Google Scholar]
- Sugimoto, E. , Pizer, L.I. , 1968. The mechanism of end product inhibition of serine biosynthesis. I. Purification and kinetics of phosphoglycerate dehydrogenase. J. Biol. Chem. 243, 2081–2089. [PubMed] [Google Scholar]
- Taylor-Papadimitriou, J. , Purkis, P. , Lane, E.B. , McKay, I.A. , Chang, S.E. , 1982. Effects of SV40 transformation on the cytoskeleton and behavioural properties of human keratinocytes. Cell Differ. 11, 169–180. [DOI] [PubMed] [Google Scholar]
- Tsutsumi, Y. , 2012. Apocrine carcinoma as triple-negative breast cancer: novel definition of apocrine-type carcinoma as estrogen/progesterone receptor-negative and androgen receptor-positive invasive ductal carcinoma. Jpn. J. Clin. Oncol. 42, 375–386. [DOI] [PubMed] [Google Scholar]
- Uhlen, M. , Oksvold, P. , Fagerberg, L. , Lundberg, E. , Jonasson, K. , Forsberg, M. , Zwahlen, M. , Kampf, C. , Wester, K. , Hober, S. , Wernerus, H. , Bjorling, L. , Ponten, F. , 2010. Towards a knowledge-based human protein atlas. Nat. Biotechnol. 28, 1248–1250. [DOI] [PubMed] [Google Scholar]
- Vander Heiden, M.G. , 2011. Targeting cancer metabolism: a therapeutic window opens. Nature reviews. Drug Discov. 10, 671–684. [DOI] [PubMed] [Google Scholar]
- Wang, Y. , Hayward, S. , Cao, M. , Thayer, K. , Cunha, G. , 2001. Cell differentiation lineage in the prostate. Differentiation. 68, 270–279. [DOI] [PubMed] [Google Scholar]
- Wells, C.A. , El-Ayat, G.A. , 2007. Non-operative breast pathology: apocrine lesions. J. Clin. Pathol. 60, 1313–1320. [DOI] [PMC free article] [PubMed] [Google Scholar]
- Yamamoto, T. , Oda, K. , Miyazaki, K. , Ichigotani, Y. , Takenouchi, Y. , Kamei, T. , Shirafuji, N. , Nimura, Y. , Hamaguchi, M. , Matsuda, S. , 2001. p73 is highly expressed in myoepithelial cells and in carcinomas with metaplasia. Int. J. Oncol. 19, 271–276. [DOI] [PubMed] [Google Scholar]
- Yamamoto, Y. , Iwase, H. , 2010. Clinicopathological features and treatment strategy for triple-negative breast cancer. Int. J. Clin. Oncol. 15, 341–351. [DOI] [PubMed] [Google Scholar]
Associated Data
This section collects any data citations, data availability statements, or supplementary materials included in this article.
Supplementary Materials
The following are the supplementary data related to this article:
Supplementary data
Figure S1 Immunostaining of PFFE sections with anti‐Phgdh antibody (4A3‐1D6 clone) was abolished when the antibody was pre‐incubated with recombinant Phgdh protein prior to IHC assay. In all cases, we observed loss of immunoreactivity when tissue sections (DCTB131, compare left and right hand panels; serial sections stained with 4A3‐1D6 antibody alone or pre‐incubated with recombinant Phgdh protein, respectively), or cell lines (MDA‐MB‐453, compare left and right hand panels; serial sections stained with 4A3‐1D6 antibody alone or pre‐incubated with recombinant Phgdh protein, respectively) were reacted with mAb 4A3‐1D6 antibody that was pre‐incubated with full length recombinant Phgdh polypeptide (recPhgdh). Original magnification, ×20.
Figure S2 Kaplan–Meier survival curves relative to PHGDH expression were generated for breast cancer using KM‐plotter. Overall survival (OS) and relapse free survival (RFS) were selected for analysis of either all patients, or by subtypes (basal, luminal A, and luminal B) and patients dichotomized by the median of PHGDH expression. In all cases, a 10 year followup was selected, with data censored at threshold. Red and black lines indicate patients with higher and lower than median PHGDH expression, respectively. The total number of patients in each of the two categories is shown. Hazard ratios (HR) and p values (log rank P) are shown for each plot. Data was generated by KM‐plotter (www.kmplot.com).
Figure S3 Phgdh expression patterns in normal human and corresponding cancers present in the Human Protein Atlas database. Immunohistochemical analysis of Phgdh expression in (A) normal breast and (B) a breast cancer sample. (C) Normal prostate an (D) a prostate cancer sample, (E) normal lung and (F) a lung carcinoma. (G) Normal colon and (H) a colorectal carcinoma. Original cores are presented with available sample identification information as well as areas shown in higher magnification indicated by a red square. All cores and images were retrieved from Human Protein Atlas (www.proteinatlas.org; accessed 07.11.2014).