

Abstract
Background: DNA methylation alterations are early events in tumorigenesis and important in the regulation of gene expression in cancer cells. Lung cancer patients have in general a poor prognosis, and a deeper insight into the epigenetic landscape in lung adenocarcinoma tumors and its prognostic implications is needed.
Results: We determined whole‐genome DNA methylation profiles of 164 fresh frozen lung adenocarcinoma samples and 19 samples of matched normal lung tissue using the Illumina Infinium 450K array. A large number of differentially methylated CpGs in lung adenocarcinoma tissue were identified, and specific methylation profiles were observed in tumors with mutations in the EGFR‐, KRAS‐ or TP53 genes and according to the patients' smoking status. The methylation levels were correlated with gene expression and both positive and negative correlations were seen. Methylation profiles of the tumor samples identified subtypes of tumors with distinct prognosis, including one subtype enriched for TP53 mutant tumors. A prognostic index based on the methylation levels of 33 CpGs was established, and was significantly associated with prognosis in the univariate analysis using an independent cohort of lung adenocarcinoma patients from The Cancer Genome Atlas project. CpGs in the HOX B and HOX C gene clusters were represented in the prognostic signature.
Conclusions: Methylation differences mirror biologically important features in the etiology of lung adenocarcinomas and influence prognosis.
Keywords: DNA methylation, Lung cancer, EGFR, NSCLC, LUAD, TP53, mRNA, Adenocarcinoma, KRAS, Prognosis, CpG, TP53, 450K
Highlights
Extensive DNA methylation changes linked to immune signaling.
DNA methylation in EGFR‐mutated tumors associated with oncogenic pathways.
DNA methylation with both positive and negative correlation with mRNA expression.
DNA methylation signature with prognostic information.
1. Introduction
Lung cancer is one of the most frequent cancers and the leading cause of cancer‐related deaths in the world (Jemal et al., 2011). The discoveries of treatable genetic alterations, like the EGFR‐mutations and ALK‐EML4 translocations, have furthered our understanding, and provided new treatment alternatives for lung cancer patients with metastatic disease (Politi and Herbst, 2015). Mutations in the EGFR‐, KRAS‐ and TP53 genes are important in lung cancer biology and increased understanding of the molecular alterations associated with the mutation profiles in lung cancer tumors is needed. Despite this new biological knowledge and improvements in diagnostics, surgery, and radiotherapy, the numbers of patients with relapse after curative treatment are high. It would be of great value to have a better prognostic molecular signature to guide clinicians in considerations about adjuvant treatment.
Epigenetic changes in tumor tissue are involved in the pathogenesis of lung cancer (Heller et al., 2010) and are important regulators that affect both gene activation and gene silencing. DNA methylation is the covalent addition of a methyl group to the 5th carbon of the cytosine base within the cytosine‐guanine (CpG)‐dinucleotide in the DNA. This is shown to change the chromatin structure and affect the binding of transcription factors to DNA, and may thus regulate the transcription of genes (Heller et al., 2013; Ndlovu et al., 2011; Selamat et al., 2012).
DNA methylation levels of a number of genes have been found altered in lung cancer tissue (Heller et al., 2013; Lokk et al., 2012; Morán et al., 2012; Pfeifer and Rauch, 2009). Studies have identified genes that have different methylation levels according to the histology of the lung cancer tissue (Lokk et al., 2012; Morán et al., 2012), and genes that are differentially methylated between tumors from smokers and never‐smokers (Lokk et al., 2012; Selamat et al., 2012). Little is known about how the methylation of genes differs between lung adenocarcinomas with different mutation status of the EGFR‐, KRAS‐ and TP53 genes. DNA methylation profiling has also confirmed the existence of epigenetic subtypes in cancers (Karlsson et al., 2014; Shinjo et al., 2012). Other studies have identified single candidate genes or sets of genes where DNA methylation may be linked with prognosis in NSCLC (Brock et al., 2008; Sandoval et al., 2013).
The majority of research on DNA methylation in lung cancer has so far included a limited number of samples or genes, focused on CpGs in the promoter regions and mostly lacks mRNA expression data, mutation status and survival data. To address these issues, we have performed a genome‐wide methylation study including 164 lung adenocarcinoma tissue samples and 19 matched normal lung tissue samples. Using the Illumina Infinium HumanMethylation450 BeadChip platform we investigated the differentially methylated CpGs in lung adenocarcinoma tumors and methylation changes specific to tumors from never‐smoking patients, and in tumors with mutations in the EGFR‐, KRAS‐ or TP53 gene. By using the Agilent 60K mRNA expression microarray, we analyzed the mRNA expression of 121 of the lung adenocarcinoma samples and performed correlation analysis to reveal how mRNA expression may be influenced by DNA methylation. Last, we wanted to identify a prognostic index based on the DNA methylation levels that could separate the patients into groups with good or poor prognosis.
2. Material and methods
2.1. Patients and tissue samples
Participants in this study were patients with operable lung cancer tumors submitted to the cardiothoracic surgery department at Oslo University Hospital‐Rikshospitalet, Norway, from 2006 to 2011. None of the patients included had received chemotherapy or radiotherapy prior to surgery. 164 lung adenocarcinoma samples and 19 matched normal lung tissue samples remained for further analyses after pathological re‐examination and preprocessing of the methylation data. Further information about the patients and the handling of the tissue are described in the Supplementary file. The project was approved by the institutional review board and regional ethics committee (S‐05307). All patients included received oral and written information and signed a written consent before entering the project. A separate cohort of patients from The Cancer Genome Atlas (TCGA) project (“The Cancer Genome Atlas,” n.d.) was used for validation of the prognostic index. DNA methylation data was available in a total of 450 tumor specimens at the time of analysis, but detailed follow‐up information was only available for 244 patients and thus included in the survival‐analysis. For these patients, mutation status of EGFR, KRAS and TP53 was either not available, or only available for very few samples. The main characteristics of the patients included in the final analysis and the validation cohort are listed in Table 1.
Table Table 1.
Patient characteristics and clinicopathological data for included cohorts.
| Discovery cohort | Validation cohort TCGA | |||
|---|---|---|---|---|
| Tumor | Normal lung | All samples | Samples included in the survival‐analysis | |
| n = 164 | n = 19 | n = 450 | n = 244 | |
| Age (years): | ||||
| Median: | 65 | 57 | 66 | 67 |
| Range: | 39–84 | 47–79 | 33–88 | 33–86 |
| Sex: | ||||
| Females | 91 | 10 | 230 | 130 |
| Males: | 73 | 9 | 194 | 114 |
| NA: | 26 | |||
| Smoking history: | ||||
| Current/former: | 143 | 14 | 347 | 197 |
| Never: | 21 | 5 | 64 | 34 |
| NA: | 39 | 13 | ||
| KRAS mutation status: | ||||
| KRAS mutation: | 53 | 16 | 9 | |
| KRAS wt: | 101 | 35 | 25 | |
| KRAS not tested/unknown: | 10 | 399 | 210 | |
| EGFR mutation status: | ||||
| EGFR mutation: | 20 | 19 | 15 | |
| EGFR wt: | 141 | 49 | 32 | |
| EGFR not tested/unknown: | 3 | 382 | 197 | |
| TP53 mutation status: | ||||
| TP53 mutation: | 58 | Unknown | Unknown | |
| TP53 wt: | 93 | Unknown | Unknown | |
| TP53 not tested/unknown: | 13 | Unknown | Unknown | |
| Stage: | ||||
| Ia: | 44 | 109 | 65 | |
| Ib: | 49 | 123 | 68 | |
| IIa: | 27 | 42 | 22 | |
| IIb: | 13 | 62 | 37 | |
| IIIa: | 29 | 60 | 37 | |
| IIIb: | 9 | 5 | ||
| IV: | 2 | 18 | 9 | |
| NA: | 27 | 1 | ||
| Adjuvant chemotherapy or radiation: | ||||
| Yes: | 51 | Unknown | ||
| No: | 113 | Unknown | ||
| Patient outcome (PFS) a : | n = 162 | n = 244 | ||
| Event | 63 | 78 | ||
| No event: | 99 | 166 | ||
| Follow up time (months): | ||||
| Mean: | 42.3 | 16.7 | ||
| Median: | 44 | 13.7 | ||
| Range: | 2–99 | 2–88.4 | ||
PFS: Progression free survival.
2.2. DNA methylation and mRNA expression data
DNA methylation status of tumor tissue and normal lung tissue was established using Illumina Infinium HumanMethylation450 BeadChips that cover 485,764 cytosine positions of the human genome. Preprocessing and normalization involved steps of probe filtering, color bias correction, background subtraction and subset quantile normalization as previously described (Touleimat and Tost, 2012). After preprocessing of the data 456,946 probes and 164 tumor samples and 19 normal lung samples were included.
The bioinformatic analyses were performed using two different datasets. The first dataset included methylation levels of all probes that remained after the preprocessing step. The second dataset, the “gene region collapsed” methylation dataset, was constructed to reduce the dimensions of the methylation data and to focus the analyses on regions that are most relevant for gene function. In this dataset, we used the median methylation levels of all CpGs mapped to one of the six subregions in the gene. The subregions are located 1) between 1500 and 200 base pairs upstream of transcription start site (TSS), 2) between 200 bp upstream of TSS to the TSS, 3) in the 5′UTR, 4) in the first exon, 5) in the gene body or 6) in the 3′UTR. The intergenic CpGs were not included in this dataset. The “gene region collapsed” dataset included 79,000 targets. The raw data and normalized data are available in Gene Expression Omnibus (GEO) with accession number GSE66836. Technical validation of the methylation data was performed by pyrosequencing of 11 selected probes in 162 tumor samples and 18 normal lung tissue samples (Supplementary file).
A subset of the lung adenocarcinoma samples (n = 121) had mRNA expression data available. The mRNA expression was assessed using gene expression microarrays from Agilent technologies (SurePrint G3 human GE, 8 × 60 K) (Supplementary file). The mRNA expression data is available in GEO with accession number GSE66863.
2.3. Statistical analyses
All statistical analyses were performed using the R computing framework (R Core Team, 2014) and the R‐script is added as a supplementary text file (Lung_450k_publication.txt).
2.3.1. Hierarchical clustering
Unsupervised hierarchical clustering was performed using the DNA methylation levels of the 1000 most variable gene regions. The distance matrix was calculated using Pearson correlation and average linkage was applied. The differences in the distribution of the clinical and molecular variables between the different clusters were analyzed using Chi‐square test and Fisher's exact test when appropriate. Log‐rank test and Kaplan–Meier curves were used to test the clusters association with time to progression, and a multivariate Cox regression model was applied to adjust for known clinical variables. A p‐value < 0.05 was considered statistically significant.
2.3.2. Differentially methylated genes between groups
Significance Analysis of Microarrays (SAM) (Tusher et al., 2001) using standardized Wilcoxon rank statistics was performed to identify differentially methylated probes between the identified clusters and between lung adenocarcinoma samples and normal lung tissue samples. The analyses were performed using the SAM function, R package samr (Tibshirani R, Chu G, Balasubramanian N, n.d.) with 100 permutations. We first applied the SAM analysis between all lung adenocarcinoma samples and all normal lung tissue samples (unpaired SAM list), and then only to the paired lung adenocarcinoma tissue and the normal lung tissue samples (paired SAM list). The methylation probes significantly altered in both the paired‐ and unpaired SAM analyses were used for further analysis (overlapping SAM list). The same steps as above were performed on the “gene region collapsed” methylation dataset. SAM analyses were applied to study differentially methylated CpGs between tumor tissue from never‐smokers and smokers/former smokers, and between mutated and wild type tumors of the EGFR, KRAS and TP53 genes. To identify differentially methylated gene regions between the identified clusters, multiclass SAM was applied, and the significant gene regions were associated with the different clusters by identifying the cluster with the median methylation level furthest from the other clusters (calculated with subtraction of the median methylation level for each cluster from the median methylation levels across all clusters). Methylation differences with FDR q‐value smaller than 0.01 (1%) and difference between the median methylation levels in the two groups more than 0.2 (20%) were considered statistically significant.
2.3.3. Integration of mRNA expression
The association between DNA methylation and mRNA expression was investigated by two approaches: 1) DNA methylation level of each “gene region” was compared with the expression of the corresponding gene. DNA methylation level and gene expression was tested for non‐zero correlation using Pearson correlation (R function corr.test). 2) DNA methylation level of a CpG and gene expression were tested for non‐zero correlation using Pearson correlation if a CpG was within 100 kb of TSS of a gene. The function eMap1 in the R package eMap (Sun W, n.d.) was applied for this analysis. A multiple‐comparison correction was performed for both analyses using Bonferroni correction, and a corrected p‐value <0.05 was considered as statistically significant. A negative correlation between DNA methylation and gene expression refers to the situation where increased methylation level is associated with decreased gene expression (or opposite), while a positive correlation refers to the situation where increased methylation level is associated with increased gene expression (or opposite).
2.3.4. Ingenuity Pathway Analysis
The data was analyzed using Ingenuity Pathway Analysis (IPA, http://www.ingenuity.com/). Core analyses were assessed to find the level of representation of our selected genes in already defined canonical pathways. The significance of the association between our defined gene lists and the molecular functions, diseases and canonical pathways are calculated using Fisher's exact test and the association with the canonical pathways are corrected for multiple testing by using a Benjamini‐Hochberg approach.
2.3.5. Prognostic index
Time to progression was calculated from the date of surgery to the date of diagnosis of relapse, distant metastasis or lung cancer death. Two patients in the discovery cohort had single distant metastasis at the time of surgery (stage IV) and were excluded from the survival analysis.
Lasso regression analysis presents a weighted approach indicating how well a set of predictors predicts progression‐free survival (Bøvelstad et al., 2007; Tibshirani, 1996). The analysis was performed using a set of methylation probes filtered by the correlation to mRNA expression (nominal p‐value < 0.05) and the variation in the methylation levels for each probe (interquartile range > 0.1 (10%)).
Patients were divided into high and low risk groups according to the following index for patient i:
where g is the target (CpG or gene), n is the number of targets, βg is the Lasso coefficient for target g and Xgi is the methylation value for target g in patient i. The patients were divided into two groups based on the mean prognostic index; those with prognostic index below the mean (low index) and those with prognostic index above the mean (high index). The two groups were tested with log‐rank analysis and Kaplan–Meier curves.
Log‐rank tests were performed to identify clinicopathological factors (sex, stage, age at surgery, adjuvant chemotherapy, smoking status and EGFR‐, KRAS‐ and TP53 mutational status) with significant influence on progression‐free survival using the functions Surv, survfit and survdiff (R package survival (Therneau T, n.d.)).
A Cox regression model was applied for multivariate survival analysis using the function coxph (R package survival (Therneau T, n.d.)). Factors included in the multivariate model were stage, age at surgery, adjuvant chemotherapy, smoking status and the prognostic index. A p‐value < 0.05 was considered as statistically significant. Both univariate and multivariate analyses were also performed in the validation cohort.
3. Results
Genome‐wide DNA methylation profiles using the Illumina Infinium 450K array were obtained for 164 lung adenocarcinoma samples and 19 matched normal lung tissue samples. The tumor samples were tested for mutations in the EGFR‐, KRAS‐ and TP53 genes and 20 tumors harbored EGFR mutations (12.4%), KRAS and TP53 mutations were found in 53 (34.4%) and 58 (38.4%) tumors, respectively. All of the patients with EGFR‐mutated tumors were never or former smokers while only 3 patients with KRAS‐mutated tumors and 8 patients with tumors with mutation in the TP53 gene were never‐smokers. EGFR‐ and KRAS‐mutations were mutually exclusive. Nine tumors had both EGFR mutation and mutation in the TP53 gene and 12 of the KRAS‐mutated tumors also contained a TP53 mutation. Pyrosequencing was performed as technical validation, and this data showed good concordance with the array results especially when the difference between the median methylation levels between groups were more than 20% (Supplementary Table 1).
3.1. Hierarchical cluster analysis
Unsupervised hierarchical clustering of the 164 lung adenocarcinoma samples using the most variable gene regions separated the tumors into three main clusters (Figure 1A). Cluster 1 was enriched for TP53 mutated tumors (p < 0.001) and cluster 2 was enriched for tumors from never‐smokers (p < 0.001). All tumors in cluster 3 were from smokers/former smokers and this cluster had significantly fewer EGFR mutated tumors (p = 0.031). Sex and KRAS mutation status were evenly distributed in the three clusters. Tumor stage was not significantly enriched in any cluster (p = 0.064), but there was a trend towards a higher proportion of early‐stage tumors in cluster 2. To identify gene regions accounting for the epigenetic differences between the three clusters we performed multiclass SAM analysis. This analysis revealed 3440 differentially methylated gene regions between the clusters (Supplementary Table 2). Cluster 1 included 1641 differentially methylated gene regions that in the pathway analysis were associated with the TREM 1 signaling pathway (BH‐corrected p‐value = 0.031). 958 of the gene regions were hypomethylated and 683 gene regions were hypermethylated compared with the other clusters. 647 gene regions (331 hypomethylated and 316 hypermethylated) were associated with cluster 2 and these genes were significantly associated with granulocyte and agranulocyte adhesion and diapedesis (BH‐corrected p‐value = 0.003). The aryl hydrocarbon receptor signaling pathway (BH‐corrected p‐value = 0.007) were significantly associated with the 1152 gene regions in cluster 3. In this cluster 583 gene regions were hypomethylated and 569 were hypermethylated. Results from IPA with corresponding p‐values are listed up in Supplementary Table 3. Log‐rank test and Kaplan–Meier curves revealed that patients with tumors in cluster 2 had a better prognosis and patients with tumors in cluster 1 had the worst prognosis (p‐value = 0.014) (Figure 1B). This was still significant after adjusting for clinical variables in the multivariate analysis (Supplementary Table 4).
Figure 1.
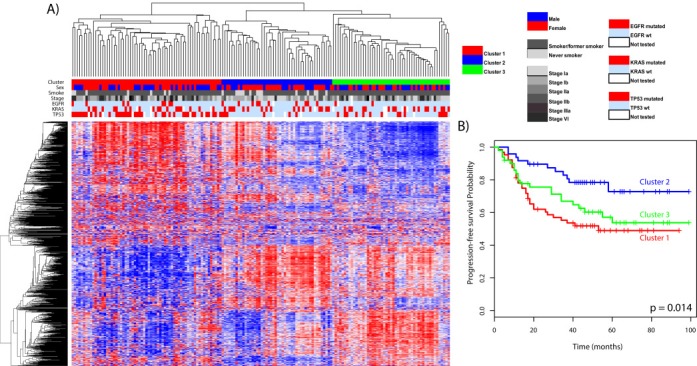
A) Unsupervised clustering of the methylation level of the 1000 most variable gene regions (rows) and 164 lung adenocarcinoma samples (columns) identified three different clusters (column colored red, blue and green). Sex, smoking status, stage, EGFR‐, KRAS‐ and TP53 mutation status are shown in the columns below the clusters. In the heatmap bricks with high methylation levels are red and low methylation levels are blue. Distance matrix: Pearson correlation. Linkage: Average. B) Kaplan–Meier curves of the three different clusters based on the methylation levels from the hierarchical cluster. Patients in cluster two have a significantly better prognosis, and patients in cluster one have a worse prognosis (p = 0.014).
3.2. Methylation differences in lung adenocarcinoma tissue and normal lung tissue
The paired and unpaired analyses between lung adenocarcinoma tissue and normal lung tissue revealed that the methylation in lung adenocarcinomas was radically changed from normal lung tissue with altered methylation in 14,530 CpGs representing 5148 unique genes. This constitutes 3% of the CpG probes on the array. 59.7% of the differentially methylated CpGs were hypermethylated (8670 probes representing 3492 genes) and 40.3% were hypomethylated (5860 probes representing 2062 genes) in the lung adenocarcinoma tissue samples. Of the identified CpGs, 7082 CpGs representing 2921 genes were significantly differentially methylated also in the TCGA data cohort (Benjamini‐Hochberg‐corrected p‐value < 0.05) (Supplementary Table 5).
SAM was also applied to the “gene region collapsed” methylation dataset comparing the differentially methylated gene regions between the lung adenocarcinoma tissue and the normal lung tissue. This analysis revealed 1222 differentially methylated gene regions, representing 1120 unique genes. 718 gene regions were hypermethylated (representing 666 unique genes) and 504 gene regions were hypomethylated (representing 467 unique genes). Both the hypermethylated and hypomethylated loci were distributed in all gene regions (Figure 2).
Figure 2.
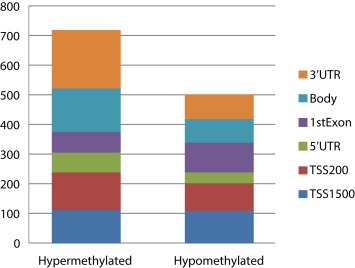
This column plot shows the numbers of hypermethylated and hypomethylated gene regions between lung adenocarcinoma samples and normal lung tissue samples. Both the hyper‐ and hypomethylated gene regions are located in all gene regions. This plot is based on the results from the “gene region collapsed” dataset.
Some of the hypermethylated CpGs in tumor tissue were localized in cancer related genes like Transforming growth factor ß (TGFß) and Insuline‐like Growth Factor 2(IGF2) and some have previously been reported as hypermethylated in lung cancer tissue such as the HOX gene clusters (Lokk et al., 2012; Rauch et al., 2007). Immunmodulating genes such as the CCL genes (Chemokine (c–C motif) Ligand 3, 4, 8, 11 and 13, 14, 15, 26) and interleukins (IL21R, IL28B, IL2RA, IL31RA, IL6 and IL4I1) were identified as hypomethylated. To investigate the molecular and cellular functions of the genes differentially methylated in lung adenocarcinoma tissue, we performed a core analysis using the results from the “gene region collapsed” data in the Ingenuity Pathway Analysis (IPA). The differentially methylated genes between lung adenocarcinoma tissue and normal lung tissue were significantly associated with cell‐to‐cell signaling and interaction and cellular movement and transport. Sub‐analysis with the hypermethylated genes was associated with gene expression, cellular growth and proliferation, and the hypomethylated genes were significantly associated with biological functions like inflammatory response and inflammatory disease. The top canonical pathways for the hypomethylated genes were “granulocyte and agranulocyte adhesion and diapedesis”.
3.3. Methylation patterns in lung adenocarcinomas associated with clinical variables and mutation status of the tumor
We identified 225 CpGs differentially methylated between tumors from never‐smokers and smokers/former smokers (Supplementary Table 6). All CpGs were hypermethylated in the tumors from the smokers/former smokers. The 225 CpGs represented 147 unique genes. LGALS4 was the top differentially methylated gene and had a strong correlation with the mRNA expression (Supplementary Figure 1). Forty‐two of the differentially methylated genes were cancer associated according to the IPA analysis. The association between methylation level and smoking status of these CpGs was also investigated in the TCGA. None of the CpGs were significantly differentially methylated in the TCGA data; however, almost all CpGs were observed with a small increase in methylation level in tumors from smokers/former smokers.
454 CpGs were differentially methylated between the EGFR‐mutated and EGFR wild type tumors, representing 275 unique genes (Supplementary Table 7). Most of the differentially methylated CpGs were hypermethylated in the EGFR‐mutant tumors with 436 CpGs hypermethylated and only 18 CpGs hypomethylated in the EGFR‐mutant lung adenocarcinomas. Core analyses in IPA show that the two top canonical pathways of these genes are EIF2 signaling and the mTOR pathway. Only EIF2 signaling pathway remained significant after multiple testing corrections.
The SAM analysis of the KRAS‐mutated tumors compared with KRAS wild type tumors identified only 2 CpGs, representing PFDN1 and MAEA that both were hypomethylated in the KRAS‐mutated tumors (Supplementary Table 8).
A total of 2375 CpGs (representing 834 unique genes) were differentially methylated between TP53‐mutated and TP53 wild type tumors. 85.3% (2026) of the CpGs were hypomethylated and 14.7% (349) were hypermethylated in the TP53‐mutated tumors (Supplementary Table 9).
3.4. Correlation with mRNA expression
The correlation between DNA methylation level and mRNA expression was examined by Pearson correlation analyses. Significant association between gene expression and DNA methylation was identified for 978 gene regions representing 737 unique genes. Methylation level of 671(68.6%) gene regions was negatively correlated to 520 unique genes while methylation level of 307 (31.4%) gene regions was positively correlated to 245 unique genes. All analyzed associations are shown in Supplementary Table 10. Negative correlations between gene expression and DNA methylation were most often found in loci located in the promoter region, while positive correlations were most often found in loci outside promoter regions (Figure 3).
Figure 3.
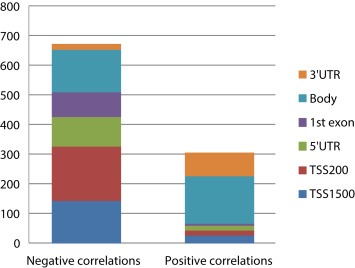
Significant correlations between the median DNA methylation levels of gene regions and mRNA expression. This plot shows both the negative and positive correlations and location of the methylated regions. This plot is based on the results from the “gene region collapsed” dataset.
The correlation analyses of gene expression levels and methylation level of single CpGs within 100 kb of TSS identified that the methylation level of 4465 CpGs was correlated to gene expression with a Bonferroni corrected p‐value of <0.05, representing 1070 unique genes. In this analysis the methylation levels of 2347 CpGs (435 unique genes) were observed with a negative correlation and 2118 CpGs (716 unique genes) were observed with a positive correlation. The negative correlations were located at all distances between −100 kb and +100 kb from TSS, but were enriched close to the TSS. The positive correlations were evenly distributed across the whole area analyzed (Supplementary Figure 2).
3.5. Prognostic index
In order to identify a smaller number of CpGs associated with time to progression a Lasso approach was applied. The dataset was filtered by correlation with mRNA expression and variation in the methylation levels so that 76,478 probes remained in the analysis. Using this method we identified a signature of 33 CpGs associated with time to progression (Table 2). The prognostic index for each patient was based on the estimated coefficients (X) from the signature and the methylation values of the 33 probes in each lung adenocarcinoma sample.
Table Table 2.
DNA methylation probes included in the prognostic index.
| Probe | Xa | Gene | Regionb |
|---|---|---|---|
| cg00121045 | −0.02652 | UNKL | 3′UTR |
| cg00277165 | −0.16778 | TRIP13 | Body |
| cg00295485 | 0.001163 | UXS1 | Body |
| cg00320094 | 0.104031 | GPR177 | Body |
| cg00381697 | −0.04284 | Intergenic | Intergenic |
| cg00940514 | −0.01017 | ADRM1 | Body |
| cg01726448 | −0.15838 | Intergenic | NA |
| cg02647265 | 0.00818 | CCDC92 | 5′UTR |
| cg02735962 | −0.04358 | FAM107B | Body |
| cg05134616 | 0.043957 | GNL1 | 3′UTR |
| cg06867482 | −0.01497 | FAM38A | Body |
| cg06912403 | −0.0201 | Intergenic | Intergenic |
| cg07291439 | 0.004856 | ZIC1 | TSS1500 |
| cg07456681 | −0.03408 | NTAN1 | Body |
| cg07928060 | −0.09005 | Intergenic | Intergenic |
| cg09560763 | −0.0569 | PRDM8 | 5′UTR |
| cg10776061 | 0.015916 | MAN2B1 | Body |
| cg11692124 | 0.069109 | Intergenic | Intergenic |
| cg13303313 | −0.02572 | Intergenic | Intergenic |
| cg13666041 | −0.02705 | ACTN1 | Body |
| cg14698646 | 0.072241 | HOXB7 | 3′UTR |
| cg18739166 | −0.14589 | LRRN1 | 5′UTR |
| cg19058685 | 0.061029 | HOXC4 | 5′UTR |
| cg20544552 | 0.018803 | Intergenic | Intergenic |
| cg20695534 | −0.06626 | HHAT | Body |
| cg20761498 | 0.066239 | Intergenic | Intergenic |
| cg21528927 | −0.03558 | SLC6A12 | Body |
| cg21738963 | −0.12176 | Intergenic | Intergenic |
| cg22097768 | −0.01107 | KCNH6 | Body |
| cg22450406 | −0.03237 | Intergenic | Intergenic |
| cg23733739 | −0.07482 | Intergenic | Intergenic |
| cg24847169 | −0.02261 | LMO1 | Body |
| cg26104475 | −0.01596 | LCP2 | Body |
Lasso coefficient (positive coefficient reflects that a high methylation level is associated with adverse prognosis).
CpG location relative to the gene.
Using a log‐rank test, we identified that the patients with low prognostic index had a significant better prognosis than the patients with a high prognostic index (p‐value < 2.2 × 10⁻¹⁶; Figure 4A).
Figure 4.
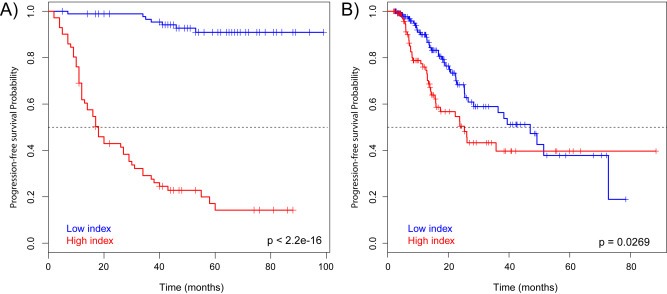
A) Kaplan–Meier curves of patients with high or low prognostic index in the discovery cohort. The prognostic index values were dichotomized to high or low index based on the median value. Low prognostic index was significantly associated with better prognosis (p = 2.2 × 10⁻¹⁶). B) Kaplan–Meier curves of patients with high or low prognostic index in the TCGA cohort. Low prognostic index was significantly associated with better prognosis (p = 0.0269).
Univariate survival analysis was performed on different clinical variables. In addition to the prognostic index, stage was significantly associated with time to progression (p = 0.003) (Supplementary Table 11).
Multivariate survival analysis was performed using Cox regression to study the influence of known prognostic factors. The prognostic index remained significantly associated with time to progression after adjusting for clinical variables (p‐value = 1.02 × 10⁻¹³; Supplementary Table 12).
To validate the prognostic index we used a separate cohort of patients with lung adenocarcinoma tumors from The Cancer Genome Atlas (TCGA) project (“The Cancer Genome Atlas,” n.d.). In this cohort the patients with low prognostic index had a significantly better prognosis than the patients with high prognostic index (p‐value = 0.0269) (Figure 4B and Supplementary Table 13), but did not reach significance in the multivariate analysis (p‐value = 0.107) (Supplementary Table 14). None of the clinical parameters were significantly associated to prognosis in the multivariate model in the TCGA cohort.
The probes in the prognostic signature were correlated with the mRNA expression of 51 genes listed in Supplementary Table 15. The CpGs in the prognostic index had both positive and negative correlation with the mRNA expression. Some of the CpGs were correlated to a number of genes, like the CpG located in the HOXB7 gene that were positively correlated with the expression of HOXB2, B5, B6, B8, and B9, and the CpG located in HOXC4 that had a positive correlation with HOXC4, C5, C6, C8, C9, C10, and C12.
4. Discussion
Epigenetic alterations are important in carcinogenesis, and increased knowledge about the impact in lung cancer can shed light on biological aspects with potential clinical application. We have identified clusters of patients based on the tumor's DNA methylation with different prognosis, and found a substantial amount of differentially methylated CpGs between lung adenocarcinoma tissue and normal lung tissue. Differential DNA methylation between tumors from smokers and never‐smokers, and tumor tissues with different EGFR‐, KRAS‐ and TP53 mutational status were also identified. By correlating the DNA methylation levels with mRNA expression levels we identified genes that may be regulated by DNA methylation. The mRNA expression was both positively and negatively correlated with the DNA methylation levels, demonstrating the complexity of the DNA methylation regulation. We also report a prognostic index based on the DNA methylation levels of 33 CpGs associated with time to progression of the disease.
The hierarchical cluster analysis based on methylation values of the most variable gene regions of the lung adenocarcinomas revealed three different clusters (Figure 1A). The different clusters were associated with genes that affected different molecular pathways, and interestingly differentially methylated genes in cluster 1 were associated with the “The triggering receptor expressed on myeloid cells 1 (TREM1) signaling pathway”. TREM 1 belongs to the Immunoglobulin (Ig) family of cell surface receptors and is known to amplify immunological responses and is an important mediator of septic shock (Bouchon et al., 2001; Colonna and Facchetti, 2003). NSCLC tumors have been shown to have high expression of TREM 1, and this has also been linked to poor survival (Ho et al., 2008; Yuan et al., 2014). Differentially methylated genes in cluster 3 were linked to the aryl hydrocarbon receptor signaling pathway. This pathway is induced by polycyclic aromatic hydrocarbons (PAH), a component in cigarette smoke, and this pathway has been linked to cigarette smoke‐induced lung cancer (Tsay et al., 2013). All patients with tumors in cluster 3 were smokers/former smokers, and DNA methylation may be a mechanism to alter this important pathway in carcinogenesis. Patients with tumors in different clusters had significantly different prognosis, with more advantageous prognosis with a 5‐year progression‐free survival of 72% for patients in cluster 2 (Figure 1B). This cluster was enriched with tumors from never‐smoking patients and it was a trend towards more early stage tumors which may affect the prognostic value, although it remained significant after adjusting for this in the multivariate analysis (Supplementary Table 4). Others have also reported subtypes based on DNA methylation (Karlsson et al., 2014), and the results presented here support the existence of clinically relevant subgroups of adenocarcinomas with prognostic impact.
We identified a substantial difference in DNA methylation between the lung adenocarcinoma tissue and normal lung tissue, with a considerable amount of CpGs that were hypomethylated. The majority of these CpGs were validated in the TCGA cohort. Identifying specific differentially methylated CpGs may reveal promising candidate molecular markers for diagnostic tests and possible targets for epigenetic therapy (Carvalho et al., 2012). Lung cancer patients have a poor prognosis, mainly because the disease is diagnosed in late stages due to its late presentation of symptoms. Biomarkers based on DNA methylation can be relatively easily accessible in biological materials such as serum, bronchial brushings, and bronchoalveolar lavage (BAL) samples, and it is quite stable and insensitive to handling in the laboratory (Laird, 2003). DNA methylation is an early event in cancer development and thus well suited as cancer biomarker (Fleischer et al., 2014), either alone or combined with other diagnostic approaches like CT scan or PET imaging.
Earlier reports comparing DNA methylation levels between lung tumors and normal lung tissue has mainly focused on regions located in the promoter area of genes (Lokk et al., 2012; Mansfield et al., 2014; Morán et al., 2012; Pfeifer and Rauch, 2009; Rauch et al., 2008; Selamat et al., 2012). In the present study, we identified a large number of hypermethylated CpGs located in the gene body and 3′UTR as well as in intergenic areas. Some of these genes with hypermethylated CpGs are of special interest in cancer development. The RB1 gene was the first tumor suppressor gene identified and is one of the key regulators of entry into cell division. CpGs located in the RB1 gene were significantly hypermethylated in lung adenocarcinoma tissue in our study and this may be an important regulatory mechanism of this important tumor suppressor gene (Di Fiore et al., 2013). CpGs in the TGFß gene family were also frequently hypermethylated in lung adenocarcinoma tissue in our study. These genes are often upregulated in cancer and believed to be involved in metastatic formation and resistance to radiotherapy (Ahn et al., 2014), we did however not find correlation with mRNA expression in our data. The IGF2 gene was also hypermethylated in lung adenocarcinoma tissue. DNA methylation was positively correlated with mRNA expression, and this gene has previously been reported overexpressed in many cancers (Livingstone, 2013). DNA methylation may be an important regulatory mechanism of this gene.
DNA hypomethylation is thought to contribute to oncogenesis by induction of genomic instability and activation of proto‐oncogenes. Cancer specific DNA hypomethylation of individual CpGs are less studied, and most of the early techniques were designed to detect only hypermethylated regions (Jovanovic et al., 2010). Hypomethylated regions in squamous cell carcinomas often occur at repetitive sequences (Rauch et al., 2008). In our data, a large amount of hypomethylated genes were associated with immune response, such as chemokines and interleukins. Inflammatory response was one of the most relevant biological functions in the IPA analysis, and the top canonical pathway was “granulocyte and agranulocyte adhesion and diapedesis”, which was also associated with cluster 2. Inflammation and immune signaling have previously been reported regulated by epigenetic events in other cancer types (Farkas et al., 2013; Fleischer et al., 2014), but it has not been linked with DNA methylation in lung cancer tumors to our knowledge. Extravasation of leukocytes and tumor cells may be important events in metastasis formation (Strell and Entschladen, 2008), and it would be of great interest for further studies. The methylation changes associated with immune signaling may reflect immune signaling by tumor cells or occur in infiltrating non‐tumor cells and is highly interesting considering the great progress made in immunology and immunotherapy in cancer.
Smoking is a well‐known risk factor for lung cancer development and hypermethylation may be involved in tobacco smoke‐induced lung carcinogenesis (Lyn‐Cook et al., 2014; Toyooka et al., 2003). It is estimated that 10–25% of all patients with lung cancer are never‐smokers (Couraud et al., 2012), and their tumors may have different genetic and epigenetic profiles. Our cluster analysis identified specific clusters based on DNA methylation that were linked with smoking. We identified 225 differentially methylated CpGs in the lung adenocarcinoma tissue from never‐smoking patients. All differentially methylated CpGs were hypermethylated in tumors from smokers, suggesting an association between tobacco smoke and DNA hypermethylation. Interestingly, the CpG with the largest difference in methylation levels between the two groups was located in LGALS4. This gene was negatively correlated with the mRNA expression, suggesting down regulation of the gene expression in tumors from smoking patients. LGALS4 modulates cell–cell and cell–matrix interactions, and has also been found downregulated in colorectal cancers, and may act as a tumor suppressor gene (Satelli et al., 2011). This was one of five genes that were hypermethylated in tumors from smoking patients compared with tumors from never‐smokers in a study by Selamat et al. (2012). When comparing methylation level between smokers and never‐smokers in the TCGA cohort, none of the CpGs identified in the present study were significantly differentially methylated; however, there was a clear trend that these CpGs were hypermethylated in tumors from smokers/former smokers.
It is well known that patients with EGFR‐mutated lung adenocarcinoma tumors have a different clinical course than patients with EGFR wild type tumors. We identified 454 differentially methylated CpGs between EGFR mutated and EGFR wild type tumors, and most were hypermethylated in the EGFR‐mutant tumors. Core analyses in IPA showed that these genes may be associated with the EIF2‐signaling pathway and mTOR signaling. The mTOR‐pathway is downstream for the EGFR and often activated in human lung cancers with EGFR mutations (Kawabata et al., 2014). Dong et al. found that the mTOR inhibitor everolimus synergizes with gefitinib (EGFR inhibitor) to achieve treatment response in lung cancer cell lines (Dong et al., 2012), and mTOR activity may contributed to resistance to EGFR TKI in lung cancer cells (Fei et al., 2013). Kawabata et al. have demonstrated that the mTOR inhibitor rapamycin inhibits tumor growth in mouse models with the EGFR TKI resistant T790M mutation (Kawabata et al., 2014). Our findings suggest that methylation changes of involved genes may contribute to this interplay between the two pathways.
KRAS is frequently mutated in lung adenocarcinoma tumors. Only two CpGs were hypomethylated in the KRAS‐mutated tumors as compared to the KRAS wild type tumors. The KRAS‐mutated samples also have few differentially expressed microRNAs (Bjaanaes et al., 2014). The methylation differences were more substantial between the TP53‐mutated tumors and TP53 wild type tumors, with 2375 differentially methylated CpGs. This has previously been studied in breast cancer tissue using the Illumina Golden Gate (Rønneberg et al., 2011). Some of the differentially methylated genes in this study were overlapping with genes in the present study, and AFF3 that was identified hypomethylated in TP53‐mutated breast cancer tumors also showed hypomethylation in 7 CpGs in the TP53‐mutant lung adenocarcinomas. This gene has been associated with tumorigenesis in acute lymphoblastic leukemia (Impera et al., 2008). In breast cancer tumors, the basal‐like subtype is often associated with both a high frequency of TP53 mutations and general hypomethylation (Koboldt et al., 2012; Silwal‐Pandit et al., 2014), and this corresponds to our finding with largely hypomethylation in the TP‐53 mutated lung adenocarcinomas. The reason for this is unknown, but hypomethylation is often associated with genomic instability that can lead to mutations (Gaudet et al., 2003) or the other way around; that TP 53 mutation affects affect important genes such as DNA 5′‐cytosine‐methyltransferases (DNMT) (Lin et al., 2010) that again lead to changes in methylation profiles. In colorectal cancer, the CIMP low tumors (hypomethylated in CpG islands) are also linked to TP53 mutations (Toyota et al., 2000).
To identify DNA methylation events of potential functional and biological significance, we integrated the DNA methylation data with gene expression data of the same tumors. We found that expression of 737 genes were significantly associated to methylation level of regions in or in close proximity to the gene. Negative correlations (suggesting that DNA methylation inhibit gene expression) were as expected found predominantly in promoter regions, but were also found in the gene bodies (Figure 3). Negative correlation between gene body methylation and gene expression has been reported previously in breast cancer (Fleischer et al., 2014). Positive correlations were predominantly found in gene bodies and 3′UTR, something that has also been reported in chronic lymphocytic leukemia (Kulis et al., 2012). Some positive correlations were found in promoter regions, and similar data was also reported in breast cancer (Fleischer et al., 2014). The majority of the differentially methylated CpGs in our analysis were not correlated with mRNA expression. It is known that DNA methylation has other functions than directly affecting the mRNA transcription, for instance by regulate microRNA expression and affect chromosomal stability (Esteller, 2008). The correction method used for multiple testing (Bonferroni) in the correlation analysis is a very strict method and may explain the relatively limited number of correlations. DNA methylation changes without correlation with mRNA expression may be important in classification and as biomarkers.
Patients with lung cancer have in general poor prognosis and this is also true for patients with operable tumors. There is a clinical need for biomarkers predicting outcome of the disease. The prognostic index is based on the methylation values of 33 methylation probes and separated the patients in groups with good and poor prognosis. Patients with low prognostic index based on this signature had a significantly better prognosis than patients with high prognostic index. Information about which patients are more likely to relapse after surgery, is valuable information for the clinician, and may help identify patients that might benefit from adjuvant treatment or more aggressive follow‐up. A prognostic test based on DNA methylation could be adapted for clinical laboratories and applicable for routine diagnostics. The prognostic signature was validated in the univariate analysis of the independent cohort of lung adenocarcinoma patients (Figure 4), but the multivariate analysis failed to confirm the signature. This may be due to the quality of the follow‐up data and the relatively short follow‐up time with a median follow‐up of only 16.7 months in the validation cohort. None of the other clinical parameters were significantly associated to prognosis in the multivariate model in the TCGA cohort, further indicating that the lung cancer cases in the TCGA are not an ideal cohort for validation of prognostic signatures.
The genes in the prognostic index were correlated with the mRNA expression of 51 genes shown in Supplementary Table 15. Some of these genes are known to be aberrantly expressed in cancer. Two of the CpGs in the prognostic index are located in HOX genes, respectively HOXB7 and HOXC4, and these were also among the gene regions that we found differentially methylated between the clusters. Genes in the HOX family are previously reported as hypermethylated in lung cancer tissue (Lokk et al., 2012; Rauch et al., 2007), but the positive correlation with mRNA expression of HOX B and C genes are to our knowledge not known. We identified 381 differentially methylated CpGs situated in different HOX genes, whereas 377 of the CpGs were hypermethylated. The HOX genes are all part of the homeobox family, acting as transcription factors, and crucial in development (Bhatlekar et al., 2014). HOX A family genes are often downregulated in primary NSCLC and in NSCLC‐derived cell lines and are involved in various regulatory mechanisms in lung cancer cells. Genes in the HOX C and HOX D families have been found upregulated in primary lung tumors (Bhatlekar et al., 2014). In this present study we found that high methylation levels of a CpG located in the HOXB7 gene is contributing to a high prognostic index and this is associated with poor prognosis. Hypermethylation of this CpG is positively correlated to mRNA expression of multiple genes in the HOX B family (HOXB2, 5, 6, 8 and 9) all of which are located in chromosome 17q and appears to be co‐regulated. Interestingly, microRNA 10a is located within the same area of chromosome 17, and high expression of this microRNA have previously been associated with poor prognosis of patients with lung cancer with adenocarcinoma histology and in breast cancer patients (Bjaanaes et al., 2014; Chang et al., 2014). Methylation of the CpG located in HOXC4 is also positively correlated with mRNA expression of genes in the HOX C family (4, 5, 6, 8, 9, 10 and 12). These HOX genes are localized at chromosome 12q in close relation with the long non‐coding RNA HOTAIR that has been associated with poor prognosis in multiple cancer types, including lung cancer (Liu et al., 2013; Yao et al., 2014).
5. Conclusion
DNA methylation is radically altered in lung adenocarcinoma tissue compared to normal lung tissue, and both hypermethylation and hypomethylation are probably important events in carcinogenesis and immune signaling in tumor tissue. Methylation changes in tumors from never‐smoking patients were identified, and aberrantly methylated genes in EGFR‐mutated tumors may be involved in the mTOR pathway. This report verifies the existence of DNA methylation derived subtypes of lung adenocarcinomas and identifies one subtype enriched for TP53 mutations. We demonstrate the potential biological significance of DNA methylation by integrating mRNA expression data, and identify both positive and negative correlations in a substantial part of the genome. A prognostic index based on DNA methylation of 33 CpGs separates the patients in groups with good or poor prognosis. This may be useful in the design of clinical trials for adjuvant chemotherapy and should be implemented in clinical trials in patients with early‐stage lung cancer.
Financial support
South‐Eastern Norway Regional Health Authority.
Supporting information
The following are the supplementary data related to this article:
Supplementary data
Supplementary data
Supplementary data
Supplementary data
Supplementary data
Supplementary data
Supplementary data
Supplementary data
Supplementary data
Supplementary data
Supplementary data
Supplementary data 1.
1.1.
Supplementary data related to this article can be found at http://dx.doi.org/10.1016/j.molonc.2015.10.021.
Bjaanæs Maria Moksnes, Fleischer Thomas, Halvorsen Ann Rita, Daunay Antoine, Busato Florence, Solberg Steinar, Jørgensen Lars, Kure Elin, Edvardsen Hege, Børresen-Dale Anne-Lise, Brustugun Odd Terje, Tost Jörg, Kristensen Vessela, Helland Åslaug, (2016), Genome‐wide DNA methylation analyses in lung adenocarcinomas: Association with EGFR, KRAS and TP53 mutation status, gene expression and prognosis, Molecular Oncology, 10, doi: 10.1016/j.molonc.2015.10.021.
Contributor Information
Maria Moksnes Bjaanæs, Email: mamok@rr-research.no.
Thomas Fleischer, Email: thomas.fleischer@rr-research.no.
Ann Rita Halvorsen, Email: Ann.Rita.Halvorsen@rr-research.no.
Antoine Daunay, Email: antoine.daunay@cephb.fr.
Florence Busato, Email: busato@cng.fr.
Steinar Solberg, Email: Steinar.Solberg@oslo-universitetssykehus.no.
Lars Jørgensen, Email: Lars.Jorgensen@oslo-universitetssykehus.no.
Elin Kure, Email: Elin.Kure@rr-research.no.
Hege Edvardsen, Email: hege.edvardsen@abbvie.com.
Anne-Lise Børresen-Dale, Email: a.l.borresen-dale@medisin.uio.no.
Odd Terje Brustugun, Email: ot.brustugun@gmail.com.
Jörg Tost, Email: tost@cng.fr.
Vessela Kristensen, Email: v.n.kristensen@medisin.uio.no.
Åslaug Helland, Email: aslaug.helland@gmail.com.
References
- Ahn, S.-J. , Choi, C. , Choi, Y.-D. , Kim, Y.-C. , Kim, K.-S. , Oh, I.-J. , Ban, H.-J. , Yoon, M.-S. , Nam, T.-K. , Jeong, J.-U. , Song, J.-Y. , Chung, W.-K. , 2014. Microarray analysis of gene expression in lung cancer cell lines treated by fractionated irradiation. Anticancer Res. 34, 4939–4948. [PubMed] [Google Scholar]
- Bhatlekar, S. , Fields, J.Z. , Boman, B.M. , 2014. HOX genes and their role in the development of human cancers. J. Mol. Med. (Berl). 92, 811–823. 10.1007/s00109-014-1181-y [DOI] [PubMed] [Google Scholar]
- Bjaanaes, M.M. , Halvorsen, A.R. , Solberg, S. , Jørgensen, L. , Dragani, T.A. , Galvan, A. , Colombo, F. , Anderlini, M. , Pastorino, U. , Kure, E. , Børresen-Dale, A.-L. , Brustugun, O.T. , Helland, A. , 2014. Unique microRNA-profiles in EGFR-mutated lung adenocarcinomas. Int. J. Cancer. 135, 1812–1821. 10.1002/ijc.28828 [DOI] [PMC free article] [PubMed] [Google Scholar]
- Bouchon, a , Facchetti, F. , Weigand, M.A. , Colonna, M. , 2001. TREM-1 amplifies inflammation and is a crucial mediator of septic shock. Nature. 410, 1103–1107. 10.1038/35074114 [DOI] [PubMed] [Google Scholar]
- Bøvelstad, H.M. , Nygård, S. , Størvold, H.L. , Aldrin, M. , Borgan, Ø. , Frigessi, a , Lingjaerde, O.C. , 2007. Predicting survival from microarray data–a comparative study. Bioinformatics. 23, 2080–2087. 10.1093/bioinformatics/btm305 [DOI] [PubMed] [Google Scholar]
- Brock, M.V. , Hooker, C.M. , Ota-Machida, E. , Han, Y. , Guo, M. , Ames, S. , Glöckner, S. , Piantadosi, S. , Gabrielson, E. , Pridham, G. , Pelosky, K. , Belinsky, S.A. , Yang, S.C. , Baylin, S.B. , Herman, J.G. , 2008. DNA methylation markers and early recurrence in stage I lung cancer. N. Engl. J. Med. 358, 1118–1128. 10.1056/NEJMoa0706550 [DOI] [PubMed] [Google Scholar]
- Carvalho, R.H. , Haberle, V. , Hou, J. , van Gent, T. , Thongjuea, S. , van Ijcken, W. , Kockx, C. , Brouwer, R. , Rijkers, E. , Sieuwerts, A. , Foekens, J. , van Vroonhoven, M. , Aerts, J. , Grosveld, F. , Lenhard, B. , Philipsen, S. , 2012. Genome-wide DNA methylation profiling of non-small cell lung carcinomas. Epigenetics Chromatin. 5, 9 10.1186/1756-8935-5-9 1756-8935-5-9 [DOI] [PMC free article] [PubMed] [Google Scholar]
- Chang, C. , Fan, T. , Yu, J. , Liao, G. , Lin, Y. , Shih, A.C. , 2014. The prognostic significance of RUNX2 and miR-10a/10b and their inter-relationship in breast cancer. 12, 1–12. 10.1186/s12967-014-0257-3 [DOI] [PMC free article] [PubMed] [Google Scholar]
- Colonna, M. , Facchetti, F. , 2003. TREM-1 (triggering receptor expressed on myeloid cells): a new player in acute inflammatory responses. J. Infect. Dis. 187, (Suppl.) S397–S401. 10.1086/374754 [DOI] [PubMed] [Google Scholar]
- Couraud, S. , Zalcman, G. , Milleron, B. , Morin, F. , Souquet, P.-J. , 2012. Lung cancer in never smokers–a review. Eur. J. Cancer. 48, 1299–1311. 10.1016/j.ejca.2012.03.007 [DOI] [PubMed] [Google Scholar]
- Di Fiore, R. , D'Anneo, A. , Tesoriere, G. , Vento, R. , 2013. RB1 in cancer: different mechanisms of RB1 inactivation and alterations of pRb pathway in tumorigenesis. J. Cell. Physiol. 228, 1676–1687. 10.1002/jcp.24329 [DOI] [PubMed] [Google Scholar]
- Dong, S. , Zhang, X.-C. , Cheng, H. , Zhu, J.-Q. , Chen, Z.-H. , Zhang, Y.-F. , Xie, Z. , Wu, Y.-L. , 2012. Everolimus synergizes with gefitinib in non-small-cell lung cancer cell lines resistant to epidermal growth factor receptor tyrosine kinase inhibitors. Cancer Chemother. Pharmacol. 70, 707–716. 10.1007/s00280-012-1946-3 [DOI] [PubMed] [Google Scholar]
- Esteller, M. , 2008. Epigenetics in cancer. N. Engl. J. Med. 358, 1148–1159. 10.1056/NEJMra072067 [DOI] [PubMed] [Google Scholar]
- Farkas, S.A. , Milutin-Gašperov, N. , Grce, M. , Nilsson, T.K. , 2013. Genome-wide DNA methylation assay reveals novel candidate biomarker genes in cervical cancer. Epigenetics. 8, 1213–1225. 10.4161/epi.26346 [DOI] [PubMed] [Google Scholar]
- Fei, S.-J. , Zhang, X.-C. , Dong, S. , Cheng, H. , Zhang, Y.-F. , Huang, L. , Zhou, H.-Y. , Xie, Z. , Chen, Z.-H. , Wu, Y.-L. , 2013. Targeting mTOR to overcome epidermal growth factor receptor tyrosine kinase inhibitor resistance in non-small cell lung cancer cells. PLoS One. 8, e69104 10.1371/journal.pone.0069104 [DOI] [PMC free article] [PubMed] [Google Scholar]
- Fleischer, T. , Frigessi, A. , Johnson, K.C. , Edvardsen, H. , Touleimat, N. , Klajic, J. , Riis, M. , Haakensen, V.D. , Wärnberg, F. , Naume, B. , Helland, Å. , Børresen-Dale, A.-L. , Tost, J. , Christensen, B.C. , Kristensen, V.N. , 2014. Genome-wide DNA methylation profiles in progression to in situ and invasive carcinoma of the breast with impact on gene transcription and prognosis. Genome Biol. 15, 435 10.1186/s13059-014-0435-x [DOI] [PMC free article] [PubMed] [Google Scholar]
- Gaudet, F. , Hodgson, J.G. , Eden, A. , Jackson-Grusby, L. , Dausman, J. , Gray, J.W. , Leonhardt, H. , Jaenisch, R. , 2003. Induction of tumors in mice by genomic hypomethylation. Science. 300, 489–492. 10.1126/science.1083558 [DOI] [PubMed] [Google Scholar]
- Heller, G. , Zielinski, C.C. , Zöchbauer-Müller, S. , 2010. Lung cancer: from single-gene methylation to methylome profiling. Cancer Metastasis Rev. 29, 95–107. 10.1007/s10555-010-9203-x [DOI] [PubMed] [Google Scholar]
- Heller, G. , Babinsky, V. , Ziegler, B. , 2013. Genome-wide CpG island methylation analyses in non-small cell lung cancer patients. Carcinogenesis. 34, 513–521. [DOI] [PubMed] [Google Scholar]
- Ho, C.C. , Liao, W.Y. , Wang, C.Y. , Lu, Y.H. , Huang, H.Y. , Chen, H.Y. , Chan, W.K. , Chen, H.W. , Yang, P.C. , 2008. TREM-1 expression in tumor-associated macrophages and clinical outcome in lung cancer. Am. J. Respir. Crit. Care Med. 177, 763–770. 10.1164/rccm.200704-641OC [DOI] [PubMed] [Google Scholar]
- Impera, L. , Albano, F. , Lo Cunsolo, C. , Funes, S. , Iuzzolino, P. , Laveder, F. , Panagopoulos, I. , Rocchi, M. , Storlazzi, C.T. , 2008. A novel fusion 5’AFF3/3'BCL2 originated from a t(2;18)(q11.2;q21.33) translocation in follicular lymphoma. Oncogene. 27, 6187–6190. 10.1038/onc.2008.214 [DOI] [PubMed] [Google Scholar]
- Jemal, A. , Bray, F. , Center, M.M. , Ferlay, J. , Ward, E. , Forman, D. , 2011. Global cancer statistics. CA. Cancer J. Clin. 61, 69–90. 10.3322/caac.20107 [DOI] [PubMed] [Google Scholar]
- Jovanovic, J. , Rønneberg, J.A. , Tost, J. , Kristensen, V. , 2010. The epigenetics of breast cancer. Mol. Oncol. 4, 242–254. 10.1016/j.molonc.2010.04.002 [DOI] [PMC free article] [PubMed] [Google Scholar]
- Karlsson, A. , Jonsson, M. , Lauss, M. , Brunnström, H. , Jönsson, P. , Borg, A. , Jönsson, G. , Ringner, M. , Planck, M. , Staaf, J. , 2014. Genome-wide DNA methylation analysis of lung carcinoma reveals one neuorendocrine and four adenocarcinoma epitypes associated with patient outcome. Clin. Cancer Res. 20, 6127–6140. 10.1158/1078-0432.CCR-14-1087 [DOI] [PubMed] [Google Scholar]
- Kawabata, S. , Mercado-Matos, J.R. , Hollander, M.C. , Donahue, D. , Wilson, W. , Regales, L. , Butaney, M. , Pao, W. , Wong, K.-K. , Jänne, P.A. , Dennis, P.A. , 2014. Rapamycin prevents the development and progression of mutant epidermal growth factor receptor lung tumors with the acquired resistance mutation T790M. Cell Rep. 7, 1824–1832. 10.1016/j.celrep.2014.05.039 [DOI] [PMC free article] [PubMed] [Google Scholar]
- Koboldt, D.C. , Fulton, R.S. , McLellan, M.D. , Schmidt, H. , Kalicki-Veizer, J. , McMichael, J.F. , Fulton, L.L. , Dooling, D.J. , Ding, L. , Mardis, E.R. , Wilson, R.K. , Ally, A. , Balasundaram, M. , Butterfield, Y.S.N. , Carlsen, R. , Carter, C. , Chu, A. , Chuah, E. , Chun, H.-J.E. , Coope, R.J.N. , Dhalla, N. , Guin, R. , Hirst, C. , Hirst, M. , Holt, R.A. , Lee, D. , Li, H.I. , Mayo, M. , Moore, R.A. , Mungall, A.J. , Pleasance, E. , Gordon Robertson, a. , Schein, J.E. , Shafiei, A. , Sipahimalani, P. , Slobodan, J.R. , Stoll, D. , Tam, A. , Thiessen, N. , Varhol, R.J. , Wye, N. , Zeng, T. , Zhao, Y. , Birol, I. , Jones, S.J.M. , Marra, M.A. , Cherniack, A.D. , Saksena, G. , Onofrio, R.C. , Pho, N.H. , Carter, S.L. , Schumacher, S.E. , Tabak, B. , Hernandez, B. , Gentry, J. , Nguyen, H. , Crenshaw, A. , Ardlie, K. , Beroukhim, R. , Winckler, W. , Getz, G. , Gabriel, S.B. , Meyerson, M. , Chin, L. , Park, P.J. , Kucherlapati, R. , Hoadley, K.A. , Todd Auman, J. , Fan, C. , Turman, Y.J. , Shi, Y. , Li, L. , Topal, M.D. , He, X. , Chao, H.-H. , Prat, A. , Silva, G.O. , Iglesia, M.D. , Zhao, W. , Usary, J. , Berg, J.S. , Adams, M. , Booker, J. , Wu, J. , Gulabani, A. , Bodenheimer, T. , Hoyle, A.P. , Simons, J.V. , Soloway, M.G. , Mose, L.E. , Jefferys, S.R. , Balu, S. , Parker, J.S. , Neil Hayes, D. , Perou, C.M. , Malik, S. , Mahurkar, S. , Shen, H. , Weisenberger, D.J. , Triche, T. , Lai, P.H. , Bootwalla, M.S. , Maglinte, D.T. , Berman, B.P. , Van Den Berg, D.J. , Baylin, S.B. , Laird, P.W. , Creighton, C.J. , Donehower, L.A. , Getz, G. , Noble, M. , Voet, D. , Saksena, G. , Gehlenborg, N. , DiCara, D. , Zhang, J. , Zhang, H. , Wu, C.-J. , Yingchun Liu, S. , Lawrence, M.S. , Zou, L. , Sivachenko, A. , Lin, P. , Stojanov, P. , Jing, R. , Cho, J. , Sinha, R. , Park, R.W. , Nazaire, M.-D. , Robinson, J. , Thorvaldsdottir, H. , Mesirov, J. , Park, P.J. , Chin, L. , Reynolds, S. , Kreisberg, R.B. , Bernard, B. , Bressler, R. , Erkkila, T. , Lin, J. , Thorsson, V. , Zhang, W. , Shmulevich, I. , Ciriello, G. , Weinhold, N. , Schultz, N. , Gao, J. , Cerami, E. , Gross, B. , Jacobsen, A. , Sinha, R. , Arman Aksoy, B. , Antipin, Y. , Reva, B. , Shen, R. , Taylor, B.S. , Ladanyi, M. , Sander, C. , Anur, P. , Spellman, P.T. , Lu, Y. , Liu, W. , Verhaak, R.R.G. , Mills, G.B. , Akbani, R. , Zhang, N. , Broom, B.M. , Casasent, T.D. , Wakefield, C. , Unruh, A.K. , Baggerly, K. , Coombes, K. , Weinstein, J.N. , Haussler, D. , Benz, C.C. , Stuart, J.M. , Benz, S.C. , Zhu, J. , Szeto, C.C. , Scott, G.K. , Yau, C. , Paull, E.O. , Carlin, D. , Wong, C. , Sokolov, A. , Thusberg, J. , Mooney, S. , Ng, S. , Goldstein, T.C. , Ellrott, K. , Grifford, M. , Wilks, C. , Ma, S. , Craft, B. , Yan, C. , Hu, Y. , Meerzaman, D. , Gastier-Foster, J.M. , Bowen, J. , Ramirez, N.C. , Black, A.D. , XPATH ERROR: unknown variable “tname”., R.E. , White, P. , Zmuda, E.J. , Frick, J. , Lichtenberg, T.M. , Brookens, R. , George, M.M. , Gerken, M.A. , Harper, H.A. , Leraas, K.M. , Wise, L.J. , Tabler, T.R. , McAllister, C. , Barr, T. , Hart-Kothari, M. , Tarvin, K. , Saller, C. , Sandusky, G. , Mitchell, C. , Iacocca, M.V. , Brown, J. , Rabeno, B. , Czerwinski, C. , Petrelli, N. , Dolzhansky, O. , Abramov, M. , Voronina, O. , Potapova, O. , Marks, J.R. , Suchorska, W.M. , Murawa, D. , Kycler, W. , Ibbs, M. , Korski, K. , Spychała, A. , Murawa, P. , Brzeziński, J.J. , Perz, H. , Łaźniak, R. , Teresiak, M. , Tatka, H. , Leporowska, E. , Bogusz-Czerniewicz, M. , Malicki, J. , Mackiewicz, A. , Wiznerowicz, M. , Van Le, X. , Kohl, B. , Viet Tien, N. , Thorp, R. , Van Bang, N. , Sussman, H. , Duc Phu, B. , Hajek, R. , Phi Hung, N. , Viet The Phuong, T. , Quyet Thang, H. , Zaki Khan, K. , Penny, R. , Mallery, D. , Curley, E. , Shelton, C. , Yena, P. , Ingle, J.N. , Couch, F.J. , Lingle, W.L. , King, T.A. , Maria Gonzalez-Angulo, A. , Mills, G.B. , Dyer, M.D. , Liu, S. , Meng, X. , Patangan, M. , Waldman, F. , Stöppler, H. , Kimryn Rathmell, W. , Thorne, L. , Huang, M. , Boice, L. , Hill, A. , Morrison, C. , Gaudioso, C. , Bshara, W. , Daily, K. , Egea, S.C. , Pegram, M.D. , Gomez-Fernandez, C. , Dhir, R. , Bhargava, R. , Brufsky, A. , Shriver, C.D. , Hooke, J.A. , Leigh Campbell, J. , Mural, R.J. , Hu, H. , Somiari, S. , Larson, C. , Deyarmin, B. , Kvecher, L. , Kovatich, A.J. , Ellis, M.J. , King, T.A. , Hu, H. , Couch, F.J. , Mural, R.J. , Stricker, T. , White, K. , Olopade, O. , Ingle, J.N. , Luo, C. , Chen, Y. , Marks, J.R. , Waldman, F. , Wiznerowicz, M. , Bose, R. , Chang, L.-W. , Beck, A.H. , Maria Gonzalez-Angulo, A. , Pihl, T. , Jensen, M. , Sfeir, R. , Kahn, A. , Chu, A. , Kothiyal, P. , Wang, Z. , Snyder, E. , Pontius, J. , Ayala, B. , Backus, M. , Walton, J. , Baboud, J. , Berton, D. , Nicholls, M. , Srinivasan, D. , Raman, R. , Girshik, S. , Kigonya, P. , Alonso, S. , Sanbhadti, R. , Barletta, S. , Pot, D. , Sheth, M. , Demchok, J.A. , Mills Shaw, K.R. , Yang, L. , Eley, G. , Ferguson, M.L. , Tarnuzzer, R.W. , Zhang, J. , Dillon, L.A.L. , Buetow, K. , Fielding, P. , Ozenberger, B.A. , Guyer, M.S. , Sofia, H.J. , Palchik, J.D. , 2012. Comprehensive molecular portraits of human breast tumours. Nature. 490, 61–70. 10.1038/nature11412 [DOI] [PMC free article] [PubMed] [Google Scholar]
- Kulis, M. , Heath, S. , Bibikova, M. , Queirós, A.C. , Navarro, A. , Clot, G. , Martínez-Trillos, A. , Castellano, G. , Brun-Heath, I. , Pinyol, M. , Barberán-Soler, S. , Papasaikas, P. , Jares, P. , Beà, S. , Rico, D. , Ecker, S. , Rubio, M. , Royo, R. , Ho, V. , Klotzle, B. , Hernández, L. , Conde, L. , López-Guerra, M. , Colomer, D. , Villamor, N. , Aymerich, M. , Rozman, M. , Bayes, M. , Gut, M. , Gelpí, J.L. , Orozco, M. , Fan, J.-B. , Quesada, V. , Puente, X.S. , Pisano, D.G. , Valencia, A. , López-Guillermo, A. , Gut, I. , López-Otín, C. , Campo, E. , Martín-Subero, J.I. , 2012. Epigenomic analysis detects widespread gene-body DNA hypomethylation in chronic lymphocytic leukemia. Nat. Genet. 44, 1236–1242. 10.1038/ng.2443 [DOI] [PubMed] [Google Scholar]
- Laird, P.W. , 2003. The power and the promise of DNA methylation markers. Nat. Rev. Cancer. 3, 253–266. 10.1038/nrc1045 [DOI] [PubMed] [Google Scholar]
- Lin, R.K. , Wu, C.Y. , Chang, J.W. , Juan, L.J. , Hsu, H.S. , Chen, C.Y. , Lu, Y.Y. , Tang, Y.A. , Yang, Y.C. , Yang, P.C. , Wang, Y.C. , 2010. Dysregulation of p53/Sp1 control leads to DNA methyltransferase-1 overexpression in lung cancer. Cancer Res. 70, 5807–5817. 10.1158/0008-5472.CAN-09-4161 [DOI] [PubMed] [Google Scholar]
- Liu, X. , Liu, Z. , Sun, M. , Liu, J. , Wang, Z. , De, W. , 2013. The long non-coding RNA HOTAIR indicates a poor prognosis and promotes metastasis in non-small cell lung cancer. BMC Cancer. 13, 464 10.1186/1471-2407-13-464 [DOI] [PMC free article] [PubMed] [Google Scholar]
- Livingstone, C. , 2013. IGF2 and cancer. Endocr. Relat. Cancer. 20, 321–339. 10.1530/ERC-13-0231 [DOI] [PubMed] [Google Scholar]
- Lokk, K. , Vooder, T. , Kolde, R. , Välk, K. , Võsa, U. , Roosipuu, R. , Milani, L. , Fischer, K. , Koltsina, M. , Urgard, E. , Annilo, T. , Metspalu, A. , Tõnisson, N. , 2012. Methylation markers of early-stage non-small cell lung cancer. PLoS One. 7, e39813 10.1371/journal.pone.0039813 [DOI] [PMC free article] [PubMed] [Google Scholar]
- Lyn-Cook, L. , Word, B. , George, N. , Lyn-Cook, B. , Hammons, G. , 2014. Effect of cigarette smoke condensate on gene promoter methylation in human lung cells. Tob. Induc. Dis. 12, 15 10.1186/1617-9625-12-15 [DOI] [PMC free article] [PubMed] [Google Scholar]
- Mansfield, A.S. , Wang, L. , Cunningham, J.M. , Jen, J. , Kolbert, C.P. , Sun, Z. , Yang, P. , 2014. DNA methylation and RNA expression profiles in lung adenocarcinomas of never-smokers. Cancer Genet. 10.1016/j.cancergen.2014.12.002 [DOI] [PMC free article] [PubMed] [Google Scholar]
- Morán, A. , Fernández-Marcelo, T. , Carro, J. , De Juan, C. , Pascua, I. , Head, J. , Gómez, A. , Hernando, F. , Torres, A.-J. , Benito, M. , Iniesta, P. , 2012. Methylation profiling in non-small cell lung cancer: clinical implications. Int. J. Oncol. 40, 739–746. 10.3892/ijo.2011.1253 [DOI] [PubMed] [Google Scholar]
- Ndlovu, M.N. , Denis, H. , Fuks, F. , 2011. Exposing the DNA methylome iceberg. Trends Biochem. Sci. 36, 381–387. 10.1016/j.tibs.2011.03.002 [DOI] [PubMed] [Google Scholar]
- Pfeifer, G.P. , Rauch, T.A. , 2009. DNA methylation patterns in lung carcinomas. Semin. Cancer Biol. 19, 181–187. 10.1016/j.semcancer.2009.02.008 [DOI] [PMC free article] [PubMed] [Google Scholar]
- Politi, K. , Herbst, R.S. , 2015. Lung cancer in the era of precision medicine. Clin. Cancer Res. 21, 2213–2220. 10.1158/1078-0432.CCR-14-2748 [DOI] [PMC free article] [PubMed] [Google Scholar]
- R Core Team, 2014. R: A Language and Environment for Statistical Computing. Vol. 1, 10.1007/978-3-540-74686-7 [Google Scholar]
- Rauch, T. , Wang, Z. , Zhang, X. , Zhong, X. , Wu, X. , Lau, S.K. , Kernstine, K.H. , Riggs, A.D. , Pfeifer, G.P. , 2007. Homeobox gene methylation in lung cancer studied by genome-wide analysis with a microarray-based methylated CpG island recovery assay. Proc. Natl. Acad. Sci. U. S. A. 104, 5527–5532. 10.1073/pnas.0701059104 [DOI] [PMC free article] [PubMed] [Google Scholar]
- Rauch, T.A. , Zhong, X. , Wu, X. , Wang, M. , Kernstine, K.H. , Wang, Z. , Riggs, A.D. , Pfeifer, G.P. , 2008. High-resolution mapping of DNA hypermethylation and hypomethylation in lung cancer. Proc. Natl. Acad. Sci. U. S. A. 105, 252–257. 10.1073/pnas.0710735105 [DOI] [PMC free article] [PubMed] [Google Scholar]
- Rønneberg, J.A. , Fleischer, T. , Solvang, H.K. , Nordgard, S.H. , Edvardsen, H. , Potapenko, I. , Nebdal, D. , Daviaud, C. , Gut, I. , Bukholm, I. , Naume, B. , Børresen-Dale, A.-L. , Tost, J. , Kristensen, V. , 2011. Methylation profiling with a panel of cancer related genes: association with estrogen receptor, TP53 mutation status and expression subtypes in sporadic breast cancer. Mol. Oncol. 5, 61–76. 10.1016/j.molonc.2010.11.004 [DOI] [PMC free article] [PubMed] [Google Scholar]
- Sandoval, J. , Mendez-Gonzalez, J. , Nadal, E. , Chen, G. , Carmona, F.J. , Sayols, S. , Moran, S. , Heyn, H. , Vizoso, M. , Gomez, A. , Sanchez-Cespedes, M. , Assenov, Y. , Müller, F. , Bock, C. , Taron, M. , Mora, J. , Muscarella, L.A. , Liloglou, T. , Davies, M. , Pollan, M. , Pajares, M.J. , Torre, W. , Montuenga, L.M. , Brambilla, E. , Field, J.K. , Roz, L. , Lo Iacono, M. , Scagliotti, G.V. , Rosell, R. , Beer, D.G. , Esteller, M. , 2013. A prognostic DNA methylation signature for stage I non-small-cell lung Cancer. J. Clin. Oncol. 31, 4140–4147. 10.1200/JCO.2012.48.5516 [DOI] [PubMed] [Google Scholar]
- Satelli, A. , Rao, P.S. , Thirumala, S. , Rao, U.S. , 2011. Galectin-4 functions as a tumor suppressor of human colorectal cancer. Int. J. Cancer. 129, 799–809. 10.1002/ijc.25750 [DOI] [PMC free article] [PubMed] [Google Scholar]
- Selamat, S.A. , Chung, B.S. , Girard, L. , Zhang, W. , Zhang, Y. , Campan, M. , Siegmund, K.D. , Koss, M.N. , Hagen, J.A. , Lam, W.L. , Lam, S. , Gazdar, A.F. , Laird-Offringa, I.A. , Suhaida, A. , Chung, B.S. , Girard, L. , Zhang, W. , Zhang, Y. , Campan, M. , Siegmund, K.D. , Koss, M.N. , Hagen, J.A. , Lam, W.L. , Lam, S. , Gazdar, A.F. , Laird-Offringa, I.A. , Selamat, S.A. , Chung, B.S. , Girard, L. , Zhang, W. , Zhang, Y. , Campan, M. , Siegmund, K.D. , Koss, M.N. , Hagen, J.A. , Lam, W.L. , Lam, S. , Gazdar, A.F. , Laird-Offringa, I.A. , 2012. Genome-scale analysis of DNA methylation in lung adenocarcinoma and integration with mRNA expression. Genome Res. 22, 1197–1211. 10.1101/gr.132662.111 [DOI] [PMC free article] [PubMed] [Google Scholar]
- Shinjo, K. , Okamoto, Y. , An, B. , Yokoyama, T. , Takeuchi, I. , Fujii, M. , Osada, H. , Usami, N. , Hasegawa, Y. , Ito, H. , Hida, T. , Fujimoto, N. , Kishimoto, T. , Sekido, Y. , Kondo, Y. , 2012. Integrated analysis of genetic and epigenetic alterations reveals CpG island methylator phenotype associated with distinct clinical characters of lung adenocarcinoma. Carcinogenesis. 33, 1277–1285. 10.1093/carcin/bgs154 [DOI] [PubMed] [Google Scholar]
- Silwal-Pandit, L. , Vollan, H.K.M. , Chin, S.F. , Rueda, O.M. , McKinney, S. , Osako, T. , Quigley, D.A. , Kristensen, V.N. , Aparicio, S. , Børresen-Dale, A.L. , Caldas, C. , Langerød, A. , 2014. TP53 mutation spectrum in breast cancer is subtype specific and has distinct prognostic relevance. Clin. Cancer Res. 20, 3569–3580. 10.1158/1078-0432.CCR-13-2943 [DOI] [PubMed] [Google Scholar]
- Strell, C. , Entschladen, F. , 2008. Extravasation of leukocytes in comparison to tumor cells. Cell Commun. Signal. 6, 10 10.1186/1478-811X-6-10 [DOI] [PMC free article] [PubMed] [Google Scholar]
- The Cancer Genome Atlas [WWW Document], n.d. http://cancergenome.nih.gov.
- Therneau, T. , 2013. n.d. A Package for Survival Analysis in S. R Package Version 2.37-4 http://CRAN.R-project.org/package=survival [Google Scholar]
- Tibshirani, R. , 1996. Regression shrinkage and selection via the lasso. J. R. Stat. Soc. Ser. B. 58, 267–288. [Google Scholar]
- Tibshirani, R. , Chu, G. , Balasubramanian, N.J.L. , 2011. n.d. samr: SAM: Significance Analysis of Microarrays. R Package Version 2.0 http://CRAN.R-project.org/package=samr [Google Scholar]
- Touleimat, N. , Tost, J. , 2012. Human methylation 450K BeadChip data processing using subset quantile normalization for accurate DNA methylation estimation. Epigenomics. 4, 325–341. 10.2217/epi.12.21 [DOI] [PubMed] [Google Scholar]
- Toyooka, S. , Maruyama, R. , Toyooka, K.O. , McLerran, D. , Feng, Z. , Fukuyama, Y. , Virmani, A.K. , Zochbauer-Muller, S. , Tsukuda, K. , Sugio, K. , Shimizu, N. , Shimizu, K. , Lee, H. , Chen, C.-Y. , Fong, K.M. , Gilcrease, M. , Roth, J.A. , Minna, J.D. , Gazdar, A.F. , 2003. Smoke exposure, histologic type and geography-related differences in the methylation profiles of non-small cell lung cancer. Int. J. Cancer. 103, 153–160. 10.1002/ijc.10787 [DOI] [PubMed] [Google Scholar]
- Toyota, M. , Ohe-Toyota, M. , Ahuja, N. , Issa, J.P. , 2000. Distinct genetic profiles in colorectal tumors with or without the CpG island methylator phenotype. Proc. Natl. Acad. Sci. U. S. A. 97, 710–715. 10.1073/pnas.97.2.710 [DOI] [PMC free article] [PubMed] [Google Scholar]
- Tsay, J.J. , Tchou-Wong, K.-M. , Greenberg, A.K. , Pass, H. , Rom, W.N. , 2013. Aryl hydrocarbon receptor and lung cancer. Anticancer Res. 33, 1247–1256. 10.1016/j.biotechadv.2011.08.021.Secreted [PMC free article] [PubMed] [Google Scholar]
- Tusher, V.G. , Tibshirani, R. , Chu, G. , 2001. Significance analysis of microarrays applied to the ionizing radiation response. Proc. Natl. Acad. Sci. U S A. 98, 5116–5121. 10.1073/pnas.091062498_091062498_[pii] [DOI] [PMC free article] [PubMed] [Google Scholar]
- Yao, Y. , Li, J. , Wang, L. , 2014. Large intervening non-coding RNA HOTAIR is an indicator of poor prognosis and a therapeutic target in human cancers. Int. J. Mol. Sci. 15, 18985–18999. 10.3390/ijms151018985 [DOI] [PMC free article] [PubMed] [Google Scholar]
- Yuan, Z. , Mehta, H.J. , Mohammed, K. , Nasreen, N. , Roman, R. , Brantly, M. , Sadikot, R.T. , 2014. TREM-1 is induced in tumor associated macrophages by cyclo-oxygenase pathway in human non-small cell lung cancer. PLoS One. 9, 1–10. 10.1371/journal.pone.0094241 [DOI] [PMC free article] [PubMed] [Google Scholar]
Associated Data
This section collects any data citations, data availability statements, or supplementary materials included in this article.
Supplementary Materials
The following are the supplementary data related to this article:
Supplementary data
Supplementary data
Supplementary data
Supplementary data
Supplementary data
Supplementary data
Supplementary data
Supplementary data
Supplementary data
Supplementary data
Supplementary data