

SUMMARY
Adaptive immunity depends on diverse T cell receptor repertoires generated by V(D)J recombination. Here, we define the principles by which combinatorial diversity is generated in the murine Tcra repertoire. Tcra and Tcrd gene segments share the Tcra-Tcrd locus, with interspersed Vα and Vδ segments undergoing Vδ-Dδ-Jδ rearrangement in CD4−CD8− thymocytes and then multiple rounds of Vα−Jα rearrangement in CD4+CD8+ thymocytes. We document stepwise, highly coordinated proximal-to-distal progressions of Vα and Vδ use on individual Tcra alleles, limiting combinatorial diversity. This behavior is supported by an extended chromatin conformation in CD4+CD8+ thymocytes, with only nearby Vα and Vδ segments contacting each other. Tcrd rearrangements can use distal Vδ segments due to a contracted Tcra-Tcrd conformation in CD4−CD8− thymocytes. These rearrangements expand the Tcra repertoire by truncating the Vα array to permit otherwise disfavored Vα−Jα combinations. Therefore, recombination events at two developmental stages with distinct chromatin conformations synergize to promote Tcra repertoire diversity.
Keywords: antigen receptor, chromatin conformation, mucosa-associated invariant T cells, MAIT cells, T cell receptor alpha, T cell receptor delta, T cell development, TCR repertoire, T cell receptor repertoire, V(D)J recombination
ETOC BLURB
A diverse Tcra repertoire is essential for robust adaptive immunity. Carico et al. demonstrate that the Tcra repertoire is intrinsically limited by a processive recombination program. Tcrd recombination overcomes this constraint to broaden Vα-Jα combinatorial diversity, and is important for development of MAIT cells, an innate-like αβ T cell subset.
INTRODUCTION
Vertebrate adaptive immune systems depend on V(D)J recombination to generate pools of diverse, clonally distributed antigen receptors (AgRs) on T and B lymphocytes. AgR loci contain arrays of variable (V), joining (J), and at some loci, diversity (D) gene segments, which are joined during lymphocyte development to create complete AgR genes. This process is catalyzed by the lymphoid-specific recombination-activating gene (RAG) protein complex, which generates site-specific DNA double-strand breaks between V, D, and J coding gene segments and their associated recombination signal sequences (RSSs) (Schatz and Swanson, 2011). RAG initially binds to discrete regions containing highly transcribed and accessible D and J gene segments under control of developmentally-regulated enhancer and promoter elements, forming a chromatin structure called the recombination center (RC) (Schatz and Ji, 2011). RC-bound RAG is then thought to capture distant V segment RSSs to mediate V-to-(D)J recombination and complete assembly of the AgR gene. AgR diversity is generated by combinatorial usage of V, D, and J segments, together with DNA repair mechanisms associated with non-homologous end joining, which impart heterogeneity to the junctions between coding gene segments (Helmink and Sleckman, 2012).
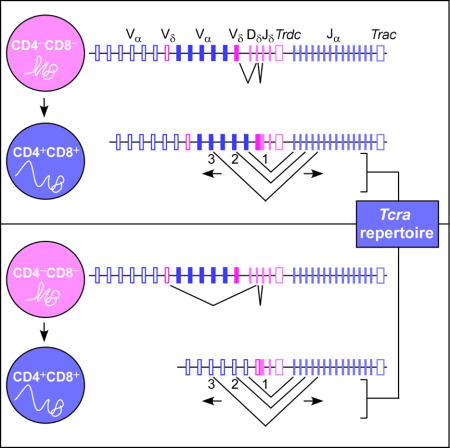
T lymphocyte development generates distinct lineages of T cells bearing either a γδ or an αβ T cell receptor (TCR). Notably, the gene segments encoding TCRδ and TCRα chains are arrayed in a single genetic locus, Tcra-Tcrd. In mice, Dδ, Jδ, and Trdc (Cδ) gene segments are nested between a 1.5 Mb array of more than 100 Vα and Vδ segments and a 60 kb region containing 60 Jα segments and Trac (Cα) (Carico and Krangel, 2015). There are nominally 16 Vδ gene segments interspersed across the Vα-Vδ array; whereas the pool of Vδ segments is limited, almost all V segments (Vα and Vδ) contribute to the Tcra repertoire. During the CD4−CD8− double-negative (DN) stage of T cell development, Tcrd undergoes biallelic Vδ-Dδ-Jδ rearrangement. In parallel, DN thymocytes also rearrange Tcrg and Tcrb; expression of a γδ TCR commits cells to the γδ -lineage, while expression of a TCRβ protein commits cells to the αβ-lineage (Ciofani and Zúñiga-Pflücker, 2010). Tcra then undergoes biallelic Vα-Jδ rearrangement in the CD4+CD8+ (DP) compartment (Carico and Krangel, 2015). Tcra is striking for its tendency to undergo multiple rounds of V-J rearrangement on each allele, allowing multiple opportunities to create TCRαβ-bearing thymocytes that can undergo positive selection. Tcrd and Tcra rearrangements are directed, in part, by the developmentally-regulated enhancers Eδ, which creates Dδ and Jδ accessibility in DN thymocytes, and Eα, which creates accessibility of Jα and some Vα segments in DP thymocytes (Hao and Krangel, 2011; Hawwari and Krangel, 2005). The nested Tcra-Tcrd structure is well-conserved among mammals, but the implications of this organization are unclear (Carico and Krangel, 2015; Glusman et al., 2001).
Although numerous studies have examined combinatorial diversity in the Tcra repertoire, the extent of diversity and its mechanistic underpinnings are only partially understood. Jα gene segment usage, and the mechanisms that regulate that usage, are well-established. Primary rearrangements are directed to the most Vα-proximal Jα segments due to activation of the T early alpha promoter (TEA) and additional Jα promoters by Eα (Abarrategui and Krangel, 2006; Guo et al., 2002; Hawwari et al., 2005; Thompson et al., 1990; Villey et al., 1996). Secondary rearrangements tend to use the most Vα-proximal of the remaining Jα segments, due to transcription driven from the rearranged Vα-Jα cassette (Buch et al., 2002; Hawwari and Krangel, 2007; Huang and Kanagawa, 2001; Pasqual et al., 2002; Petrie et al., 1995). Comparatively less is known about patterns of Vα usage (Carico and Krangel, 2015). A variety of PCR-based studies have documented that Jα-proximal Vα segments tend to rearrange to proximal Jα segments, whereas Jα-distal Vα segments tend to rearrange to distal Jα segments (Aude-Garcia et al., 2001; Huang and Kanagawa, 2001; Pasqual et al., 2002). Such biases could reflect a regulated mechanism governing Vα usage, or alternatively, the consequence of stochastic Vα usage through multiple rounds of Vα-Jα rearrangement. In contrast, high-throughput sequencing (HTS) of the Tcra repertoire in naïve CD8+ T cells found that Vα-Jα combinations occurred mostly independent of chromosomal position (Genolet et al., 2012). This was interpreted to indicate that selection of Vα segments for rearrangement was primarily a stochastic process, with all Vα segments simultaneously available for recombination (Genolet et al., 2012). The discrepancies among these studies notwithstanding, given the highly regulated progression of Jα usage through multiple rounds of rearrangement, the manner in which Vα segments are used should have enormous implications for combinatorial diversity in the Tcra repertoire.
Here, we developed and applied a high-throughput sequencing (HTS)-based strategy to analyze the pre-selection Tcra repertoire in mice carrying wild-type and genetically modified Tcra-Tcrd alleles. We found that Tcra rearrangement in individual thymocytes is intrinsically highly processive and coordinated along the Vα and Jα arrays through multiple rounds of rearrangement, imposing severe constraints on combinatorial diversity. Repertoire diversity is nonetheless achieved by mechanisms that impart combinatorial diversity to primary Vα-Jα rearrangement, effectively scrambling the starting points for progressions of secondary rearrangements in individual DP thymocytes. A major mechanism by which V diversity is imparted during primary Vα-Jα rearrangements is prior Tcrd recombination in DN thymocytes, which variably truncates the Vα array and allows distal Vα segments to rearrange to proximal Jα segments. Such diversification is functionally significant, as Trav1-Traj33+ mucosa-associated invariant T (MAIT) cells are depleted when Tcrd rearrangement is impaired or absent.
RESULTS
Pre-selection Tcra repertoire in DP thymocytes
We developed an HTS approach to study the Tcra repertoire that was tailored to the specific challenges presented by the Tcra-Tcrd locus. Rather than amplifying gene segment joins directly from genomic DNA using multiplexed primers that target the many individual V and J segments, we analyzed rearrangements in Tcra transcripts using a single primer pair targeting Cα and a common adapter added to the 5′ ends of cDNA during 5′ rapid amplification of cDNA ends (5′ RACE). To unambiguously differentiate between the many highly similar Vα gene segment family members, we obtained long sequencing reads through the Vα-Jα coding region using 300-nucleotide paired-end sequencing on the Illumina MiSeq platform. We used the powerful MiXCR immune repertoire analysis software, which aided with sequence calls and allowed us to count Vα-Jα joins from unique clones only (Bolotin et al., 2015). We also used strain 129 mice, because the 129 Tcra haplotype contains a less complex Vα array including a 400kb duplication, rather than a triplication as in C57BL/6 (Carico and Krangel, 2015). Our approach allowed for accurate identification of all Vα segments by software except for Trav16 and Trav16d, which we were able to unambiguously distinguish through manual analysis. We were unable to measure primary rearrangements involving pseudogene Traj61, because it lacks functional splice signals and would not be captured by 5′ RACE (Villey et al., 1997).
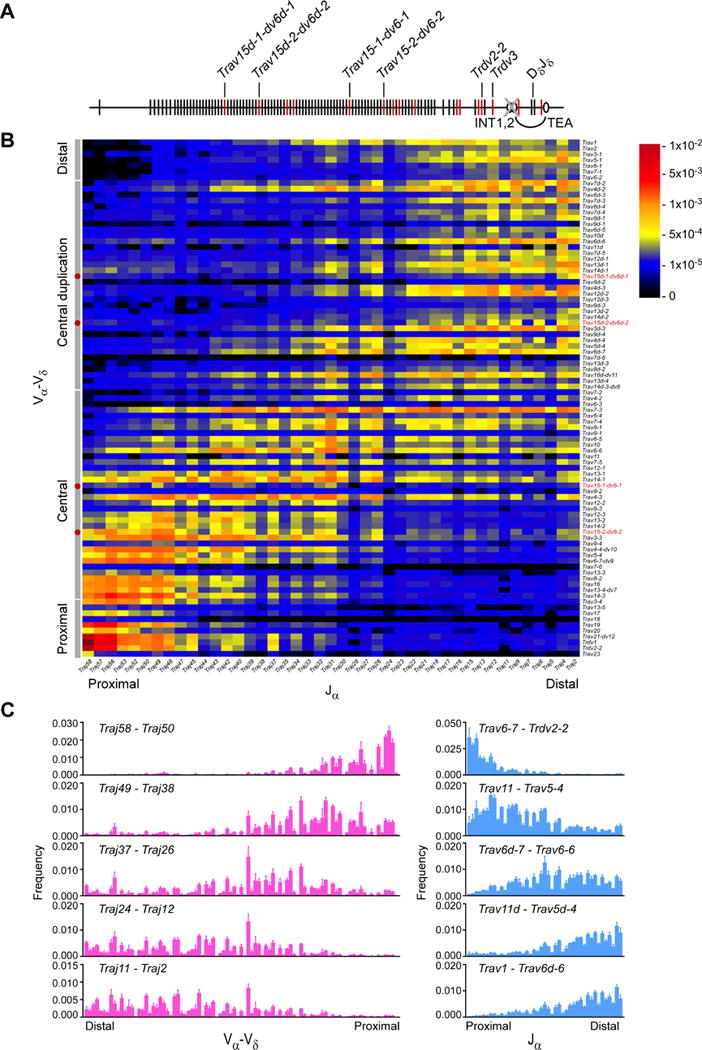
We measured Vα and Jα usage in wild-type CD4+CD8+CD3εlo thymocytes to assess the pre-selection Tcra repertoire (Table S1). We detected a clear bias for usage of proximal Vα with proximal Jα and distal Vα with distal Jα (Figure 1). Nonetheless, we were struck by the extent of combinatorial diversity, particularly in primary Vα-Jα recombination. We defined the V segments used in primary rearrangement as those joined to the most proximal Jα segment analyzed, Traj58. Similarly, we defined the Jα segments used in primary rearrangement as those joined to the most proximal Vα segment used, Trdv2-2. Traj58 most frequently rearranged to very proximal Vα segments Trdv2-2, Trdvl, Trav21, and Trav19 (Figures 1B and 1C). However, Traj58 also rearranged extensively to Vα segments distributed across 750 kb, including a large portion of the central Vα array. Moreover, some Traj58 rearrangements involved a cluster of Vα segments located in the central duplication region (Figures 1B and 1C). Similarly, Trdv2-2 rearranged to Jα segments as distal as Traj26 (Figures 1B and 1C). We noted at least two apparent ‘tracks’ along which subsequent (secondary) Vα-Jα rearrangements occurred: a major diagonal initiating from primary rearrangements involving Trdv2-2 to Trav6-6 and Traj58 to Traj26, and a minor ‘shadow’ diagonal arising from primary Jα rearrangements to distal Vα segments in the central-duplication region.
Figure 1. Pre-selection Tcra repertoire in strain 129 DP thymocytes.
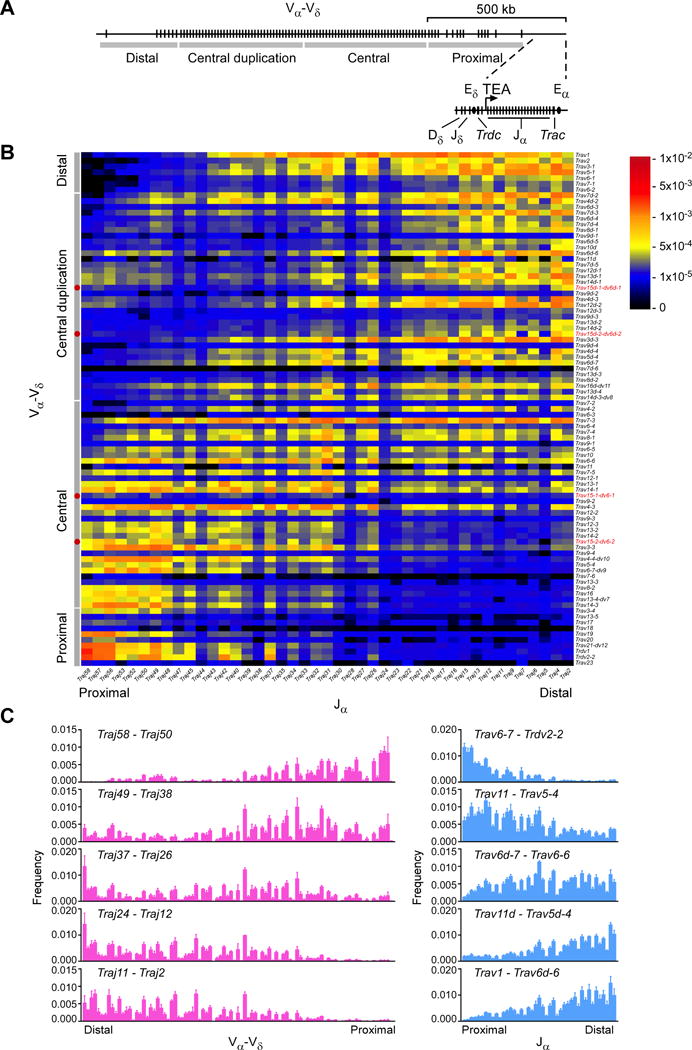
(A) Schematic of the Tcra-Tcrd locus, with gene segments, Vα-Vδ array subregions, and c/s-regulatory elements depicted. (B) Frequencies of Vα−Jα rearrangements in strain 129 CD4+CD8+CD3elo thymocytes, as determined by HTS of Tcra transcripts amplified by 5′ RACE. Vα-Vδ array subregions are specified along the left border of the plot. Red dots (left border) and red text (right border) identify locations of Trav15-dv6 family members. (C) Frequencies of Vα-Vδ (left) or Jα (right) usage with the indicated sets of Jα and Vα segments, respectively. Data are presented as the mean (B) and mean and s.d. (C) of three mice from two independent experiments. See also Table S1.
Developmental progression of Vα-Jα rearrangement
To better understand the inferred progression of Vα-Jα rearrangements through primary and multiple rounds of secondary recombination, we examined the distribution of rearrangements in a fixed cohort of DP thymocytes over time. To do this, we injected mice bearing TcrdCreER and Rosa26fl-STOP-fl-ZsGreen alleles (Zhang et al., 2015) with tamoxifen to label DN thymocytes, which express Tcrd, and we tracked Tcra rearrangements in those cells over time as they entered into and matured in the DP compartment. A single dose of tamoxifen preferentially labeled DN2 and DN4-CD8 ISP thymocytes, which progressively moved into the DN3 and DP compartments, respectively, over 72 hrs (Figure S1A). As expected, ZsGreen+ DP thymocytes were CD71+ at early times but were largely CD71− by 48 hrs. ZsGreen− DP thymocytes were always CD71−, indicating that they represented older DP thymocytes at all time points (Figure S1B).
Twelve hours after tamoxifen injection, ZsGreen+CD4+CD8+CD3εlo thymocytes displayed Jα usage heavily biased toward proximal segments between Traj58 and Traj26, and usage became progressively more distal at 24−, 48−, and 72 hrs (Figures 2A and 2B). Vα usage similarly progressed from proximal to distal in the same time frame. At all times examined, ZsGreen−CD4+CD8+CD3εlo thymocytes displayed usage of more distal Vα-Jα segments than their ZsGreen+ counterparts, consistent with ZsGreen− cells representing an older cohort of DP thymocytes.
Figure 2. Temporal progression of Vα-Jα rearrangements in strain 129 DP thymocytes.
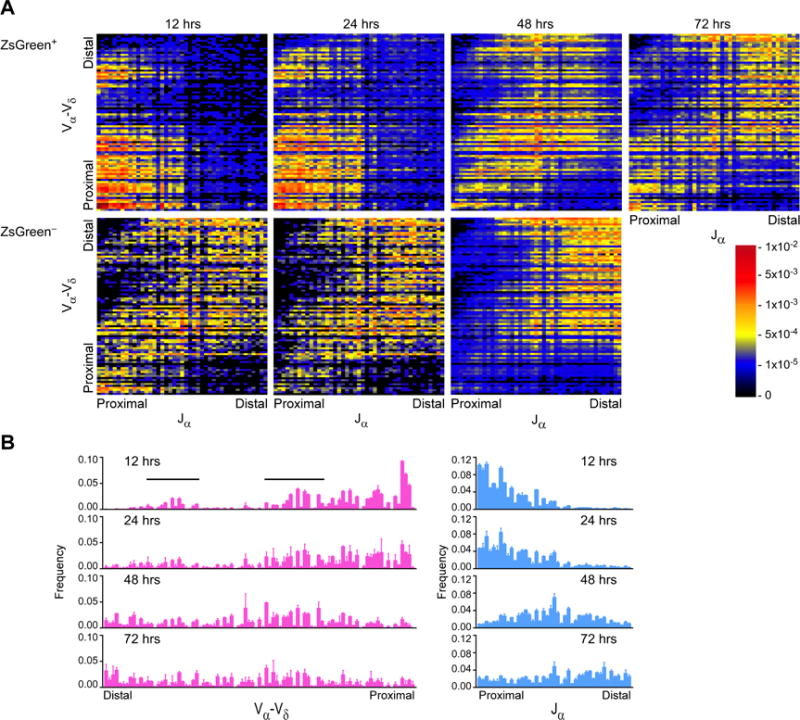
(A) Vα-Jα rearrangement frequencies in CD4+CD8+CD3εloZsGreen+ and CD4+CD8+CD3εloZsGreen− DP thymocytes sorted from TcrdCreER × Rosa26fl-STOP-Fl-ZsGreen mice at the indicated times postinjection of tamoxifen. Lines in the Vα-Vα plot at 12 hrs identify homologous sets of central and central duplication V segments which are targeted for early rearrangement. (B) Frequencies of Vα-Vδ (left) or Jα (right) usage at the indicated time points post-injection. Data are presented as the mean (A) and mean and s.d. (B) of two mice analyzed in two independent experiments, with the exception of the 12- and 24-hr ZsGreen− analyses, which were conducted once. See also Figure S1.
The time course experiment also emphasized the tremendous heterogeneity of the earliest Tcra rearrangement events (Figures 2A, 2B, and S1C). Va usage was broadly distributed across the proximal half of the Vα array and included a cluster in the central duplication region that was even more striking than in steady-state conditions (Figures 1B and 1C). Notably, usage of the central duplication Vα cluster was mirrored by prominent usage of the homologous cluster of Vα segments in the central Vα region at 12 hrs post-injection (Figures 2B and S1C). Moreover, from all points in the 12-hr Vα-Jα distribution, rearrangements progressed to correspondingly more distal Vα-Jα combinations over time.
Vα-Jα rearrangements are highly processive in individual DP thymocytes
To better understand the dynamics of Vα-Jα rearrangement, we analyzed the distribution of secondary rearrangements in DP thymocytes of mice in which all thymocytes bear a uniform primary Vα-Jα rearrangement (Figure 3A). HYα mice carry a Trav17-Traj57 rearrangement introduced into Tcra with deletion of 280kb from Trav21 to Traj57 (Buch et al., 2002). In the absence of the HY-specific TCRβ chain, most DP thymocytes fail to undergo positive selection due to HYα, and undergo multiple rounds of secondary Vα-Jα recombination, deleting the initial Trav17-Traj57 rearrangement (Buch et al., 2002; Hawwari and Krangel, 2007). We found that combinatorial diversity was greatly constrained downstream of the fixed primary rearrangement in pre-selection thymocytes, with strong enrichment for “on-diagonal” Vα-Jα combinations and suppressed usage of distal Vα with proximal Jα segments (Figure 3B, 3C and S2A). Moreover, the repertoire observed in pre-selection DP thymocytes was not substantially modified by selection, because resting CD8+CD44−CD62L+ splenic T cells displayed a similarly constrained distribution of Vα-Jα combinations (Figure S2B).
Figure 3. Constrained Tcra repertoire in HYα DP thymocytes.
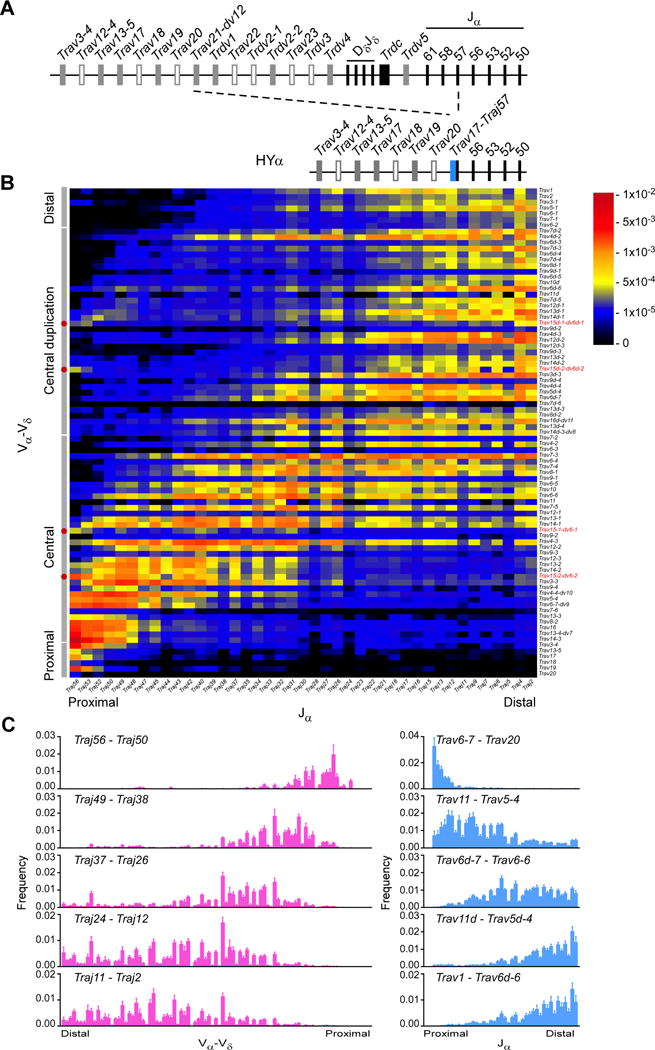
(A) Schematic of the HYα Tcra-Tcrd locus, depicting insertion of theTrav17-Traj57 cassette with deletion of 280 kb. (B) Frequencies of Vα-Jα rearrangements in HYα CD4+CD8+CD3εlo thymocytes. (C) Frequencies of Vα-Vδ (left) or Jα (right) usage with the indicated sets of Jα and Vα segments, respectively. Data are presented as the mean (B) and mean and s.d. (C) of four mice analyzed in two independent experiments. See also Figure S2.
To better understand how Vα usage changes as rearrangement proceeds, we plotted the frequency-weighted means and standard deviations (SD) of the chromosomal coordinates of the Vα segments used with each Jα segment in HYα DP thymocytes (Figures 4A and 4B). We observed that both values increased in approximately linear fashion across a substantial portion of the Jα array, but leveled off in the distal Jα segments. We calculated that in the linear region, the mean increased at a rate of 12.76 bp of Vα DNA for every one bp of Jα DNA (Table S2). Since Vα segments are, on average, spaced at 9.6 times the distance between Jα segments, this corresponds to movement of 1.33 V per J throughout the bulk of the Vα and Jα arrays. The SD increased from a starting value of 107,898 bp at Traj56 at a rate of 3.89 bp of Vα DNA for every one bp of Jα DNA (Table S2). Deviation from these trends across the distal Jα segments reflects the constraints imposed on Vα usage as the Vα array is exhausted.
Figure 4. Modeling of Vα-Jα rearrangement in HYα thymocytes.
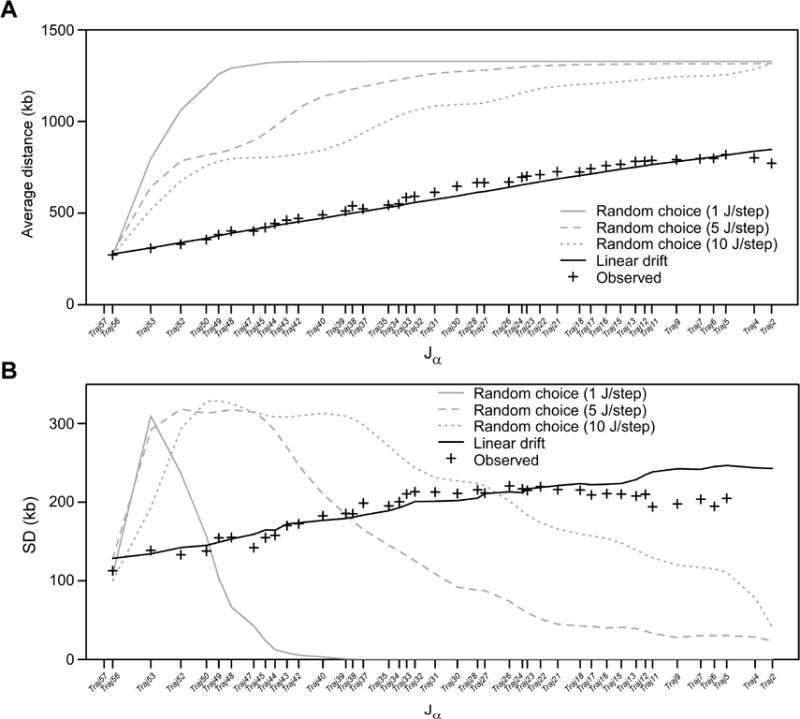
(A) Vα-Jα rearrangements were simulated in 1000 cells assuming either random choice or linear drift models for V segment selection. Results are compared to observed data for HYα thymocytes (Figure 3B), expressed as the frequency-weighted mean of the chromosomal coordinates of the Vα segments used with each Jα segment, with Vα chromosomal coordinates expressed as distance (in kb) from Traj58, and Jα segments plotted according to their chromosomal coordinates. PV scores were used to assess fit of each model to observed data. Linear drift, PV=0.06, 0.05 and 0.05, for the 1 J/step, 5 J/step, and 10 J/step simulations of movement along the Jα array, respectively. Only 1 J/step is plotted; 5 J/step, and 10 J/step simulations were superimposable. Random choice, PV=18.55, 12.66, or 6.98 for the 1 J/step, 5 J/step, and 10 J/step simulations, respectively. (B) Frequency-weighted standard deviations of Vα segment usage (in kb) were plotted as a function of Jα segment for the same simulations as in (A), and were compared to the observed data (Figure 3B). See also Table S2.
The above analysis suggested that rearrangements in individual thymocytes are highly processive along the Vα and Jα arrays, with movement described by a linear drift model, in which a constant rate of progression of Vα position is subject to random error that accumulates as the process iterates. To test this model, we simulated Vα-Jα rearrangement in 1000 individual cells using the observed starting values at Traj56 and the slopes for the mean and SD progressions. The linear drift simulation explained the observed mean and standard deviation plots remarkably well, irrespective of whether successive Jα rearrangements were assumed to occur in steps of one, five or ten Jα segments (Figures 4A and 4B). We also simulated Vα segment selection as a random choice, which assumed a uniform probability for all remaining Vα segments at each step in the rearrangement process. Regardless of the Jα step function tested, these models poorly described the observed data (Figures 4A and 4B), because they too rapidly consumed the Vα array. This analysis highlighted that usage of the Vα and Jα arrays in individual thymocytes is both highly processive and highly coordinated throughout many rounds of secondary rearrangement, placing substantial constraints on combinatorial diversity.
Tcra combinatorial diversity depends upon truncation of Vα array by Tcrd rearrangement
Because of the highly processive nature of secondary rearrangements in individual thymocytes, diversity in the pre-selection Tcra repertoire is heavily dependent on primary Tcra rearrangement. In wild-type mice, DP thymocytes initiating Tcra rearrangement have previously undergone Vδ-to-Dδ rearrangement on about 70% of Tcra-Tcrd alleles (Livak et al., 1995; Nakajima et al., 1995; Shih et al., 2012). Because Vδ segments are dispersed across one Mb within the Va array (Figure 5A), Vδ-to-Dδ recombination would variably truncate the Vα array and alter the starting point for primary Vα-to-Jα rearrangement in individual DP thymocytes. Consistent with that idea, we noted that the central and central-duplication Vα gene repeats used in primary Vα-Jα recombination tended to be located just distal to four members of the Trav15-dv6 family (Figure 1A, red dots; Figure S1C), which are frequently used during Tcrd rearrangement (Weber-Arden et al., 2000; Zhao et al., 2016).
Figure 5. Reduced Tcra combinatorial diversity in INT1-2-deficient DP thymocytes.
(A) Schematic of the INT1-2-deficient Tcra locus, which lacks the INT1 and INT2 CTCF sites and cannot form a chromatin structural loop from INT2 to the TEA CTCF site. Vδ segments are highlighted in red. (B) Frequencies of Vα-Jα rearrangements in INT1-2-deficient CD4+CD8+CD3εlo thymocytes. (C) Frequencies of Vα-Vδ (left) or Jα (right) usage with the indicated sets of Jα and Vα segments, respectively. Data are presented as the mean (B) and mean and s.d. (C) of three mice analyzed in two independent experiments. See also Figures S3 and S4.
To better understand the role of Tcrd rearrangement in diversifying primary Vα-to-Jα rearrangements, we examined the Tcra repertoire in INT1-2-deficient mice (Chen et al., 2015). In these mice, deletion of two CTCF sites disrupts a chromatin structural loop that contains the Tcrd RC. Absence of the loop causes increased contacts between the Tcrd RC and proximal Vδ segments, increased RAG tracking from the RC to proximal Vδ segments, and, as a consequence, substantially increased rearrangement of proximal Vδ segments Trdv2-2 and Trdv3 at the expense of more distal Vδ segments, including the Trav15-Trdv6 family (Chen et al., 2015; Zhao et al., 2016). Analysis of the pre-selection Tcra repertoire in INT1-2-deficient thymocytes revealed highly constrained global Vα-Jα combinatorial diversity, with a marked reduction in primary rearrangements using Vα segments in the central and central-duplication portions of the Vα array, and secondary rearrangements strongly biased toward “on-diagonal” combinations (Figures 5B and 5C). In fact, the Vα distribution used in early Jα rearrangements, as well as the overall distribution of Vα usage, mimicked the respective profiles in HYα thymocytes, even though patterns of Jα usage mirrored those in WT thymocytes (Figures S3A and S3B). Notably, INT1-2-deficient and HYα thymocytes both displayed reduced usage of distal Vα segments (Figures S3A and S3B), indicating failure to efficiently utilize the full length of the Vα array.
Quantitative analysis revealed that average Vα usage as a function of Jα position in INT1-2-deficient thymocytes was indistinguishable from HYα thymocytes, whereas both were clearly different from wild-type (Figure S4A and Table S2). However, the SD for initial Vα usage in INT1-2-deficient thymocytes was intermediate between that of wild-type and HYα (Figure S4B and Table S2). Nevertheless, in the region spanning Traj52-Traj37, the rates of Vαmovement and accumulation of Vα error were statistically indistinguishable for the three genotypes (Table S2). We conclude that limiting or eliminating Tcrd rearrangement has a major impact on the distribution of Vα gene segments used in primary rearrangements. However, because the means and SDs of Vα usage each changed at highly similar rates, we conclude that the mechanism of processive secondary rearrangements is common to all genotypes.
Tcra chromatin structure supports processive usage of Vα segments during Tcra rearrangement
Our previous studies by three-dimensional DNA fluorescence in situ hybridization (3D DNA FISH) showed that the unrearranged Tcra-Tcrd locus is highly contracted in DN thymocytes, but in DP thymocytes adopts a configuration in which the majority of V gene segments extend away from a compact region containing the Tcra and Tcrd RCs (Shih and Krangel, 2010). Studies using chromatin conformation capture (3C) revealed extensive contacts between proximal Vα and proximal Jα segments within the compact portion of the locus in DP thymocytes (Shih et al3., 2012). This genomic architecture can be understood to support proximally biased primary Vα-Jα rearrangement, with secondary rearrangements proceeding in highly processive fashion. To investigate the structure of unrearranged Tcra-Tcrd alleles in greater detail, we obtained DP thymocytes from Rag2−/− mice that had been injected with anti-CD3ε antibody, and performed 4C-seq from four viewpoints spanning from Trav1 to Eα. In accord with prior studies, we observed an extensive network of interactions involving proximal Vα gene segments, the TEA promoter, and Eα (Figure 6A, top). However, distal Vα segment Trav1 and central duplication Vα segment Trav14d-3 interacted neither with each other nor with the Tcra RC, implying an extended configuration for those portions of the locus.
Figure 6. Long-distance DNA contacts on unrearranged and HYα alleles.
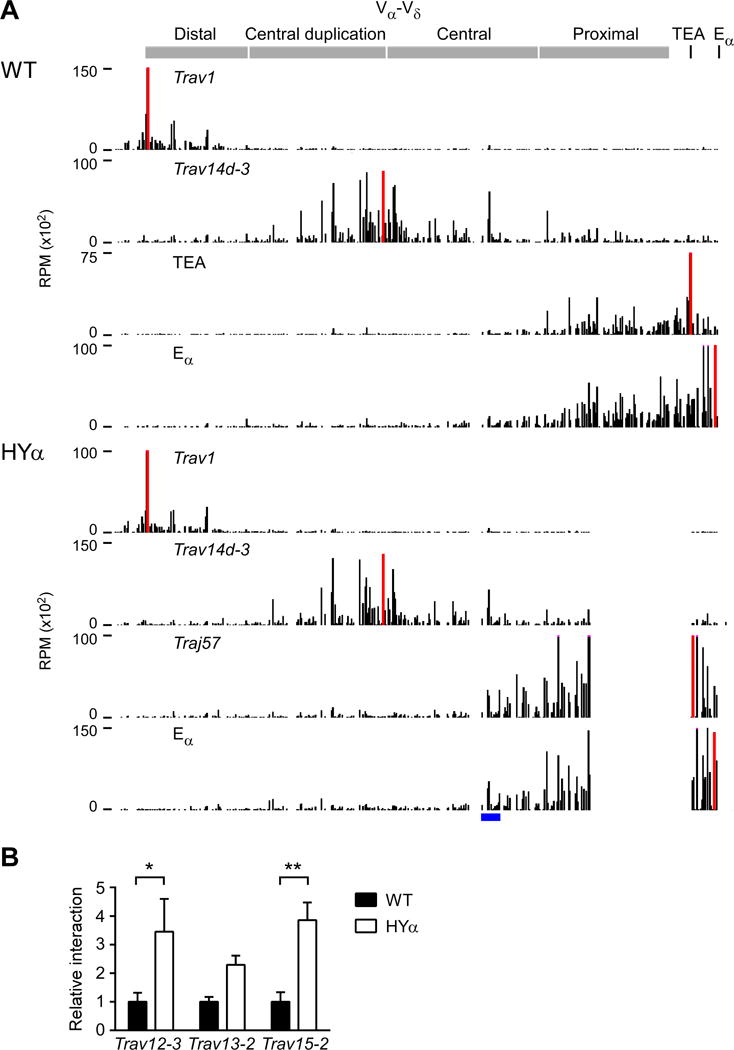
(A) 4C-seq profiles of interactions with the specified viewpoints on wild-type (top) and HYα (bottom) Tcra alleles in DP thymocytes generated in Rag2−/− mice and HYα Rag2−/−mice, respectively. Data are presented as reads per million mapped reads (RPM) within the Tcra-Tcrd locus. In each panel, the red bar identifies the viewpoint fragment. The gaps in the HYα profiles reflect the 280 kb deletion on this allele. Data are representative of two independent experiments. The blue bar beneath the HYα plots marks the region containing V segments analyzed by 3C. (B) 3C measuring interactions between Eα and selected central Vα segments. Data for WT and HYα were first normalized to each other based on interaction between Eα and a nearest neighbor fragment, and results for HYα at each site were then expressed relative to those for WT. Data are presented as the mean and s.e.m. of 5–6 WT and 3–4 HYα mice analyzed in two independent experiments. *P < 0.001, **P < 0.0001, by two-way ANOVA with Sidak’s multiple comparisons test. See also Figure S5.
The above analysis provided information relevant to the structure of the unrearranged locus, but whether this structure is maintained by a Vα-Jα rearranged locus, the substrate for secondary recombination, was unknown. Consequently, we analyzed interactions from several of the same viewpoints in DP thymocytes obtained from anti-CD3ε-treated HYα × Rag2−/−~ mice. Because the TEA promoter is included in the 280kb deletion on the HYα allele, we analyzed interactions using the Trav17-Traj57 cassette as a viewpoint instead. Despite the large deletion, Eα and Trav17-Traj57 contacted neither distal nor central duplication Vα segments, and Trav1 and Trav14d-3 contacted neither the Tcra RC nor each other (Figure 6A, bottom). Nevertheless, as a consequence of the deletion, viewpoints in the Tcra RC interacted more frequently with proximal and some central Vα segments (Figure 6A, bottom), a point which was confirmed by 3C (Figure 6B). Because contacts with the RC were redirected to the most proximal of the remaining Vα segments on the HYα allele, these contact profiles suggest a straightforward structural explanation for processive use of Vα gene segments during secondary recombination.
As additional evidence that many V segments remain out of contact with the Tcra RC on rearranged alleles, we compared HYα to wild-type alleles by 3D DNA-FISH. To accomplish this, we generated DP thymocytes from Rag2−/− mice heterozygous for the HYα allele, and used a three-probe strategy in which two probes (A and B) measured the distance between distal and central Vα gene segments, and one probe (C) distinguished the wild-type allele (intense hybridization) from the HYα allele (minimal hybridization). We observed virtually indistinguishable distributions of Vα configurations on WT and HYα alleles, confirming that the Vα array remains relatively extended through primary and secondary recombination (Figure S5).
MAIT cell development depends on diversification of Tcra repertoire by Tcrd rearrangement
A striking feature of the repertoires of HYα and INT1-2-deficient mice is the loss of rearrangements of central Jα segments to distal Vα segments (Figures 3B and 5B). Among the affected Vα-Jα combinations is Trav1-Traj33, which is less frequent in both HYα and INT1-2-deficient thymocytes relative to wild-type (Figure 7A). This rearrangement is notable because it encodes the invariant TCRa chain used by mucosa-associated invariant T (MAIT) cells (Godfrey et al., 2015; Tilloy et al., 1999). MAIT cells represent an innate-like T cell lineage that is selected by and responds to bacterial vitamin B metabolites presented by MHC-related protein 1 (MR1)(Godfrey et al., 2015). At mucosal surfaces, MAIT cells play a vital role in the response to a variety of bacterial pathogens (Le Bourhis et al., 2010; Meierovics et al., 2013). To determine whether MAIT cell abundance is reduced as a consequence of diminished Tcrd rearrangement, we used fluorophore-conjugated, antigen-loaded MR1 tetramers (Corbett et al., 2014) to compare MAIT cell populations by flow cytometry in peripheral immune tissues of wild-type, HYα, and INT1-2-deficient mice (Figures 7B and 7C). We detected 52% and 57% reductions in MR1-tetramer+ cell frequencies in spleens and lungs of INT1-2-deficient mice, and 77% and 76% reductions in spleens and lungs of HYα mice, respectively, relative to wild-type (Figures 7B and 7C). We conclude that the frequency of Trav1-Traj33 rearrangements in the thymus informs MAIT cell numbers in the periphery and that a replete MAIT cell compartment is a major functional consequence of Tcrd rearrangement on αβ-lineage T cells.
Figure 7. Diminished MAIT cell frequencies in HYα and INT1-2-deficient mice.
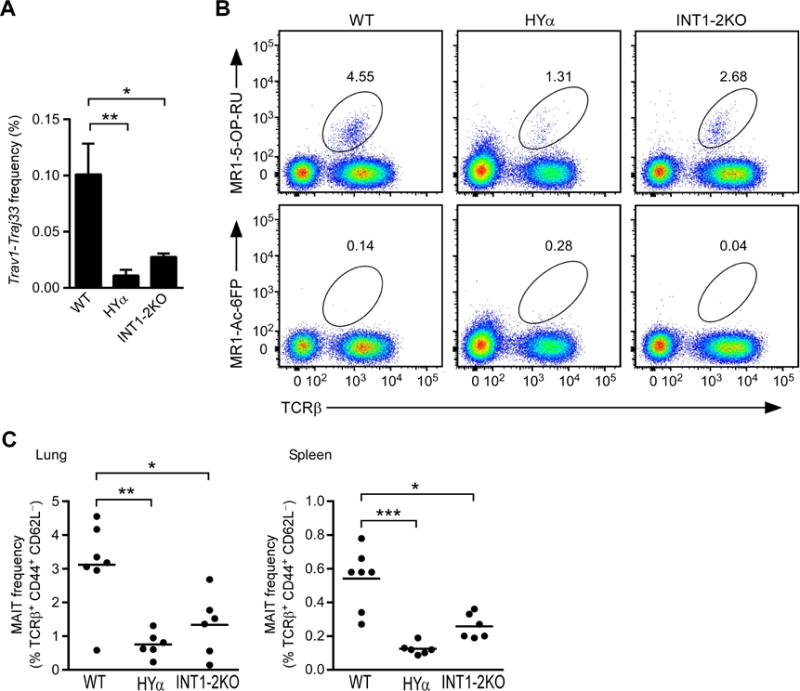
(A) Frequency of Trav1-Traj33 rearrangement in wild-type, HYα, and INT1-2-deficient thymocytes as determined by HTS. Data represent the mean and s.d. of 3–4 mice for each genotype. (B) Representative flow cytometry of lung cells isolated from wild-type, HYα, and INT1-2-deficient mice, stained for TCRβ and MR1-tetramers loaded with the indicated antigens. Numbers indicate the percentage MR1-tetramer positive cells within TCRβ+ population, with pre-gating for 7AAD−Lin−CD62L−CD44+. (C) Quantification of MAIT cell frequencies in lungs (left) and spleens (right) of wild-type, HYα, and INT1-2-deficient mice. Horizontal lines indicate the mean for each genotype, with 6–7 mice analyzed in 5 independent experiments. *P < 0.01, **P < 0.001, and ***P<0.0001, by one-way ANOVA, with Dunnett’s multiple comparisons test.
DISCUSSION
Here, we have defined the principles by which combinatorial diversity is generated in the pre-selection Tcra repertoire. Our analysis of the steady state distribution of rearrangements in wild-type and genetically manipulated strains of mice, and the temporal progression of rearrangements in wild-type mice, revealed regulated usage of both Vα and Jα segments. Primary Vα-Jα recombination events were remarkably diverse, engaging nearly half of all Vα and Jα segments. However, once a specific Vα-Jα combination was chosen during primary rearrangement in a young DP thymocyte, the subsequent progression of secondary rearrangements was highly processive, substantially constraining the set of Vα-Jα combinations available to that DP thymocyte. Notably, a major influence on the diversification of Vα usage during primary rearrangement was variable truncation of the Vα array by Vδ-Dδ rearrangements in DN thymocytes. This not only scrambled the starting points for primary rearrangement in thymocytes entering the DP compartment, but also made available distinct sets of Vα-Jα combinations during subsequent rounds of V-to-J rearrangement. Thus, heterogeneous Tcrd rearrangements in DN thymocytes enhance combinatorial diversity in the Tcra repertoire by mitigating the constraints imposed by processive usage of Vα and Jα segments during secondary rearrangements.
Primary rearrangements are also made diverse by mechanisms that promote the usage of a substantial portion of the Jα array. Although it is understood that primary rearrangements are biased towards use of Jα segments at the Vα-proximal end of the Jα array, our results revealed an unexpectedly broad distribution of primary rearrangements from Traj58 to Traj26. This distribution stands in striking contrast to the set of Jα segments used during the initial cycle of secondary recombination on HYα alleles, which we show involves only a few of the most Vα-proximal Jα segments. This difference in Jα usage during primary and secondary recombination is consistent with previously established distributions of RAG proteins on the unrearranged wildtype and the HYα allele (Ji et al., 2010a, 2010b), and can be understood as a consequence of differentially-regulated promoter usage. Unrearranged alleles are characterized by Eα-dependent germline transcription originating from the TEA promoter and a series of weaker Jα promoters dispersed through the Vα-proximal one-third of the Jα array (Abarrategui and Krangel, 2006; Hawwari et al., 2005; Villey et al., 1997). Transcription from these promoters creates the chromatin accessibility required for RAG binding. After primary rearrangement, transcription from the rearranged Vα promoter effectively suppresses transcription from downstream Jα promoters, thereby restricting RAG binding to the Jα segments immediately downstream (Hawwari and Krangel, 2007; Ji et al., 2010a). This more restricted targeting of Jα segments is likely to translate to their processive usage during secondary rearrangements.
Our results indicate that during primary and secondary rearrangement, Vα usage is restricted to the most proximal of the available Vα segments. We believe that this intrinsic bias to proximal Vα usage is best explained by the unique conformation of the Tcra-Tcrd locus in DP thymocytes. As demonstrated in this and previous studies, Eα, the Tcra RC, and proximal Vα gene segments contact each other within a relatively compact portion of the locus on unrearranged wild-type alleles, whereas more distal Vα gene segments reside in an extended region that does not contact the Tcra RC (Shih and Krangel, 2010; Shih et al., 2012). Because this structure is also maintained on the HYα allele following primary rearrangement, we imagine that only the most proximal Vα segments on an allele are likely to be captured by Jα-bound RAG, thus enforcing processive Va usage. That said, highly processive usage of Vα segments may also be understood as a consequence of RAG tracking. Recent studies have argued that RAG bound to an RSS in the RC can track along chromatin to find an RSS partner (Hu et al., 2015). Such a mechanism would impose a natural bias towards usage of relatively proximal Vα gene segments, thus enforcing processivity. Our data do not allow us to distinguish these two very different mechanisms for processive Vα usage.
As noted above, the extended conformation of the Tcra-Tcrd locus in DP thymocytes limits combinatorial diversity during any particular round of secondary rearrangement. Therefore, V-to-J rearrangement is required, not only to create TCRs to be tested by positive selection, but also to modify the locus by DNA deletion to create new opportunities for combinatorial diversity in subsequent rounds of rearrangement. At the same time, our results argue that Tcra combinatorial diversity is significantly enhanced by the quite distinct, fully contracted conformation of the locus in DN thymocytes (Shih and Krangel, 2010). As is the case at other antigen receptor loci, this contracted conformation is thought to allow distal and proximal V gene segments to effectively compete with each other for access to the RC (Jhunjhunwala et al., 2009; Shih and Krangel, 2013). In this regard, we presume that Tcra-Tcrd locus contraction in DN thymocytes is essential for members of the distributed Trav15-dv6 family to make meaningful contributions to the Tcrd repertoire (Shih and Krangel, 2010). Since these and other Tcrd rearrangements then contribute to the heterogeneity of primary Tcra rearrangements in DP thymocytes, the Tcra repertoire appears to be shaped by the combined influences of two very different locus conformations in DN and DP thymocytes.
Our conclusions about the nature of the Tcra repertoire in wild-type mice stand in contrast with another study, which concluded that secondary Vα-Jα rearrangements occurred independent of Vα chromosomal positions (Genolet et al., 2012). We note, however, that this study analyzed C57BL/6 mice, which have a large triplication rather than duplication in the Vα array, and as a result, larger families of highly similar Vα-Vα segments. Moreover, their HTS approach, with only 100-nucleotide paired-end reads, allowed unambiguous assignment of only 60% of Vα sequence reads. Nevertheless, the remaining 40% of Vα sequence reads were assigned by distributing them among the relevant Vα family members. We believe that this approach would obscure the dynamics that were readily apparent in our analysis of the strain 129 pre-selection DP thymocyte repertoire. We do not believe the different results can be attributed to analysis of splenic CD8 T cells in the previous study, because our analysis revealed that repertoire biases established in pre-selection DP thymocytes were largely maintained in the periphery. Despite the differences noted above, the profile of primary rearrangements described herein appears similar to that reported previously (Genolet et al., 2012).
Finally, our study reveals functional consequences of Tcrd rearrangement on Tcra repertoire diversification. The Trav1-Traj33 combination that encodes the invariant MAIT cell TCRα chain cannot be readily accessed by secondary rearrangements in DP thymocytes that join a proximal Vα to a proximal Jα during primary rearrangement. Our results indicate that Trav1-Traj33 rearrangements are much more frequent in the DP progeny of DN thymocytes that had undergone Vδ-Dδ rearrangement involving distal Vδ gene segments Trav15d-1-dv6d-1 or Trav15d-2-dv6d-2. Consistent with this, prior work mapped substantial strain variation in MAIT cell numbers to the Tcra locus itself (Cui et al., 2015).
From an evolutionary perspective, the combination of a nested Tcra-Tcrd organization and distal Vδ rearrangements may impart combinatorial advantage in species with an expanded Vα array. In this regard, like the mouse, the human Tcra-Tcrd locus has a prominent Vδ segment, TRDV1, situated in the middle of the Vα-Vδ array, relatively far from the Tcrd RC. Notably, the nested Tcra-Tcrd organization found in mammals is not found in frogs (Glusman et al., 2001; Parra et al., 2010), which nevertheless have extended arrays of Vα and Jα segments.
Assuming a similarly processive scheme of gene segment usage, we suggest that the combinatorial Tcra repertoire in the frog will fall short of that achieved in mice and humans.
EXPERIMENTAL PROCEDURES
Mice
Wild-type and Rag2−/− mice (Shinkai, 1992) were strain 129. TcrdCreER × Rosa26fl-STOP-fl-zsGreen mice (Zhang et al., 2015), mice homozygous for the HYα allele (Buch et al., 2002; Hawwari and Krangel, 2007), and mice homozygous for the INT1-2 deletion (Chen et al., 2015), were all of a mixed 129 and C57/BL6 genetic origin, and were previously described. HYα mice were bred with Rag2−/− mice to generate Rag2−/− mice either homozygous or heterozygous for the HYα allele (Shinkai, 1992). Regardless of genetic background, all mice analyzed carried wild-type or mutant strain 129 Tcra-Tcrd alleles. Mice were housed in a specific-pathogen-free facility managed by the Duke University Division of Laboratory Animal Resources. Mice of both genders were included in all experiments; no differences on the basis of gender were noted. All mice were handled in accordance with protocols approved by the Duke University Institutional Animal Care and Use Committee.
Cell collection
Thymi and spleens were generally collected from mice at 4 weeks of age. To label developing thymocytes, TcrdCreER 0D7 Rosa26fl-STOP-fl-ZsGreen mice were injected i.p. with a single dose of 1 mg tamoxifen (Sigma-Aldrich) in corn oil (Sigma-Aldrich), 12–72 hrs prior to sacrifice. To isolate DP thymocytes from Rag2−/− mice, mice were injected i.p. with 150 μg of anti-CD3ε antibody (2C11; Biolegend) in saline at 3 weeks of age, and thymi were harvested 10 d later. For analysis of MAIT cells, spleens and lungs were collected from 8–10 week old mice. Single-cell suspensions from lung were prepared as described (Yu et al., 2016), with modifications. Briefly, mice were euthanized via CO2 asphyxiation and perfused with 25 ml phosphate-buffered saline (PBS) through the right atrium to flush erythrocytes and non-adherent leukocytes from the pulmonary vasculature. Lungs were then inflated with 1× Hank’s buffered saline solution (HBSS) containing 5% (vol/vol) fetal bovine serum (FBS), 1.5 mg/ml collagenase A (Sigma-Aldrich) and 0.4 mg/ml DNAse I (Sigma-Aldrich), and incubated in the same solution for 45 minutes at 37°C. The resulting mixture was vortexed to homogenize the digested tissue, and filtered through an 80 μm nylon mesh. The homogenate was then pelleted and incubated for one min in 150 mM NH4Cl, 10mM KHCO3, 0.1 mM EDTA, pH 7.4, to lyse erythrocytes. The reaction was quenched by addition of RPMI 1640 containing 10% (vol/vol) FBS, pelleted by centrifugation, and resuspended in the same buffer.
Flow cytometry and cell sorting
All antibodies were purchased from Biolegend, unless stated otherwise. Pre-selection DP thymocytes were identified by staining with antibodies to CD4 (GK1.5), CD8α (53–6.7), CD3e (2C11), and lineage (Lin) markers B220 (RA3-6B2), CD11b (M1/70), CD11c (p150/90; eBioscience), F4/80 (BM8), Gr-1 (RB6-8C5), and Ter-119 (TER-119). Pre-selection DP thymocytes were defined as CD4+CD8+Lin−CD3elo during sorting. Analysis of thymocytes in TcrdCreER Rosa26fl-STOP-fl-ZsGreen mice included, in addition, antibodies to CD44 (IM7), CD25 (PC61), CD71 (RI7217), and CD69 (H1.2F3). Pre-immune CD8+ splenocytes were isolated by staining with antibodies to CD4, CD8α, CD44, CD62L (MEL-14), CD3ε, and lineage markers, and were defined as CD3εhiCD4−CD8α+CD44−CD62L+Un−. To identify MAIT cells, single cell suspensions from lung and spleen were stained with antibodies and MR1-tetramers as described (Corbett et al., 2014). Briefly, lung and splenocytes were stained for 30 min at 23°C with antibodies to CD4, CD8α, CD44, TCRβ (H57–597), CD62L, lineage markers, and phycoerythrin-conjugated MR1-tetramers (NIH Tetramer Core Facility) loaded with either 5-(2-oxopropylideneamino)-6-D-ribitylaminouracil (5-OP-RU) or acetyl-6-formylpterin (Ac-6-FP) in PBS containing 2% (vol/vol) FBS. MAIT cells were defined as Lin−TCRβ+CD44+CD62L− and 5-OP-RU MR1 tetramer+. Data were acquired on a BD FacsCanto II flow cytometer in 8-color configuration and cell sorting was conducted using a Beckman Coulter Astrios or MoFlo.
Preparation of Tcra repertoire sequencing libraries
106 sorted pre-selection DP thymocytes were lysed in Trizol (ThermoFisher) per manufacturer’s specifications and either stored at −80°C or used immediately for RNA extraction. Total RNA was subjected to template-switch 5′ RACE as previously described (Pinto and Lindblad, 2010; Quigley et al., 2011), with modifications. Briefly, a mixture 106 cell equivalents of RNA, 1 μM 5′ RACE adapter sequence (5′-GTCGCACGGTCCATCGCAGCAGTCACArGrGrG-3′) and 1 μM oligo(dT)20 primer in 12 μl nuclease-free water was heated to 70°C for one min to disrupt RNA secondary structure and then lowered to −20°C for one min to snap-anneal the oligo(dT)20 primer. The reaction was then adjusted to 250 mM Tris-HCl, pH 8.3, 375 mM KCl, 15 mM MgCl2, 0.5 mM dNTPs and 5 mM dithiothreitol, before addition of 200 U Superscript II (ThermoFisher) in a final volume of 20 μl. The reaction was incubated for 2 hrs at 42°C to synthesize cDNA and add RACE adapter by template switching. Reverse transcriptase was then inactivated by incubation for 7 min at 72°C.
PCR amplification of 5′ RACE cDNA was performed as described (Quigley et al., 2011), with modifications. All PCRs used Kapa HiFi polymerase in 1× Kapa HiFi buffer (Kapa Biosystems) in 50 μl total volume. PCR reactions contained 0.375 μM antisense Trac primer (5′-TACACAGCAGGTTCTGGGTTCTGGATGT-3′), 0.02 μM sense RACE adapter primer 1 (5′-ACGCTGACGCTGAGCCTACCTGACGTCGCACGGTCCATCGCAGCAGTC-3′), and 0.4 μM sense RACE adapter primer 2 (5′-ACGCTGACGCTGAGCCTACCTGAC-3′). Touchdown PCR was performed using one cycle of 30 s at 98°C, five cycles of 10 s at 98°C and 2 min at 72°C, five cycles of 10 s at 98°C and 2 min at 70°C, ten cycles of 10 s at 98°C, 30 s at 65°C, and 2 min at 72°C, and 1 cycle of 10 min at 72°C. PCR products were then purified using a PCR purification kit (Qiagen) and U-Prep spin columns (Genesee) following manufacturer’s specifications. Barcodes and Illumina adapter sequences were then added by PCR amplification as described, with modifications (Kozich et al., 2013). Sense primer, consisted of, from 5′ to 3′,Illumina P5 adapter sequence (5′-AATGATACGGCGACCACCGAGATCTACAC-3′), one of seven Nextera XT (Illumina) 8bp barcode sequences (N50x), a pad sequence (5′-TGTCGTCCTT-3′), and the RACE adapter primer 2 sequence. Antisense primer, consisted of, from 5′ to 3′, the Illumina P7 adapter sequence (5′-CAAGCAGAAGACGGCATACGAGAT-3′), the Nextera ×T N701 barcode (5′-TCGCCTTA-3′), a pad sequence (5′-AGTCAATCAA-3′), and the Trac antisense primer sequence. Both were used at 0.375 00BCM. For PCR2, PCR1 products were subjected to one cycle of 30 s at 98°C, 10 cycles of 10 s at 98°C, 30 sec at 65°C, and 2 min at 72°C, and one cycle of 10 min at 72°C. For both rounds of PCR, eight individual PCRs were run for each sample, after which products were pooled. After the second round of PCR, products were purified as described above and amplification of libraries was verified by gel electrophoresis. PCR yields were quantified using PicoGreen (ThermoFisher). All primers and oligonucleotides were obtained from Integrated DNA Technologies, purified using standard desalting methods, and dissolved in nuclease-free water.
Immune repertoire sequencing and data analysis
Either six or seven barcoded libraries were pooled in equimolar amounts for sequencing, which was performed by the Duke University Sequencing and Genomic Technologies Shared Resource using the Illumina MiSeq platform. Agilent Bioanalyzer traces were used to determine library molarity and quality prior to loading of the flow cell. Custom primers for sequencing read 1 (5′-GGTCCATCGCAGCAGTCACAGGGG-3′), the P7 index read (5′-CAGAACCCAGAACCTGCTGTGTATTGATTGACT-3′), and sequencing read 2 (5′-AGTCAATCAATACACAGCAGGTTCTGGGTTCTGGATGT-3′) were spiked into the standard Illumina primer mix along with a PhiX control library. 300 nucleotide paired-end reads were collected using Illumina version 3 chemistry, and libraries were demultiplexed and assessed for quality and yield using Illumina MiSeq Reporter software.
Sequencing data was analyzed using the MiXCR (version 1.7.2) immune repertoire analysis pipeline (Bolotin et al., 2015). A reference library of strain 129 Vα and Vδ sequences and DBA/J Jα sequences was used for all alignments (Bosc and Lefranc, 2003). Sequences were screened for alignment using the ‘align’ command with the RNA-seq parameter set (parameter ‘-p rna-seq’). The ‘assemble’ command was then used to identify clones from within the pool of aligned sequences, and to assign each clone to a particular V or J segment in a second round of alignment (Table S1). Sequences spanning from the beginning of CDR2 to the end of CDR3 (parameter ‘-OassemblingFeatures=[CDR2+FR3+CDR3]’) were used to identify clones and constituent gene segments (Table S1). Assembled clones were extracted to a human-readable format using the ‘exportClones’ command and alignment fidelity was assessed manually; frequent mis-identification of Trav16d as Trav16 was corrected by hand. The PlotFancyVJUsage routine in the VDJtools pipeline (Shugay et al., 2015) was used to tabulate clonal frequencies of V-J pairings. Heatmaps were generated using the gplots (Warnes et al., 2016) and RColorBrewer (Neuwirth, 2014) packages within RStudio (R Core Team, 2016), and bar graphs were generated using Excel (Microsoft) and Prism (GraphPad Software, Inc.). For experiments in Figures 1, 3, and 5, subsampling of sequences was performed using the RarefactionPlot routine in VDJtools to verify that the depth of sequencing was sufficient in each sample.
Statistical analysis of repertoire data
Repertoire data from each biological replicate took the form of an 85 × 42 array of counts Nvj of the frequency of Vα-Jα combinations at loci Vv and Jj. To estimate the rate of progression along the Vα array relative to progression along the Jα array, for every Jα segment Jj we calculated the frequency weighted average , and the frequency weighted SD sj (where , is the marginal frequency of Jα segment Jj and dv is the distance in base pairs of Vα segment Vi from the most proximal Jα segment). A smoothed spline was fit to the observed mean and SD plots for each strain. Slopes were calculated for the region from Traj52 to Traj37, because this region was linear in all strains.
To compare rates of progression along the Vα array relative to the Jα array between the mouse strains, a mixed effects linear function of the form
| (1) |
was fit to the observed data for wild-type, HYα, and INT1-2-deficient mice. The observed mean Vα segment for strain s (wild-type, HYα, or INT1-2) and replicate i at a given Jα segment j is given as a function of the expected mean Vα segment υWT, J56 for the wild-type strain at initial Jα segment Traj56, the effect υs, J56 of strain s at initial Jα segment Traj56, a replication-specific initial random effect bsi (assumed to have a zero mean Gaussian distribution with SD σb), the rate of progression r along the Vα array in the HYα strain as a function of the distance dj (in bp) of the j-th Jα segment from Traj56, the differential rate rs of progression along the Vα array in strain s, and measurement error εjsi (assumed to have an independent zero mean Gaussian distribution with SD σe).
To compare between strains how variability in Vα segment usage changed as a function of the Jα segment used, a mixed effects linear function of the form
| (2) |
was fit to the observed data for each strain s. The observed SD sjsi in Vα segment usage at Jα segment j in replicate i is given as a function of the SD value κWT,J56 of Vα segments at initial Jα segment Traj56 in wild-type thymocytes, the effect κs,J56 of strain s at Traj56, the replicate-specific initial random effect gsi (given as a zero mean Gaussian distribution with SD σg), the rate of increase λ in SD in HYα thymocytes (given as a function of the distance dj in bp of the j-th Jα segment from the initial Jα segment Traj56) the differential rate of increase in SD in Vα segment usage across the Jα array λs in strain s, and the measurement error ηsi (assumed to have an independent zero mean Gaussian distribution with SD σh).
Models (1) and (2) were fit to the data by the method of restricted maximum likelihood (REML) using the nlme package in the R computing platform (Pinheiro et al., 2017; R Core Team, 2016). The marginal distribution of counts of cells by Jα segment Njsi for the s-th variant and i-th replicate was separately normalized by the total number of observed cells for each replicatec . We used a two factor ANOVA to examine the relative contributions of the variant type, Jα segment, and their interaction, to the observed variation in marginal distribution.
Modeling and simulation of Vα-Jα rearrangement
Two distinct models for secondary Vα-Jα rearrangement were fit to the observed HYα repertoire. The random choice model assumed that progression in the Jα array is a continuous sequential movement while progression in the Vα array occurs in discrete unidirectional jumps, with the probability of selecting an unused Vα segment from the array V/+1, Vi+2,…, V85, given by the formula 1/(85−i), where V1 is the most Jα-proximal Vα segment, V85 is the most distal Vα segment, and Vi denotes the position of the last Vα segment used. Three sub-models of Jα progression were considered: i) Use of the Jα array one segment at a time, allowing a total of 42 rearrangements per cell, ii) use of Jα segments selected from a Poisson distribution of mean 5 Jα segments distal to the last segment used, and iii) use of Jα segments selected from a Poisson distribution of mean 10 Jα segments distal to the last segment used.
The linear drift model assumed that for a population of cells, progression through the Vα array E[V(t)] occurs at a rate r that is proportional to the rate of progression through the Jα array J(t), described by the equation E[V(t)] = V(0) + r (J(t) − J(0)), where V(0) and J(0) are the Vα and Jα segments used by the primary rearrangement. It was assumed that movement in the Vα array occurred in discrete steps s and was subject to some random error. For a particular cell c, Vc(ts) = Vc(ts-1) + r (Jc(ts) − Jc(ts-1)) + εc(ts), where Vc(ts) and Jc(ts) were the Vα and Jα segments used in the current rearrangement and Vc(ts-1) and Jc(ts-1) were the Vα and Jα segments used in the prior rearrangement. The errors εc(t) were assumed to have a zero mean Gaussian distribution with common standard deviation σe and independent increments in time. Propagation of the above progression model implied that the position of the V locus Vc(t) accumulates errors over time, as described by Vc(ts) = Vc(ts−2) + r (Jc(ts) − Jc(ts−2)) + εc(ts) + εc(ts−1) = Vc(ts−3) + r (Jc(ts) − Jc(ts−3)) + εc(ts) + εc(ts−1) + εc(ts−2), etc. Therefore, the SD in the position of the array Vc(ts) increases proportionally to the square root of the number of steps s: SD[Vc(ts)] = √sσe. For the simulation, the progression rate r and standard deviation σe were set to the corresponding quantities in the observed data.
The Vα progression was simulated using each of the probabilistic models described above, for a population of 1000 cells, yielding a set of 1000 Vα-Jα progression trajectories. Each trajectory was initialized by sampling from the observed distribution of Vα segments rearranged to Traj56 in HYα thymocytes. The simulated trajectories were tallied to obtain an 85 × 42 array of counts Rij, which gave the expected frequency distribution of Vα-Jα combinations under the model. Frequency-weighted mean and SD values for Vα segments were graphed against all positions in the Jα array as described for the observed data. Quality of fit of each model to the observed data was measured using the PV calculation, given by the equation:
| (3) |
where is the observed mean Vα segment partner for a given Jα segment, the corresponding model prediction and the overall mean Vα segment across the entire Jα array. The numerator of (3) is the sum of squared errors between the observed and predicted means. The denominator of (3) is the scaled variance of the observed means. For the models averaging steps of 5 or 10 across the Jα array, the sum was calculated over every fifth or tenth Jα segment, respectively.
3C and 4C-seq
3C libraries were generated from 107 cells as described (Chen et al., 2015; Hagege et al., 2007; Shih et al., 2012), by digestion with HindIII. The Eα viewpoint primer and TaqMan probe (Shih et al., 2012) were used in combination with primers annealing to HindIII fragments containing Trav13-2(5′-CTTACAAGTCACAAGAAATCAGAG-3′), Trav12-3 and Trav9-3(5′-GTGAAGTGGCCATAAACATGTTT-3′), and Trav15-2 (5′-GAAAGAGTGGGCAGGCTTCAGC-3′). Data were normalized to interactions between the Eα viewpoint and its nearest neighboring HindIII fragment (Shih et al., 2012) using the ΔCt method.
For 4C, secondary digestion and re-ligation were performed as described (Chen et al., 2015; Stadhouders et al., 2013), with modifications. 3C libraries were digested overnight at 37°C with 200 U of Bfal (New England Biolabs), followed by addition of 200 U of Bfal and digestion for 6 h at 37 °C. The digested libraries were purified by phenol-chloroform extraction, precipitated with 2.5 vol ethanol, and rehydrated in 7 ml 30 mM Tris-HCl, pH 8.0, 10 mM MgCl2, 1 mM DTT and 0.1 mM ATP, after which 200 U of T4 DNA ligase (New England Biolabs) were added for overnight incubation at 16°C. The reactio ns were then supplemented with an additional 200 U T4 DNA ligase, followed by incubation for a minimum of 6 h at 16°C. 4C libraries were then purified by phenol-chloroform extraction, precipitated with 2.5 vol ethanol, and rehydrated in 200 μl of 10mM Tris-HCl, pH 8.0, 0.1 mM EDTA. Each library was then used for two rounds of inverse PCR from each of four viewpoints, with eight individual PCR reactions performed per viewpoint. First-round PCR was conducted with the following primers at 0.2 μM: TEA-F (5′-CCATCTGCCTCGCTGTTCTAG-3′) and TEA-R (5′-CTCATAACAGTAACCCAGCAAGCTT-3′), Eα-F (5′-GGCCCTCTCTGTATCTCAGGGGAA-3′) and Eα-R (5′-AAGACAGACCCTGCGAAGCTT-3′), Traj57-F (5′-GATCAACAAGTAAACGTTGAAGCTT-3′) and Traj57-R (5′-GTATAGCAGCCGACTCCTAG-3′), Trav14d-3-F (5′-CTGTTTGAGGTGACAGTACAAGCT-3′) and Trav14d-3-R (5′-GGAAAATCCATGCTTAGAGTCTAG-3′), and Trav1-F (5′-GTGGTCAACTGCCCCATGCT-3′) and Trav1-R (5′-GATGGTGGGAGGTAAGTTCCA-3′). PCR conditions were as follows: 30 s at 98°C, followed by 20 cycles of 10 s at 98°C, 30 s at 60°C and 2 min at 72°C, with a final extension for 10 min at 72°C PCR products were purified with QiaQuick PCR purification reagents (Qiagen) and UPrep spin columns (Genesee), and were then subjected to second round PCR to add Illumina sequencing adapters to their ends. Second round PCR was conducted with the following primers at 0.2 μM: Adapter 2-TEA-F(5′-CCATCTGCCTCGCTGTT-CTAG-3′) and Adapter 1-TEA-R(5′-CTCATAACAGTAACCCAGCAAGCTT-3′), Adapter 2-Ea-F(5′-GGCCCTCTCTGTATCTCAGGGGAA-3′) and Adapter 1-Eα-R(5′-AGACAGACCCTGCGAAGCTT-3′), Adapter 1-Traj57-F(5′-GATCAACAAGTAAACGTTGAAGCTT-3′) and Adapter 2-Traj57-R(5′-GTATAGCAGCCGACTCCTAG-3′), Adapter 1-Trav14d-3-F(5′-CTGTTTGAGGTGACAGTACAAGCT-3′) and Adapter 2-Trav14d-3-R(5′-GGAAAATCCATGCTTAGAGTCTAG-3′), and Adapter 1-Trav1-F(5′-AACTGCCCCATGCTAAGCCT-3′) and Adapter 2-Trav1-R(5′-GATGGTGGGAGGTAAGTTCCA-3′), where Adapter 1 is 5′-AATGATACGGCGACCACCGAACACTCTTTCCCTACACGACGCTCTTCCGATCTNNNN-3′ and Adapter 2 is 5′-CAAGCAGAAGACGGCATACGA-3′. PCR conditions were as follows: 30 s at 98°C, 2 cycles of 10 s at 98°C, 30 s at 60°C and 2 min at 72°C, 8 cycles of 10 s at 98°C, 30 s at 65°C and 2 min at 72°C, and a final extension for 10 min at 72°C. All PCR reactions used Phusion polymerase in Phusion HiFi buffer (New England Biolabs) at a reaction volume of 50 μl. Following second round PCR, the eight reactions for each viewpoint were pooled, and PCR products were purified as described above and assessed by gel electrophoresis. PCR products for each viewpoint were quantified with PicoGreen, multiplexed by pooling all viewpoints from a given biological specimen in equimolar ratios, and supplemented by the addition of a 1% spike of PhiX control library (Illumina). Before sequencing, the quality of the pooled libraries was assessed using the Bioanalyzer platform (Agilent). Multiplexed libraries were then subjected to 100 nucleotide single-end sequencing by the Duke University Sequencing and Genomic Technologies Shared Resource using the Illumina HiSeq 2500 platform. All primers were obtained from Integrated DNA Technologies and dissolved in nuclease-free water. Primers containing Adapter 1 were purified using high-performance liquid chromatography, while all other primers were purified using standard desalting methods.
Sequencing data were analyzed using a workflow modified from one that has been published (Chen et al., 2015; Stadhouders et al., 2013). To generate a reference genome, the strain 129Sv/J Tcra-Tcrd sequence was spliced into the mm9 genome assembly in place of the endogenous Tcra-Tcrd sequence, as previously performed for Igh sequences (Medvedovic et al., 2013). FASTQ files containing raw ‘multiplexed’ data had the first four random nucleotides excised using the Fastx toolkit, and were split with viewpoint-specific primer sequences included in second round of PCR. The first 14 bp representing viewpoint sequence were excised with the Fastx toolkit, and the remaining 82 nucleotides of each read were aligned to the hybrid mm9Tcra129Sv/J genome assembly using Bowtie, with allowance for 2 mismatches and unique sequences only (Bowtie parameters -v 2 -m 1 –all –best –strata). Mapped reads were counted, sorted, and formatted using Samtools and were visualized using the UCSC Genome Browser. Data are presented as reads per million mapped sequence reads in the Tcra-Tcrd locus.
Three-dimensional DNA fluorescence in situ hybridization
3D DNA-FISH was performed as previously described (Shih and Krangel, 2010). Bacterial artificial chromosome (BAC) clones RP23-304L21 (probe A, distal V), RP24-334B8 (probe B, central V), and bMQ-440L6 (probe C, proximal V) were used to generate DNA probes. BACs were directly labeled with Alexa Fluor 568-5-dUTP (ThermoFisher) using a nick translation kit (Roche), with digoxigenin–11-dUTP using a DIG-nick translation kit (Roche), or with biotin-11-dUTP using a biotin-nick translation kit (Roche).
Cells were fixed and hybridized as described previously (Shih and Krangel, 2010). In brief, cells attached to poly-L-lysine-coated slides (VWR Technologies) were fixed in 4% (vol/vol) paraformaldehyde (Electron Microscopy Sciences) for 10 min, followed by permeabilization with 0.5% (wt/vol) saponin (Sigma-Aldrich) and 0.5% (vol/vol) Triton X-100 (VWR) for 1 hr and incubation with 0.1 N HCl for 10 min. After four cycles of freeze/thaw in 20% (wt/vol) glycerol (VWR) in 1× HBSS, the slides were stored at −80°C. For hybridization, the cells were denatured by incubation at 77.8°C for 3 min in 70% (vol/vol) formamide (VWR) and 2× SSC (0.3 M NaCl, 30 mM Na3C6H5O7, pH 7.0), followed by 1 min in 50% (vol/vol) formamide and 2× SSC. Denatured slides were then hybridized for 24–48 h at 37°C with boiled and preannealed probe cocktails. The DNA probe cocktail consisted of 1 μg of each DNA probe per slide and blocking DNAs (mixture of mouse Cot-1 DNA and salmon sperm DNA) in HYBRISOL VII (MP Biomedicals). Excess probe was removed by two incubations of 5–7 min at 42°C in 50% (vol/vol) formamide and 2× SSC, followed by three incubations at 60°C in 0.2× SSC. The slides were blocked by incubation for 30 min in 4% BSA and 2× SSC and then incubated for 1 h with Cy5-conjugated anti-digoxigenin and AlexaFluor488-conjugated anti-biotin antibodies (Jackson ImmunoResearch Laboratories, Inc.) in 4% (wt/vol) bovine serum albumin and 2× SSC. Excess antibodies were removed by three 5-min incubations in 0.1% (vol/vol) Triton X-100 and 2× SSC. The slides were mounted in Vectashield (Vector Laboratories), and were imaged on an inverted confocal microscope (SP5; Leica) using a 100× NA 1.4 objective lens and a 2× optical zoom. FIJI (National Institutes of Health) software was used to process images and to determine the coordinates (x, y, z) of focus centers. A probe C signal was used to identify Tcra alleles as WT (positive) or HYα (weak or absent). Distances between pairs of foci (d, in micrometers) were calculated using the formula d2 = [(x′ − x) × 0.151]2 + [(y′ − y) × 0.151]2+ [(z′ − z) × 0.131]2, where 0.151 μm is the size of each pixel and 0.131 μm is the z-plane separation. Only nuclei with distinguishable signals from two alleles were analyzed.
Statistical methods
Data were analyzed by one-way ANOVA, two-way ANOVA, or MannWhitney U test as appropriate, using Graphpad Prism software. P values of less than 0.05 were considered statistically significant. Sample sizes were estimated on the basis of initial experiments and measurements, rather than being predetermined on the basis of expected effect sizes. No data were excluded from analysis. There was no randomization of mice or “blinding” of researchers to experimental groups.
Supplementary Material
Highlights.
The Tcra repertoire is limited by processive Vα−Jα usage on individual alleles
Processive Vα usage is dictated by an extended Tcra-Tcrd chromatin conformation
Vα diversity during primary rearrangement is imparted by prior Tcrd recombination
Tcrd recombination facilitates development of Trav1-Traj33+ innate-like MAIT cells
Acknowledgments
We thank N. Martin and L. Martinek of the Duke Cancer Institute Flow Cytometry Facility for help with cell sorting and analysis, N. Devos of the Duke Center for Genomics and Computational Biology for advice on DNA sequencing, the NIH Tetramer Core Facility for MR1 tetramers, A. Byrd for technical support, and G. Kelsoe and D. Dauphars for comments on the manuscript. Supported by the National Institutes of Health (RO1 GM41052 to M.S.K, and RO1 GM059638 and R21 AG045440 to Y.Z.). K.R.C. was partially supported by the Duke Biostatistics Core, which is funded by the National Center for Advancing Translational Science (UL1TR001117).
Footnotes
Publisher's Disclaimer: This is a PDF file of an unedited manuscript that has been accepted for publication. As a service to our customers we are providing this early version of the manuscript. The manuscript will undergo copyediting, typesetting, and review of the resulting proof before it is published in its final citable form. Please note that during the production process errors may be discovered which could affect the content, and all legal disclaimers that apply to the journal pertain.
AUTHOR CONTRIBUTIONS
Z.C., K.R.C., B.Z., Y.Z. and M.S.K conceived and designed the experiments, Z.C. and B.Z. performed the experiments, Z.C., K.R.C. and M.S.K. analyzed the experiments, and Z.C., K.R.C. and M.S.K. wrote the manuscript.
ACCESSION NUMBERS
TCRα repertoire sequencing and 4C-seq data are deposited in the Gene Expression Omnibus (GSE95826).
References
- Abarrategui I, Krangel MS. Regulation of T cell receptor a gene recombination by transcription. Nat Immunol. 2006;7:1109–1115. doi: 10.1038/ni1379. [DOI] [PubMed] [Google Scholar]
- Aude-Garcia C, Gallagher M, Marche PN, Jouvin-Marche E. Preferential ADV-AJ association during recombination in the mouse T-cell receptor alpha/delta locus. Immunogenetics. 2001;52:224–230. doi: 10.1007/s002510000266. [DOI] [PubMed] [Google Scholar]
- Bolotin DA, Poslavsky S, Mitrophanov I, Shugay M, Mamedov IZ, Putintseva EV, Chudakov DM. MiXCR: software for comprehensive adaptive immunity profiling. Nat Methods. 2015;12:380–381. doi: 10.1038/nmeth.3364. [DOI] [PubMed] [Google Scholar]
- Bosc N, Lefranc MP. The mouse (Mus musculus) T cell receptor alpha (TRA) and delta (TRD) variable genes. Dev Comp Immunol. 2003;27:465–497. doi: 10.1016/s0145-305x(03)00027-2. [DOI] [PubMed] [Google Scholar]
- Le Bourhis L, Martin E, Peguillet I, Guihot A, Froux N, Core M, Levy E, Dusseaux M, Meyssonnier V, Premel V, et al. Antimicrobial activity of mucosal-associated invariant T cells. Nat Immunol. 2010;11:701–708. doi: 10.1038/ni.1890. [DOI] [PubMed] [Google Scholar]
- Buch T, Rieux-Laucat F, Forster I, Rajewsky K. Failure of HY-Specific Thymocytes to Escape Negative Selection by Receptor Editing. Immunity. 2002;16:707–718. doi: 10.1016/s1074-7613(02)00312-6. [DOI] [PubMed] [Google Scholar]
- Carico Z, Krangel MS. Advances in Immunology. Academic Press Inc.; 2015. Chromatin Dynamics and the Development of the TCRα and TCRS Repertoires; pp. 307–361. [DOI] [PubMed] [Google Scholar]
- Chen L, Carico Z, Shih HY, Krangel MS. A discrete chromatin loop in the mouse Tcra-Tcrd locus shapes the TCRδ and TCRα repertoires. Nat Immunol. 2015;16:1085–1093. doi: 10.1038/ni.3232. [DOI] [PMC free article] [PubMed] [Google Scholar]
- Ciofani M, Zúñiga-Pflücker JC. Determining γδ versus αβ T cell development. Nat Rev Immunol. 2010;10:657–663. doi: 10.1038/nri2820. [DOI] [PubMed] [Google Scholar]
- Corbett AJ, Eckle SBG, Birkinshaw RW, Liu L, Patel O, Mahony J, Chen Z, Reantragoon R, Meehan B, Cao H, et al. T-cell activation by transitory neo-antigens derived from distinct microbial pathways. Nature. 2014;509:361–365. doi: 10.1038/nature13160. [DOI] [PubMed] [Google Scholar]
- Cui Y, Franciszkiewicz K, Mburu YK, Mondot S, Le Bourhis L, Premel V, Martin E, Kachaner A, Duban L, Ingersoll MA, et al. Mucosal-associated invariant T cell-rich congenic mouse strain allows functional evaluation. J Clin Invest. 2015;125:4171–4185. doi: 10.1172/JCI82424. [DOI] [PMC free article] [PubMed] [Google Scholar]
- Genolet R, Stevenson BJ, Farinelli L, Østerås M, Luescher IF. Highly diverse TCRα chain repertoire of pre-immune CD8+ T cells reveals new insights in gene recombination. EMBO J. 2012;31:4247–4248. doi: 10.1038/emboj.2012.277. [DOI] [PMC free article] [PubMed] [Google Scholar]
- Glusman G, Rowen L, Lee I, Boysen C, Roach JC, Smit AFA, Wang K, Koop BF, Hood L. Comparative Genomics of the Human and Mouse T Cell Receptor Loci. Immunity. 2001;15:337–349. doi: 10.1016/s1074-7613(01)00200-x. [DOI] [PubMed] [Google Scholar]
- Godfrey DI, Uldrich AP, McCluskey J, Rossjohn J, Moody DB. The burgeoning family of unconventional T cells. Nat Immunol. 2015;16:1114–1123. doi: 10.1038/ni.3298. [DOI] [PubMed] [Google Scholar]
- Warnes GR, Bolker B, Bonebakker L, Gentleman R, Huber W, Liaw A, Lumley T, Maechler M, Magnusson A, Moeller S, Schwartz M. gplots: Various R Programming Tools for Plotting Data. 2016 (available at https://cran.r-project.org/package=gplots)
- Guo J, Hawwari A, Li H, Sun Z, Mahanta SK, Littman DR, Krangel MS, He YW. Regulation of the TCRα repertoire by the survival window of CD4+CD8+ thymocytes. Nat Immunol. 2002;3:469–476. doi: 10.1038/ni791. [DOI] [PubMed] [Google Scholar]
- Hagege H, Klous P, Braem C, Splinter E, Dekker J, Cathala G, de Laat W, Forne T. Quantitative analysis of chromosome conformation capture assays (3C-qPCR) Nat Protoc. 2007;2:1722–1733. doi: 10.1038/nprot.2007.243. [DOI] [PubMed] [Google Scholar]
- Hao B, Krangel MS. Long-Distance Regulation of Fetal VS Gene Segment TRDV4 by the Tcrd Enhancer. J Immunol. 2011;187:2484–2491. doi: 10.4049/jimmunol.1100468. [DOI] [PMC free article] [PubMed] [Google Scholar]
- Hawwari A, Krangel MS. Regulation of TCR S and a repertoires by local and long-distance control of variable gene segment chromatin structure. J Exp Med. 2005;202:467–472. doi: 10.1084/jem.20050680. [DOI] [PMC free article] [PubMed] [Google Scholar]
- Hawwari A, Krangel MS. Role for rearranged variable gene segments in directing secondary T cell receptor a recombination. Proc Natl Acad Sci. 2007;104:903–907. doi: 10.1073/pnas.0608248104. [DOI] [PMC free article] [PubMed] [Google Scholar]
- Hawwari A, Bock C, Krangel MS. Regulation of T cell receptor a gene assembly by a complex hierarchy of germline Ja promoters. Nat Immunol. 2005;6:481–489. doi: 10.1038/ni1189. [DOI] [PMC free article] [PubMed] [Google Scholar]
- Helmink BA, Sleckman BP. The Response to and Repair of RAG-Mediated DNA Double-Strand Breaks. Annu Rev Immunol. 2012;30:175–202. doi: 10.1146/annurev-immunol-030409-101320. [DOI] [PMC free article] [PubMed] [Google Scholar]
- Hu J, Zhang Y, Zhao L, Frock RL, Du Z, Meyers RM, Meng F, Schatz DG, Alt FW. Chromosomal Loop Domains Direct the Recombination of Antigen Receptor Genes. Cell. 2015;163:947–959. doi: 10.1016/j.cell.2015.10.016. [DOI] [PMC free article] [PubMed] [Google Scholar]
- Huang CY, Kanagawa O. Ordered and Coordinated Rearrangement of the TCR a Locus: Role of Secondary Rearrangement in Thymic Selection. J Immunol. 2001;166:2597–2601. doi: 10.4049/jimmunol.166.4.2597. [DOI] [PubMed] [Google Scholar]
- Jhunjhunwala S, van Zelm MC, Peak M, Murre C. Chromatin Architecture and the Generation of Antigen Receptor Diversity. Cell. 2009;138:435–448. doi: 10.1016/j.cell.2009.07.016. [DOI] [PMC free article] [PubMed] [Google Scholar]
- Ji Y, Resch W, Corbett E, Yamane A, Casellas R, Schatz DG. The In Vivo Pattern of Binding of RAG1 and RAG2 to Antigen Receptor Loci. Cell. 2010a;141:419–431. doi: 10.1016/j.cell.2010.03.010. [DOI] [PMC free article] [PubMed] [Google Scholar]
- Ji Y, Little AJ, Banerjee JK, Hao B, Oltz EM, Krangel MS, Schatz DG. Promoters, enhancers, and transcription target RAG1 binding during V(D)J recombination. J Exp Med. 2010b;207:2809–2816. doi: 10.1084/jem.20101136. [DOI] [PMC free article] [PubMed] [Google Scholar]
- Kozich JJ, Westcott SL, Baxter NT, Highlander SK, Schloss PD. Development of a dual-index sequencing strategy and curation pipeline for analyzing amplicon sequence data on the MiSeq Illumina sequencing platform. Appl Environ Microbiol. 2013;79:5112–5120. doi: 10.1128/AEM.01043-13. [DOI] [PMC free article] [PubMed] [Google Scholar]
- Livak F, Petrie HT, Crisps IN, Schatz DG. In-frame TCR 8 gene rearrangements play a critical role in the ap/yS T cell lineage decision. Immunity. 1995;2:617–627. doi: 10.1016/1074-7613(95)90006-3. [DOI] [PubMed] [Google Scholar]
- Medvedovic J, Ebert A, Tagoh H, Tamir IM, Schwickert TA, Novatchkova M, Sun Q, Huis in ’t Veld PJ, Guo C, Yoon HS. Flexible Long-Range Loops in the VH Gene Region of the Igh Locus Facilitate the Generation of a Diverse Antibody Repertoire. Immunity. 2013;39:229–244. doi: 10.1016/j.immuni.2013.08.011. [DOI] [PMC free article] [PubMed] [Google Scholar]
- Meierovics A, Yankelevich WJC, Cowley SC. MAIT cells are critical for optimal mucosal immune responses during in vivo pulmonary bacterial infection. Proc Natl Acad Sci. 2013;110:E3119–E3128. doi: 10.1073/pnas.1302799110. [DOI] [PMC free article] [PubMed] [Google Scholar]
- Nakajima PB, Menetski JP, Roth DB, Gellert M, Bosma MJ. V-D-J rearrangements at the T cell receptor S locus in mouse thymocytes of the αβ lineage. Immunity. 1995;3:609–621. doi: 10.1016/1074-7613(95)90132-9. [DOI] [PubMed] [Google Scholar]
- Neuwirth E. RColorBrewer: ColorBrewer Palettes. 2014 (available at https://cran.r-project.org/package=RColorBrewer)
- Parra ZE, Ohta Y, Criscitiello MF, Flajnik MF, Miller RD. The dynamic TCRδ: TCRδ chains in the amphibian Xenopus tropicalis utilize antibody-like V genes. Eur J Immunol. 2010;40:2319–2329. doi: 10.1002/eji.201040515. [DOI] [PMC free article] [PubMed] [Google Scholar]
- Pasqual N, Gallagher M, Aude-Garcia C, Loiodice M, Thuderoz F, Demongeot J, Ceredig R, Marche PN, Jouvin-Marche E. Quantitative and Qualitative Changes in V-J α Rearrangements During Mouse Thymocytes Differentiation: Implication For a Limited T Cell Receptor a Chain Repertoire. J Exp Med. 2002;196:1163–1174. doi: 10.1084/jem.20021074. [DOI] [PMC free article] [PubMed] [Google Scholar]
- Petrie HT, Livak F, Burtrum D, Mazel S. T cell receptor gene recombination patterns and mechanisms: cell death, rescue, and T cell production. J Exp Med. 1995;182:121–127. doi: 10.1084/jem.182.1.121. [DOI] [PMC free article] [PubMed] [Google Scholar]
- Pinheiro J, Bates D, DebRoy S, Sarkar D, R Core Team nlme: Linear and Nonlinear Mixed Effects Models. 2017 (available at https://cran.r-project.org/package=nlme)
- Pinto FL, Lindblad P. A guide for in-house design of template-switch-based 5′ rapid amplification of cDNA ends systems. Anal Biochem. 2010;397:227–232. doi: 10.1016/j.ab.2009.10.022. [DOI] [PubMed] [Google Scholar]
- Quigley MF, Almeida JR, Price DA, Douek DC. Unbiased molecular analysis of T cell receptor expression using template-switch anchored RT-PCR. Curr Protoc Immunol. 2011 doi: 10.1002/0471142735.im1033s94. Chapter 10, Unit10.33. [DOI] [PMC free article] [PubMed] [Google Scholar]
- R Core Team. R: A language and environment for statistical computing. 2016 (available at https://www.r-project.org/)
- Schatz DG, Ji Y. Recombination centres and the orchestration of V(D)J recombination. Nat Rev Immunol. 2011;11:251–263. doi: 10.1038/nri2941. [DOI] [PubMed] [Google Scholar]
- Schatz DG, Swanson PC. V(D)J Recombination: Mechanisms of Initiation. Annu Rev Genet. 2011;45:167–202. doi: 10.1146/annurev-genet-110410-132552. [DOI] [PubMed] [Google Scholar]
- Shih HY, Krangel MS. Distinct contracted conformations of the Tcra/Tcrd locus during Tcra and Tcrd recombination. J Exp Med. 2010;207:1835–1841. doi: 10.1084/jem.20100772. [DOI] [PMC free article] [PubMed] [Google Scholar]
- Shih HY, Krangel MS. Chromatin Architecture, CCCTC-Binding Factor, and V(D)J Recombination: Managing Long-Distance Relationships at Antigen Receptor Loci. J Immunol. 2013;190:4915–4921. doi: 10.4049/jimmunol.1300218. [DOI] [PMC free article] [PubMed] [Google Scholar]
- Shih HY, Verma-Gaur J, Torkamani A, Feeney AJ, Galjart N, Krangel MS. Tcra gene recombination is supported by a Tcra enhancer- and CTCF-dependent chromatin hub. Proc Natl Acad Sci. 2012;109:E3493–E3502. doi: 10.1073/pnas.1214131109. [DOI] [PMC free article] [PubMed] [Google Scholar]
- Shinkai Y. RAG-2-deficient mice lack mature lymphocytes owing to inability to initiate V(D)J rearrangement. Cell. 1992;68:855–867. doi: 10.1016/0092-8674(92)90029-c. [DOI] [PubMed] [Google Scholar]
- Shugay M, Bagaev DV, Turchaninova MA, Bolotin DA, Britanova OV, Putintseva EV, Pogorelyy MV, Nazarov VI, Zvyagin IV, Kirgizova VI, et al. VDJtools: Unifying Post-analysis of T Cell Receptor Repertoires. PLOS Comput Biol. 2015;11:e1004503. doi: 10.1371/journal.pcbi.1004503. [DOI] [PMC free article] [PubMed] [Google Scholar]
- Stadhouders R, Kolovos P, Brouwer R, Zuin J, van den Heuvel A, Kockx C, Palstra RJ, Wendt KS, Grosveld F, van Ijcken W, et al. Multiplexed chromosome conformation capture sequencing for rapid genome-scale high-resolution detection of long-range chromatin interactions. Nat Protoc. 2013;8:509–524. doi: 10.1038/nprot.2013.018. [DOI] [PubMed] [Google Scholar]
- Thompson SD, Pelkonen J, Hurwitz JL. First T cell receptor alpha gene rearrangements during T cell ontogeny skew to the 5′ region of the J alpha locus. J Immunol. 1990;145:2347–2352. [PubMed] [Google Scholar]
- Tilloy F, Treiner E, Park SH, Garcia C, Lemonnier F, de la Salle H, Bendelac A, Bonneville M, Lantz O. An Invariant T Cell Receptor a Chain Defines a Novel TAP-independent Major Histocompatibility Complex Class Ib-restricted a/p T Cell Subpopulation in Mammals. J Exp Med. 1999;189:1907–1921. doi: 10.1084/jem.189.12.1907. [DOI] [PMC free article] [PubMed] [Google Scholar]
- Villey I, Caillol D, Selz F, Ferrier P, de Villartay JP. Defect in Rearrangement of the Most 5′ TCR–Jα Following Targeted Deletion of T Early α (TEA): Implications for TCR α Locus Accessibility. Immunity. 1996;5:331–342. doi: 10.1016/s1074-7613(00)80259-9. [DOI] [PubMed] [Google Scholar]
- Villey I, Quartier P, Selz F, de Villartay JP. Germ-line transcription and methylation status of the TCR-Jα locus in its accessible configuration. Eur J Immunol. 1997;27:1619–1625. doi: 10.1002/eji.1830270705. [DOI] [PubMed] [Google Scholar]
- Weber-Arden J, Wilbert OM, Kabelitz D, Arden B. Vδ Repertoire During Thymic Ontogeny Suggests Three Novel Waves of γδ TCR Expression. J Immunol. 2000;164:1002–1012. doi: 10.4049/jimmunol.164.2.1002. [DOI] [PubMed] [Google Scholar]
- Yu YRA, O’Koren EG, Hotten DF, Kan MJ, Kopin D, Nelson ER, Que L, Gunn MD. A Protocol for the Comprehensive Flow Cytometric Analysis of Immune Cells in Normal and Inflamed Murine Non-Lymphoid Tissues. PLoS One. 2016;11:e0150606. doi: 10.1371/journal.pone.0150606. [DOI] [PMC free article] [PubMed] [Google Scholar]
- Zhang B, Wu J, Jiao Y, Bock C, Dai M, Chen B, Chao N, Zhang W, Zhuang Y. Differential Requirements of TCR Signaling in Homeostatic Maintenance and Function of Dendritic Epidermal T Cells. J Immunol. 2015;195:4282–4291. doi: 10.4049/jimmunol.1501220. [DOI] [PMC free article] [PubMed] [Google Scholar]
- Zhao L, Frock RL, Du Z, Hu J, Chen L, Krangel MS, Alt FW. Orientation-specific RAG activity in chromosomal loop domains contributes to Tcrd V(D)J recombination during T cell development. J Exp Med. 2016;213:1921–1936. doi: 10.1084/jem.20160670. [DOI] [PMC free article] [PubMed] [Google Scholar]
Associated Data
This section collects any data citations, data availability statements, or supplementary materials included in this article.