

Significance
Frogs are the dominant component of semiaquatic vertebrate faunas. How frogs originated and diversified has long attracted the attention of evolutionary biologists. Here, we recover their evolutionary history by extensive sampling of genes and species and present a hypothesis for frog evolution. In contrast to prior conclusions that the major frog clades were established in the Mesozoic, we find that ∼88% of living frogs originated from three principal lineages that arose at the end of the Mesozoic, coincident with the Cretaceous–Paleogene (K–Pg) mass extinction event that decimated nonavian dinosaurs 66 Mya. The K–Pg extinction events played a pivotal role in shaping the current diversity and geographic distribution of modern frogs.
Keywords: amphibia, Anura, nuclear genes, phylogeny, divergence time
Abstract
Frogs (Anura) are one of the most diverse groups of vertebrates and comprise nearly 90% of living amphibian species. Their worldwide distribution and diverse biology make them well-suited for assessing fundamental questions in evolution, ecology, and conservation. However, despite their scientific importance, the evolutionary history and tempo of frog diversification remain poorly understood. By using a molecular dataset of unprecedented size, including 88-kb characters from 95 nuclear genes of 156 frog species, in conjunction with 20 fossil-based calibrations, our analyses result in the most strongly supported phylogeny of all major frog lineages and provide a timescale of frog evolution that suggests much younger divergence times than suggested by earlier studies. Unexpectedly, our divergence-time analyses show that three species-rich clades (Hyloidea, Microhylidae, and Natatanura), which together comprise ∼88% of extant anuran species, simultaneously underwent rapid diversification at the Cretaceous–Paleogene (K–Pg) boundary (KPB). Moreover, anuran families and subfamilies containing arboreal species originated near or after the KPB. These results suggest that the K–Pg mass extinction may have triggered explosive radiations of frogs by creating new ecological opportunities. This phylogeny also reveals relationships such as Microhylidae being sister to all other ranoid frogs and African continental lineages of Natatanura forming a clade that is sister to a clade of Eurasian, Indian, Melanesian, and Malagasy lineages. Biogeographical analyses suggest that the ancestral area of modern frogs was Africa, and their current distribution is largely associated with the breakup of Pangaea and subsequent Gondwanan fragmentation.
A robust, reliable phylogeny is essential to understand the role of macroevolutionary processes in generating biodiversity. However, resolution of evolutionary relationships among certain groups has been persistently difficult because of sparse genotypic and phenotypic data. Frogs (Anura) are one such example; they are one of the most diverse groups of tetrapods, and currently comprise 6,775 described species, 446 genera, and 55 families (1) that are well represented on all continents. They exhibit great adaptive diversity within a highly constrained phenotype estimated to be 200 My old. Evolutionary convergence in body form, life history, and behavioral traits is widespread in frogs, including forms reflecting different microhabitat use by arboreal, aquatic, and fossorial species. These features make frogs a challenging but fascinating model for addressing fundamental questions of morphological, developmental, and biogeographical evolution. However, despite intensive molecular phylogenetic studies (2–7), areas of uncertainty and disagreement persist among clades that are crucial for interpreting broad-scale macroevolutionary patterns. In addition, a general consensus on divergence times of the major anuran lineages is also lacking (7, 8).
The poor resolution for many nodes in anuran phylogeny is likely a result of the small number of molecular markers traditionally used for these analyses. Previous large-scale studies used 6 genes (∼4,700 nt) (4), 5 genes (∼3,800 nt) (5), 12 genes (6) with ∼12,000 nt of GenBank data (but with ∼80% missing data), and whole mitochondrial genomes (∼11,000 nt) (7). In the larger datasets (e.g., ref. 6), most data (>50%) are from the 12S and 16S mitochondrial ribosomal genes. The limited amount of data also causes a wide range of estimates of divergence times for many nodes in the tree. For example, age estimates for the last common ancestor of extant Neobatrachia, often referred to as “modern frogs” and containing 95% of extant anuran species, span ∼100 Mya (5, 7–11). Furthermore, divergences time estimates among the earliest neobatrachian clades, such as the Heleophrynidae, Myobatrachidae, Calyptocephalellidae, Nasikabatrachidae, and Sooglossidae, range from the Late Jurassic to early Cretaceous (∼150–100 Mya) and have wide CIs (5, 7–11). In addition to these species-poor groups of neobatrachians, there are two species-rich clades: Ranoidea (39% of extant anuran species, mostly Old World) and Hyloidea (54%; mostly New World). The estimated ages of each clade range from the Late Jurassic to the end of the Cretaceous, spanning ∼100 My, and relationships of family-level taxa within each clade remain poorly resolved.
In this study, we increased gene sampling by using a recently developed nuclear marker toolkit (12). Our new data include ∼88,000 nt of aligned sequences from 95 nuclear protein-coding genes covering 164 species (156 anuran species and 8 outgroups) from 44 of 55 frog families; to our knowledge, this is the largest source of new data for anuran phylogenetics. In addition, we enlarged this dataset to a total of 301 anuran species by incorporating previously published RAG1 and CXCR4 sequences so that all 55 extant frog families were included. Our goal was to propose a robust hypothesis of phylogenetic relationships and divergence times of the major lineages. Our results resolve previously intractable relationships, generate divergence times with narrow CIs, and provide perspectives on the evolutionary history and historical biogeography of frogs.
Results and Discussion
Data Characteristics.
We assembled a de novo 164-species dataset by using 95 nuclear genes (Table S1) and 88,302 nt from 156 frog species and 8 outgroups; this matrix is 89.6% complete. To increase coverage of anuran families, we added sequences of RAG1 and CXCR4 from GenBank of 145 additional anuran species. This 309-species dataset contains 88,386 nt and is 48.2% complete. The 164-species and 309-species matrices are available from the Dryad Digital Repository (doi:10.5061/dryad.12546).
Table S1.
Descriptive statistics for the 95 loci used in this study
| No. | Gene name | Length, bp | Variable sites | Parsimony informative sites | Relative composition variability | GC of total mean, % | GC of third position mean, % | Substitution model (BIC) |
| 1 | ADNP | 822 | 86 | 507 | 0.0445 | 47.6 | 45.1 | GTR+I+G |
| 2 | ANKRD50 | 996 | 61 | 484 | 0.0261 | 42.1 | 32.2 | GTR+I+G |
| 3 | ARID2 | 873 | 83 | 587 | 0.0342 | 44.0 | 32.8 | HKY+I+G |
| 4 | ARSI | 852 | 44 | 485 | 0.0431 | 44.2 | 41.9 | GTR+I+G |
| 5 | B3GALT1 | 780 | 49 | 332 | 0.0402 | 40.1 | 41.9 | HKY+I+G |
| 6 | BPTF | 546 | 29 | 258 | 0.0980 | 54.4 | 70.1 | SYM+I+G |
| 7 | CAND1 | 1,176 | 50 | 514 | 0.0238 | 42.6 | 35.3 | GTR+I+G |
| 8 | CASR | 750 | 39 | 346 | 0.0515 | 46.5 | 64.0 | GTR+I+G |
| 9 | CELSR3 | 1,281 | 91 | 693 | 0.0682 | 48.5 | 52.6 | GTR+I+G |
| 10 | CHST1 | 693 | 47 | 391 | 0.0417 | 46.5 | 47.6 | GTR+I+G |
| 11 | CILP | 1,158 | 92 | 661 | 0.0325 | 41.6 | 32.7 | GTR+I+G |
| 12 | CPT2 | 792 | 63 | 546 | 0.0588 | 47.5 | 52.6 | SYM+I+G |
| 13 | CXCR4 | 651 | 51 | 379 | 0.0347 | 47.3 | 60.2 | HKY+I+G |
| 14 | DBC1 | 810 | 32 | 383 | 0.0713 | 45.9 | 50.4 | GTR+I+G |
| 15 | DCHS1 | 363 | 41 | 173 | 0.0566 | 49.6 | 46.5 | GTR+I+G |
| 16 | DET1 | 711 | 39 | 329 | 0.0397 | 42.9 | 42.7 | SYM+I+G |
| 17 | DISP1 | 1,062 | 53 | 510 | 0.0344 | 44.0 | 51.1 | GTR+I+G |
| 18 | DISP2 | 981 | 98 | 653 | 0.0494 | 42.8 | 43.3 | GTR+I+G |
| 19 | DMXL1 | 1,002 | 80 | 653 | 0.0316 | 43.1 | 37.4 | GTR+I+G |
| 20 | DNAH3 | 957 | 73 | 487 | 0.0293 | 41.1 | 37.5 | HKY+I+G |
| 21 | DOLK | 741 | 66 | 489 | 0.0504 | 49.0 | 57.8 | GTR+I+G |
| 22 | DOPEY1 | 600 | 49 | 303 | 0.0343 | 42.1 | 49.6 | GTR+I+G |
| 23 | DSEL | 1,305 | 77 | 763 | 0.0211 | 39.2 | 31.3 | GTR+I+G |
| 24 | ENC1 | 1,098 | 53 | 604 | 0.0308 | 45.7 | 44.1 | GTR+I+G |
| 25 | EVPL | 1,014 | 111 | 664 | 0.0404 | 42.0 | 43.1 | GTR+I+G |
| 26 | EXOC8 | 1,143 | 67 | 658 | 0.0463 | 40.9 | 39.3 | GTR+I+G |
| 27 | EXTL3 | 1,269 | 114 | 622 | 0.0386 | 46.8 | 49.9 | GTR+I+G |
| 28 | FAT1 | 1,545 | 137 | 1071 | 0.0235 | 38.7 | 30.0 | GTR+I+G |
| 29 | FAT4 | 756 | 41 | 467 | 0.0290 | 41.7 | 35.6 | HKY+I+G |
| 30 | FEM1B | 996 | 60 | 552 | 0.0553 | 49.2 | 51.4 | GTR+I+G |
| 31 | FICD | 525 | 25 | 271 | 0.0364 | 45.0 | 43.5 | GTR+I+G |
| 32 | FILIP1 | 810 | 61 | 492 | 0.0328 | 37.1 | 31.7 | GTR+I+G |
| 33 | FLRT3 | 1,059 | 148 | 559 | 0.0252 | 42.5 | 42.0 | GTR+I+G |
| 34 | FREM2 | 1,152 | 76 | 688 | 0.0356 | 40.7 | 36.1 | GTR+I+G |
| 35 | FUT9 | 771 | 58 | 357 | 0.0250 | 40.5 | 42.8 | HKY+I+G |
| 36 | FZD4 | 762 | 37 | 329 | 0.0382 | 45.9 | 53.3 | GTR+I+G |
| 37 | GGPS1 | 414 | 19 | 212 | 0.0366 | 36.4 | 31.1 | GTR+I+G |
| 38 | GLCE | 438 | 26 | 220 | 0.0433 | 48.8 | 50.3 | HKY+I+G |
| 39 | GPER | 519 | 30 | 260 | 0.0439 | 44.5 | 58.2 | GTR+I+G |
| 40 | GRIN3A | 651 | 33 | 309 | 0.0337 | 41.1 | 33.4 | GTR+I+G |
| 41 | GRM2 | 687 | 46 | 374 | 0.0831 | 54.6 | 68.3 | GTR+I+G |
| 42 | HYP | 1,299 | 370 | 653 | 0.0414 | 47.4 | 52.2 | SYM+I+G |
| 43 | IRS1 | 1,020 | 48 | 496 | 0.0391 | 50.9 | 48.9 | SYM+I+G |
| 44 | KBTBD2 | 1,125 | 94 | 638 | 0.0204 | 44.4 | 42.8 | GTR+I+G |
| 45 | KCNF1 | 765 | 38 | 374 | 0.0396 | 46.4 | 58.2 | SYM+I+G |
| 46 | KIAA2013 | 537 | 46 | 300 | 0.0820 | 53.8 | 69.3 | HKY+I+G |
| 47 | LCT | 666 | 62 | 450 | 0.0453 | 45.3 | 44.3 | GTR+I+G |
| 48 | LIG4 | 1,056 | 87 | 618 | 0.0262 | 38.8 | 37.3 | GTR+I+G |
| 49 | LINGO1 | 1,137 | 65 | 594 | 0.0335 | 46.0 | 45.6 | HKY+I+G |
| 50 | LINGO2 | 1,332 | 108 | 805 | 0.0266 | 40.4 | 39.9 | GTR+I+G |
| 51 | LPHN2 | 582 | 38 | 252 | 0.0361 | 48.3 | 50.9 | SYM+I+G |
| 52 | LRRC8D | 1,155 | 62 | 554 | 0.0325 | 40.8 | 41.4 | HKY+I+G |
| 53 | LRRN1 | 837 | 48 | 424 | 0.0563 | 51.0 | 56.5 | HKY+I+G |
| 54 | LRRN3 | 1,113 | 100 | 607 | 0.0288 | 37.8 | 38.4 | HKY+I+G |
| 55 | LRRTM4 | 1,155 | 60 | 590 | 0.0248 | 45.1 | 51.5 | GTR+I+G |
| 56 | MB21D2 | 1,029 | 42 | 422 | 0.0260 | 44.0 | 43.8 | HKY+I+G |
| 57 | MED1 | 627 | 45 | 329 | 0.0434 | 46.5 | 40.7 | GTR+I+G |
| 58 | MED13 | 525 | 39 | 277 | 0.0278 | 43.5 | 42.5 | GTR+I+G |
| 59 | MGAT4C | 792 | 51 | 400 | 0.0297 | 36.6 | 33.9 | HKY+I+G |
| 60 | MIOS | 972 | 53 | 464 | 0.0865 | 53.0 | 63.2 | GTR+I+G |
| 61 | MSH6 | 1,350 | 101 | 821 | 0.0426 | 44.2 | 44.1 | GTR+I+G |
| 62 | MYCBP2 | 1,068 | 80 | 551 | 0.0216 | 42.1 | 34.8 | GTR+I+G |
| 63 | NHS | 1,044 | 88 | 639 | 0.0248 | 42.1 | 32.8 | HKY+I+G |
| 64 | NTN1 | 585 | 22 | 238 | 0.0904 | 52.2 | 66.8 | HKY+I+G |
| 65 | P2RY1 | 744 | 41 | 342 | 0.0311 | 39.7 | 48.9 | GTR+I+G |
| 66 | PANX2 | 735 | 49 | 362 | 0.0429 | 37.8 | 37.2 | GTR+I+G |
| 67 | PCDH1 | 1,479 | 117 | 774 | 0.0277 | 45.5 | 42.7 | GTR+I+G |
| 68 | PCDH10 | 849 | 53 | 487 | 0.0582 | 60.3 | 82.8 | GTR+I+G |
| 69 | PCLO | 906 | 43 | 480 | 0.0256 | 39.1 | 24.4 | GTR+I+G |
| 70 | PDP1 | 1,071 | 60 | 491 | 0.0391 | 46.1 | 44.2 | GTR+I+G |
| 71 | PIK3CG | 978 | 90 | 572 | 0.0258 | 38.6 | 35.6 | GTR+I+G |
| 72 | PPL | 1,389 | 141 | 998 | 0.0418 | 44.9 | 51.3 | GTR+I+G |
| 73 | RAG1 | 1425 | 84 | 763 | 0.0331 | 44.3 | 43.9 | HKY+I+G |
| 74 | RAG2 | 906 | 62 | 653 | 0.0363 | 43.0 | 44.6 | GTR+I+G |
| 75 | RERE | 456 | 28 | 216 | 0.0336 | 52.0 | 43.7 | SYM+I+G |
| 76 | REV3L | 675 | 52 | 512 | 0.0327 | 39.9 | 28.2 | GTR+I+G |
| 77 | ROR2 | 972 | 78 | 489 | 0.0274 | 43.5 | 40.3 | GTR+I+G |
| 78 | RP2 | 510 | 41 | 272 | 0.0393 | 45.6 | 51.7 | HKY+I+G |
| 79 | SACS | 1,146 | 56 | 579 | 0.0252 | 40.2 | 34.3 | GTR+I+G |
| 80 | SALL1 | 1,497 | 96 | 862 | 0.0223 | 43.1 | 35.0 | GTR+I+G |
| 81 | SETBP1 | 795 | 64 | 443 | 0.0353 | 43.7 | 42.3 | GTR+I+G |
| 82 | SH3BP4 | 1,158 | 79 | 717 | 0.0403 | 44.9 | 43.8 | GTR+I+G |
| 83 | SLITRK1 | 1,185 | 103 | 636 | 0.0714 | 46.9 | 55.4 | GTR+I+G |
| 84 | SOCS5 | 999 | 55 | 504 | 0.0460 | 49.0 | 47.2 | GTR+I+G |
| 85 | SPEN | 948 | 80 | 577 | 0.0503 | 41.4 | 39.8 | GTR+I+G |
| 86 | STON2 | 921 | 74 | 602 | 0.0506 | 47.6 | 55.1 | SYM+I+G |
| 87 | SVEP1 | 840 | 81 | 566 | 0.0294 | 41.3 | 27.2 | HKY+I+G |
| 88 | TTN | 999 | 250 | 575 | 0.0232 | 41.1 | 28.0 | GTR+G |
| 89 | VCPIP1 | 1,125 | 77 | 578 | 0.0592 | 46.8 | 48.7 | GTR+I+G |
| 90 | VPS18 | 975 | 81 | 586 | 0.0651 | 42.8 | 49.4 | GTR+I+G |
| 91 | WFIKKN2 | 1,155 | 82 | 699 | 0.0617 | 47.0 | 53.6 | GTR+I+G |
| 92 | ZBED4 | 1077 | 92 | 518 | 0.0352 | 40.2 | 37.3 | GTR+I+G |
| 93 | ZEB1 | 819 | 55 | 484 | 0.0270 | 42.5 | 33.4 | HKY+I+G |
| 94 | ZFPM2 | 1,251 | 119 | 652 | 0.0304 | 45.2 | 41.4 | GTR+I+G |
| 95 | ZHX2 | 993 | 78 | 649 | 0.0422 | 44.5 | 45.2 | GTR+I+G |
Higher-Level Phylogenetic Relationships of Frogs.
Maximum-likelihood (ML) and Bayesian analyses of concatenated genes in the 164-species dataset produced identical trees except for two nodes with low support (Figs. S1 and S2). The ASTRAL species tree differed from the ML tree at eight poorly supported nodes (Fig. S3). Overall support is high: 94% of 155 nodes within frogs have a bootstrap value (BS) ≥70% (Fig. S1), and 97% have Bayesian posterior probabilities (BPPs) ≥0.95 (Fig. S2). The ASTRAL species-tree method produced BSs ≥70% at 84% of the nodes (Fig. S3). Although ML analysis of the 309-species dataset has weaker support (78% of nodes have BSs ≥70%; Fig. S4), the basic topology of the ML tree is similar. Therefore, we used the ML tree as our primary hypothesis (Fig. 1A) for estimating the chronogram.
Fig. 1.

Time-calibrated phylogenetic tree of frogs and the pattern of net diversification rate across time. (A) Evolutionary chronogram based on 95% nuclear genes and 20 fossil age constraints. Gray bars represent the 95% credibility interval of divergence time estimates. Divergence time estimates and corresponding 95% credibility intervals for all nodes are provided in Table S2. Note that the initial diversification of the three major frog clades: Hyloidea (blue), Microhylidae (purple), and Natatanura (green) took place simultaneously near the KPB (dashed red line). (B) Rate-through-time plot of extant frogs indicates an increase in diversification rate at the end of the Cretaceous.
Archaeobatrachian relationships are identical to those of most recent studies (refs. 2, 5, 6, 13; but see refs. 4, 10), including an analysis of mitogenomes of 90 anuran species (7). Relationships among the early branches of Neobatrachia are identical to the mitogenomic phylogeny (7). We corroborate the placement of Heleophrynidae, which is from extreme southern Africa, as the sister taxon to all other neobatrachian frogs (Fig. 1A), as found by some authors (4–7, 9), but not by others (10, 11). We find that Sooglossidae (known only from the Seychelles Islands) is the sister taxon of Ranoidea (BS = 100%, BPP = 1.0; Figs. S1–S3) in the 164-species analyses, and that Sooglossidae + Nasikabatrachidae (known only from the Western Ghats of peninsular India) form the Sooglossoidea, which is the sister group of Ranoidea (BS = 100%; Fig. S4) in the 309-species analyses. Sooglossoidea is placed as the sister taxon of all other neobatrachians (11), all neobatrachian frogs to the exclusion of Heleophrynidae (6), Hyloidea + Myobatrachidae + Calyptocephalellidae (4), and Ranoidea (3, 5, 7), but no previous studies recovered the placement of Sooglossoidea with strong statistical support, including a mitogenome phylogeny (7).
Taxa within the superfamily Ranoidea have been consistently grouped into three clades (4–7): Microhylidae, Afrobatrachia (i.e., epifamily Brevicipitoidae, which includes Brevicipitidae, Hemisotidae, Hyperoliidae, and Arthroleptidae), and Natatanura (Fig. 1A). We found that Microhylidae is the sister group of Afrobatrachia + Natatanura (BS = 72%, PP = 1.0; Figs. S1 and S2); in contrast, many previous studies placed Microhylidae as the sister group of Afrobatrachia (4–6, 14) or of Natatanura (7). Relationships within the Afrobatrachia mirror those found in other studies (5–7, 14).
Natatanura is a large clade of extant anurans (24% of species) and mainly found in the Old World. Our ML and Bayesian topologies of Natatanura are identical. All nodes in the Bayesian tree have a BPP of 1.0, and only three nodes in the ML tree have BSs <90%. The 309-species topology is identical, but with low support among the deeper branches, likely because of missing data. Notably, we found that endemic African continental lineages (Conrauidae, Odontobatrachidae, Petropedetidae, Phrynobatrachidae, Ptychadenidae, Pyxicephalidae) form a clade that is the sister group to the clade of the remaining North American, Eurasian, Melanesian, and Malagasy lineages (Ceratobatrachidae, Dicroglossidae, Mantellidae, Rhacophoridae, and Ranidae; Fig. 1A and Figs. S1–S4). This African clade has low bootstrap support (56%) but high Bayesian support (1.0). The clade of the remaining non-African families is strongly supported (BS = 100%), and the internal branches are strongly supported (BS = 100%, BPP = 1.0), although they are short. In other studies, this group of African lineages is not monophyletic (6, 7, 10, 14, 15). The phylogenetic position of the continental African lineages has important biogeographic significance (as detailed later).
Relationships among the subfamilies of Microhylidae (one of the largest anuran families, including 8.8% of all species), which have significant radiations on most continents and the large islands Madagascar and New Guinea, have proven difficult to resolve (4, 6, 7, 15–19). In contrast, our Bayesian tree has strong support; all 10 of the deepest nodes have a BPP of 1.0 (Fig. S2). The ML topology is identical, but 3 of 10 nodes have a BS <90% (Fig. S1). ML analysis of our 309-species dataset (Fig. S4) recovered the same topology, but support is weaker. Nonetheless, our tree is more strongly supported than others except for a phylogenomic analysis (19) of 66 anchored loci for 48 taxa and 7 Sanger-sequenced loci for 142 taxa.
Significantly, our study resolves relationships among one of the most diverse clades in the anuran phylogeny: Hyloidea, which contains 54% of extant anuran species. ML and Bayesian analyses strongly support 53 of 55 of nodes in Hyloidea (BS > 80% and PP = 1.0; Figs. S1 and S2). This is particularly unexpected because even the most species- and character-rich studies of hyloids (5–7) have recovered poorly resolved topologies. Our expanded 309-species topology (Fig. S4) is similar to our primary tree, even though many nodes have lower support, which is consistent with the higher degree of missing data for this dataset of more species.
Two arrangements within hyloids are noteworthy. The deepest divergences in Hyloidea are among southern South American taxa: Rhinodermatidae in the temperate beech forests of Chile, and Alsodidae and Batrachylidae in Patagonia (Figs. S1–S4). Similar relationships were previously reported (5, 20), albeit with weak support and a smaller sample of species. These relationships support a southern South American origin of Hyloidea. Moreover, most previous studies (4, 6, 7, 21) supported Terrarana, a large New World tropical clade (15% of extant anuran species), rather than southern South America groups, as the sister group of all other hyloids. This difference in the placement of Terrarana may result from long-branch attraction of mtDNA sequences, because Terrarana species apparently have higher rates of mtDNA evolution than other hyloid lineages (22).
In summary, our analyses corroborate many of the deeper neobatrachian nodes inferred by other studies, but with greater support (all BS values = 100%). Furthermore, we find strong support for many shallower nodes that are weakly supported in other studies; only 4 of 155 nodes in our Bayesian tree have a posterior probability <1.0 and only 9 of 155 nodes have bootstrap support <75%. Relationships among the deepest branches in the Hyloidea, Microhylidae, and Natatanura, for which previous studies have conflicting results, are now strongly supported in Hyloidea and Natatanura, and most nodes are well-supported in Microhylidae. Some clades that were not well-supported in the mitogenomic phylogeny (7) are rejected in this study. Our findings include the position of southern South American taxa as the earliest branches of hyloids, and the identification of a clade of endemic African taxa as the sister group of all other Natatanura.
A New Timescale for Extinction and Diversification.
Our extensive sample of nuclear loci produced not only a strongly supported phylogeny for frogs but also younger divergence time estimates with smaller CIs than previous studies. The estimated divergence times in the 164-species and the 309-species data sets are similar (Figs. S5 and S6); the average time deviation among comparable nodes between the two analyses is ∼5%. Following a thorough literature review, we selected 20 fossil calibration points, of which 13 are within crown Anura (Fig. S7). Jackknife removal of each fossil resulted in highly congruent sets of date estimates. The overall average time differences were less than 1% except for the two outlier fossils (the salamander Chunerpeton and the salientian Triadobatrachus), and even the two outliers only led to overall average time differences of 3–5.4% (Fig. S8).
For this discussion, we focus on the 164-species tree (Fig. 1A). Overall, our divergence times are notably younger than those found by most other studies (5, 10, 23, 24) (Fig. 1A and Table S2), and especially much younger than those in the mitogenome phylogeny (7). For example, we estimate the last common ancestor of crown-group Anura to be during the Upper Triassic at 210.0 Mya (95% CI, 199.1–220.4 Mya), and the age of crown Neobatrachia in the Lower Cretaceous at 142.1 Mya (95% CI, 132.8–149.8 Mya). In contrast, many other estimates place the age of crown Anura between the Permian and Middle Triassic and the origin of Neobatrachia between Upper Triassic and Upper Jurassic (Fig. S9).
Table S2.
Detailed node information of the concatenated analyses and divergence analyses
| Node | BS | PP | Age, Mya | 95% CI |
| 1 | N/A | 1.0 | 433.4 | 416.3–455.2 |
| 2 | N/A | 1.0 | 422 | 410.8–427.5 |
| 3 | 100 | 1.0 | 348.4 | 343.0–351.5 |
| 4 | 100 | 1.0 | 319 | 316.9–322.7 |
| 5 | 100 | 1.0 | 252.2 | 246.9–259.7 |
| 6 | 100 | 1.0 | 297.9 | 287.7–309.1 |
| 7 | 100 | 1.0 | 271.7 | 266.8–274.7 |
| 8 | 100 | 1.0 | 153 | 130.5–166.3 |
| 9 | 100 | 1.0 | 210 | 199.1–220.4 |
| 10 | 100 | 1.0 | 193.8 | 178.6–207.0 |
| 11 | 100 | 1.0 | 194.1 | 183.2–204.1 |
| 12 | 100 | 1.0 | 138.5 | 122.9–158.6 |
| 13 | 100 | 1.0 | 102.2 | 74.8–125.5 |
| 14 | 100 | 1.0 | 42.8 | 33.0–54.7 |
| 15 | 100 | 1.0 | 10 | 7.4–13.3 |
| 16 | 100 | 1.0 | 182.5 | 172.0–192.7 |
| 17 | 100 | 1.0 | 159.4 | 146.7–171.4 |
| 18 | 100 | 1.0 | 117.6 | 104.2–130.9 |
| 19 | 100 | 1.0 | 11.6 | 8.4–15.5 |
| 20 | 100 | 1.0 | 104.1 | 91.7–117.7 |
| 21 | 100 | 1.0 | 57.9 | 45.3–69.9 |
| 22 | 100 | 1.0 | 45.3 | 34.2–57.9 |
| 23 | 100 | 1.0 | 172.6 | 162.5–182.6 |
| 24 | 100 | 1.0 | 128 | 115.6–141.5 |
| 25 | 100 | 1.0 | 41.9 | 32.1–54.1 |
| 26 | 100 | 1.0 | 9.3 | 6.8–12.3 |
| 27 | 100 | 1.0 | 112.3 | 99.9–125.6 |
| 28 | 100 | 1.0 | 74.4 | 66.2–86.2 |
| 29 | 100 | 1.0 | 50.6 | 44.3–57.9 |
| 30 | 100 | 1.0 | 24.8 | 20.5–29.8 |
| 31 | 100 | 1.0 | 17 | 13.1–21.6 |
| 32 | 100 | 1.0 | 32.4 | 27.1–38.0 |
| 33 | 100 | 1.0 | 18.7 | 15.2–22.9 |
| 34 | 100 | 1.0 | 15.5 | 12.1–19.6 |
| 35 | 100 | 1.0 | 142.1 | 132.8–149.8 |
| 36 | 100 | 1.0 | 130 | 121.1–137.8 |
| 37 | 100 | 1.0 | 119.9 | 110.7–129.1 |
| 38 | 100 | 1.0 | 99.5 | 88.6–111.3 |
| 39 | 100 | 1.0 | 72.6 | 63.4–84.8 |
| 40 | 100 | 1.0 | 65.7 | 56.2–77.6 |
| 41 | 100 | 1.0 | 72.6 | 67.4–78.5 |
| 42 | 100 | 1.0 | 61.5 | 54.3–68.3 |
| 43 | 100 | 1.0 | 68 | 63.2–73.4 |
| 44 | 100 | 1.0 | 61.8 | 56.5–67.9 |
| 45 | 100 | 1.0 | 20.1 | 14.7–27.0 |
| 46 | 100 | 1.0 | 26.7 | 21.2–33.5 |
| 47 | 100 | 1.0 | 13.4 | 9.8–17.7 |
| 48 | 100 | 1.0 | 66.4 | 61.8–71.7 |
| 49 | 100 | 1.0 | 4.9 | 3.5–6.7 |
| 50 | 100 | 1.0 | 64.8 | 60.3–70.0 |
| 51 | 98 | 1.0 | 63.9 | 59.5–69.1 |
| 52 | 100 | 1.0 | 18.2 | 13.1–24.6 |
| 53 | 94 | 1.0 | 62.6 | 58.2–67.9 |
| 54 | 100 | 1.0 | 43.9 | 35.5–51.9 |
| 55 | 100 | 1.0 | 19.2 | 14.2–25.2 |
| 56 | 100 | 1.0 | 58.9 | 54.4–64.2 |
| 57 | 100 | 1.0 | 47.5 | 42.0–53.4 |
| 58 | 100 | 1.0 | 24.5 | 20.0–29.7 |
| 59 | 100 | 1.0 | 16.7 | 12.8–21.3 |
| 60 | 100 | 1.0 | 49.5 | 44.9–54.4 |
| 61 | 100 | 1.0 | 32.3 | 26.6–38.3 |
| 62 | 100 | 1.0 | 25.2 | 19.6–31.0 |
| 63 | 100 | 1.0 | 46.2 | 41.6–50.9 |
| 64 | 99 | 1.0 | 43.9 | 39.4–48.6 |
| 65 | 100 | 1.0 | 41.1 | 36.8–45.8 |
| 66 | 100 | 1.0 | 24.7 | 20.0–29.9 |
| 67 | 100 | 1.0 | 35.3 | 30.6–40.2 |
| 68 | 100 | 1.0 | 63.6 | 59.2–68.9 |
| 69 | 100 | 1.0 | 34.6 | 28.7–40.8 |
| 70 | 100 | 1.0 | 28.9 | 23.1–35.4 |
| 71 | 67 | 1.0 | 62.1 | 57.6–67.4 |
| 72 | 100 | 1.0 | 48.5 | 43.2–53.7 |
| 73 | 100 | 1.0 | 45.1 | 40.0–50.4 |
| 74 | 100 | 1.0 | 30.2 | 24.5–36.0 |
| 75 | 100 | 1.0 | 43.2 | 38.2–48.4 |
| 76 | 91 | 0.84 | 39.2 | 34.0–44.6 |
| 77 | 81 | 0.84 | 40.7 | 35.6–45.9 |
| 78 | 81 | 1.0 | 59.9 | 55.5–64.9 |
| 79 | 36 | 1.0 | 58.1 | 53.8–63.1 |
| 80 | 100 | 1.0 | 32 | 24.8–40.0 |
| 81 | 100 | 1.0 | 52.8 | 48.2–58.0 |
| 82 | 100 | 1.0 | 36.2 | 29.6–42.5 |
| 83 | 100 | 1.0 | 39 | 34.0–44.4 |
| 84 | 100 | 1.0 | 25.8 | 21.1–30.8 |
| 85 | 100 | 1.0 | 6.2 | 4.5–8.4 |
| 86 | 100 | 1.0 | 48 | 43.1–53.2 |
| 87 | 100 | 1.0 | 35.4 | 30.8–40.5 |
| 88 | 100 | 1.0 | 25.4 | 22.4–28.9 |
| 89 | 100 | 1.0 | 21 | 18.5–24.0 |
| 90 | 100 | 1.0 | 18 | 15.4–20.9 |
| 91 | 100 | 1.0 | 17.1 | 14.6–20.0 |
| 92 | 87 | 0.99 | 16.4 | 13.9–19.4 |
| 93 | 100 | 1.0 | 19.4 | 16.9–22.5 |
| 94 | 100 | 1.0 | 16.5 | 14.0–19.4 |
| 95 | 100 | 1.0 | 12.3 | 9.7–15.2 |
| 96 | 100 | 1.0 | 122.9 | 114.1–131.0 |
| 97 | 100 | 1.0 | 100.9 | 92.8–108.6 |
| 98 | 100 | 1.0 | 67.1 | 61.0–72.9 |
| 99 | 39 | 1.0 | 63.6 | 57.7–69.2 |
| 100 | 100 | 1.0 | 59.6 | 53.9–65.3 |
| 101 | 100 | 1.0 | 48.1 | 42.1–53.8 |
| 102 | 100 | 1.0 | 27.9 | 23.0–32.8 |
| 103 | 100 | 1.0 | 21 | 16.6–25.9 |
| 104 | 40 | 1.0 | 62 | 56.1–67.4 |
| 105 | 100 | 1.0 | 56.8 | 50.8–62.6 |
| 106 | 100 | 1.0 | 32.3 | 25.2–39.9 |
| 107 | 57 | NR | 30.3 | 23.3–38.1 |
| 108 | 100 | 1.0 | 47.7 | 41.3–54.3 |
| 109 | 100 | 1.0 | 7.2 | 5.2–9.8 |
| 110 | 35 | 1.0 | 60.9 | 55.1–66.2 |
| 111 | 100 | 1.0 | 54.8 | 49.2–60.4 |
| 112 | 99 | 1.0 | 52.7 | 47.2–58.2 |
| 113 | 100 | 1.0 | 45.9 | 40.1–51.5 |
| 114 | 100 | 1.0 | 15 | 11.1–20.1 |
| 115 | 100 | 1.0 | 20.4 | 17.6–23.5 |
| 116 | 100 | 1.0 | 16.9 | 14.1–20.0 |
| 117 | 42 | NR | 19.7 | 16.9–22.8 |
| 118 | 100 | 1.0 | 16.8 | 14.3–19.8 |
| 119 | 100 | 1.0 | 14.2 | 11.9–16.9 |
| 120 | 100 | 1.0 | 12.5 | 10.1–15.2 |
| 121 | 72 | 1.0 | 96.6 | 88.6–104.1 |
| 122 | 100 | 1.0 | 82 | 73.7–89.7 |
| 123 | 100 | 1.0 | 53.8 | 45.2–62.8 |
| 124 | 100 | 1.0 | 34.3 | 26.7–42.7 |
| 125 | 100 | 1.0 | 63.9 | 56.7–70.9 |
| 126 | 100 | 1.0 | 39.9 | 31.9–48.0 |
| 127 | 100 | 1.0 | 48.9 | 43.3–55.1 |
| 128 | 92 | 1.0 | 46.2 | 40.7–51.9 |
| 129 | 94 | 1.0 | 42.5 | 36.9–48.3 |
| 130 | 100 | 1.0 | 36.9 | 31.4–42.6 |
| 131 | 100 | 1.0 | 34.8 | 29.2–40.4 |
| 132 | 100 | 1.0 | 20.9 | 16.1–26.5 |
| 133 | 100 | 1.0 | 64.5 | 59.1–69.8 |
| 134 | 56 | 1.0 | 63.1 | 57.7–68.4 |
| 135 | 64 | 1.0 | 61 | 55.5–66.2 |
| 136 | 100 | 1.0 | 54.5 | 48.3–60.1 |
| 137 | 97 | 1.0 | 61.3 | 55.8–66.5 |
| 138 | 80 | 1.0 | 58.3 | 52.7–63.9 |
| 139 | 100 | 1.0 | 47 | 40.1–53.6 |
| 140 | 100 | 1.0 | 7.2 | 5.3–9.6 |
| 141 | 100 | 1.0 | 62.7 | 57.3–67.8 |
| 142 | 100 | 1.0 | 39.4 | 31.2–47.1 |
| 143 | 100 | 1.0 | 61.2 | 56.0–66.4 |
| 144 | 100 | 1.0 | 45.9 | 39.6–52.2 |
| 145 | 91 | 1.0 | 42.8 | 36.8–49.0 |
| 146 | 100 | 1.0 | 26.6 | 21.2–32.8 |
| 147 | 100 | 1.0 | 59.1 | 54.1–64.3 |
| 148 | 100 | 1.0 | 53.7 | 48.6–59.0 |
| 149 | 100 | 1.0 | 42.7 | 35.9–48.9 |
| 150 | 100 | 1.0 | 42.5 | 37.3–48.1 |
| 151 | 100 | 1.0 | 26.2 | 22.0–31.1 |
| 152 | 100 | 1.0 | 22.5 | 18.1–27.2 |
| 153 | 100 | 1.0 | 30.6 | 27.1–34.3 |
| 154 | 100 | 1.0 | 26.9 | 24.0–30.2 |
| 155 | 100 | 1.0 | 18.8 | 14.8–22.9 |
| 156 | 100 | 1.0 | 24.4 | 21.6–27.5 |
| 157 | 100 | 1.0 | 17.7 | 14.9–20.7 |
| 158 | 100 | 1.0 | 14.4 | 11.5–17.4 |
| 159 | 100 | 1.0 | 22.2 | 19.5–25.3 |
| 160 | 100 | 1.0 | 16.4 | 14.2–18.9 |
| 161 | 100 | 1.0 | 11.4 | 8.7–14.1 |
| 162 | 100 | 1.0 | 12.6 | 10.6–14.7 |
| 163 | 100 | 1.0 | 6.5 | 5.1–8.3 |
A striking pattern is the synchronous origin of three species-rich neobatrachian clades—Hyloidea, Microhylidae, and Natatanura—at the Cretaceous–Paleogene (K–Pg) boundary (KPB;Fig. 1A, dashed red line). The diversification synchronicity of the three frog clades still existed when all calibration constraints in frogs were excluded (Fig. S10), suggesting that this pattern is unlikely the result of the choice of calibration points. The K–Pg boundary (KPB), dated precisely at 66 Mya (25), marks one of Earth's great extinctions, largely attributed to the impact of the Chicxulub bolide. However, other factors such as climate warming and the Indian Deccan volcanism, possibly related to the bolide impact, likely contributed to this extinction event (26). Although a near-KPB origin was separately reported for Hyloidea (5, 8, 10, 20, 27) and Microhylidae (10, 16) (Fig. S9), our study found that these three major clades originated at the same time, very near the KPB. The contemporaneous origin of the three large clades is highlighted in our results by the narrow 95% CIs for each and their overlap with the KPB. Nine of the 10 deepest nodes of Hyloidea have relatively narrow CIs that overlap the KPB (9.6–14.0 My; Fig. 1A and Table S2). Similarly, within Microhylidae, the CIs of the four deepest nodes encompass the KPB, and the CIs are similarly narrow (11.1–11.9 My). Finally, in Natatanura, the CIs of the six deepest nodes all overlap the KPB, also with similarly narrow CIs (10.4–10.7 My). The use of internal calibration points for these clades is unlikely to be driving this pattern because there was only one internal calibration point (within the Natatanura) used within these three clades.
There are several reasons why our study may have produced younger divergence times compared with previous studies. First, we included diverse outgroups, including lungfish, coelacanth, salamanders, caecilians, and amniotes. Second, we used a new set of calibration points rather than uncritically recycling calibration points from other studies; these calibration points have been carefully reexamined based on the fossil record. The choice of calibration points has significant impact on divergence time estimation for frogs and may be an important reason that older divergence times were obtained in previous studies (27). Third, our phylogenetic estimate is based on a much larger dataset (88 kb; 62% of sites are variable) derived solely from 95 nuclear loci (rather than primarily from mitochondrial loci) that exceeds other studies by at least sevenfold. We attribute the greater precision (i.e., smaller CIs) to the large amount of information within our dataset. A similar increase in precision was found for plethodontid salamanders by using the same nuclear marker toolkit (28).
Rate-through-time analysis indicates that a surge in net diversification rates of frogs occurred immediately following the KPB (Fig. 1B), which suggests a clear impact of the KPB extinction on frog diversification. The rapidity of the diversification is reflected in the short branches of the deepest nodes in each clade. In Hyloidea, all but one branch connecting the 10 deepest nodes are <4.6 My in duration. In Microhylidae, the branches connecting the four deepest nodes are <4.0 My long. In Natatanura, the branches connecting the six deepest nodes are <2.1 My. Even though these branches are short, they are strongly supported. Another line of evidence demonstrates three mass extinctions preceding explosive speciation. The branches subtending the Hyloidea, Natatanura, and Microhylidae are long: 47.3, 32.1, and 33.8 My, respectively (Fig. 1A and Table S2). The lack of other extant lineages originating from these three stem lineages corroborates our suggestion that an extinction event simultaneously decimated these lineages near the KPB.
Even though the fossil record indicates mass extinction at the KPB for several taxa, including birds, squamates, and mammals, and subsequent radiation post-KPB (29–31), molecular data often indicate that many clades had diversified, at least in the sense of lineage splitting, before the KPB event (32–36). Unlike nonavian dinosaurs, whose demise is well documented in the rocks, the fossil record of frogs is so far largely uninformative about survival/extinction across the KPB (37–40). In the present study, the three parallel combinations of precise node ages overlapping the KPB, preceded by a long branch and followed by very short but strongly supported branches, indicate three extinctions followed by rapid divergence. These three radiations, which are coincident with the late Cretaceous extinction, account for 88% of extant frog species. This molecular phylogenetic perspective strongly suggests that frogs experienced a major extinction at the KPB.
Historical Biogeography of Frogs.
We performed a biogeographic analysis on the 309-species data set using BioGeoBEARS (41). The DEC+J model performs significantly better than the DEC model (Akaike information criterion; Table S3), indicating the importance of the J parameter, which models long-distance or “jump” dispersal. Our interpretation is that dispersal into a new area is accompanied by near-instantaneous speciation. The practical effect of adding the J parameter to the model is that ancestral ranges often comprise one area rather than several.
Table S3.
Models and parameters of ancestral range estimation of frogs
| Model | LnL | Parameters | d | e | j | AIC | w |
| DEC | −257.30 | 2 | 0.13 | 0.02 | — | 518.6 | 5.0 × 10⁻²² |
| DEC+J | −207.26 | 3 | 0.02 | 1.0 × 10⁻¹² | 0.04 | 420.5 | 1 |
Models include dispersal-extinction cladogenesis (DEC), and the same model allowing for founder event speciation (+J). AIC, Akaike Information Criterion; d, rate of range expansion by adding an area; e, rate of range reduction through extirpation in an area; j, relative per-event weight of jump dispersal at cladogenesis; ln L, log-likelihood; w, Akaike weights. The best-fit model is the DEC+J model.
The most recent common ancestor (MRCA) of extant frogs was distributed in Eurasia + North America + Australia or North America + Australia (Fig. 2 and Fig. S11), a Pangaean origin. In contrast, neobatrachians (i.e., modern frogs) originated in Gondwanaland, most likely in Africa (relative probability, 93.6%; Fig. 2). The major neobatrachian lineages are also Gondwanan in origin: Hyloidea in South America and Ranoidea, Afrobatrachia, and Natatanura in Africa (relative probability, >90%; Fig. 2).
Fig. 2.

Ancestral-area estimates for 69 terminal taxa (families, subfamilies, and genera) of extant frogs using the DEC+J model in BioGeoBEARS. Circles on nodes represent the set of possible ancestral areas, and the color is associated with the area legends. The probabilities are given next to circles for the most probable ancestral area. Circles without values indicate that the probability of the ancestral area is >99%. Three important landmass breakup events are indicated: (A) the break-up of Pangea with division into Laurasia and Gondwana in the Middle Jurassic coincident with the origin of neobatrachian frogs; (B) the separation of Africa and South America in the Early Cretaceous coincident with the divergence of Ranoidea and Hyloidea as well as between the African and New World pipids; and (C) the separation of the Seychelles and India in the Late Cretaceous coincident with the divergence between the Sooglossidae and Nasikabatrachidae. Anuran taxa that contain at least some arboreal species are indicated in green and a tree icon (we do not imply that the last common ancestor of each of these families was arboreal). Note that all clades containing arboreal frogs originated after the KPB.
Breakup of land masses may be associated with three divergence events in the evolution of frogs. The first of these was the split of neobatrachians from ancestral groups (Fig. 2A), dated at 172–181 Mya, which agrees with the breakup of Pangaea into Laurasia and Gondwana in the Early Jurassic (∼180 Mya) (42). This breakup event, which isolated the MRCA of Neobatrachia in Gondwana, is associated with the initial diversification of the clade. The second breakup event caused the split between the two major lineages of neobatrachians, Procoela (Hyloidea and Myobatrachoidea, mostly South American) and Diplasiocoela (Ranoidea + Sooglossoidea, mostly African), as well as the split between the African and South American pipids (Fig. 2B). Spreading of the South Atlantic Ocean sea floor started in the Early Cretaceous (135 Mya), but the final physical separation between Africa and South America took place approximately 105 Mya (42). Our estimates for timing of these divergences, 125–130 Mya and ∼120 Mya, respectively, are highly congruent with this rifting process. The third breakup event took place when the Sooglossidae (Seychelles) and the Nasikabatrachidae (India) diverged (Fig. 2C). The Seychelles/India land mass continued to exist until 66 Mya, when new rifting severed the Seychelles from India (43). We estimate Sooglossidae split from Nasikabatrachidae at ∼66 Mya, which is considerably younger than the previous estimates (77–130 Mya) (10, 11, 23), in congruence with the geological event.
The MRCA of Hyloidea and of Myobatrachidae + Calyptocephalellidae occurred in South America (Fig. 2). The divergence between Myobatrachidae (Australia) and Calyptocephalellidae (South America) and the split between Phyllomedusinae (South America) and Pelodryadinae (Australia and New Guinea) took place ∼100 Mya and ∼50 Mya, respectively (Fig. 2). During this period, South America and Australia were distantly separated but connected intermittently via Antarctica (42). From the late Cretaceous to the early Tertiary, the Earth experienced a period of global warming (44). Climate data from plant fossils, sediments, and geochemical indicators show that the mean annual temperature of the Antarctic Peninsula region was 10–20 °C from 100 to 50 Mya (45), which is sufficiently warm to allow dispersal of frogs through this region. Thus, the origin of the Australian myobatrachids and pelodryadine hylids is most likely explained by dispersal from South America to Australia through Antarctica, and later extinction in Antarctica because of the formation of ice sheets. The role of Antarctica in dispersal of frogs among Gondwanan land masses has received little attention (but see ref. 46), but our time-calibrated phylogeny predicts that paleontological research in the Cretaceous and early Cenozoic of Antarctica could shed light on the early evolution and dispersal, especially of hyloids.
The nearly worldwide distribution of Microhylidae presents a longstanding and challenging biogeographic puzzle. Vicariant origin and long-distance oceanic dispersal have been proposed to explain the current distribution of this family (10, 15, 16, 18, 23). Which scenario dominates interpretation depends largely on the time and location of origin for the Microhylidae. Our analyses place the initial divergence of the Microhylidae at ∼66 Mya, with a relative probability of 79.5% for an African origin (Fig. 2). By this time, Gondwana was already highly fragmented and Africa was separated from South America and Madagascar by ocean. Accordingly, overseas dispersal of the major microhylid lineages on Gondwanan landmasses is required.
The origin and diversification of the second large clade, Natatanura, is controversial. Two hypotheses have been proposed. The Out-of-Africa hypothesis (47), argues that the origin of the Natatanura lies in Africa, with subsequent dispersal to other continents. The Out-of-India hypothesis (48) postulates that the ancestor of Natatanura originated on the Indian plate and was confined there until the plate collided with Asia approximately 55 Mya. We find that Natatanura originated in Africa (relative probability, 92.5%; Fig. 2). Considering that Natatanura is the sister group of Afrobatrachia (apparently of African origin) and the basal split within the Natatanura phylogeny separates all African continental lineages from other Asian, Indian, and Madagascar lineages (Fig. 2), an African origin seems more likely. The endemic Indian natatanurans (Nyctibatrachidae, Micrixalidae, and Ranixalidae) are nested within Asian lineages, and the divergences between them and their closest Asian relatives occurred between 55 and 60 Mya (Fig. 2), which is consistent with the timing of the India–Asia collision (∼55 Mya) (49). Intriguingly, the divergence between the Asian tree frogs (Rhacophoridae) and the Malagasy mantellids also happened during this period (Fig. 2), implying that the Indian plate served as a stepping stone for the long-distance dispersal from Asia to Madagascar.
The three long branches of similar duration leading to Hyloidea, Microhylidae, and Natatanura suggest that the K–Pg mass extinction event may have triggered explosive radiations by emptying ecological space. Notably, all terminal taxa (family and subfamily ranks) with arboreal species originate after the K–Pg boundary (Fig. 2). The rebounding of forests after the massive loss of vegetation (50) at the KPB may have provided new ecological opportunities for the subsequent radiation of largely arboreal groups such as Hylidae, Centrolenidae, and Rhacophoridae. The observation that no lineages of frogs originating before the KPB (archaeobatrachians, Heleophrynidae, Myobatrachoidea, and Sooglossoidea) have truly arboreal species, and that all origins of arboreality (e.g., within hyloids or natatanurans) follow the KPB, supports the hypothesis that the K–Pg mass extinction shaped the current diversity of frogs.
Materials and Methods
Taxon Sampling and Data Collection.
Our sampling included 156 frog species from 44 of the 55 recognized families (1). Eight outgroup species, including two salamanders, one caecilian, one bird, one crocodile, one mammal, and two lobe-finned fishes, were used in all phylogenetic analyses. Total DNA was isolated from frozen or ethanol-preserved tissues (liver or muscle) by proteinase K digestion followed by standard salt extraction protocol. Previously published PCR primers and PCR protocols (12) were used to amplify 95 unlinked nuclear protein-coding genes (including RAG1 and CXCR4) from the DNA extracts in 96-well plates. The amplification products were sequenced using a next-generation sequencing (NGS) strategy as described by Feng et al. (51). Briefly, all amplification products from a single species were pooled together and purified. The amplification product pool of a sample was then randomly sheared to small fragments (200–500 bp), ends were repaired, and a species-specific barcode linker was added. All indexed amplification product pools were mixed together. A sequencing library was constructed with the pooled DNA by using the TruSeq DNA Sample Preparation kit and sequenced on a Illumina HiSEq.2500 sequencer. Approximately 3 GB of Illumina HiSeq paired-end 90-bp reads were obtained. These reads were bioinformatically sorted by barcode sequence and assembled into consensus sequences. NGS protocol of library construction and bioinformatic analyses have been described previously (51). All sequences were compared by using BLAST against GenBank to ensure that the target sequences were amplified. The remaining sequences were further checked for frame shift or stop codons. GenBank accession numbers for the new sequences are given in Dataset S1.
GenBank Data.
To provide a comprehensive phylogeny at the family level, we retrieved RAG1 and CXCR4 sequences from GenBank for 145 additional species of frogs (Dataset S1). These data plus our new sequences comprise a combined dataset that contains 301 frog species from all recognized anuran families.
Phylogenetic Analyses.
The 95 nuclear protein coding genes were aligned by using the ClustalW algorithm as implemented in MEGA v6 (52). Ambiguously aligned regions were culled using GBlocks v.0.91b (53) with the “codon” model (−t = c), smaller block (−b4 = 3), and all gaps allowed (−b5 = a). All refined alignments were then concatenated into a concatenated supermatrix. Two supermatrices were built: 164-species dataset (156 frogs and 8 outgroups) and 309-species dataset (301 frogs and 8 outgroups). PartitionFinder v.1.1.1 (54) was used to select models and partitioning schemes for the two supermatrices according to the Bayesian information criterion. A total of 285 data partitions were selected as the best partitioning scheme that corresponded to the three separate codon positions for each of the 95 genes (Table S4). The ML tree was estimated by using RAxML version 8.0 (55) with the GTR + Γ + I model assigned to each partition. Support for nodes in the ML tree was assessed with a rapid bootstrap analysis (option –f a) with 1,000 replicates. The Bayesian tree was inferred using MrBayes 3.2 (56) using the models and partitions identified by PartitionFinder. Two Markov chain Monte Carlo (MCMC) runs were performed with one cold chain and three heated chains (temperature set to 0.1) for 50 million generations and sampled every 1,000 generations. Chain stationarity was visualized by plotting likelihoods against the generation number by using TRACER v1.6 (beast.bio.ed.ac.uk/Tracer). The effective sample sizes were greater than 200 for all parameters after the first 10% of generations were discarded. Species tree analysis without gene concatenation was performed by using the Accurate Species TRee ALgorithm (ASTRAL) (57) under the coalescent model. The individual input gene trees were inferred from partitioned ML analyses by using RAxML with the same GTR + Γ + I model assigned to each codon position of each gene. The species tree analysis was conducted by using ASTRAL under the multilocus bootstrapping option with 200 replicates (−r = 200).
Table S4.
Comparisons of partitioning schemes using AIC, AICc, and BIC
| Partitions | Rank | No. of parameters | Ln L | AIC | AICc | BIC |
| 285p | 1 | 2,989 | −2,869,254.946 | 5,743,956.247 | 5,744,203.285 | 5,772,548.75 |
| 190p | 2 | 2,124 | −2,875,870.896 | 5,755,641.612 | 5,755,762.151 | 5,775,929.993 |
| 3p | 3 | 357 | −2,891,347.478 | 5,783,408.955 | 5,783,411.863 | 5,786,760.486 |
| 2p | 4 | 346 | −2,895,102.496 | 5,790,896.993 | 5,790,899.724 | 5,794,145.256 |
| 95p | 5 | 1,277 | −2,919,155.093 | 5,840,791.627 | 5,840,830.889 | 5,852,852.715 |
| 1p | 6 | 335 | −2,931,059.583 | 5,862,789.166 | 5,862,791.726 | 5,865,934.16 |
The Ln L and number of parameters are represented with results from BIC.
Divergence Time Analyses.
Divergence time estimation was conducted by using the program MCMCTREE in the PAML package (58). The ML topology was used as the reference tree. Twenty calibration points were used to calibrate the clock (Fig. S7). The ML estimates of branch lengths for each of the 95 nuclear genes were obtained by using BASEML (in PAML) programs under the GTR + Γ model. Based on the mean estimate from the 95 genes using a strict molecular clock with a 450-Mya root age (the divergence between Latimeria and Protopterus; ref. 59), the prior for the overall substitution rate (rgene gamma) was set at G (1, 11.96, 1). The prior for the rate-drift parameter (sigma2 gamma) was set at G (1, 4.5, 1). The 20 calibration points were specified with soft boundaries by using 2.5% tail probabilities above and below their limits; this is a built-in function of MCMCTREE. The independent rate model (clock = 2 in MCMCTREE) was used to specify the rate priors for internal nodes. The MCMC run was first executed for 10,000,000 generations as burn-in, then sampled every 1,000 generations until a total of 10,000 samples was collected. Two MCMC runs using random seeds were compared for convergence, and similar results were found.
Rate-Through-Time Analysis.
We investigated the diversification tempo of frogs using the program Bayesian Analysis of Macroevolutionary Mixtures (BAMM), v2.5 (60). The 309-species chronogram was used as the input tree. To account for incomplete taxon sampling, the time tree was pruned to family level, and the sampling fraction of each family was calculated based on the number of species following AmphibiaWeb. The BAMM analysis was run for 100 million generations at a temperature increment parameter of 0.01 and sampled event data every 1,000 generations. The first 20% samples were removed as burn-in. The rate-through-time plot was summarized and visualized by using BAMMtools (61) from the remaining 80% event data samples.
Biogeographic Analyses.
Based on the current distribution pattern of frogs, we defined seven biogeographic areas: Africa, Eurasia (Europe and Asia with exception of Indian plate), India (including Sri Lanka and the Seychelles), Madagascar, North America (northern Mexico, United States, and Canada), South America, and Australia (Australia, New Zealand, and New Guinea; Fig. 2). Connectivity of these biogeographic areas was modeled with three dispersal probability categories: 0.01 for well-separated areas, 0.5 for moderately separate areas, and 1.0 for well-connected areas. Area connectivity and dispersal probability were modeled in seven time slices: 0–30 Mya, 30–66 Mya, 66–90 Mya, 90–120 Mya, 120–160 Mya, 160–200 Mya, and 200–270 Mya (Table S5).
Table S5.
BioGeoBEARS dispersal multipliers for seven slices
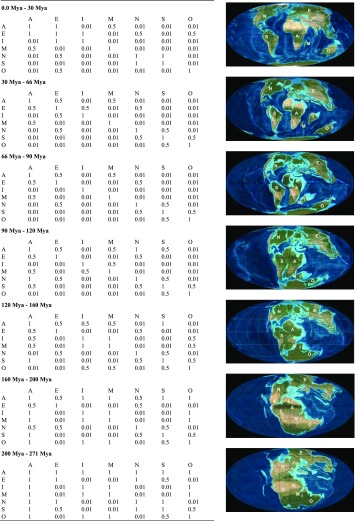 |
Dispersal rates were assigned as 1 for neighboring areas connected by land bridge, 0.5 for neighboring but not connected areas, and 0.01 for nonneighboring areas or areas separated by large ocean barriers. A, Africa; E, Eurasia (Europe and Asia with exception of Indian plate); I, India-Seychelles; M, Madagascar; N, North America; O, Australia (Australia, New Zealand, and New Guinea); S, South America. The paleogeography maps are based on ref. 42 and from the website jan.ucc.nau.edu/rcb7/index.html.
Biogeographic analyses were performed by using BioGeoBEARS (41). We used the 309-species chronogram generated by our divergence time analyses as the input phylogeny. The current distribution of each frog species was assigned based on data from AmphibiaWeb (Table S6). The maximum number of ancestral areas allowed at each node was set to four. We compared the DEC and DEC+J models to determine the influence of founder-event dispersal on biogeographic patterns. The AIC criterion selected the DEC+J as the best-fitting model (Table S3), and this was subsequently used to infer the most likely biogeographic history of anurans.
Table S6.
Taxonomic information and geographical distribution used for biogeographical analysis
| No. | Species | Taxonomy | Distribution |
| 1 | Allophryne ruthveni | Allophrynidae | South America |
| 2 | Alsodes gargola | Alsodidae | South America |
| 3 | Eupsophus calcaratus | Alsodidae | South America |
| 4 | Alytes obstetricans | Alytidae | Eurasia |
| 5 | Discoglossus pictus | Alytidae | Eurasia |
| 6 | Arthroleptis poecilonotus | Arthroleptidae | Africa |
| 7 | Arthroleptis variabilis | Arthroleptidae | Africa |
| 8 | Astylosternus diadematus | Arthroleptidae | Africa |
| 9 | Leptodactylodon ovatus | Arthroleptidae | Africa |
| 10 | Leptopelis kivuensis | Arthroleptidae | Africa |
| 11 | Leptopelis parkeri | Arthroleptidae | Africa |
| 12 | Nyctibates corrugatus | Arthroleptidae | Africa |
| 13 | Scotobleps gabonicus | Arthroleptidae | Africa |
| 14 | Trichobatrachus robustus | Arthroleptidae | Africa |
| 15 | Ascaphus truei | Ascaphidae | North America |
| 16 | Atelognathus reverberii | Batrachylidae | South America |
| 17 | Batrachyla leptopus | Batrachylidae | South America |
| 18 | Batrachyla taeniata | Batrachylidae | South America |
| 19 | Barbourula busuangensis | Bombinatoridae | Eurasia |
| 20 | Bombina fortinuptialis | Bombinatoridae | Eurasia |
| 21 | Bombina orientalis | Bombinatoridae | Eurasia |
| 22 | Brachycephalus ephippium | Brachycephalidae | South America |
| 23 | Ischnocnema guentheri | Brachycephalidae | South America |
| 24 | Breviceps macrops | Brevicipitidae | Africa |
| 25 | Breviceps mossambicus | Brevicipitidae | Africa |
| 26 | Callulina kreffti | Brevicipitidae | Africa |
| 27 | Callulina laphami | Brevicipitidae | Africa |
| 28 | Probreviceps durirostris | Brevicipitidae | Africa |
| 29 | Spelaeophryne methneri | Brevicipitidae | Africa |
| 30 | Sclerophrys brauni | Bufonidae | Africa |
| 31 | Sclerophrys maculata | Bufonidae | Africa |
| 32 | Mertensophryne micranotis | Bufonidae | Africa |
| 33 | Nectophrynoides tornieri | Bufonidae | Africa |
| 34 | Schismaderma carens | Bufonidae | Africa |
| 35 | Bufo bufo | Bufonidae | Eurasia |
| 36 | Bufo gargarizans | Bufonidae | Eurasia |
| 37 | Bufo japonicus | Bufonidae | Eurasia |
| 38 | Bufotes viridis | Bufonidae | Eurasia |
| 39 | Epidalea calamita | Bufonidae | Eurasia |
| 40 | Ingerophrynus divergens | Bufonidae | Eurasia |
| 41 | Ingerophrynus galeatus | Bufonidae | Eurasia |
| 42 | Leptophryne borbonica | Bufonidae | Eurasia |
| 43 | Rentapia hosii | Bufonidae | Eurasia |
| 44 | Phrynoidis aspera | Bufonidae | Eurasia |
| 45 | Phrynoidis juxtaspera | Bufonidae | Eurasia |
| 46 | Duttaphrynus melanostictus | Bufonidae | Eurasia, India-Seychelles |
| 47 | Duttaphrynus stomaticus | Bufonidae | Eurasia, India-Seychelles |
| 48 | Adenomus kelaartii | Bufonidae | India-Seychelles |
| 49 | Amazophrynella minuta | Bufonidae | South America |
| 50 | Atelopus peruensis | Bufonidae | South America |
| 51 | Incilius luetkenii | Bufonidae | South America |
| 52 | Incilius nebulifer | Bufonidae | South America |
| 53 | Melanophryniscus stelzneri | Bufonidae | South America |
| 54 | Nannophryne cophotis | Bufonidae | South America |
| 55 | Nannophryne variegata | Bufonidae | South America |
| 56 | Peltophryne lemur | Bufonidae | South America |
| 57 | Peltophryne longinasus | Bufonidae | South America |
| 58 | Peltophryne peltocephala | Bufonidae | South America |
| 59 | Rhaebo glaberrimus | Bufonidae | South America |
| 60 | Rhaebo nasicus | Bufonidae | South America |
| 61 | Rhinella marina | Bufonidae | South America |
| 62 | Rhinella ocellata | Bufonidae | South America |
| 63 | Anaxyrus canorus | Bufonidae | North America |
| 64 | Anaxyrus punctatus | Bufonidae | North America |
| 65 | Calyptocephalella gayi | Calyptocephalellidae | South America |
| 66 | Centrolene bacatum | Centrolenidae | South America |
| 67 | Centrolene daidaleum | Centrolenidae | South America |
| 68 | Chimerella mariaelenae | Centrolenidae | South America |
| 69 | Cochranella granulosa | Centrolenidae | South America |
| 70 | Espadarana prosoblepon | Centrolenidae | South America |
| 71 | Hyalinobatrachium aureoguttatum | Centrolenidae | South America |
| 72 | Hyalinobatrachium colymbiphyllum | Centrolenidae | South America |
| 73 | Hyalinobatrachium ibama | Centrolenidae | South America |
| 74 | Ikakogi tayrona | Centrolenidae | South America |
| 75 | Nymphargus grandisonae | Centrolenidae | South America |
| 76 | Rulyrana adiazeta | Centrolenidae | South America |
| 77 | Rulyrana flavopunctata | Centrolenidae | South America |
| 78 | Sachatamia ilex | Centrolenidae | South America |
| 79 | Teratohyla spinosa | Centrolenidae | South America |
| 80 | Vitreorana helenae | Centrolenidae | South America |
| 81 | Platymantis hazelae | Ceratobatrachidae | Eurasia |
| 82 | Cornufer pelewensis | Ceratobatrachidae | Eurasia |
| 83 | Ceratophrys cornuta | Ceratophryidae | South America |
| 84 | Ceratophrys ornata | Ceratophryidae | South America |
| 85 | Lepidobatrachus laevis | Ceratophryidae | South America |
| 86 | Lepidobatrachus sp. | Ceratophryidae | South America |
| 87 | Ceuthomantis smaragdinus | Ceuthomantidae | South America |
| 88 | Conraua crassipes | Conrauidae | Africa |
| 89 | Craugastor fitzingeri | Craugastoridae | South America |
| 90 | Craugastor podiciferus | Craugastoridae | South America |
| 91 | Craugastor augusti | Craugastoridae | North America |
| 92 | Thoropa taophora | Cycloramphidae | South America |
| 93 | Allobates femoralis | Dendrobatidae | South America |
| 94 | Hyloxalus jacobuspetersi | Dendrobatidae | South America |
| 95 | Dendrobates auratus | Dendrobatidae | South America |
| 96 | Epipedobates tricolor | Dendrobatidae | South America |
| 97 | Phyllobates vittatus | Dendrobatidae | South America |
| 98 | Ranitomeya imitator | Dendrobatidae | South America |
| 99 | Euphlyctis cyanophlyctis | Dicroglossidae: Dicroglossinae | Eurasia |
| 100 | Fejervarya limnocharis | Dicroglossidae: Dicroglossinae | Eurasia |
| 101 | Fejervarya multistriata | Dicroglossidae: Dicroglossinae | Eurasia |
| 102 | Hoplobatrachus tigerinus | Dicroglossidae: Dicroglossinae | Eurasia |
| 103 | Limnonectes fujianensis | Dicroglossidae: Dicroglossinae | Eurasia |
| 104 | Limnonectes laticeps | Dicroglossidae: Dicroglossinae | Eurasia |
| 105 | Limnonectes magnus | Dicroglossidae: Dicroglossinae | Eurasia |
| 106 | Quasipaa spinosa | Dicroglossidae: Dicroglossinae | Eurasia |
| 107 | Fejervarya granosa | Dicroglossidae: Dicroglossinae | India-Seychelles |
| 108 | Liurana xizangensis | Dicroglossidae: Occidozyginae | Eurasia |
| 109 | Occidozyga laevis | Dicroglossidae: Occidozyginae | Eurasia |
| 110 | Occidozyga lima | Dicroglossidae: Occidozyginae | Eurasia |
| 111 | Diasporus diastema | Eleutherodactylidae | South America |
| 112 | Eleutherodactylus coqui | Eleutherodactylidae | South America |
| 113 | Eleutherodactylus planirostris | Eleutherodactylidae | South America |
| 114 | Eleutherodactylus marnockii | Eleutherodactylidae | North America |
| 115 | Heleophryne purcelli | Heleophrynidae | Africa |
| 116 | Cryptobatrachus boulengeri | Hemiphractidae | South America |
| 117 | Flectonotus fitzgeraldi | Hemiphractidae | South America |
| 118 | Gastrotheca pseustes | Hemiphractidae | South America |
| 119 | Gastrotheca weinlandii | Hemiphractidae | South America |
| 120 | Hemiphractus bubalus | Hemiphractidae | South America |
| 121 | Stefania ginesi | Hemiphractidae | South America |
| 122 | Hemisus marmoratus | Hemisotidae | Africa |
| 123 | Hyla chinensis | Hylidae: Hylinae | Eurasia |
| 124 | Aplastodiscus perviridis | Hylidae: Hylinae | South America |
| 125 | Dendropsophus parviceps | Hylidae: Hylinae | South America |
| 126 | Hyloscirtus lindae | Hylidae: Hylinae | South America |
| 127 | Hypsiboas fasciatus | Hylidae: Hylinae | South America |
| 128 | Osteocephalus taurinus | Hylidae: Hylinae | South America |
| 129 | Pseudis paradoxa | Hylidae: Hylinae | South America |
| 130 | Scinax ruber | Hylidae: Hylinae | South America |
| 131 | Trachycephalus typhonius | Hylidae: Hylinae | South America |
| 132 | Acris crepitans | Hylidae: Hylinae | North America |
| 133 | Hyla arenicolor | Hylidae: Hylinae | North America |
| 134 | Hyla cinerea | Hylidae: Hylinae | North America |
| 135 | Cyclorana maini | Hylidae: Pelodryadinae | Australia |
| 136 | Litoria caerulea | Hylidae: Pelodryadinae | Australia |
| 137 | Nyctimystes kubori | Hylidae: Pelodryadinae | Australia |
| 138 | Nyctimystes pulcher | Hylidae: Pelodryadinae | Australia |
| 139 | Agalychnis callidryas | Hylidae: Phyllomedusinae | South America |
| 140 | Agalychnis lemur | Hylidae: Phyllomedusinae | South America |
| 141 | Agalychnis saltator | Hylidae: Phyllomedusinae | South America |
| 142 | Cruziohyla calcarifer | Hylidae: Phyllomedusinae | South America |
| 143 | Phyllomedusa hypochondrialis | Hylidae: Phyllomedusinae | South America |
| 144 | Phyllomedusa tomopterna | Hylidae: Phyllomedusinae | South America |
| 145 | Hylodes nasus | Hylodidae | South America |
| 146 | Afrixalus dorsalis | Hyperoliidae | Africa |
| 147 | Hyperolius bolifambae | Hyperoliidae | Africa |
| 148 | Hyperolius viridiflavus | Hyperoliidae | Africa |
| 149 | Phlyctimantis boulengeri | Hyperoliidae | Africa |
| 150 | Leiopelma hochstetteri | Leiopelmatidae | Australia |
| 151 | Physalaemus pustulosus | Leptodactylidae | South America |
| 152 | Leptodactylus albilabris | Leptodactylidae | South America |
| 153 | Leptodactylus latrans | Leptodactylidae | South America |
| 154 | Leptodactylus melanonotus | Leptodactylidae | South America |
| 155 | Lithodytes lineatus | Leptodactylidae | South America |
| 156 | Physalaemus cuvieri | Leptodactylidae | South America |
| 157 | Pleurodema thaul | Leptodactylidae | South America |
| 158 | Pleurodema somuncurensis | Leptodactylidae | South America |
| 159 | Boophis madagascariensis | Mantellidae: Boophinae | Madagascar |
| 160 | Boophis xerophilus | Mantellidae: Boophinae | Madagascar |
| 161 | Aglyptodactylus madagascariensis | Mantellidae: Laliostominae | Madagascar |
| 162 | Blommersia wittei | Mantellidae: Mantellinae | Madagascar |
| 163 | Mantella madagascariensis | Mantellidae: Mantellinae | Madagascar |
| 164 | Brachytarsophrys feae | Megophryidae | Eurasia |
| 165 | Leptobrachium chapaense | Megophryidae | Eurasia |
| 166 | Leptolalax alpinus | Megophryidae | Eurasia |
| 167 | Megophrys nasuta | Megophryidae | Eurasia |
| 168 | Ophryophryne microstoma | Megophryidae | Eurasia |
| 169 | Oreolalax jingdongensis | Megophryidae | Eurasia |
| 170 | Scutiger gongshanensis | Megophryidae | Eurasia |
| 171 | Xenophrys omeimontis | Megophryidae | Eurasia |
| 172 | Micrixalus sp. | Micrixalidae | India-Seychelles |
| 173 | Gastrophrynoides immaculatus | Microhylidae: Asterophryinae | Eurasia |
| 174 | Callulops wilhelmanus | Microhylidae: Asterophryinae | Australia |
| 175 | Cophixalus cheesmanae | Microhylidae: Asterophryinae | Australia |
| 176 | Cophixalus cryptotympanum | Microhylidae: Asterophryinae | Australia |
| 177 | Cophixalus sp. A | Microhylidae: Asterophryinae | Australia |
| 178 | Cophixalus sp. B | Microhylidae: Asterophryinae | Australia |
| 179 | Hylophorbus rufescens | Microhylidae: Asterophryinae | Australia |
| 180 | Liophryne schlaginhaufeni | Microhylidae: Asterophryinae | Australia |
| 181 | Mantophryne lateralis | Microhylidae: Asterophryinae | Australia |
| 182 | Oreophryne sp. A | Microhylidae: Asterophryinae | Australia |
| 183 | Oreophryne sp. B | Microhylidae: Asterophryinae | Australia |
| 184 | Xenorhina obesa | Microhylidae: Asterophryinae | Australia |
| 185 | Xenorhina sp. | Microhylidae: Asterophryinae | Australia |
| 186 | Anodonthyla boulengerii | Microhylidae: Cophylinae | Madagascar |
| 187 | Platypelis tuberifera | Microhylidae: Cophylinae | Madagascar |
| 188 | Plethodontohyla inguinalis | Microhylidae: Cophylinae | Madagascar |
| 189 | Stumpffia pygmaea | Microhylidae: Cophylinae | Madagascar |
| 190 | Dyscophus antongilii | Microhylidae: Dyscophinae | Madagascar |
| 191 | Chiasmocleis ventrimaculata | Microhylidae: Gastrophryninae | South America |
| 192 | Ctenophryne geayi | Microhylidae: Gastrophryninae | South America |
| 193 | Elachistocleis ovalis | Microhylidae: Gastrophryninae | South America |
| 194 | Stereocyclops incrassatus | Microhylidae: Gastrophryninae | South America |
| 195 | Gastrophryne olivacea | Microhylidae: Gastrophryninae | North America |
| 196 | Hoplophryne rogersi | Microhylidae: Hoplophryninae | Africa |
| 197 | Kalophrynus interlineatus | Microhylidae: Kalophryninae | Eurasia |
| 198 | Kalophrynus pleurostigma | Microhylidae: Kalophryninae | Eurasia |
| 199 | Melanobatrachus indicus | Microhylidae: Melanobatrachinae | India-Seychelles |
| 200 | Calluella guttulata | Microhylidae: Microhylinae | Eurasia |
| 201 | Chaperina fusca | Microhylidae: Microhylinae | Eurasia |
| 202 | Kaloula conjuncta | Microhylidae: Microhylinae | Eurasia |
| 203 | Kaloula pulchra | Microhylidae: Microhylinae | Eurasia |
| 204 | Metaphrynella pollicaris | Microhylidae: Microhylinae | Eurasia |
| 205 | Metaphrynella sundana | Microhylidae: Microhylinae | Eurasia |
| 206 | Microhyla annectens | Microhylidae: Microhylinae | Eurasia |
| 207 | Microhyla heymonsi | Microhylidae: Microhylinae | Eurasia |
| 208 | Microhyla marmorata | Microhylidae: Microhylinae | Eurasia |
| 209 | Microhyla okinavensis | Microhylidae: Microhylinae | Eurasia |
| 210 | Micryletta inornata | Microhylidae: Microhylinae | Eurasia |
| 211 | Phrynella pulchra | Microhylidae: Microhylinae | Eurasia |
| 212 | Uperodon montanus | Microhylidae: Microhylinae | India-Seychelles |
| 213 | Uperodon variegatus | Microhylidae: Microhylinae | India-Seychelles |
| 214 | Uperodon systoma | Microhylidae: Microhylinae | India-Seychelles |
| 215 | Otophryne pyburni | Microhylidae: Otophryninae | South America |
| 216 | Synapturanus sp. | Microhylidae: Otophryninae | South America |
| 217 | Phrynomantis microps | Microhylidae: Phrynomerinae | Africa |
| 218 | Paradoxophyla palmata | Microhylidae: Scaphiophryninae | Madagascar |
| 219 | Scaphiophryne boribory | Microhylidae: Scaphiophryninae | Madagascar |
| 220 | Scaphiophryne madagascariensis | Microhylidae: Scaphiophryninae | Madagascar |
| 221 | Scaphiophryne marmorata | Microhylidae: Scaphiophryninae | Madagascar |
| 222 | Limnodynastes salmini | Myobatrachidae: Limnodynastinae | Australia |
| 223 | Mixophyes coggeri | Myobatrachidae: Limnodynastinae | Australia |
| 223 | Mixophyes coggeri | Myobatrachidae: Limnodynastinae | Australia |
| 224 | Crinia signifera | Myobatrachidae: Myobatrachinae | Australia |
| 225 | Myobatrachus gouldii | Myobatrachidae: Myobatrachinae | Australia |
| 226 | Uperoleia laevigata | Myobatrachidae: Myobatrachinae | Australia |
| 227 | Nasikabatrachus sahyadrensis | Nasikabatrachidae | India-Seychelles |
| 228 | Lankanectes corrugatus | Nyctibatrachidae | India-Seychelles |
| 229 | Nyctibatrachus sp. | Nyctibatrachidae | India-Seychelles |
| 230 | Odontobatrachus natator | Odontobatrachidae | Africa |
| 231 | Odontophrynus occidentalis | Odontophrynidae | South America |
| 232 | Proceratophrys boiei | Odontophrynidae | South America |
| 233 | Pelobates cultripes | Pelobatidae | Eurasia |
| 234 | Pelobates syriacus | Pelobatidae | Eurasia |
| 235 | Pelodytes ibericus | Pelodytidae | Eurasia |
| 236 | Petropedetes euskircheni | Petropedetidae | Africa |
| 237 | Petropedetes parkeri | Petropedetidae | Africa |
| 238 | Phrynobatrachus africanus | Phrynobatrachidae | Africa |
| 239 | Phrynobatrachus krefftii | Phrynobatrachidae | Africa |
| 240 | Phrynobatrachus natalensis | Phrynobatrachidae | Africa |
| 241 | Hymenochirus boettgeri | Pipidae | Africa |
| 242 | Pseudhymenochirus merlini | Pipidae | Africa |
| 243 | Xenopus epitropicalis | Pipidae | Africa |
| 244 | Xenopus kobeli | Pipidae | Africa |
| 245 | Pipa parva | Pipidae | South America |
| 246 | Pipa pipa | Pipidae | South America |
| 247 | Ptychadena cooperi | Ptychadenidae | Africa |
| 248 | Ptychadena mascareniensis | Ptychadenidae | Africa |
| 249 | Ptychadena oxyrhynchus | Ptychadenidae | Africa |
| 250 | Amietia lubrica | Pyxicephalidae: Cacosterninae | Africa |
| 251 | Strongylopus grayii | Pyxicephalidae: Cacosterninae | Africa |
| 252 | Aubria subsigillata | Pyxicephalidae: Pyxicephalinae | Africa |
| 253 | Pyxicephalus edulis | Pyxicephalidae: Pyxicephalinae | Africa |
| 254 | Amolops loloensis | Ranidae | Eurasia |
| 255 | Amolops ricketti | Ranidae | Eurasia |
| 256 | Babina chapaensis | Ranidae | Eurasia |
| 257 | Babina pleuraden | Ranidae | Eurasia |
| 258 | Sylvirana guentheri | Ranidae | Eurasia |
| 259 | Papurana latouchii | Ranidae | Eurasia |
| 260 | Hydrophylax leptoglossa | Ranidae | Eurasia |
| 261 | Chalcorana macrops | Ranidae | Eurasia |
| 262 | Papurana sp. | Ranidae | Eurasia |
| 263 | Meristogenys kinabaluensis | Ranidae | Eurasia |
| 264 | Odorrana hosii | Ranidae | Eurasia |
| 265 | Odorrana schmackeri | Ranidae | Eurasia |
| 266 | Pelophylax nigromaculatus | Ranidae | Eurasia |
| 267 | Rana amurensis | Ranidae | Eurasia |
| 268 | Rana chensinensis | Ranidae | Eurasia |
| 269 | Rana japonica | Ranidae | Eurasia |
| 270 | Rana temporaria | Ranidae | Eurasia |
| 271 | Sanguirana luzonensis | Ranidae | Eurasia |
| 272 | Staurois latopalmatus | Ranidae | Eurasia |
| 273 | Rana catesbeiana | Ranidae | North America |
| 274 | Rana draytonii | Ranidae | North America |
| 275 | Rana pipiens | Ranidae | North America |
| 276 | Rana virgatipes | Ranidae | North America |
| 277 | Rana berlandieri | Ranidae | North America, South America |
| 278 | Indirana sp. A | Ranixalidae | India-Seychelles |
| 279 | Indirana sp. B | Ranixalidae | India-Seychelles |
| 280 | Buergeria buergeri | Rhacophoridae: Buergeriinae | Eurasia |
| 281 | Buergeria oxycephala | Rhacophoridae: Buergeriinae | Eurasia |
| 282 | Kurixalus odontotarsus | Rhacophoridae: Rhacophorinae | Eurasia |
| 283 | Polypedates megacephalus | Rhacophoridae: Rhacophorinae | Eurasia |
| 284 | Rhacophorus dennysi | Rhacophoridae: Rhacophorinae | Eurasia |
| 285 | Pseudophilautus wynaadensis | Rhacophoridae: Rhacophorinae | India-Seychelles |
| 286 | Insuetophrynus acarpicus | Rhinodermatidae | South America |
| 287 | Rhinoderma darwinii | Rhinodermatidae | South America |
| 288 | Rhinophrynus dorsalis | Rhinophrynidae | North America |
| 289 | Scaphiopus couchii | Scaphiopodidae | North America |
| 290 | Scaphiopus holbrookii | Scaphiopodidae | North America |
| 291 | Spea intermontana | Scaphiopodidae | North America |
| 292 | Spea multiplicata | Scaphiopodidae | North America |
| 293 | Sooglossus thomasseti | Sooglossidae | India-Seychelles |
| 294 | Barycholos pulcher | Strabomantidae | South America |
| 295 | Hypodactylus brunneus | Strabomantidae | South America |
| 296 | Phrynopus bracki | Strabomantidae | South America |
| 297 | Pristimantis thymelensis | Strabomantidae | South America |
| 298 | Strabomantis biporcatus | Strabomantidae | South America |
| 299 | Strabomantis sulcatus | Strabomantidae | South America |
| 300 | Batrachophrynus macrostomus | Telmatobiidae | South America |
| 301 | Telmatobius vellardi | Telmatobiidae | South America |
| 302 | Andrias davidianus | Cryptobranchidae | Eurasia |
| 303 | Batrachuperus yenyuanensis | Hynobiidae | Eurasia |
Supplementary Material
Acknowledgments
This work was supported by National Natural Science Foundation of China Grants 31672266 and 31372172 (to P.Z.), National Youth Talent Support Program Grant W02070133 (to P.Z.), National Science Fund for Excellent Young Scholars of China Grant 31322049 (to P.Z.), and National Science Foundation Grant DEB-1202609 (to D.C.B.) and DEB-1441652 (to D.B.W.).
Footnotes
The authors declare no conflict of interest.
Data deposition: The sequences reported in this paper have been deposited in the GenBank database. For a list of accession numbers, see Dataset S1.
This article contains supporting information online at www.pnas.org/lookup/suppl/doi:10.1073/pnas.1704632114/-/DCSupplemental.
References
- 1.University of California, Berkeley 2017 AmphibiaWeb: Information on amphibian biology and conservation. Available at amphibiaweb.org. Accessed June 14, 2017.
- 2.Roelants K, Bossuyt F. Archaeobatrachian paraphyly and Pangaean diversification of crown-group frogs. Syst Biol. 2005;54:111–126. doi: 10.1080/10635150590905894. [DOI] [PubMed] [Google Scholar]
- 3.San Mauro D, Vences M, Alcobendas M, Zardoya R, Meyer A. Initial diversification of living amphibians predated the breakup of Pangaea. Am Nat. 2005;165:590–599. doi: 10.1086/429523. [DOI] [PubMed] [Google Scholar]
- 4.Frost DR, et al. The amphibian tree of life. Bull Am Mus Nat Hist. 2006;297:1–370. [Google Scholar]
- 5.Roelants K, et al. Global patterns of diversification in the history of modern amphibians. Proc Natl Acad Sci USA. 2007;104:887–892. doi: 10.1073/pnas.0608378104. [DOI] [PMC free article] [PubMed] [Google Scholar]
- 6.Pyron RA, Wiens JJ. A large-scale phylogeny of Amphibia including over 2800 species, and a revised classification of extant frogs, salamanders, and caecilians. Mol Phylogenet Evol. 2011;61:543–583. doi: 10.1016/j.ympev.2011.06.012. [DOI] [PubMed] [Google Scholar]
- 7.Zhang P, et al. Efficient sequencing of anuran mtDNAs and a mitogenomic exploration of the phylogeny and evolution of frogs. Mol Biol Evol. 2013;30:1899–1915. doi: 10.1093/molbev/mst091. [DOI] [PubMed] [Google Scholar]
- 8.Bossuyt F, Roelants K. Anura. In: Hedges SB, Kumar S, editors. The Timetree of Life. Oxford Univ Press; New York: 2009. pp. 357–364. [Google Scholar]
- 9.Wiens JJ. Re-evolution of lost mandibular teeth in frogs after more than 200 million years, and re-evaluating Dollo’s law. Evolution. 2011;65:1283–1296. doi: 10.1111/j.1558-5646.2011.01221.x. [DOI] [PubMed] [Google Scholar]
- 10.Frazão A, da Silva HR, Russo CA. The Gondwana breakup and the history of the Atlantic and Indian oceans unveils two new clades for early neobatrachian diversification. PLoS ONE. 2015;10:e0143926. doi: 10.1371/journal.pone.0143926. [DOI] [PMC free article] [PubMed] [Google Scholar]
- 11.Biju SD, Bossuyt F. New frog family from India reveals an ancient biogeographical link with the Seychelles. Nature. 2003;425:711–714. doi: 10.1038/nature02019. [DOI] [PubMed] [Google Scholar]
- 12.Shen XX, Liang D, Feng YJ, Chen MY, Zhang P. A versatile and highly efficient toolkit including 102 nuclear markers for vertebrate phylogenomics, tested by resolving the higher level relationships of the Caudata. Mol Biol Evol. 2013;30:2235–2248. doi: 10.1093/molbev/mst122. [DOI] [PubMed] [Google Scholar]
- 13.Irisarri I, Vences M, San Mauro D, Glaw F, Zardoya R. Reversal to air-driven sound production revealed by a molecular phylogeny of tongueless frogs, family Pipidae. BMC Evol Biol. 2011;11:114. doi: 10.1186/1471-2148-11-114. [DOI] [PMC free article] [PubMed] [Google Scholar]
- 14.Bossuyt F, Brown RM, Hillis DM, Cannatella DC, Milinkovitch MC. Phylogeny and biogeography of a cosmopolitan frog radiation: Late cretaceous diversification resulted in continent-scale endemism in the family Ranidae. Syst Biol. 2006;55:579–594. doi: 10.1080/10635150600812551. [DOI] [PubMed] [Google Scholar]
- 15.Van Bocxlaer I, Roelants K, Biju SD, Nagaraju J, Bossuyt F. Late Cretaceous vicariance in Gondwanan amphibians. PLoS ONE. 2006;1:e74. doi: 10.1371/journal.pone.0000074. [DOI] [PMC free article] [PubMed] [Google Scholar]
- 16.van der Meijden A, et al. Nuclear gene phylogeny of narrow-mouthed toads (family: Microhylidae) and a discussion of competing hypotheses concerning their biogeographical origins. Mol Phylogenet Evol. 2007;44:1017–1030. doi: 10.1016/j.ympev.2007.02.008. [DOI] [PubMed] [Google Scholar]
- 17.Kurabayashi A, et al. From Antarctica or Asia? New colonization scenario for Australian-New Guinean narrow mouth toads suggested from the findings on a mysterious genus Gastrophrynoides. BMC Evol Biol. 2011;11:175. doi: 10.1186/1471-2148-11-175. [DOI] [PMC free article] [PubMed] [Google Scholar]
- 18.de Sá RO, et al. Molecular phylogeny of microhylid frogs (Anura: Microhylidae) with emphasis on relationships among New World genera. BMC Evol Biol. 2012;12:241. doi: 10.1186/1471-2148-12-241. [DOI] [PMC free article] [PubMed] [Google Scholar]
- 19.Peloso PLV, et al. The impact of anchored phylogenomics and taxon sampling on phylogenetic inference in narrow-mouthed frogs (Anura, Microhylidae) Cladistics. 2016;32:113–140. doi: 10.1111/cla.12118. [DOI] [PubMed] [Google Scholar]
- 20.Heinicke MP, et al. A new frog family (Anura: Terrarana) from South America and an expanded direct-developing clade revealed by molecular phylogeny. Zootaxa. 2009;2211:1–35. [Google Scholar]
- 21.Darst CR, Cannatella DC. Novel relationships among hyloid frogs inferred from 12S and 16S mitochondrial DNA sequences. Mol Phylogenet Evol. 2004;31:462–475. doi: 10.1016/j.ympev.2003.09.003. [DOI] [PubMed] [Google Scholar]
- 22.Hedges SB, Duellman WE, Heinicke MP. New World direct-developing frogs (Anura: Terrarana): Molecular phylogeny, classification, biogeography, and conservation. Zootaxa. 2008;1737:1–182. [Google Scholar]
- 23.Pyron RA. Biogeographic analysis reveals ancient continental vicariance and recent oceanic dispersal in amphibians. Syst Biol. 2014;63:779–797. doi: 10.1093/sysbio/syu042. [DOI] [PubMed] [Google Scholar]
- 24.Pyron RA. Divergence time estimation using fossils as terminal taxa and the origins of Lissamphibia. Syst Biol. 2011;60:466–481. doi: 10.1093/sysbio/syr047. [DOI] [PubMed] [Google Scholar]
- 25.Renne PR, et al. Time scales of critical events around the Cretaceous-Paleogene boundary. Science. 2013;339:684–687. doi: 10.1126/science.1230492. [DOI] [PubMed] [Google Scholar]
- 26.Keller G. Deccan volcanism, the Chicxulub impact, and the end-Cretaceous mass extinction: Coincidence? Cause and effect? Geol Soc Am. 2014;505:57–89. [Google Scholar]
- 27.Duellman WE, Marion AB, Hedges SB. Phylogenetics, classification, and biogeography of the treefrogs (Amphibia: Anura: Arboranae) Zootaxa. 2016;4104:1–109. doi: 10.11646/zootaxa.4104.1.1. [DOI] [PubMed] [Google Scholar]
- 28.Shen XX, et al. Enlarged multilocus data set provides surprisingly younger time of origin for the Plethodontidae, the largest family of salamanders. Syst Biol. 2016;65:66–81. doi: 10.1093/sysbio/syv061. [DOI] [PubMed] [Google Scholar]
- 29.Longrich NR, Bhullar BAS, Gauthier JA. Mass extinction of lizards and snakes at the Cretaceous-Paleogene boundary. Proc Natl Acad Sci USA. 2012;109:21396–21401. doi: 10.1073/pnas.1211526110. [DOI] [PMC free article] [PubMed] [Google Scholar]
- 30.Longrich NR, Tokaryk T, Field DJ. Mass extinction of birds at the Cretaceous-Paleogene (K-Pg) boundary. Proc Natl Acad Sci USA. 2011;108:15253–15257. doi: 10.1073/pnas.1110395108. [DOI] [PMC free article] [PubMed] [Google Scholar]
- 31.O’Leary MA, et al. The placental mammal ancestor and the post-K-Pg radiation of placentals. Science. 2013;339:662–667. doi: 10.1126/science.1229237. [DOI] [PubMed] [Google Scholar]
- 32.Cooper A, Penny D. Mass survival of birds across the Cretaceous-Tertiary boundary: Molecular evidence. Science. 1997;275:1109–1113. doi: 10.1126/science.275.5303.1109. [DOI] [PubMed] [Google Scholar]
- 33.Benton MJ. The origins of modern biodiversity on land. Philos Trans R Soc Lond B Biol Sci. 2010;365:3667–3679. doi: 10.1098/rstb.2010.0269. [DOI] [PMC free article] [PubMed] [Google Scholar]
- 34.Meredith RW, et al. Impacts of the Cretaceous Terrestrial Revolution and KPg extinction on mammal diversification. Science. 2011;334:521–524. doi: 10.1126/science.1211028. [DOI] [PubMed] [Google Scholar]
- 35.dos Reis M, et al. Phylogenomic datasets provide both precision and accuracy in estimating the timescale of placental mammal phylogeny. Proc R Soc B Biol Sci. 2012;279:3491–3500. doi: 10.1098/rspb.2012.0683. [DOI] [PMC free article] [PubMed] [Google Scholar]
- 36.dos Reis M, Donoghue PCJ, Yang Z. Neither phylogenomic nor palaeontological data support a Palaeogene origin of placental mammals. Biol Lett. 2014;10:20131003. doi: 10.1098/rsbl.2013.1003. [DOI] [PMC free article] [PubMed] [Google Scholar]
- 37.Blain HA, Canudo JI, Cuenca-Bescós G, López-Martínez N. Amphibians and squamate reptiles from the latest Maastrichtian (Upper Cretaceous) of Blasi 2 (Huesca, Spain) Cretac Res. 2010;31:433–446. [Google Scholar]
- 38.Fastovsky DE, Bercovici A. The Hell Creek Formation and its contribution to the Cretaceous–Paleogene extinction: A short primer. Cretac Res. 2016;57:368–390. [Google Scholar]
- 39.Marjanović D, Laurin M. An updated paleontological timetree of lissamphibians, with comments on the anatomy of Jurassic crown-group salamanders (Urodela) Hist Biol. 2014;26:535–550. [Google Scholar]
- 40.Mercier GK, Demar DG, Wilson GP. 2016. Anurans, caudates, and albanerpetontids (Lissamphibia) reveal differential patterns of turnover and extinctions during the end-Cretaceous mass extinction, northeastern Montana, USA. 76th Annual Meeting of the Society of Vertebrate Paleontology, October 26–29, 2016 (Salt Lake City), p 188.
- 41.Matzke NJ. 2013 BioGeoBEARS: Biogeography with Bayesian and likelihood evolutionary analysis in R scripts. Available at cran.r-project.org/web/packages/BioGeoBEARS/. Accessed February 26, 2016.
- 42.Blakey RC. Gondwana paleogeography from assembly to breakup—a 500 m.y. odyssey. GSA Special Papers. 2008;441:1–28. [Google Scholar]
- 43.Plummer PS, Belle ER. Mesozoic tectono-stratigraphic evolution of the Seychelles microcontinent. Sediment Geol. 1995;96:73–91. [Google Scholar]
- 44.Zachos J, Pagani M, Sloan L, Thomas E, Billups K. Trends, rhythms, and aberrations in global climate 65 Ma to present. Science. 2001;292:686–693. doi: 10.1126/science.1059412. [DOI] [PubMed] [Google Scholar]
- 45.Francis JE, Poole I. Cretaceous and early Tertiary climates of Antarctica: Evidence from fossil wood. Palaeogeogr Palaeoclimatol Palaeoecol. 2002;182:47–64. [Google Scholar]
- 46.Goin CJ, Goin OB. Antarctica, isostacy, and the origin of frogs. Q J Florida Acad Sci. 1973;35:113–129. [Google Scholar]
- 47.Savage JM. The geographic distribution of frogs: Patterns and predictions. In: Vial JL, editor. Evolutionary Biology of the Anurans: Contemporary Research on Major Problems. Univ Missouri Press; Columbia, MO: 1973. pp. 351–445. [Google Scholar]
- 48.Bossuyt F, Milinkovitch MC. Amphibians as indicators of early tertiary “out-of-India” dispersal of vertebrates. Science. 2001;292:93–95. doi: 10.1126/science.1058875. [DOI] [PubMed] [Google Scholar]
- 49.Ruddiman W. Early uplift in Tibet? Nature. 1998;394:723–725. [Google Scholar]
- 50.Vajda V, Raine JI, Hollis CJ. Indication of global deforestation at the Cretaceous-Tertiary boundary by New Zealand fern spike. Science. 2001;294:1700–1702. doi: 10.1126/science.1064706. [DOI] [PubMed] [Google Scholar]
- 51.Feng YJ, Liu QF, Chen MY, Liang D, Zhang P. Parallel tagged amplicon sequencing of relatively long PCR products using the Illumina HiSeq platform and transcriptome assembly. Mol Ecol Resour. 2016;16:91–102. doi: 10.1111/1755-0998.12429. [DOI] [PubMed] [Google Scholar]
- 52.Tamura K, Stecher G, Peterson D, Filipski A, Kumar S. MEGA6: Molecular evolutionary genetics analysis version 6.0. Mol Biol Evol. 2013;30:2725–2729. doi: 10.1093/molbev/mst197. [DOI] [PMC free article] [PubMed] [Google Scholar]
- 53.Castresana J. Selection of conserved blocks from multiple alignments for their use in phylogenetic analysis. Mol Biol Evol. 2000;17:540–552. doi: 10.1093/oxfordjournals.molbev.a026334. [DOI] [PubMed] [Google Scholar]
- 54.Lanfear R, Calcott B, Ho SYW, Guindon S. PartitionFinder: Combined selection of partitioning schemes and substitution models for phylogenetic analyses. Mol Biol Evol. 2012;29:1695–1701. doi: 10.1093/molbev/mss020. [DOI] [PubMed] [Google Scholar]
- 55.Stamatakis A. RAxML version 8: A tool for phylogenetic analysis and post-analysis of large phylogenies. Bioinformatics. 2014;30:1312–1313. doi: 10.1093/bioinformatics/btu033. [DOI] [PMC free article] [PubMed] [Google Scholar]
- 56.Ronquist F, et al. MrBayes 3.2: Efficient Bayesian phylogenetic inference and model choice across a large model space. Syst Biol. 2012;61:539–542. doi: 10.1093/sysbio/sys029. [DOI] [PMC free article] [PubMed] [Google Scholar]
- 57.Mirarab S, et al. ASTRAL: Genome-scale coalescent-based species tree estimation. Bioinformatics. 2014;30:i541–i548. doi: 10.1093/bioinformatics/btu462. [DOI] [PMC free article] [PubMed] [Google Scholar]
- 58.Yang Z. PAML 4: Phylogenetic analysis by maximum likelihood. Mol Biol Evol. 2007;24:1586–1591. doi: 10.1093/molbev/msm088. [DOI] [PubMed] [Google Scholar]
- 59.Benton MJ, et al. Constraints on the timescale of animal evolutionary history. Paleontol Electron. 2015;18:1–106. [Google Scholar]
- 60.Rabosky DL. Automatic detection of key innovations, rate shifts, and diversity-dependence on phylogenetic trees. PLoS ONE. 2014;9:e89543. doi: 10.1371/journal.pone.0089543. [DOI] [PMC free article] [PubMed] [Google Scholar]
- 61.Rabosky DL, et al. BAMMtools: An R package for the analysis of evolutionary dynamics on phylogenetic trees. Methods Ecol Evol. 2014;5:701–707. [Google Scholar]
Associated Data
This section collects any data citations, data availability statements, or supplementary materials included in this article.