

Summary
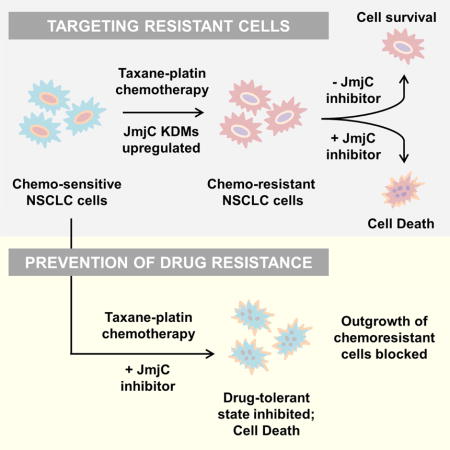
Although non-small cell lung cancer (NSCLC) patients benefit from standard taxane-platin chemotherapy, many relapse, developing drug resistance. We established preclinical taxane-platin chemoresistance models and identified a 35-gene resistance signature, which associated with poor recurrence-free survival in neoadjuvant-treated NSCLC patients and included upregulation of the JumonjiC lysine demethylase KDM3B. In fact, multi-drug resistant cells progressively increased expression of many JumonjiC demethylases, had altered histone methylation and importantly showed hypersensitivity to JumonjiC inhibitors, in vitro and in vivo. Increasing taxane-platin resistance in progressive cell line series was accompanied by progressive sensitization to JIB-04 and GSK-J4. These JumonjiC inhibitors partly reversed deregulated transcriptional programs, prevented the emergence of drug-tolerant colonies from chemo-naïve cells and synergized with standard chemotherapy in vitro and in vivo. Our findings reveal JumonjiC inhibitors as promising therapies for targeting taxane-platin chemoresistant NSCLCs.
Graphical abstract
Introduction
Lung cancer is the leading cause of cancer-related deaths in the U.S.A (American Cancer Society, 2015; Howlader N, 1975–2012). Non-small cell lung cancer (NSCLC) accounts for 85% of all lung cancer cases, more than 50% of which are already advanced-stage at the time of diagnosis. Platinum-based doublet chemotherapy is the standard of care for advanced NSCLCs, given in combination with third generation cytotoxic agents such as paclitaxel (Scagliotti et al., 2008; Schiller et al., 2002). Early-stage patients also receive platin-taxane chemotherapy to shrink tumors prior to resection (neoadjuvant therapy). Cancer relapse after chemotherapy poses a major obstacle for lung cancer cure and multiple studies have reported recurrence/drug resistance in ~70% of treated patients (Martin et al., 2002) (Massarelli et al., 2003) (d’Amato et al., 2007). Thus, despite current advances in targeted therapy for lung cancer, there is a large unmet clinical need to identify effective therapies for chemotherapy-resistant NSCLCs.
The most commonly implicated mechanism for acquisition of resistance to taxanes involves increased expression of drug efflux transporters such as MDR1, resulting in cross-resistance to other chemotherapies (Gottesman et al., 2002). Clinical trials using MDR inhibitors have been unsuccessful because of associated toxicity to normal tissues or lack of response due to collateral mechanisms of resistance (Bradshaw and Arceci, 1998; Szakacs et al., 2006). Epigenetic drivers of tumor drug tolerance have recently gained attention owing to their ability to dynamically alter transcriptional programs. EGFR tyrosine kinase inhibitor or BRAFV600E inhibitor-surviving cell subpopulations over-express the histone lysine demethylases KDM5A (Sharma et al., 2010) or KDM5B (Roesch et al., 2013) respectively, and KDM5 inhibitors have recently shown therapeutic potential (Vinogradova et al., 2016). T cell acute lymphoblastic leukemia cells persisting gamma-secretase inhibitors showed increased expression of BRD4 and sensitivity to small molecule inhibitor JQ1 (Knoechel et al., 2014). These studies suggest a role of epigenetic drivers in the acquisition of the drug-tolerant state. This state might not only provide a transition phase for surviving drug stress, but may also lead the way to establishing permanent resistance mechanisms.
To study the progression of NSCLC resistance to standard taxane-platin combination therapy, we developed isogenic resistant cell line variants through long-term drug treatment using cycles of drug on/drug off therapy to mimic clinical regimens. We then used these models to search for clinically relevant targets for drug resistant lung cancers by integrating genome-wide mRNA expression profiles of resistant cell line variants and the corresponding xenografts, and by evaluating the preclinical resistance signature for its association with recurrence-free survival outcome in neoadjuvant chemotherapy treated NSCLC patients. Intriguingly, our studies uncovered epigenetic alterations in chemoresistant cells encompassing several members of the JumonjiC histone demethylase family. We asked whether these epigenetic mechanisms conferred a survival advantage that could be exploited therapeutically to abrogate NSCLC cells that develop resistance to taxane-platin chemotherapy.
Results
Long-term paclitaxel + carboplatin treated NSCLC cell lines develop progressive increases in chemoresistance
To establish in vitro models of lung cancer chemoresistance, we treated NSCLC cell lines with paclitaxel + carboplatin standard chemotherapy, given in the clinically relevant 2:3 wt/wt ratio. Our ongoing tests of >100 NSCLC lines identified H1299 and H1355 among a group of NSCLC cell lines that had 100–500 fold lower IC50 values than the most resistant NSCLC lines, and were thus selected as “parental” cells to develop drug resistant variants. Clinical annotations and driver oncogenotypes for these cell lines are listed in Table S1. H1299 and H1355 cells were treated long-term for >6 months with increasing doses of paclitaxel + carboplatin doublet, given in cycles of drug on (4 days)/drug off (1–2 weeks). Cells were characterized for their drug response phenotypes after different treatment cycles, with T[n] denoting cell line variant developed after ‘n’ cycles of doublet therapy. We thus developed H1299 variant series consisting of T5, T10, T15 and T18, and H1355 isogenic cell line series with T4, T8, T13 and T16 resistant variants. These variants showed progressive increase in resistance to paclitaxel + carboplatin with increasing treatment cycles (Fig 1A, 1C), reaching >50-fold increases in IC50 in H1299 T18 and H1355 T16 (Fig 1B, 1D). Drug resistance persisted in limiting dilution clonogenic assays with continuous exposure to paclitaxel + carboplatin for 2–3 weeks (Fig 1E–1H).
Figure 1. Long-term treated NSCLC cell lines develop progressively increasing resistance to paclitaxel + carboplatin chemotherapy.
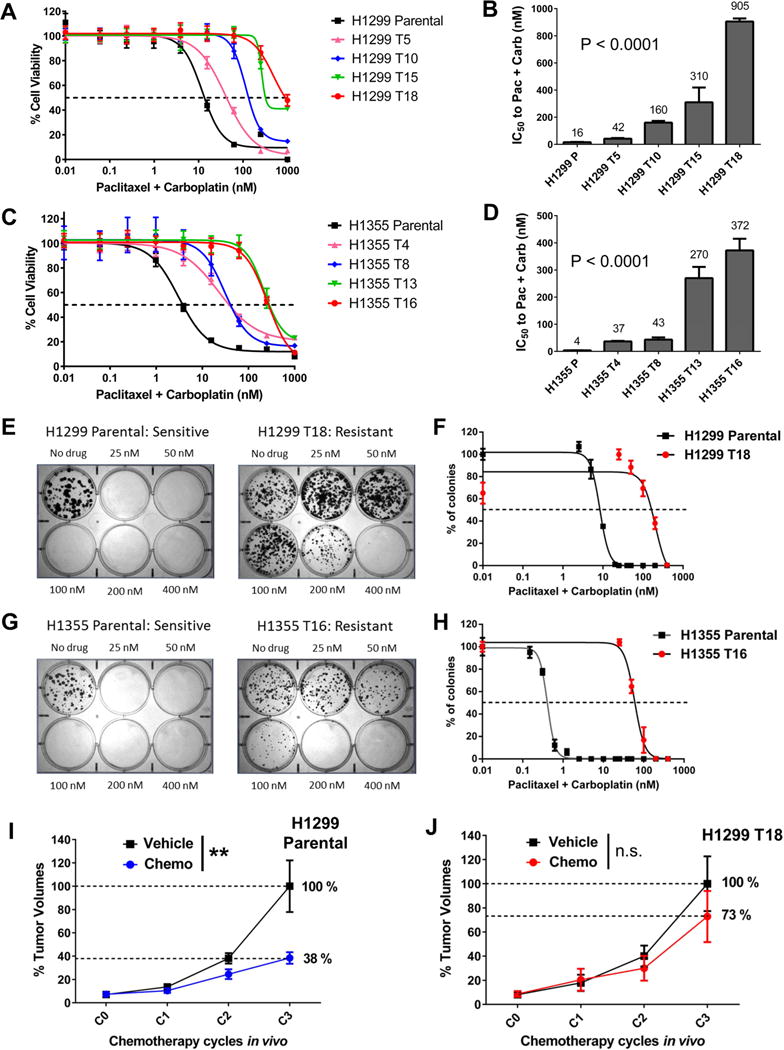
(A, C) Dose response curves for NCI-H1299 and NCI-H1355 cells after long-term treatment with drug on/drug off cycles of paclitaxel + carboplatin. P: Parental cell line, T[n]: Resistant variant generated after ‘n’ cycles of doublet chemotherapy. Values on the X-axis indicate nM paclitaxel concentration in the drug combination (see Experimental Procedures for dosing details). Each data-point represents mean + SD of 8 replicates.
(B, D) IC50 plots for H1299 and H1355 resistant cell line variants. IC50 values represent nM paclitaxel concentration in the 2:3 wt/wt drug combination. Data represents IC50 mean + SD of >4 replicate assays. P values are from post-test for linear trend following one-way ANOVA.
(E, G) Resistance was validated in liquid colony formation assays. Representative plate images are shown. Drug values indicate nM concentration of paclitaxel in the 2:3 wt/wt doublet.
(F, H) Dose response curves were generated by counting stained colonies from colony formation assays. For parental cell lines, additional plates were treated with lower doses from 40 nM highest. Error bars represent mean + SEM.
(I, J) H1299 Parental and H1299 T18 tumor bearing mice were randomized (n=8 per group) to receive vehicle or docetaxel + cisplatin once a week, for 3 weeks. Tumor volumes were measured after each treatment cycle (C1, C2, C3). Error bars represent mean + SEM. Groups were compared using two-way ANOVA followed by Sidak’s multiple comparison tests. H1299 Parental xenografts, two-way ANOVA: **P=0.002, Sidak’s test at C3: ****P<0.0001; H1299 T18 xenografts, two-way ANOVA: P value not significant (n.s.).
See Table S1 and related Fig S1, S2 and S3.
Resistant cell line variants show decreased response to taxane + platin chemotherapy in vivo and cross-resistance to multiple drugs in vitro
To validate the taxane-platin resistance phenotype in vivo, we grew subcutaneous xenografts of H1299 Parental and H1299 T18 cells and treated the tumor bearing mice with 3 cycles of docetaxel + cisplatin doublet chemotherapy. While H1299 Parental xenografts showed a dramatic reduction in tumor burden compared to the vehicle-treated group (Fig 1I, **P=0.002), H1299 T18 tumors showed a non-significant response, confirming resistance (Fig 1J). This also confirmed cross-resistance to docetaxel + cisplatin standard therapy.
Consistent with previously published reports that suggested the involvement of MDR1 in taxane resistance (Lemontt et al., 1988; Roninson et al., 1986), we detected increased mRNA and protein expression of MDR1 in both H1299 and H1355 resistant variants (Fig S1A–D), decreased drug accumulation (Fig S1E) and partial re-sensitization to the doublet upon genetic/pharmacological inhibition (Fig S1F–H). To characterize the multi-drug resistance phenotype, we tested several standard and targeted agents (Fig S2A). Resistant variants were found to be cross-resistant to docetaxel, doxorubicin, vinorelbine and depsipeptide, which are known MDR1 substrates (Fig S2B). Cells remained sensitive to carboplatin as single agent, consistent with the low dose used and its established mechanism of action (Busschots et al., 2015). Extended drug-free culturing for >4 months resulted in partial reversal of paclitaxel + carboplatin resistance (Fig S2C–F), suggesting transient mechanisms in addition to stable changes. When we expanded our panel of drug resistant models to H1693 and HCC4017 cell lines, we found that both developed taxane-platin resistance upon long term exposure (Fig S3A–D), but HCC4017 T5 did not show increased MDR1 (Fig S3E–H). These findings led us to investigate other molecular changes in taxane-platin resistance.
Gene expression profiles of preclinical models yield a resistance-associated gene signature
To investigate the molecular changes accompanying the development of NSCLC resistance to chemotherapy, we performed genome-wide mRNA expression profiling of the entire progressively resistant, isogenic H1299 and H1355 cell line series. We fitted a linear regression model on microarray data to systematically identify genes that showed a progressive increase or decrease in expression consistent with increasing drug resistance represented by the log transformed IC50 values across the entire series of progressed lines. We identified 3752 differentially expressed genes in the H1299 resistant series and 595 genes in the H1355 resistant series at a false discovery rate of 0.1 (Fig 2A). We then performed stringent filtering of expression data to only select for genes that exhibited overlap between the two progressively resistant NSCLC cell line models. We further required these changes to occur in vivo in H1299 xenografts. 51 up-regulated and 59 down-regulated genes overlapped between the H1299 and H1355 resistant cell line series (Fig 2B), while intersection with xenograft tumor profiles (H1299 T18 versus H1299 Parental xenografts, Fig 2C) identified 14 up-regulated and 21 down-regulated genes whose expression differences were sustained in vivo (Fig 2D). These 35 genes (Fig 2E) formed our preclinical resistance signature.
Figure 2. Gene signature from chemoresistant models clusters neoadjuvant treated NSCLC patients based on relapse-free outcome, and identifies KDM3B as a significant contributor to poor recurrence-free survival.
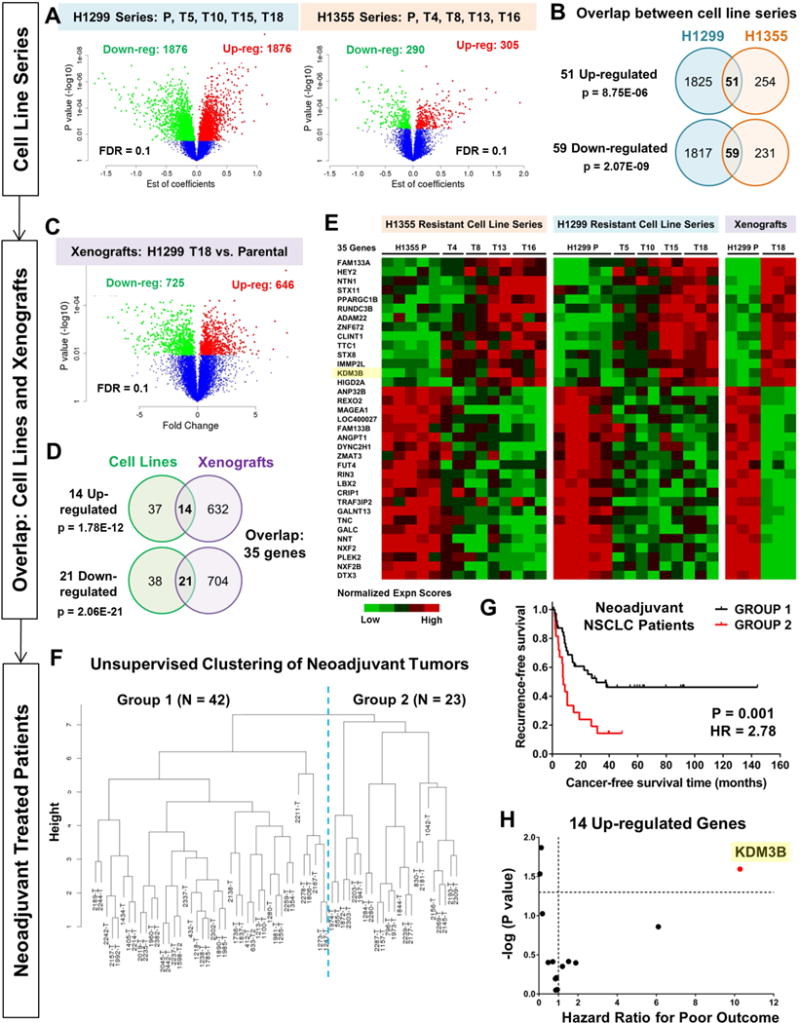
(A) Linear regression model was fitted on microarray data to identify genes that were progressively up/down-regulated with increasing drug resistance. Parental cell lines (P) and four resistant variants per model were analyzed. Differentially expressed genes are represented in the volcano plots (red: up-regulated; green: down-regulated). FDR 0.1
(B) Common up- and down-regulated genes across the two resistant cell line series are shown. P values are from hypergeometric tests.
(C) Differential gene expression analysis on xenograft microarray data (H1299 T18 resistant vs H1299 Parental) using student’s t-test. FDR 0.1
(D) Gene lists obtained from cell line and xenograft microarray analyses were overlapped to identify common genes (14 up-regulated, 21 down-regulated). P values are from hypergeometric tests.
(E) Heat map representation of the expression pattern of 35-gene resistance signature in resistant cell lines and xenografts.
(F) Using mRNA expression of 35 genes, unsupervised hierarchical clustering of neoadjuvant treated NSCLC patients (n=65, mainly taxane + platin treated) was found to separate the patients into two major groups.
(G) Kaplan-Meier survival analysis of the two groups of neoadjuvant treated NSCLC patients revealed significant differences in cancer recurrence-free survival (P=0.001, Hazard Ratio=2.78, 95% CI, 1.46–5.29). Survival P value was adjusted for clinical covariates (Cox multivariate regression, Table S3).
(H) Cox multivariate regression identified individual contributions of the 35 genes to poor recurrence-free survival (Table S4). X-axis depicts hazard ratios i.e. exp (regression coefficient) and Y-axis represents –log (P values) for the 14 up-regulated genes. KDM3B showed the largest hazard risk for poor recurrence-free patient survival (Hazard ratio=10.28, P=0.025).
See Tables S2–S4.
Evaluation of preclinical resistance signature in neoadjuvant treated NSCLC patient tumors identified KDM3B as an important correlate of poor recurrence-free outcome and a druggable resistance target
To identify clinically relevant drug resistance targets, we tested our 35-gene resistance signature on a cohort of 65 NSCLC patients (annotated in Table S2) who had received platin-based neoadjuvant chemotherapy, with taxane + platin doublet administered prior to surgical resection. Resected tumor samples were profiled by microarrays. Based on the 35-gene preclinical signature, unsupervised hierarchical clustering separated the chemotherapy-treated patient tumors into two major groups (Fig 2F). Kaplan-Meier survival analysis revealed significant differences in recurrence-free survival (Fig 2G). Group 2 exhibited significantly worse cancer recurrence-free prognosis than Group 1 patients (Hazard Ratio=2.78, P=0.001, adjusted for clinical covariates in Table S3).
We further evaluated the individual contribution of the 35 genes in the signature using Cox multivariate regression (Table S4) and focused on up-regulated genes as potential therapeutic targets. Among the 14 genes that were up-regulated in preclinical resistance models, the gene that showed the largest hazard risk for poor recurrence-free outcome in neoadjuvant treated NSCLC patients was the JumonjiC (JmjC) lysine demethylase, KDM3B (Hazard Ratio=10.28, P=0.025, Fig 2H), a druggable enzyme. Notably, two of the downregulated genes in our 35-gene signature, MAGEA1 and ANGPT1, are known to be suppressed by KDM3B (GSE30294 on GEO) (Kim et al., 2012). We thus decided to explore KDM3B given that it represents an actionable enzyme target.
Neoadjuvant treated NSCLC tumors show increased KDM expression
KDM3B protein levels were evaluated in the same cohort of neoadjuvant chemotherapy treated NSCLC tumors by immunohistochemistry (IHC) of specimens available in a tissue microarray. Group 2 patients (who had poor recurrence-free survival) showed higher overall KDM3B IHC scores compared to Group 1 patients (Fig 3A). We then evaluated the mRNA expression of other members of the KDM enzyme family in the NSCLC patients (66 neoadjuvant treated + 209 chemo-naïve, annotated in Table S2). NSCLC patient tumor cells surviving standard neoadjuvant chemotherapy expressed higher overall KDM3A and KDM4A mRNA levels compared to chemo-naïve tumors (Fig 3B, P value adjusted for clinical variables by multivariate analysis shown in Table S5).
Figure 3. Neoadjuvant-treated NSCLC patient tumors and chemoresistant cell lines exhibit elevated expression of JmjC histone lysine demethylases (KDMs) and altered histone methylation.
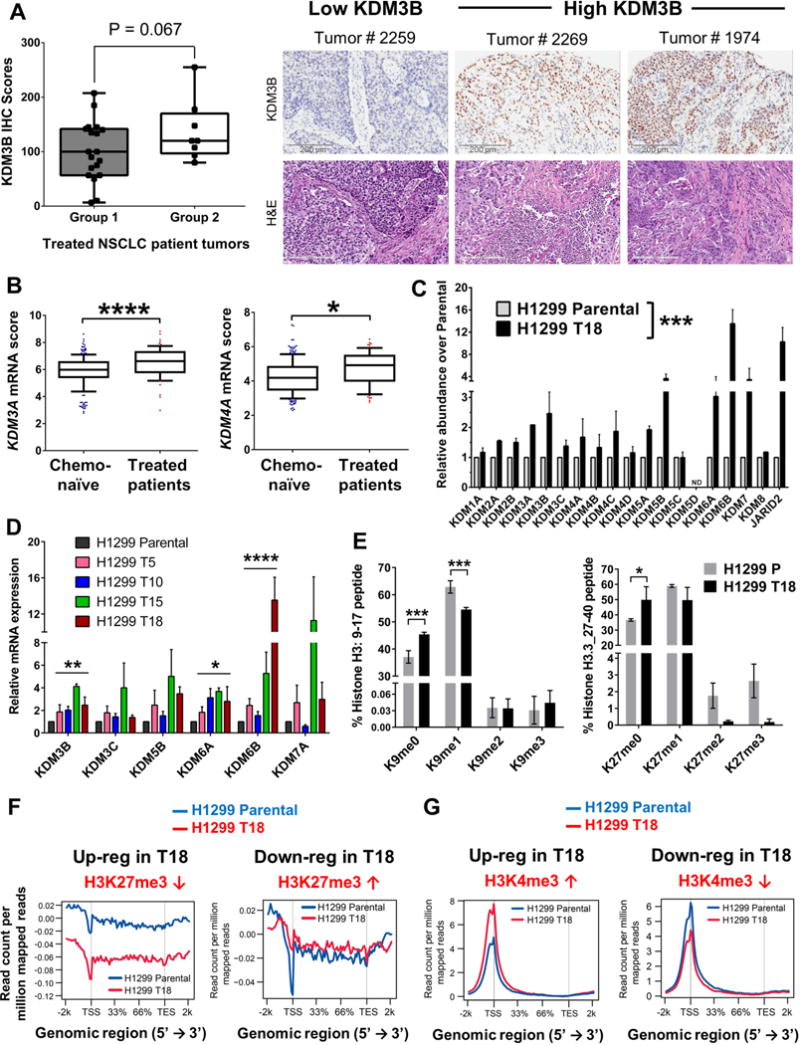
(A) Group 2 of neoadjuvant treated patients (poor recurrence-free survival) showed higher KDM3B IHC scores compared to Group 1 patients. Representative images of KDM3B IHC and corresponding tumor H&E staining are shown. Scale bar = 200 μm
(B) Chemotherapy-treated patient tumors showed higher mRNA expression scores of KDM3A and KDM4A than chemo-naïve tumors. Y-axis depicts Log2 normalized expression scores. The line indicates median value and whiskers the 10th and 90th percentiles. P values are adjusted after multivariate analysis of clinical variables; *P<0.05, ****P<0.0001
(C) Paclitaxel + carboplatin resistant H1299 T18 cell line showed increased mRNA expression of several JmjC KDMs compared to H1299 Parental, by qRT-PCR. Error bars=mean + SEM. Two-way ANOVA, ***P<0.001
(D) Isogenic H1299 resistant cells showed progressive increases in JmjC KDM expression. Error bars=mean + SEM. P values are from one-way ANOVA post-test for linear trend, *P<0.05, **P<0.01, ****P<0.0001.
(E) Global changes in histone lysine methylation were measured by mass spectrometry. Y-axis denotes the % of the stated histone peptides (left, H3: 9–17; right, H3.3: 27–40) that showed K9 or K27 methylation respectively. Left panel error bars =mean + SEM, n=3. Right panel error bars=mean + SEM, n=2. P values are from Fisher’s LSD test post two-way ANOVA, *P<0.1, ***P<0.001.
(F) H3K27me3 ChIP-Seq enrichment plots for up- and down-regulated genes identified by RNA-Seq (FDR 0.05) in H1299 T18 vs H1299 Parental cells. X-axis represents the genomic regions from 5′ to 3′ and the Y-axis represents read depth.
(G) H3K4me3 average distribution plots for differentially expressed genes in H1299 T18 vs H1299 Parental cells (left panel upregulated, right panel downregulated genes). TSS, transcription start site; TES, transcription end site.
See also Table S5 and Fig S4.
Chemoresistant cells show increased expression of JumonjiC histone lysine demethylases and altered histone methylation levels
Although KDM3B was the only histone demethylase that made it into the 35-gene resistance signature because it was progressively upregulated throughout the resistant series, was common to both H1299 and H1355 cell line models and showed increased expression in vivo, several other JmjC family members were also overexpressed in resistant models. For example, KDM5A, JMJD4 and JMJD8 were among the other up-regulated genes in the H1299 resistant cell line series (FDR=0.1, p<0.05). In vivo grown H1299 T18 tumors exhibited increased expression of KDM3A, KDM4B, KDM5A, KDM5B, KDM6B, KDM7A, JARID2, JMJD4 and JMJD6 (Fig S4A).
We therefore profiled the JmjC KDM gene family in chemoresistant vs parental cells by qRT-PCR and found general upregulation of JmjC KDMs including KDM3B (Fig 3C and Fig S4B). We also noted strong upregulation of the H3K27 demethylases KDM6A, KDM6B and KDM7A, and modest upregulation of the H3K4 demethylases KDM5A and KDM5B in H1299 T18 cells (Fig 3C). We then queried the entire progressively resistant H1299 series and found a consistent increase in KDM mRNA expression with increasing resistance to paclitaxel + carboplatin chemotherapy (Fig 3D).
To investigate the functional effects of JmjC KDM up-regulation in resistant cells, we performed mass spectrometry for global histone post-translational modifications in histone extracts from H1299 T18 and H1299 Parental cells. Consistent with the up-regulation of the H3K9me1 demethylase KDM3B, we detected a global decrease in H3K9me1 and a subsequent increase in H3K9me0 in H1299 T18 vs Parental cells (Fig 3E, left). We also found decreased K9me1 in K14 acetylated H3 and a corresponding increase in K9/K14 unmodified (me0, ac0) levels in both H1299 T18 and H1355 T16 cell lines (Fig S4C). In agreement with strong upregulation of the histone3 K27me3/me2 demethylase KDM6B in H1299 T18 cells, we observed decreased K27me3 and K27me2 global levels and a corresponding increase in K27me0 (Fig 3E, right) on H3.3, a histone3 variant deposited specifically in actively transcribed regions (Szenker et al., 2011).
To gain insights into the effect of increased H3K27 and H3K4 demethylases on the transcriptional output of chemo-resistant cells, we performed ChIP-Seq for H3K27me3 and H3K4me3 marks in H1299 Parental and H1299 T18 cells. Firstly, correlating with increased expression of H3K27me3 demethylases, we observed that H1299 T18 resistant cells showed marked decrease in the “average” distribution of H3K27me3 across all transcribed regions of the genome (Fig S4D). There was however no decrease in “average” H3K4me3 distribution across all genes (Fig S4E). To specify the transcribed regions that exhibited changes in H3K27me3 and to identify altered H3K4me3 enrichment, we used RNA-Seq to classify differentially up-regulated and down-regulated genes in H1299 T18 versus H1299 Parental cells (FPKM≥1; FDR q=0.05) and then evaluated their histone marks. We found that the up-regulated genes in H1299 T18 showed an overall decrease in the repressive H3K27me3 signal throughout TSS and gene bodies (Fig 3F, left), whereas down-regulated genes selectively showed increased H3K27me3 at the TSS (Fig 3F, right). Likewise, ChIP-Seq for H3K4me3 revealed an increase in H3K4me3 at the TSS of up-regulated genes (Fig 3G, left) while down-regulated genes exhibited reduced H3K4me3 at the TSS (Fig 3G, right). We thus detected functional changes in the H3K4/H3K27 methylation landscape of resistant versus parental cells that corresponded with transcriptional activation or repression of differentially expressed genes.
Chemoresistant cells are hypersensitized to JmjC demethylase inhibitors
To test the survival dependency of chemoresistant cells on JmjC KDMs, we first employed a pan-selective JmjC demethylase inhibitor, JIB-04 (Wang et al., 2013). H1299 T18 cells were several-fold hypersensitized to JIB-04 E-isomer compared to parental cells (Fig 4A) while the inactive Z isomer had no effect. We then tested the KDM5/KDM6 subfamily inhibitor, GSK-J4 (Kruidenier et al., 2012). Again, H1299 T18 showed higher sensitivity to GSK-J4 compared to parental cells and there was no effect on cell viability with the inactive GSK-J5 (Fig 4B).
Figure 4. Chemoresistant cell lines show increased sensitivity to JmjC KDM inhibitors.
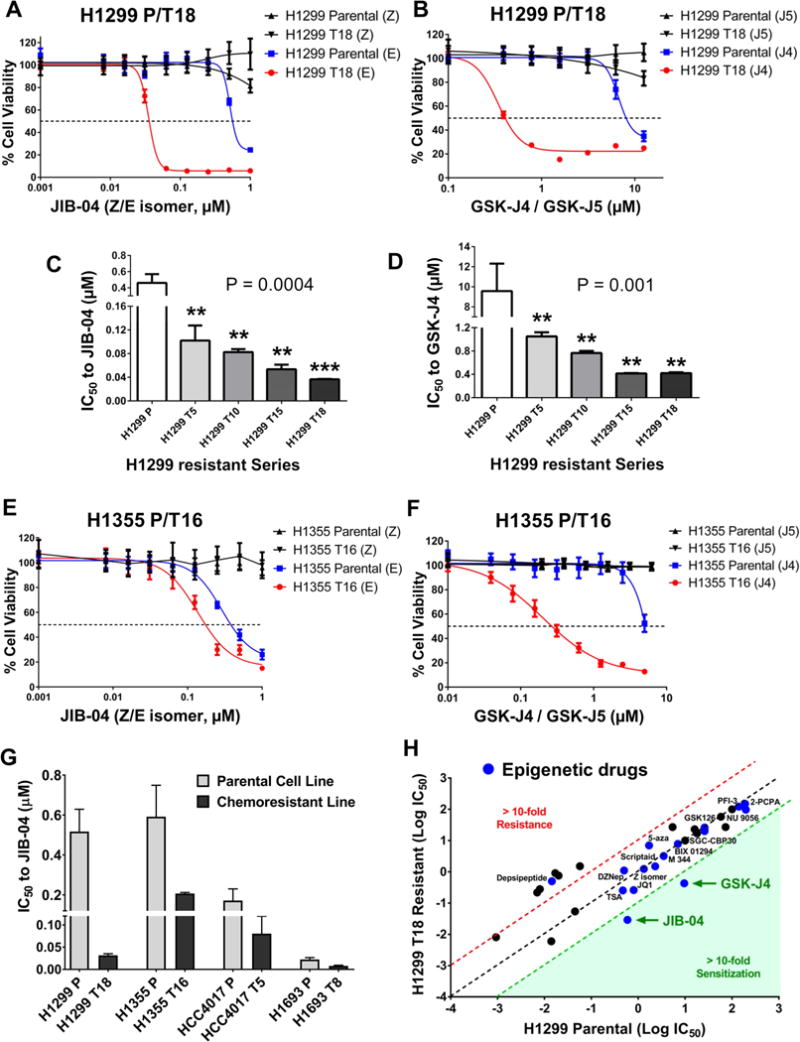
(A, B) H1299 T18 cells showed hypersensitivity to JIB-04 active ‘E’ isomer (A) as well as GSK-J4 (B), compared to H1299 Parental. Inactive drug isomers (JIB-04 ‘Z’ isomer and GSK-J5) had no effect. Each data point represents mean + SD from 8 replicates per drug dose.
(C, D) IC50 plots for H1299 resistant series. Data represents mean + SD. Statistical significance was tested by one-way ANOVA, followed by Dunnett’s multiple comparisons with H1299 Parental, **P<0.01, ***P<0.001. P values listed on graphs are from post-test for linear trend.
(E, F) H1355 T16 resistant variant was hypersensitized to JIB-04 active ‘E’ isomer (E) and GSK-J4 (F) but not to inactive isomers, compared to H1355 Parental. Each data-point represents mean + SD from 8 replicates per drug dose.
(G) IC50 values show general hypersensitivity of H1299 T18, H1355 T16, HCC4017 T5 and H1693 T8to JIB-04. Data represents mean + SEM. Two-way ANOVA, P<0.01.
(H) Log10 IC50 values for standard, targeted and epigenetic drugs for H1299 T18 chemoresistant vs H1299 Parental cells. Epigenetic drugs (blue dots) include inhibitors of KDM, LSD1, HMT, HDAC, HAT, DNMT and BRD. Red dotted line denotes the 10-fold cut-off for cross-resistance and green dotted line is the 10-fold cut-off for sensitization.
See also Fig S5–S6, Table S6.
To investigate whether increased KDM expression and pharmacological sensitivity to JmjC inhibitors accompanied the progressive increase in chemoresistance, we queried the entire H1299 resistant series. In agreement with increased KDM upregulation (Fig 3D), we saw a consistent decrease in IC50 values to JIB-04 and GSK-J4 as cells progressed from H1299 Parental to the H1299 T18 variant (Fig 4C, 4D).
To explore the generality of increased sensitivity of taxane + platin resistant NSCLC cells to JmjC inhibitors, we tested other resistant cell line variants. H1355 T16, which had up-regulation of KDM3B and KDM6A (Fig S4B), showed higher sensitivity to JIB-04 (Fig 4E) and GSK-J4 (Fig 4F), compared to H1355 Parental. Other taxane-platin resistant cell lines including HCC4017 T5 and H1693 T8 were also more sensitive to JIB-04 than their corresponding parental cells (Fig 4G, S5A–B), with a fold-sensitivity proportional to their level of taxane-platin resistance. Of note, HCC4017 and H1693 parental cell lines were already highly sensitive to the KDM5/KDM6 -specific inhibitor GSK-J4 (Fig S5C). Their HCC4017 T5 and H1693 T8 resistant variants, although hypersensitized to JIB-04, did not show any further reduction in GSK-J4 IC50 values (Fig S5C), suggesting that these cells may have acquired resistance independently of H3K4 or H3K27me3 demethylases. Indeed, qRT-PCR analysis revealed modest up-regulation of other KDMs in HCC4017 T5 and H1693 T8 (Fig S5D–E), including known JIB-04 targets (Wang et al., 2013).
To evaluate if the hypersensitivity of taxane-platin resistant cells was specific to JmjC KDM inhibitors or represented a general epigenetic susceptibility, we tested other compounds inhibiting 2-OG oxygenases, histone methyltransferases (HMT), LSD1 demethylase, histone acetyltransferases (HAT), histone deacetylases (HDAC), DNA methyltransferases (DNMT) or bromodomains (BRD). We did not see significant differences in IC50 to any of these drugs between parental cells and taxane-platin resistant variants (Fig 4H, Fig S6, Table S6). Of particular note was the lack of hypersensitivity to HMT inhibitors and 2-OG oxygenase inhibitors (Table S6), consistent with no general expression changes in these enzyme families (GSE77209). Our studies have thus uncovered a specific, targetable epigenetic vulnerability to Jumonji inhibition that can be exploited to treat NSCLCs that develop resistance to taxane + platin chemotherapy.
JIB-04 or GSK-J4 treatment results in reversal of a subset of transcriptional programs deregulated in taxane-platin resistant cells
In agreement with the hypersensitivity of chemoresistant cells to JmjC inhibitors, we observed that short-term 24 h treatment with 0.2 μM JIB-04 (Fig S7A–B) or 1 μM GSK-J4 (Fig S7C–D) led to gene expression changes selectively in H1299 T18 resistant cells with minimal transcriptional changes in H1299 Parental cells (P≤0.05). Importantly, JmjC inhibitor treatment of H1299 T18 partially reversed expression changes acquired during the development of taxane-platin resistance (Fig S7E–F, Table S7). Furthermore, gene set enrichment analysis (GSEA) using curated gene sets from molecular signatures database (MSigDB) (Subramanian et al., 2005) revealed reversal of a subset of transcriptional programs in H1299 T18 cells upon JmjC inhibitor treatment, with a significant overlap between JIB-04 and GSK-J4 (Fig 5A). Out of the 214 gene sets that were depleted after resistance development in H1299 T18 cells, 38 gene sets (~20%) were enriched (reversed) by both JIB-04 and GSK-J4. These 38 overlapping gene sets (Table S8) included functionally relevant categories such as genes with H3K4me3 and H3K27me3 marks (MSigDB, M1941) (Meissner et al., 2008) shown in Fig 5A, left panel, as well as SUZ12 ChIP-on-chip targets, indicative of genes regulated by H3K27me3 (MSigDB, M9898, Table S8) (Ben-Porath et al., 2008). Also included in the overlap were apoptotic gene sets such as MDM4 target genes, TP63 target genes and TP53 target genes (Table S8). Gene set representing genes up-regulated in apoptotic tissues (MSigDB, M5681) (Martoriati et al., 2005) enriched by both JmjC inhibitors is shown in Fig 5A, right panel.
Figure 5. JIB-04 and GSK-J4 cause reversal of deregulated transcriptional programs, regain of H3K4me3-H3K27me3 promoter bivalency and induction of pro-apoptotic genes in chemoresistant cells.
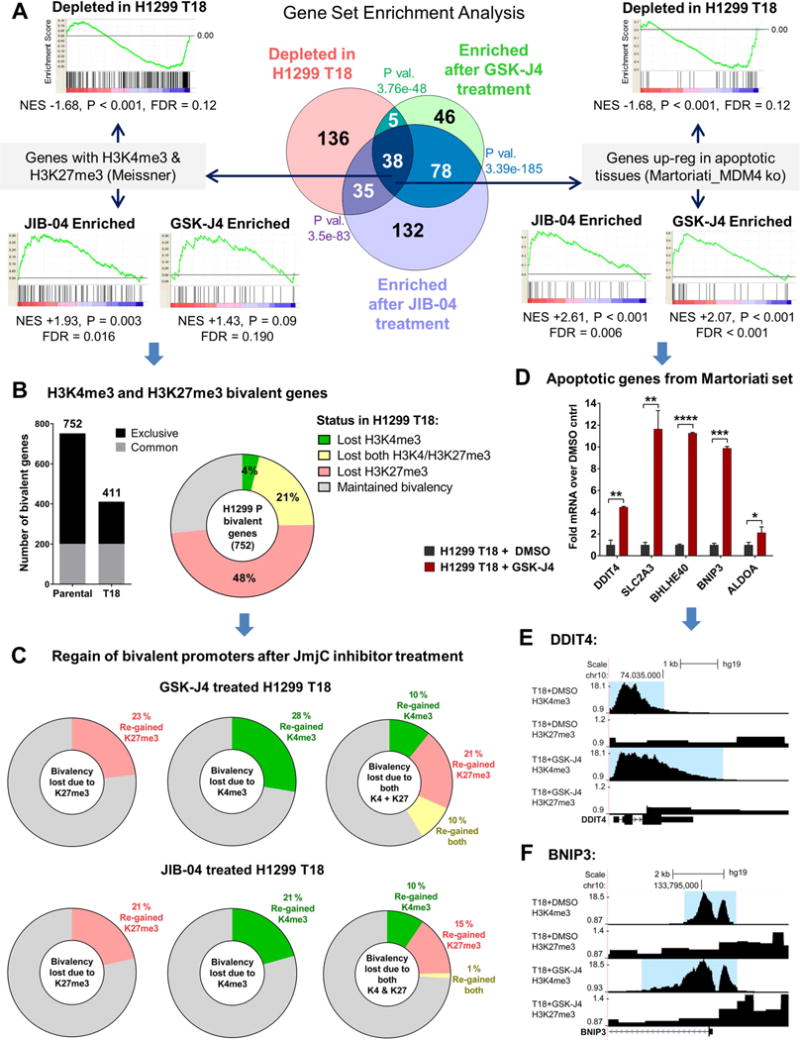
(A) GSEA of differentially expressed gene lists from microarray against MSigDB curated gene sets revealed transcriptional programs that were depleted in H1299 T18 resistant vs H1299 Parental cells are enriched by 24 h treatment with JIB-04 (0.2 μM) or GSK-J4 (1 μM). P values signify overlap by hypergeometric tests. Two of the 38 overlapping gene sets are shown. Left: Genes with H3K4me3 and H3K27me3 (Meissner et al, M1941), Right: Genes up-regulated in apoptotic tissues (Martoriati et al, M5681). NES: Normalized Enrichment Score; P values under GSEA plots are nominal p-values.
(B) ChIP-Seq analysis confirmed loss of bivalent genes in H1299 T18 vs. Parental cells. Number of bivalent genes (bar graph) and breakdown by lost or gain of marks (pie) are shown.
(C) Genes in each of the bivalency lost categories depicted in the pie chart in (B) were probed for their regain status (at least a 1.5-fold increase) in GSK-J4 and JIB-04 treated H1299 T18 cells.
(D) Genes from the Martoriati et al apoptotic gene set identified in (A) were confirmed to be up-regulated by GSK-J4 by RNA-seq. Error bars indicate mean + SEM from biological duplicates. Significance was tested using the powerful False Discovery Rate (q) approach of two-stage linear step-up procedure of Benjamini, Krieger and Yekutieli; *q<0.05, **q<0.01, ***q<0.001, ****q<0.0001.
(E) ChIP-Seq traces for the pro-apoptotic, up-regulated gene DDIT4, showing increased H3K4me3 (blue highlight) in GSK-J4 vs DMSO treated H1299 T18 cells.
(F) ChIP-Seq traces for BNIP3 up-regulated gene, showing broader H3K4me3 enrichment in GSK-J4 treated vs DMSO treated H1299 T18 cells. GSK-J4: 1 μM, 24 h for both (E) and (F).
See also Fig S7–S8, Tables S7–S8.
To gain insights into the H3K4me3 and H3K27me3 dynamics revealed by GSEA (Fig 5A, left), we performed detailed promoter bivalency analyses of our ChIP-Seq data. We first identified H3K4me3 and H3K27me3 bivalent gene promoters in H1299 Parental and H1299 T18 cells. Genes were classified as bivalent if both H3K4me3 and H3K27me3 were ≥4-fold over input in the TSS±500bp region. We found that there was an overall decrease in the total number of bivalent genes in H1299 T18 compared to Parental cells (Bar graph in Fig 5B). A great majority of these genes (~80%) showed at least a 2-fold signal loss. We next classified the “bivalency lost” genes by loss of H3K4me3, loss of H3K27me3 or loss of both marks (Pie chart in Fig 5B). Many of the genes which had lost their bivalency in H1299 T18 compared to H1299 Parental, regained these marks (at least a 1.5-fold increase) after short-term GSK-J4 or JIB-04 treatment of T18 cells (shown by category in Fig 5C).
To validate the apoptotic gene set enrichment uncovered by GSEA on our microarray data, we queried known apoptotic genes from the Martoriati gene set (Fig 5A, right) in our RNA-seq dataset. As shown in Fig 5D, pro-apoptotic genes were significantly up-regulated by short-term JmjC inhibitor treatment of T18 cells. Additionally, these and some other pro-apoptotic/anti-proliferative genes were confirmed by qRT-PCR to be up-regulated by both JIB-04 and GSK-J4, whereas proliferative/oncogenic genes were significantly down-regulated in JmjC inhibitor-treated T18 cells (Fig S8A). ChIP-Seq traces of sample pro-apoptotic genes up-regulated by JmjC inhibitors, DDIT4 and BNIP3, are shown in Fig 5E and 5F respectively, exhibiting greater enrichment of the H3K4me3 activating mark. In contrast, histone marks at the MDR1 locus were not altered by JmjC inhibitor treatment nor was MDR1 expression as expected from its genetic amplification (Fig S8B–F).
These analyses confirmed that major changes in the H3K4me3/H3K27me3 dynamics accompany the development of chemoresistance and that short-term JmjC inhibitor treatment can partly reverse these changes, killing drug-resistant cells with high potency.
Chemoresistant tumors show increased response to GSK-J4 and JIB-04 in vivo
To evaluate the response of taxane-platin chemoresistant NSCLC cells to JmjC inhibitors in vivo, we established subcutaneous xenografts of H1299 Parental and H1299 T18, and compared their response to GSK-J4 or JIB-04. GSK-J4 caused a significant reduction in tumor volumes selectively in H1299 T18 xenografts (P<0.0001) (Fig 6A–B). Treated T18 tumors also showed a significant decrease in final tumor weights (P<0.01) (Fig 6B, right), without mice body weight loss (Fig S9A). For the JIB-04 study, tumor-bearing mice were randomized to receive 5 mg/kg, 20 mg/kg or 50 mg/kg treatment or vehicle. At all doses, JIB-04 resulted in greater percent reduction in final tumor volumes of H1299 T18 compared to H1299 Parental (Fig 6C–D). JIB-04 treatment preferentially slowed T18 tumor growth and decreased tumor growth rate as seen by increased tumor doubling times (Fig 6E), without any toxicity on treated mice (Fig S9A).
Figure 6. JmjC inhibitor-treated chemoresistant tumors have lower histone demethylase activity and increased response to GSK-J4 and JIB-04 in vivo.
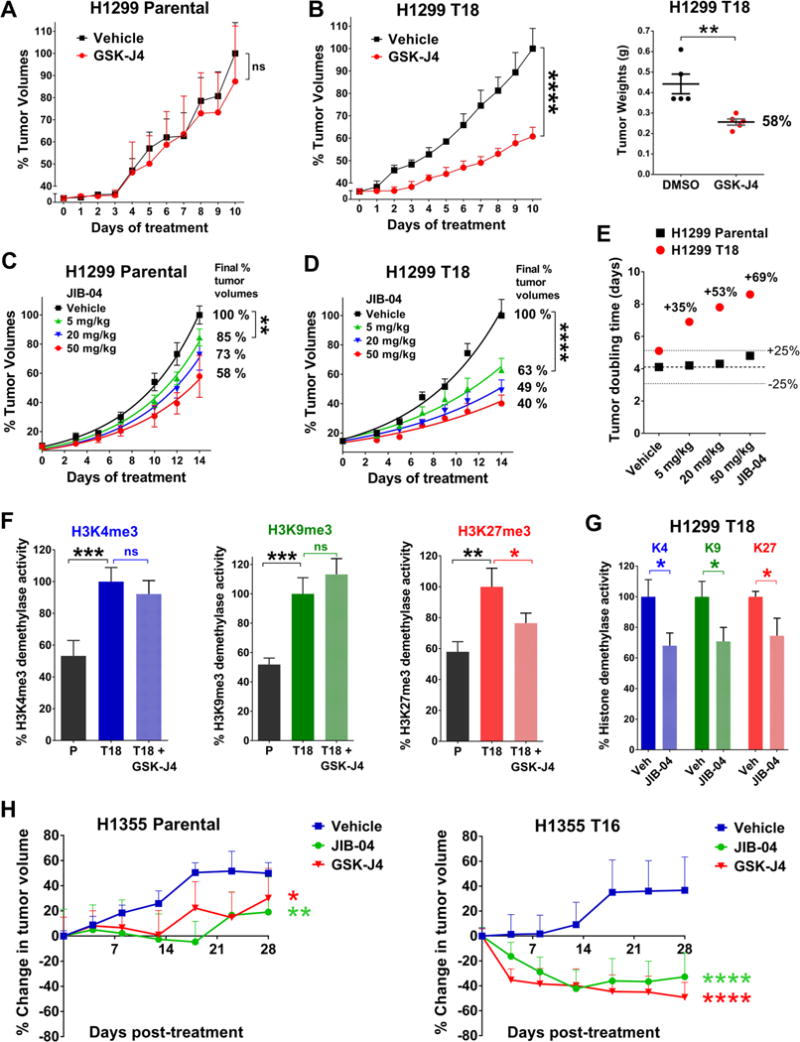
(A, B) GSK-J4 treatment significantly reduced final tumor burden of H1299 T18 xenografts (B); response in H1299 Parental xenografts was not significant (A). Y-axis depicts % tumor volumes normalized to average vehicle tumor volume at the end of treatment. Data represent mean + SEM, n=5 mice per group. P values for tumor volume growth are from two-way ANOVA, ns = not significant, ****P<0.0001. Tumor weights (B, right) were compared using two-tailed unpaired t-test, **P=0.007.
(C, D) At all doses, JIB-04 caused a greater percent reduction in H1299 T18 tumor volumes compared to H1299 Parental tumors. Data represent mean + SEM, n=6–8 mice per group. Y-axis depicts % tumor volumes normalized to average vehicle tumor volume on Day 14. Exponential growth curves were fitted using non-linear regression. Drug response was compared using two-way ANOVA. For 5 mg/kg vs. vehicle group in H1299 Parental: **P=0.001 and H1299 T18: ****P<0.0001.
(E) JIB-04 treatment slowed tumor growth and increased doubling time of treated H1299 T18 tumors by 69%, with minimal effect on H1299 Parental tumors (<25% change). Doubling times were derived from exponential growth curves in (C, D).
(F) H3K4/K9/K27 me3 demethylase activity in tumor lysates from GSK-J4 treated mice P values are from Fisher’s LSD test post one-way ANOVA. *P<0.1, **P<0.01, ***P<0.001.
(G) JIB-04 treated H1299 T18 xenografts showed significant reduction in H3K4me3, H3K9me3 and H3K27me3 demethylase activity. P values represent two-tailed unpaired t-tests, *P≤0.05.
(H) % change in tumor volumes relative to the treatment start volume (~120 mm3) is shown for H1355 Parental (left) and H1355 T16 (right) xenografts. P values are from two-way ANOVA, *P<0.05, **P<0.01, ****P<0.0001.
See also Fig S9.
To evaluate whether the targeted KDM enzymatic activity was reduced in the JmjC inhibitor-treated tumors in vivo, we measured histone demethylase activity in drug vs. vehicle treated tumor lysates by ELISA. Chemoresistant H1299 T18 xenografts had higher H3K4me3, H3K9me3 and H3K27me3 demethylase activity compared to H1299 Parental tumors (Fig 6F), in agreement with increased KDM expression. KDM6 inhibitor GSK-J4 significantly inhibited H3K27me3 demethylase activity in H1299 T18 xenografts (Fig 6F, right), without reducing H3K4me3 or H3K9me3 demethylase activity (Fig 6F, left and middle panels). Pan-JmjC inhibitor JIB-04 significantly inhibited H3K4me3, H3K9me3 as well as H3K27me3 demethylase activity in H1299 T18 xenografts (Fig 6G). In addition, we saw evidence of cytostatic/cytotoxic effects in JmjC inhibitor-treated chemoresistant xenografts (Fig S9C–E).
We then validated the hypersensitivity of chemoresistant tumors to JIB-04 and GSK-J4 in an additional in vivo model, comparing treatment response in H1355 Parental versus H1355 T16. JmjC-inhibitor treated H1355 Parental xenografts continued to grow in volume throughout the 28 days of treatment (Fig 6H, left), whereas treated H1355 T16 tumors exhibited significant tumor shrinkage (Fig 6H, right). No appreciable toxicity was seen in JIB-04 or GSK-J4 treated mice (Fig S9B). Both in vivo models confirmed the increased sensitivity of taxane + platin chemoresistant tumors to JIB-04 and GSK-J4. Taken together, these data provide proof-of-principle for the use of JmjC inhibitors to target drug resistant NSCLCs.
JmjC KDM inhibitors synergize with taxane-platin standard chemotherapy and prevent emergence of drug tolerance
Given the hypersensitivity of chemoresistant cells to JmjC inhibitors and the transcriptional reprogramming seen in resistant cells, we asked whether JIB-04 or GSK-J4 would synergize with taxane + platin chemotherapy in killing chemoresistant clones. Using JIB-04 or GSK-J4 doses that were pre-determined to not cause complete growth inhibition as single agents, both of these drugs were effective in synergistically inhibiting H1299 T18 chemoresistant colonies surviving taxane + platin treatment (indicated by positive delta Bliss in Fig 7A–B).
Figure 7. JmjC KDM inhibitors synergize with paclitaxel + carboplatin standard chemotherapy in blocking emergence of drug tolerance from chemo-sensitive NSCLCs in vitro and in vivo.
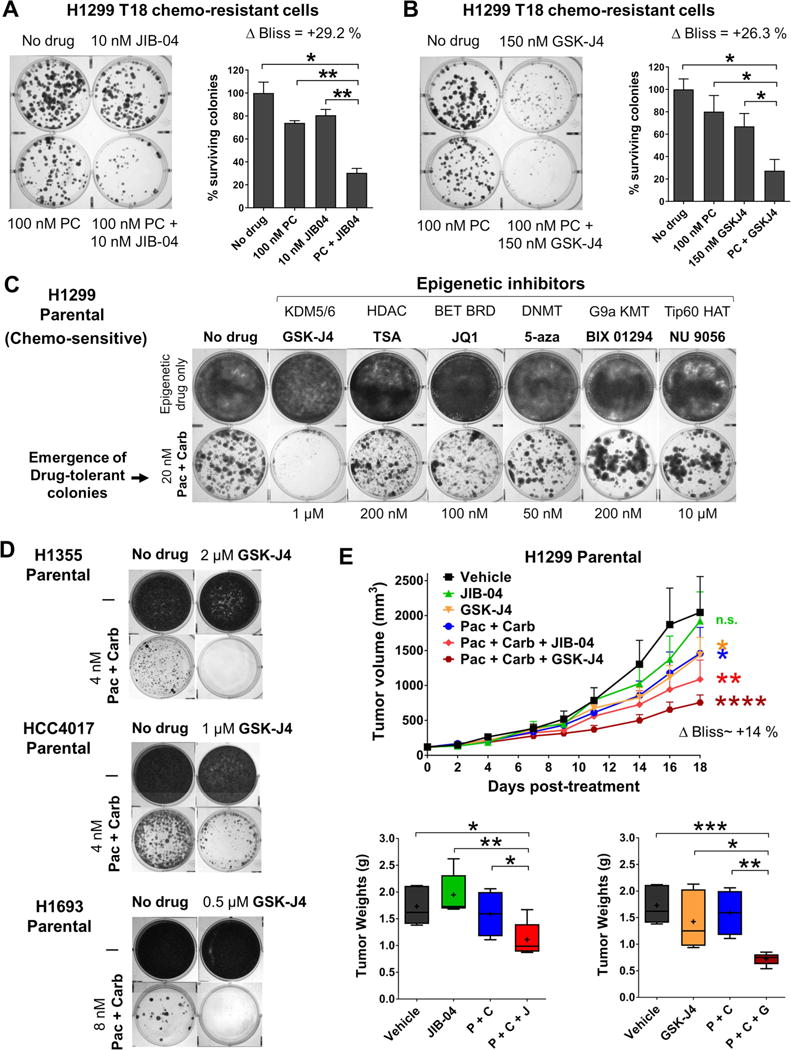
(A, B) Combination of JIB-04 (A) or GSK-J4 (B) with standard paclitaxel + carboplatin chemotherapy synergistically inhibited colony formation from H1299 T18. Error bars represent mean + SD from duplicate assays. P values are from two-tailed unpaired t-tests, *P<0.1, **P<0.01. Response was greater than additive, indicated by positive ΔBliss.
(C) Sub-lethal doses of JmjC KDM inhibitor GSK-J4 (but not other epigenetic inhibitors) prevented the emergence of paclitaxel + carboplatin drug-tolerant colonies from chemo-sensitive H1299 Parental. Representative images from replicate assays (n=3) are shown.
(D) GSK-J4 also blocked the emergence of paclitaxel + carboplatin drug-tolerant colonies from other chemo-sensitive NSCLC cell lines: H1355, HCC4017 and H1693.
(E) H1299 Parental tumor volumes during in vivo combination treatment are shown in the top panel and tumor weights at sacrifice in the bottom graphs. Statistical tests on tumor volumes represent comparison of each treatment group with the Vehicle group by two-way ANOVA; n.s.=not significant, *P<0.05, **P<0.01, ****P<0.0001. ΔBliss for (Pac + Carb + JIB-04) combination = +13.8% and ΔBliss for (Pac + Carb + GSK-J4) = +13.9%, both values indicating synergy. P values for tumor weight comparisons are from two-tailed unpaired t-tests, *P<0.1, **P<0.01, ***P<0.001.
We also investigated blocking the emergence of drug-tolerant colonies from taxane-platin sensitive, chemo-naïve cell lines. H1299 Parental cells were exposed to paclitaxel + carboplatin under conditions that allowed for a surviving subpopulation. We then evaluated the impact of sub-lethal doses of various epigenetic compounds in inhibiting colony forming ability of these taxane-platin ‘persister’ cells (Fig 7C). Only the JmjC inhibitor prevented the emergence of drug-tolerant colonies from H1299 Parental cells, whereas inhibitors of other epigenetic enzymes did not (Fig 7C). Next, we assessed if JmjC inhibition could block the outgrowth of persister colonies from other chemo-sensitive NSCLC cell lines. H1355, HCC4017 and H1693 Parental cells were exposed to their respective pre-determined paclitaxel + carboplatin doublet concentrations that allowed for a surviving subpopulation. Sub-lethal doses of GSK-J4 inhibited the outgrowth of these taxane-platin drug-tolerant colonies (Fig 7D).
We therefore evaluated the impact of JmjC inhibitors in combination with standard taxane-platin chemotherapy in vivo. Combination of JIB-04 or GSK-J4 with paclitaxel + carboplatin chemotherapy resulted in significantly greater tumor growth inhibition of H1299 Parental xenografts than single agents and gave a synergistic response (Fig 7E top panel, positive delta Bliss). There was a significant reduction in tumor burden compared to either therapy alone (Fig 7E bottom, tumor weights), without general toxicity.
Our results thus present a new therapeutic opportunity not only for targeting of NSCLCs after development of drug resistance but also for possibly preventing the emergence of chemoresistant subpopulations and achieving greater response in chemo-sensitive lung cancers treated with standard taxane-platin chemotherapy.
Discussion
We have established preclinical models of NSCLC resistance to taxane-platin doublet chemotherapy and identified upregulation of JmjC histone lysine demethylases as an underlying epigenetic change co-developing with increasing chemoresistance and leading to progressive sensitization to JmjC KDM inhibitors. These findings define JmjC demethylases as promising therapeutic targets in drug resistant NSCLCs, and for potentially preventing the emergence of taxane-platin drug tolerance.
Our work suggests that NSCLC cells may dynamically express multiple JmjC KDMs, in line with recent similar observations in glioblastoma (Liau et al., 2017). Further, KDMs may have a role in not just survival from the first drug contact, but also in maintaining transcriptional plasticity and increasing epigenetic alterations during the progression towards robust drug resistance. Chemoresistant cells appear to be epigenetically addicted, becoming specifically hypersensitized to JmjC KDM inhibitors. Future genetic studies will need to determine which JmjC demethylases are the key mediators of this phenotype.
Due to their ability to regulate multiple transcriptional programs at once, epigenetic mechanisms might serve to restore the cellular signaling balance (Mair et al., 2014) that is perturbed by chemotherapy stress, acting as a defense mechanism to protect cells from further insults. It is unclear if JmjC enzyme overexpressing subpopulations exist in the original population or are acquired de novo, upon selective pressure. Our studies suggest that the resistance is likely manifested as a combination of both intrinsic and acquired changes. While GSK-J4 eliminated the emergence of drug resistant colonies in short-term colony formation assays, our long-term drug treatment studies revealed that resistant cells were also acquiring permanent/genetic changes over time, nevertheless maintaining their hypersensitivity to JmjC inhibitors.
Since our previous studies have shown that normal human bronchial epithelial cells are not sensitive to JmjC inhibition (Wang et al., 2013), our findings suggest that there is a therapeutic window for lung cancer therapy, while also raising the possibility of extending the utility of JmjC inhibitors to other drug resistant solid tumors. Pharmacological targeting of JmjC KDMs could help prevent the development of drug resistance while also providing a therapeutic option to treat chemoresistant tumors.
Experimental Procedures
Cell lines
NSCLC lines were obtained from the Hamon Cancer Center Collection (University of Texas Southwestern Medical Center). Cell lines were DNA fingerprinted using PowerPlex 1.2 kit (Promega) and confirmed to be mycoplasma-free using e-Myco kit (Boca Scientific). Cells were maintained in RPMI-1640 (Life Technologies Inc.) with 5% FBS at 37°C in a humidified atmosphere containing 5 % CO2.
In vitro drug assays
NSCLC lines were treated with paclitaxel + carboplatin combination, given in a ~2:3 wt/wt ratio, to mirror the clinical dosage values of 225 mg/m2 and 330 mg/m2, paclitaxel and carboplatin respectively. Considering the molecular weights of the two drugs, this translates to approximately a 1 to 3.4 molar ratio. Drugs were given in cycles, consisting of 4–5 days of drug treatment and 1–2 weeks of drug-free culturing to allow the surviving cells to repopulate. Treatment was started with 2×–3× IC50 doses and doses were incremented with increasing treatment cycles, ultimately reaching ~30×–50× IC50, depending on the cell line. Untreated parental cells were maintained at all times for comparison. Cell viability after 4-day treatments was assessed in 96-well plates using standard MTS assays (Promega). Drugs were tested in serial dilutions, totaling 8 different drug concentrations, with 8 replicates per concentration. Response was validated in replicate plates (n ≥ 3).
In vivo studies
Animals were housed under standard, sterile conditions at UTSW animal facility. All experiments were carried out under approved IACUC protocols and followed UTSW animal care procedures. Experimental details are provided in Supplemental information.
Patient tumors
Human specimens and clinical data were used after full de-identification under MD Anderson IRB approved/exempted protocols. This included both chemo-naïve and neoadjuvant treated tumors, and had complete histopathological and clinical annotation. Fresh frozen tumor samples from the time of resection were used for Illumina gene expression profiling and some were formalin-fixed, paraffin-embedded (FFPE) tumors for tissue microarrays.
Microarrays
Gene expression profiling was performed using Illumina HumanWG-6 V3 BeadArrays (for NSCLC patient tumors) or Illumina Human HT-12 V4 BeadArrays (for cell lines, xenografts). Cell line and xenograft microarrays included biological replicates (Cell lines: 5 for parental, 3 for most resistant variant, 2 for each intermediate time-point; Xenografts: 3 tumors each for parental and resistant group). Data were pre-processed using the R package mbcb for background correction (Ding et al., 2008), then log-transformed and quantile-normalized with the R package preprocessCore or using in-house MATRIX software (MicroArray TRansformation In eXcel). See Supplemental Information for microarray analysis details.
Statistical methods
All statistical tests were performed using GraphPad Prism 6/7. Dose response curves and IC50 values were also calculated using in-house DIVISA (Database of In VItro Sensitivity Assays; L. Girard unpublished). For synergy estimation, ΔBliss excess was calculated as shown previously (Wilson et al., 2014). Bliss expectation was calculated as A + B − (A × B), where A and B denote the fractional responses from drugs A and B given individually. The difference between Bliss expectation and observed response from combination of drugs A and B at the same doses is the ΔBliss excess.
Supplementary Material
Supplemental Information
Document S1. Figures S1–S9, Tables S1–S8, Supplemental Experimental Procedures and Supplemental References
Document S2. Supplemental Data File. Sweave documentation for microarray data analysis, Related to Figure 2
Acknowledgments
The authors thank current and past members of Minna and Martinez laboratories for assistance, particularly Michael Peyton, Amit Das, Boning Gao and Nicholas Levonyak. We are thankful to Dr. Michael Roth and Dr. Jerry Shay (UT Southwestern) for helpful discussions. Research reported in this publication was partly funded by NCI (R01 CA125269 to E.D.M., P50CA70907 to J.D.M., P01 CA196539 to B.A.G.), the Department of Defense (W81XWH-07-1-0306 and W81XWH-16-1-0129), CPRIT (RP160493, RP120717, RP110708), the Friends of the Cancer Center (to E.D.M.), The Welch Foundation (I-1878 to E.D.M.), and LLS Robert Arceci Scholar Award (to B.A.G.). We also recognize the support to UT Southwestern Simmons Cancer Center Shared Resources by the NCI of the National Institutes of Health (5P30CA142543) and to MD Anderson Institutional Tissue Bank, ITBS (2P30CA016672).
Footnotes
Publisher's Disclaimer: This is a PDF file of an unedited manuscript that has been accepted for publication. As a service to our customers we are providing this early version of the manuscript. The manuscript will undergo copyediting, typesetting, and review of the resulting proof before it is published in its final citable form. Please note that during the production process errors may be discovered which could affect the content, and all legal disclaimers that apply to the journal pertain.
Author Contributions
M.P.D. designed and performed experiments, analyzed data and wrote the manuscript. L.W., H.P., J.B. and B.T. helped with in vivo experiments. R.Z., Y.Z., K.C., Y.X. and L.G. helped in microarray data analysis. R.K.K., P.Y. and R.K. performed ChIP experiment and bioinformatics analysis. N.V.B. and B.A.G. performed histone PTM mass spectrometry. J.R.C., C.B., B.M., P.V., E.R.P., M.S., A.P., S.G.S., N.K., J.V.H., A.F.G. and I.I.W. provided clinically annotated patient dataset or pathological data. J.D.M. contributed to project design and manuscript edits. E.D.M. designed and guided the project and co-wrote and edited the manuscript.
References
- American Cancer Society. Cancer Facts & Figures. 2015. [Google Scholar]
- Ben-Porath I, Thomson MW, Carey VJ, Ge R, Bell GW, Regev A, Weinberg RA. An embryonic stem cell-like gene expression signature in poorly differentiated aggressive human tumors. Nat Genet. 2008;40:499–507. doi: 10.1038/ng.127. [DOI] [PMC free article] [PubMed] [Google Scholar]
- Bradshaw DM, Arceci RJ. Clinical relevance of transmembrane drug efflux as a mechanism of multidrug resistance. Journal of clinical oncology : official journal of the American Society of Clinical Oncology. 1998;16:3674–3690. doi: 10.1200/JCO.1998.16.11.3674. [DOI] [PubMed] [Google Scholar]
- Busschots S, O’Toole S, O’Leary JJ, Stordal B. Carboplatin and taxol resistance develops more rapidly in functional BRCA1 compared to dysfunctional BRCA1 ovarian cancer cells. Experimental cell research. 2015;336:1–14. doi: 10.1016/j.yexcr.2014.12.001. [DOI] [PubMed] [Google Scholar]
- d’Amato TA, Landreneau RJ, Ricketts W, Huang W, Parker R, Mechetner E, Yu IR, Luketich JD. Chemotherapy resistance and oncogene expression in non-small cell lung cancer. The Journal of thoracic and cardiovascular surgery. 2007;133:352–363. doi: 10.1016/j.jtcvs.2006.10.019. [DOI] [PubMed] [Google Scholar]
- Ding LH, Xie Y, Park S, Xiao G, Story MD. Enhanced identification and biological validation of differential gene expression via Illumina whole-genome expression arrays through the use of the model-based background correction methodology. Nucleic Acids Res. 2008;36:e58. doi: 10.1093/nar/gkn234. [DOI] [PMC free article] [PubMed] [Google Scholar]
- Eisen MB, Spellman PT, Brown PO, Botstein D. Cluster analysis and display of genome-wide expression patterns. Proceedings of the National Academy of Sciences of the United States of America. 1998;95:14863–14868. doi: 10.1073/pnas.95.25.14863. [DOI] [PMC free article] [PubMed] [Google Scholar]
- Gottesman MM. Mechanisms of cancer drug resistance. Annu Rev Med. 2002;53:615–627. doi: 10.1146/annurev.med.53.082901.103929. [DOI] [PubMed] [Google Scholar]
- Gottesman MM, Fojo T, Bates SE. Multidrug resistance in cancer: role of ATP-dependent transporters. Nature reviews Cancer. 2002;2:48–58. doi: 10.1038/nrc706. [DOI] [PubMed] [Google Scholar]
- Howlader N, N A, Krapcho M, Garshell J, Miller D, Altekruse SF, Kosary CL, Yu M, Ruhl J, Tatalovich Z, Mariotto A, Lewis DR, Chen HS, Feuer EJ, Cronin KA. SEER Cancer Statistics Review. Bethesda, MD: National Cancer Institute; 1975–2012. [Google Scholar]
- Kim JY, Kim KB, Eom GH, Choe N, Kee HJ, Son HJ, Oh ST, Kim DW, Pak JH, Baek HJ, et al. KDM3B is the H3K9 demethylase involved in transcriptional activation of lmo2 in leukemia. Molecular and cellular biology. 2012;32:2917–2933. doi: 10.1128/MCB.00133-12. [DOI] [PMC free article] [PubMed] [Google Scholar]
- Knoechel B, Roderick JE, Williamson KE, Zhu J, Lohr JG, Cotton MJ, Gillespie SM, Fernandez D, Ku M, Wang H, et al. An epigenetic mechanism of resistance to targeted therapy in T cell acute lymphoblastic leukemia. Nat Genet. 2014;46:364–370. doi: 10.1038/ng.2913. [DOI] [PMC free article] [PubMed] [Google Scholar]
- Kruidenier L, Chung CW, Cheng Z, Liddle J, Che K, Joberty G, Bantscheff M, Bountra C, Bridges A, Diallo H, et al. A selective jumonji H3K27 demethylase inhibitor modulates the proinflammatory macrophage response. Nature. 2012;488:404–408. doi: 10.1038/nature11262. [DOI] [PMC free article] [PubMed] [Google Scholar]
- Lemontt JF, Azzaria M, Gros P. Increased mdr gene expression and decreased drug accumulation in multidrug-resistant human melanoma cells. Cancer research. 1988;48:6348–6353. [PubMed] [Google Scholar]
- Liau BB, Sievers C, Donohue LK, Gillespie SM, Flavahan WA, Miller TE, Venteicher AS, Hebert CH, Carey CD, Rodig SJ, et al. Adaptive Chromatin Remodeling Drives Glioblastoma Stem Cell Plasticity and Drug Tolerance. Cell stem cell. 2017;20:233–246 e237. doi: 10.1016/j.stem.2016.11.003. [DOI] [PMC free article] [PubMed] [Google Scholar]
- Mair B, Kubicek S, Nijman SM. Exploiting epigenetic vulnerabilities for cancer therapeutics. Trends Pharmacol Sci. 2014;35:136–145. doi: 10.1016/j.tips.2014.01.001. [DOI] [PubMed] [Google Scholar]
- Martin J, Ginsberg RJ, Venkatraman ES, Bains MS, Downey RJ, Korst RJ, Kris MG, Rusch VW. Long-term results of combined-modality therapy in resectable non-small-cell lung cancer. Journal of clinical oncology : official journal of the American Society of Clinical Oncology. 2002;20:1989–1995. doi: 10.1200/JCO.2002.08.092. [DOI] [PubMed] [Google Scholar]
- Martoriati A, Doumont G, Alcalay M, Bellefroid E, Pelicci PG, Marine JC. dapk1, encoding an activator of a p19ARF-p53-mediated apoptotic checkpoint, is a transcription target of p53. Oncogene. 2005;24:1461–1466. doi: 10.1038/sj.onc.1208256. [DOI] [PubMed] [Google Scholar]
- Massarelli E, Andre F, Liu DD, Lee JJ, Wolf M, Fandi A, Ochs J, Le Chevalier T, Fossella F, Herbst RS. A retrospective analysis of the outcome of patients who have received two prior chemotherapy regimens including platinum and docetaxel for recurrent non-small-cell lung cancer. Lung Cancer. 2003;39:55–61. doi: 10.1016/s0169-5002(02)00308-2. [DOI] [PubMed] [Google Scholar]
- Meissner A, Mikkelsen TS, Gu H, Wernig M, Hanna J, Sivachenko A, Zhang X, Bernstein BE, Nusbaum C, Jaffe DB, et al. Genome-scale DNA methylation maps of pluripotent and differentiated cells. Nature. 2008;454:766–770. doi: 10.1038/nature07107. [DOI] [PMC free article] [PubMed] [Google Scholar]
- Roesch A, Vultur A, Bogeski I, Wang H, Zimmermann KM, Speicher D, Korbel C, Laschke MW, Gimotty PA, Philipp SE, et al. Overcoming intrinsic multidrug resistance in melanoma by blocking the mitochondrial respiratory chain of slow-cycling JARID1B(high) cells. Cancer Cell. 2013;23:811–825. doi: 10.1016/j.ccr.2013.05.003. [DOI] [PMC free article] [PubMed] [Google Scholar]
- Roninson IB, Chin JE, Choi KG, Gros P, Housman DE, Fojo A, Shen DW, Gottesman MM, Pastan I. Isolation of human mdr DNA sequences amplified in multidrug-resistant KB carcinoma cells. Proceedings of the National Academy of Sciences of the United States of America. 1986;83:4538–4542. doi: 10.1073/pnas.83.12.4538. [DOI] [PMC free article] [PubMed] [Google Scholar]
- Scagliotti GV, Parikh P, von Pawel J, Biesma B, Vansteenkiste J, Manegold C, Serwatowski P, Gatzemeier U, Digumarti R, Zukin M, et al. Phase III study comparing cisplatin plus gemcitabine with cisplatin plus pemetrexed in chemotherapy-naive patients with advanced-stage non-small-cell lung cancer. Journal of clinical oncology : official journal of the American Society of Clinical Oncology. 2008;26:3543–3551. doi: 10.1200/JCO.2007.15.0375. [DOI] [PubMed] [Google Scholar]
- Schiller JH, Harrington D, Belani CP, Langer C, Sandler A, Krook J, Zhu J, Johnson DH, Eastern Cooperative Oncology, G Comparison of four chemotherapy regimens for advanced non-small-cell lung cancer. The New England journal of medicine. 2002;346:92–98. doi: 10.1056/NEJMoa011954. [DOI] [PubMed] [Google Scholar]
- Sharma SV, Lee DY, Li B, Quinlan MP, Takahashi F, Maheswaran S, McDermott U, Azizian N, Zou L, Fischbach MA, et al. A chromatin-mediated reversible drug-tolerant state in cancer cell subpopulations. Cell. 2010;141:69–80. doi: 10.1016/j.cell.2010.02.027. [DOI] [PMC free article] [PubMed] [Google Scholar]
- Subramanian A, Tamayo P, Mootha VK, Mukherjee S, Ebert BL, Gillette MA, Paulovich A, Pomeroy SL, Golub TR, Lander ES, Mesirov JP. Gene set enrichment analysis: a knowledge-based approach for interpreting genome-wide expression profiles. Proceedings of the National Academy of Sciences of the United States of America. 2005;102:15545–15550. doi: 10.1073/pnas.0506580102. [DOI] [PMC free article] [PubMed] [Google Scholar]
- Szakacs G, Paterson JK, Ludwig JA, Booth-Genthe C, Gottesman MM. Targeting multidrug resistance in cancer. Nat Rev Drug Discov. 2006;5:219–234. doi: 10.1038/nrd1984. [DOI] [PubMed] [Google Scholar]
- Szenker E, Ray-Gallet D, Almouzni G. The double face of the histone variant H3.3. Cell research. 2011;21:421–434. doi: 10.1038/cr.2011.14. [DOI] [PMC free article] [PubMed] [Google Scholar]
- Vinogradova M, Gehling VS, Gustafson A, Arora S, Tindell CA, Wilson C, Williamson KE, Guler GD, Gangurde P, Manieri W, et al. An inhibitor of KDM5 demethylases reduces survival of drug-tolerant cancer cells. Nature chemical biology. 2016;12:531–538. doi: 10.1038/nchembio.2085. [DOI] [PubMed] [Google Scholar]
- Wang L, Chang J, Varghese D, Dellinger M, Kumar S, Best AM, Ruiz J, Bruick R, Pena-Llopis S, Xu J, et al. A small molecule modulates Jumonji histone demethylase activity and selectively inhibits cancer growth. Nature communications. 2013;4:2035. doi: 10.1038/ncomms3035. [DOI] [PMC free article] [PubMed] [Google Scholar]
- Wilson C, Ye X, Pham T, Lin E, Chan S, McNamara E, Neve RM, Belmont L, Koeppen H, Yauch RL, et al. AXL inhibition sensitizes mesenchymal cancer cells to antimitotic drugs. Cancer research. 2014;74:5878–5890. doi: 10.1158/0008-5472.CAN-14-1009. [DOI] [PubMed] [Google Scholar]
Associated Data
This section collects any data citations, data availability statements, or supplementary materials included in this article.
Supplementary Materials
Supplemental Information
Document S1. Figures S1–S9, Tables S1–S8, Supplemental Experimental Procedures and Supplemental References
Document S2. Supplemental Data File. Sweave documentation for microarray data analysis, Related to Figure 2