Abstract
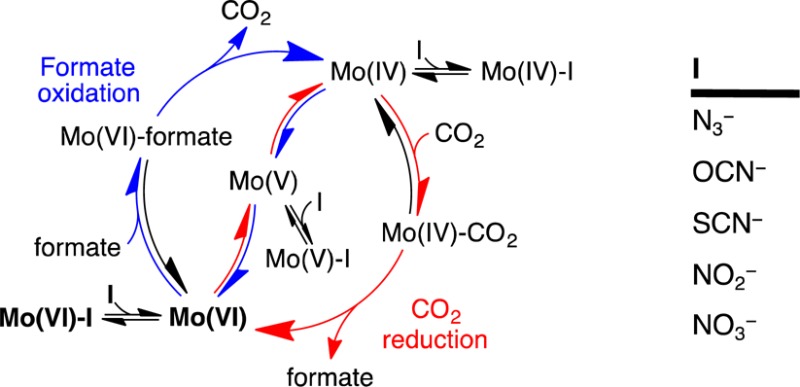
Molybdenum-containing formate dehydrogenase H from Escherichia coli (EcFDH-H) is a powerful model system for studies of the reversible reduction of CO2 to formate. However, the mechanism of FDH catalysis is currently under debate, and whether the primary Mo coordination sphere remains saturated or one of the ligands dissociates to allow direct substrate binding during turnover is disputed. Herein, we describe how oxidation-state-dependent changes at the active site alter its inhibitor binding properties. Using protein film electrochemistry, we show that formate oxidation by EcFDH-H is inhibited strongly and competitively by N3–, OCN–, SCN–, NO2–, and NO3–, whereas CO2 reduction is inhibited only weakly and not competitively. During catalysis, the Mo center cycles between the formal Mo(VI)=S and Mo(IV)—SH states, and by modeling chronoamperometry data recorded at different potentials and substrate and inhibitor concentrations, we demonstrate that both formate oxidation and CO2 reduction are inhibited by selective inhibitor binding to the Mo(VI)=S state. The strong dependence of inhibitor-binding affinity on both Mo oxidation state and inhibitor electron-donor strength indicates that inhibitors (and substrates) bind directly to the Mo center. We propose that inhibitors bind to the Mo following dissociation of a selenocysteine ligand to create a vacant coordination site for catalysis and close by considering the implications of our data for the mechanisms of formate oxidation and CO2 reduction.
Introduction
Metal-dependent formate dehydrogenase enzymes (FDHs) have recently come to prominence as efficient and reversible electrocatalysts for CO2 reduction.1,2 Both the Mo-dependent FDH from Escherichia coli (EcFDH-H)2 and the W-dependent FDH from Syntrophobacter fumaroxidans(1) interconvert CO2 and formate reversibly when immobilized on graphite-based electrodes, and the Mo-containing FDHs from Desulfovibrio desulfuricans(3) and Rhodobacter capsulatus,4 along with the W-containing formylmethanofuran dehydrogenase from Methanothermobacter wolfeii,5 have also been reported to reduce CO2 to formate. In contrast, no molecular electrocatalyst yet exists that is capable of reversibly interconverting CO2 and formate.
Several Rh-, Ir-, and Ru-based electrocatalysts have been reported to reduce CO2 to formate.6−9 Notably, a series of Ir-pincer dihydride complexes reduce CO2 to formate with >90% selectivity in water6,7 and when immobilized on carbon-nanotube-based electrodes.8 However, the need to develop Earth-abundant electrocatalysts is clear, and Ni-,10 Fe-,11,12 and Mn-13 based electrocatalysts have also been shown to produce formate as a major product (in addition to CO and/or H2) under particular conditions. Recently, state-of-the-art electrocatalysts such as [Fe4N(CO)12]− 14 and a series of CpCo-diphosphine complexes15 were shown to reduce CO2 to formate with high activity and Faradaic efficiency in the presence of water and were proposed to catalyze the reaction through metal-hydride intermediates that CO2 can abstract or insert into. Nickel bis-diphosphine (“DuBois”) catalysts oxidize formate in organic solution at up to 15.8 s–116,17 and have been proposed to operate by a β-deprotonation mechanism in which the formate proton is removed by a pendent base, not by hydride transfer to Ni.17 However, all of these molecular electrocatalysts require overpotentials of hundreds of millivolts to perform unidirectional catalysis, in stark contrast to the reversible catalysis of FDHs.1,2 Thus, the FDH active site provides an attractive biological blueprint to inform the design of efficient synthetic electrocatalysts for formate oxidation and CO2 reduction. Although the principles by which enzymes such as FDH have evolved into such efficient and reversible catalysts are increasingly well understood,18 the FDH catalytic mechanism itself is currently controversial, and only limited structural and functional data are available.
Several metal-dependent FDHs have been characterized structurally5,19,20,21 and show a common active-site architecture, exemplified by the structure of E. coli FDH-N.21 In the oxidized state, the central Mo (or W) atom is coordinated to two pyranopterin (dithiolene) ligands, a terminal sulfide, and a rare selenocysteine (Sec) residue. The sulfido ligand is crucial: Sulfur-transferase enzymes are required to produce active FDH, and inactivation by cyanide, which removes the sulfido ligand, can be partially reversed by incubation with sulfide.22,23
According to a central tenet of molybdenum biochemistry, the Mo in FDH is considered to cycle among the formal Mo(VI), Mo(V), and Mo(IV) oxidation states during catalysis.24 We use this nomenclature throughout, even though the redox-noninnocent pyranopterin ligands25 might participate, particularly in the lower oxidation states. Thus, the Mo(VI) state is used to oxidize formate, and the Mo(IV) state is used to reduce CO2. In the structures of the oxidized and formate-reduced forms of EcFDH-H,19 the structure of the oxidized active site is closely similar to that of EcFDH-N, but the structure of the formate-reduced active site is controversial. Initially, the site was modeled as a trigonal-bipyramidal Mo center coordinated by the two pyranopterins and the Sec residue. The sulfido ligand (modeled at the time as an oxo group) was assumed to have dissociated. This structure is not consistent with the sulfido ligand being essential for function. However, the same data were subsequently reinterpreted: The loop carrying the Sec residue was modeled in a different position, with the Sec 12 Å from the Mo center and the apical position on the Mo occupied by the sulfido ligand.26 This latter model is consistent with the structure of a catalytically relevant state, but the existence of two such different models from the same data set implies ambiguity in the data and suggests caution in basing further interpretations on either model.
X-ray absorption spectroscopy (XAS) data on the oxidized FDHs from E. coli and D. sulfuricans were in agreement with the Mo coordination spheres originally assigned in the X-ray crystal structures (that included a terminal oxo instead of sulfido group).27,28 XAS data on the chemically reduced forms indicated little change to the Mo coordination sphere, except for a lengthening of the putative Mo—O bond,28 perhaps suggesting that Sec dissociation does not occur upon reduction. However, XAS data on Rhodobacter capsulatus FDH (which contains a Cys residue in place of the Sec) suggested that a Mo—S bond is replaced by a Mo—O bond upon reduction by formate.23 Electron paramagnetic resonance (EPR) spectroscopy has identified a characteristic Mo(V) signal upon reduction of the Mo(VI) state by formate, followed by transfer of an electron to an iron–sulfur or heme cofactor.29−32 Coupling of 77Se to this intermediate Mo(V) state has been observed in EcFDH-H [but is not necessarily relevant to the Mo(IV) state],30 and magnetic coupling between Mo(V) and the proton derived from the C–H moiety of the formate has been attributed to the proton residing on the terminal sulfido ligand as a terminal thiol.29,32
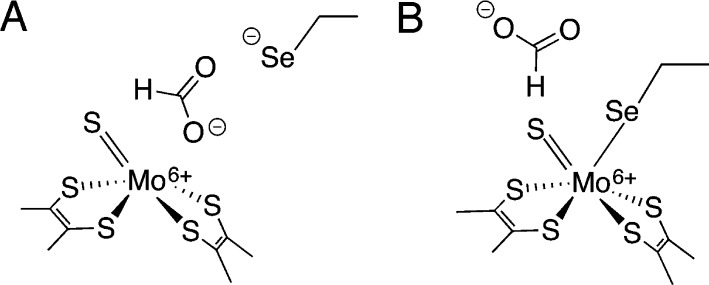
On the basis of these data, several different mechanisms have been proposed for FDH-catalyzed formate oxidation, including mechanisms in which a vacant coordination site on Mo(VI) is created by Sec dissociation (Figure 1A)33,34 and mechanisms in which a saturated Mo coordination environment is maintained (Figure 1B).3,32 In the former case, various species (including the dissocated Sec26 or a nearby His residue19) have been proposed to act as a base to abstract a proton from formate, once it is bound to the Mo(VI) by one of its carboxylate oxygens. Alternatively, formate has been suggested to displace the Sec residue from the Mo onto the terminal sulfide in a sulfur-shift reaction.35 Formate has also been proposed to donate a hydride directly to the Mo, which then migrates to the terminal sulfide in a hydride-shift reaction.33 In the latter case, direct hydride transfer of the formate α-hydrogen to the terminal sulfido group on the Mo, without direct substrate binding to the metal, was recently proposed,3,32 in analogy with the hydride-transfer mechanism proposed for the related xanthine oxidase enzymes.24
Figure 1.
Formate approaching (A) a vacant primary coordination site on Mo(VI) and (B) the outer coordination sphere of a saturated Mo(VI) center in FDH.
In this work, we have used protein film electrochemistry (PFE) to probe the mechanism of CO2 reduction and formate oxidation by EcFDH-H. In combination with a set of inhibitors of varying electron donor strength (N3–, OCN–, SCN–, NO2–, and NO3–), PFE was employed to distinguish the binding characteristics of inhibitors to the reduced and oxidized active sites. We reveal that inhibitor binding is strongly oxidation-state-dependent, with a strong preference for the oxidized state. Thus, inhibition of formate oxidation is strong and competitive, whereas inhibition of CO2 reduction is weak and noncompetitive. We also show that the oxidized state has a strong electron-acceptor character (inhibitor binding affinities increase with electron donor strength), consistent with direct coordination of formate to the Mo center. Finally, we discuss the implications of our results for the mechanism of FDH catalysis.
Experimental Methods
EcFDH-H was purified as reported previously.2 It was concentrated to 0.7–1 mg mL–1, aliquoted into 10 μL portions, and stored long-term at −80 °C or short-term at −40 °C in a freezer inside an anaerobic glovebox.
PFE was performed in a nitrogen-filled MBraun glovebox (<0.1 ppm of O2) using an Ivium Compactstat potentiostat. The three-electrode cell was fitted with a Pt mesh counter electrode, an Ag/AgCl/saturated KCl reference electrode (BASi), and a graphite-epoxy composite rotating-disk working electrode (area 0.09 cm2, prepared as described previously2). The cell was thermostated at 23.5 °C using a circulated-water jacket. Experiments were performed in pH-corrected buffer solutions that were 25 mM in each of 2-(N-morpholino)ethanesulfonic acid (MES, Alfa Aesar), N-tris(hydroxymethyl)methyl-3-aminopropanesulfonic acid (TAPS, Sigma-Aldrich), 4-(2-hydroxyethyl)-1-piperazineethanesulfonic acid (HEPES, Sigma-Aldrich), and potassium acetate (Alfa Aesar) in water from a Millipore system. For each experiment, the graphite-epoxy electrode was abraded with p800-grade wet and dry SiC paper (Norton) and then rinsed and dried. Either 2.5 or 5 μL of EcFDH-H solution were applied to its surface and left to dry for 10 min, before the electrode was inserted into the electrochemical cell. Stock solutions of substrates and inhibitors were made in the cell buffer solution at the same pH and temperature. For inhibitor titrations, they also included the experimental substrate concentration. Sodium formate (Sigma-Aldrich) was dried under a vacuum at 100 °C and stored in a drybox. For determination of the KM values for CO2 reduction, carbonic anhydrase (0.2 mg mL–1) was added to ensure that the CO2/bicarbonate equilibrium was rapidly established. CO2 was introduced into the cell through the addition of an aliquot of NaHCO3 (Breckland Scientific) solution corrected to the experimental pH. Sodium azide (Fisher), sodium nitrate (Sigma-Aldrich), sodium nitrite (Sigma-Aldrich), sodium thiocyanate (Sigma-Aldrich), sodium cyanate (Sigma-Aldrich), and carbonic anhydrase (Sigma-Aldrich) were purchased at the highest available purity and used as received. The pH of the cell solution was checked before and after each experiment; this was particularly important in validating experiments for CO2 reduction. Before experiments investigating formate oxidation, the electrode potential was held at −0.6 V vs SHE for several seconds before being switched to the potential of the experiment. All experiments were performed with an electrode rotation rate of 2000 rpm.
When necessary, high-frequency electrical noise was removed from electrochemical data by Fourier transformation, and chronoamperometric data were normalized for film degradation according to a published method.36 Background currents were estimated from the processed data and then tested using Dixon plots37 of 1/current versus inhibitor concentration, which are linear in the ideal case. Background currents for KM measurements were easily determined from the current recorded in the absence of substrate. Data were fit using a program written in C (see Supporting Information). The program calculated the normalized rate (v/v0) for each set of experimental conditions using eqs 1 and 2 (see below). Then, the square of the difference between the calculated and measured normalized rates for each data point was taken, and the squared terms for all data points were summed. This summed error value was minimized by screening values for each parameter, and the minimum “least-squares-error” (LSQE) value was taken to define the best fit. A similar procedure was applied to determine the range for each parameter. The parameter of interest was fixed, and the other parameters were varied to obtain the LSQE; the procedure was repeated for a range of values of the parameter under investigation to obtain a plot of LSQE as a function of the parameter value.
Results
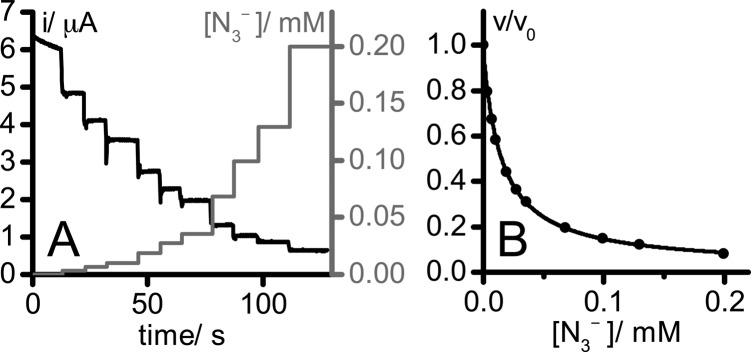
PFE was used to investigate the mechanism of EcFDH-H catalysis through its inhibition by a set of small molecules, namely, N3–, OCN–, SCN–, NO2–, NO3–, CS2, and CO. Inhibition by N3–, NO2–, and NO3– has been reported previously.38−40Figure 2 shows data from a typical experiment reporting on the inhibition of catalysis by a protein film of EcFDH-H adsorbed on a graphite-epoxy rotating-disk electrode. Figure 2A shows a chronoamperometry trace (corrected for film degradation)36 that monitored the formate oxidation current while aliquots of NaN3 solution were added. The formate oxidation current is proportional to the rate of turnover.41Figure 2B displays the normalized current values (v/v0, the current observed at the given inhibitor concentration divided by the current observed in the absence of inhibitor) plotted against the NaN3 concentration and fit using the standard dose–effect relationship to determine the inhibitor concentration that decreases the activity by 50% (i.e., the IC50 value). For each inhibitor studied, three sets of data at different substrate concentrations were acquired for both formate oxidation and CO2 reduction. Note that we use the term “CO2 concentration” to denote the total concentration of CO2/carbonate species present in solution.
Figure 2.
(A) Chronoamperometry trace recorded at −0.1 V vs SHE in 5 mM aqueous sodium formate solution (pH 7, 23.5 °C, electrode rotation rate 2000 rpm). Aliquots of a 15 mM solution of NaN3 (also containing 5 mM formate) were added to adjust the N3– concentration (right axis). pH and substrate concentration were constant throughout, and the data were corrected for film loss.36 (B) Dependence of the normalized current (v/v0, current observed at the given inhibitor concentration divided by the current observed in the absence of inhibitor) on NaN3 concentration, derived from the data in panel A. The data were fit using the standard dose–effect relationship, namely, v/v0 = 1 – {[N3–]/(IC50 + [N3–])}, with a Hill coefficient of 1.
Figure 3 shows the IC50 values determined for inhibition by N3–, OCN–, SCN–, NO2–, and NO3–. No significant inhibition was observed for CS2 (up to 0.3 mM) or CO (up to 1.31 mM). All five inhibitors are considerably more potent against formate oxidation than CO2 reduction. Furthermore, the IC50 values for formate oxidation increase with increasing substrate concentration, whereas for CO2 reduction, they decrease (or are little affected). Notably, the positive, linear relationship between the IC50 value and substrate concentration exhibited by the formate oxidation data is a clear indication of competitive inhibition,42 suggesting that the inhibitors bind to the Mo(VI) state. Conversely, the data in Figure 3 provide no indication that CO2 reduction is inhibited competitively, and the much weaker inhibition of CO2 reduction reflects a significant difference in the binding character of the oxidized and reduced active sites. The different binding characters must reflect the different oxidation states of the Mo center itself, which is considered to convert between the deprotonated Mo(VI)-sulfido center [Mo(VI)=S] and the protonated Mo(IV) thiol center [Mo(IV)–SH, inferred from the assignment of Mo(V)–SH in EPR spectra].32
Figure 3.
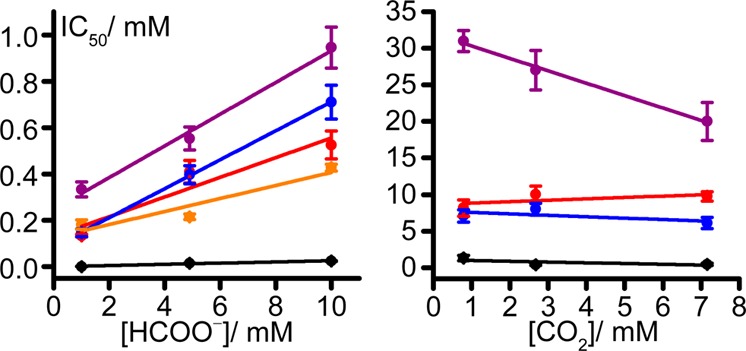
Dependence of inhibitor IC50 values on substrate concentration for formate oxidation and CO2 reduction. NO2– was reduced by the electrode and thus was omitted from the CO2 reduction graph. Black, N3–; red, OCN–; blue, SCN–; purple, NO3–; orange, NO2–. Conditions: 23.5 °C, pH 7, −0.1 V vs SHE (formate), −0.6 V vs SHE (CO2).
Previously, N3– was reported to inhibit formate oxidation by EcFDH-H in a “noncompetitive” manner, and it was proposed to bind, when formate is bound, with an inhibitor dissociation constant, KI, of 75 or 88 μM.38 In a different study on D. desulfuricans FDH, N3– was reported to inhibit formate oxidation both competitively with a KI value of 33 μM and “uncompetitively” with a KI value of 214 μM.31 The oxidation-state dependence of inhibitor binding was not considered and the mode of N3– inhibition thus remained unclear. NO3– was reported to inhibit formate oxidation by EcFDH-H competitively with a KI of 7.1 mM,38 and R. capsulatus FDH with a KI of 1.6 mM.39 NO2– was also proposed to be coordinated to the Mo center in an X-ray crystal structure of EcFDH-H.19 Importantly, using these published KI values to predict IC50 values (using a competive inhibition model and the published KM of 26 mM42) led to much higher values than reported in Figure 3, leading us to undertake a detailed consideration of how the inhibition may be rationalized mechanistically.
To investigate the characteristics of inhibition in greater depth, we focused on N3–, the strongest inhibitor, and investigated data from a comprehensive set of titrations of both formate oxidation and CO2 reduction at different substrate concentrations and potentials (see Figure 4). The data can be explained qualitatively by considering the steady-state population of the Mo(VI) state, to which N3– binds preferentially and which is governed by a balance between substrate binding/turnover (enzyme catalysis) and interfacial electron transfer to/from the electrode. First, the IC50 values determined are strongly potential-dependent. For inhibition of CO2 reduction, they decrease from 800 μM at −0.6 V vs SHE to 10.3 μM at −0.4 V vs SHE (in 8.3 mM CO2), and for inhibition of formate oxidation, they decrease from 61 μM at −0.4 V vs SHE to 25 μM at −0.1 V vs SHE (in 10 mM formate). The explanation is that, at negative potentials, the steady-state level of the Mo(VI) state is low, resulting in poor inhibition by N3–, whereas at less negative potentials, the level increases, and inhibition increases as well. Catalysis is most sensitive around the FDH active-site potentials (see below), which overlap more closely with the region of CO2 reduction. Second, the IC50 values determined are also strongly substrate-concentration-dependent. Their values increase to 1.3 mM for the low CO2 concentration of 0.8 mM (at −0.6 V vs SHE) and decrease to 0.7 μM for the low formate concentration of 1 mM (at −0.1 V vs SHE). Decreasing the CO2 concentration decreases the rate of CO2 reduction and thus the level of the Mo(VI) state, resulting in weaker inhibition by N3–. Conversely, decreasing the formate concentration increases the level of the Mo(VI) state (also, lower formate competes less with N3–), so inhibition increases. Thus, the potential- and substrate-dependent inhibition observed is consistent with the Mo(VI) state as the target for N3– binding.
Figure 4.
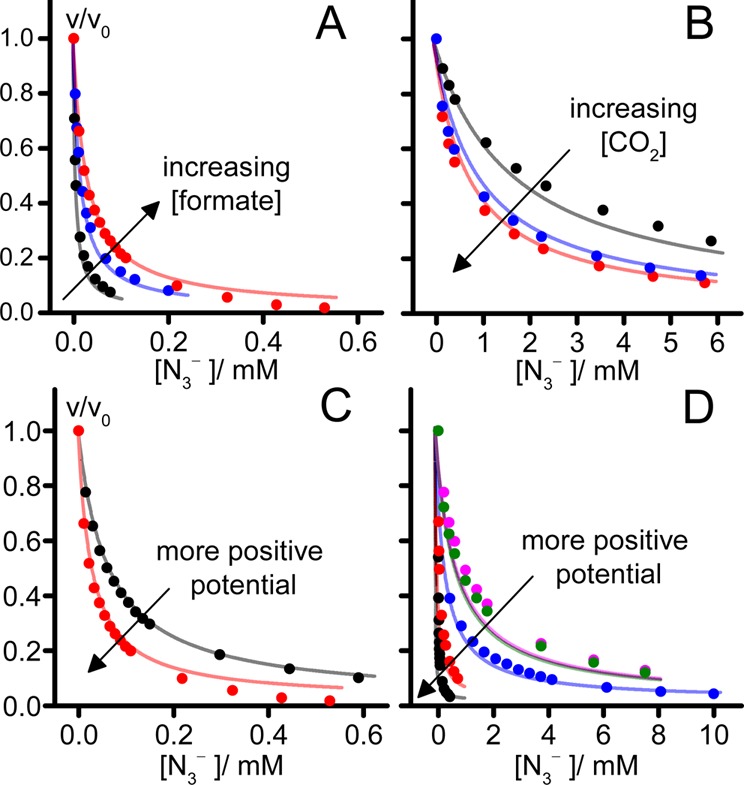
Global fits to data on the inhibition of formate oxidation and CO2 reduction by N3–, using eqs 1 and eqs 2 with common parameters. (A) Dependence of the normalized formate oxidation rate on the N3– concentration for three formate concentrations (red, 10 mM; blue, 5 mM; black, 1 mM) at −0.1 V vs SHE. (B) Dependence of the normalized CO2 reduction rate on the N3– concentration for three CO2 concentrations (red, 7.16 mM; blue, 2.67 mM; black, 0.79 mM) at −0.6 V vs SHE. (C) Dependence of the normalized formate oxidation rate on the N3– concentration for two potentials (red, −0.1 V vs SHE; black, −0.4 V vs SHE) in 10 mM formate. (D) Dependence of the normalized CO2 reduction rate on the N3– concentration for five potentials (pink, −0.6 V; green, −0.55; blue, −0.5; red, −0.45; black, −0.4 V vs SHE) in 8.31 mM CO2. Best-fit lines were calculated using KMCO2 = 2.5 mM, KM = 0.8 mM, K6 = 2 μM, K5 = 1 M, K4 = 42 mM, E1 = −0.365 V, E2 = −0.656 V. kcatCO2/k0 = 5.13, kcat/k0 = 0.5. Conditions: pH 7, 23.5 °C.
Our N3– inhibition data were used quantitatively to evaluate the mechanism shown in Scheme 1, which represents the two directions of catalysis as EECC (E, electrochemical; C, chemical) reactions. Two (reversible) interfacial electron-transfer steps generate the active oxidation state of the Mo center, followed by formate oxidation or CO2 reduction by a (two-step) Michaelis–Menten mechanism. Scheme 1 assumes that substrate mass transport to the electrode surface is fast and not rate-limiting (increasing the electrode rotation rate did not lead to any significant increase in catalytic current). Similarly, product diffusion away from the surface was assumed to be fast; based on a product concentration of zero in the enzyme vicinity, product dissociation was then assumed to be irreversible. Intramolecular electron transfer between the Mo center and the single [4Fe–4S] cluster was not considered, such that interfacial electron transfer was assumed to occur directly between the Mo center and the electrode.43 Finally, the inhibitor-bound species were considered to be redox-inactive in the potential range investigated.
Scheme 1. Model for the Inhibition of EcFDH-H Electrocatalysis.
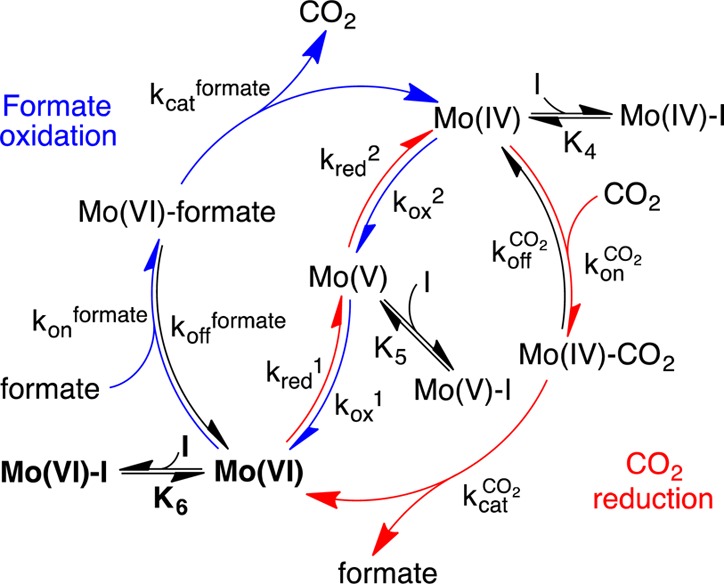
Mo(VI), Mo(V), and Mo(IV) refer to the active site in different Mo oxidation states.
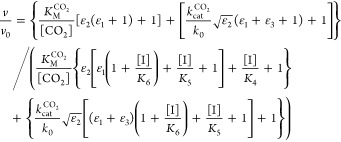
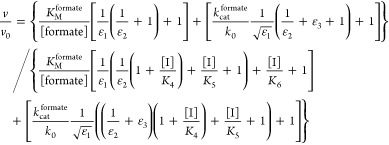
We used Scheme 1 to derive steady-state equations for both formate oxidation and CO2 reduction (see Supporting Information). Equations 1 and 2 contain seven independently adjustable parameters, of which five are common to both reactions. (kred1/kox1) and (kred2/kox2) are functions of the active-site potentials E1 and E2, respectively, and relate the catalytic activity to the electrode potential. The inhibitor dissociation constants, K6, K5, and K4, refer to Mo(VI), Mo(V), and Mo(IV), respectively. The maximum enzyme turnover rates in each direction appear in eqs 1 and 2 relative to k0, the interfacial electron-transfer exchange constant, as (kcatCO2/k0) and (kcat/k0). Finally, two further parameters, the Michaelis–Menten constants KMCO2 and KM [where KM = (kon + kcat)/koff] are used in the usual sense to describe the formation of the enzyme–substrate complexes for each reaction. They were estimated in separate experiments that monitored the current as a function of substrate concentration (see Figure S1) to be KMCO2 = 2.5 mM and KM = 0.8 mM, and their values were fixed accordingly.
Inhibition of CO2 reduction by EcFDH-H
|
1 |
Inhibition of formate
oxidation by EcFDH-H
|
2 |
High-overpotential
limit of eq 2

|
3 |
In eqs 1–3, v is the calculated rate of catalysis, v0 is the calculated rate when the inhibitor concentration is zero, F is Faraday’s constant, R is the ideal gas constant, T is the temperature (297 K), E is the electrode potential (V vs SHE), k0 is the interfacial electron-transfer exchange constant, E1 is the reduction potential of the Mo(VI/V) couple, E2 is the reduction potential of the Mo(V/IV) couple, and ε1, ε2 and ε3 are defined as follows (with one electron involved in each redox reaction and each transfer coefficient set to 0.5):
The best fits to the data (see Figure 4) were identified by studying different parameter combinations and minimizing the sum of the squared differences between the data points and their matching calculated rates (the value of the least-squares error, LSQE). Then, for each parameter, the range of values within which acceptable fits could be generated was estimated by fixing the investigated parameter and varying the others to minimize the LSQE. The LSQE values obtained were plotted against the investigated parameter, and the acceptable LSQE threshold was determined by inspection (see Figure S2).
Figure 4 confirms that N3– binds more strongly to the Mo(VI) state than to the Mo(V) or Mo(IV) states. The best-fit value for K6 is 2 μM, and it has a tightly constrained range of 1.1–3.4 μM. This is much smaller than previously published values (75, 88, and 33 μM)31,38 that were determined in steady-state analyses using a KMformate value of 26 mM and substrate concentrations in the range of 9–120 mM (well above the KM = 0.8 mM value determined here). At these high concentrations, the IC50 value does not respond strongly to the substrate concentration, confounding the KI measurements. Furthermore, the steady-state analyses used benzyl viologen as the electron acceptor.38 Benzyl viologen is a nonphysiological electron acceptor that is much less efficient at regenerating the Mo(VI) state than the electrode used here. Therefore, the Mo(VI) state is present at decreased levels, and even higher inhibitor concentrations are needed to affect the rate. This comparison underlines the advantage of using PFE to observe the potential-dependent characteristics of catalysis. For K4 and K5, the best-fit values determined are much higher than that for K6 (formally 42 mM and 1 M, respectively), and the data can be fit with wide ranges of both parameters (>17 μM and >1.1 mM, respectively, up to 1 M), showing that inhibitor binding to Mo(V) and Mo(IV) exerts little influence. Further support for the inhibition of both directions of catalysis being dominated by inhibitor binding to the Mo(VI) state was provided by applying eq 3, the high-overpotential limit of eq 2, to the data in Figure 4A. To form eq 3, kox1 and kox were tended to infinity, such that the populations of Mo(V) and Mo(IV) approached zero and active-site regeneration was instantaneous. Thus, eq 3 describes purely competitive inhibition of formate oxidation through K6. Equation 3 fitted the data in Figure 4A to the same standard as eq 2 and gave a best-fit value of K6 ≈ 2 μM, supporting both the central role of Mo(VI) in formate oxidation and competition between N3– and formate for the Mo(VI) state.
Data on the other inhibitors studied (see Figure S3) indicate a similar preference for Mo(VI). OCN–, SCN–, and NO3– all compete with formate for the Mo(VI) state (see Figure 3). The smaller data sets acquired for these inhibitors were fit using the best-fit values for the inhibitor-independent parameters E1, E2, kcatformate/k0 and kcat/k0 from Figure 4. The values and ranges obtained for K6, K5, and K4 were derived as shown in Figure S4 and are given in Table 1. The best-fit values for K6 range from 51 μM for OCN– to 95 μM for NO2–, consistent with them being weaker inhibitors than N3–. For OCN–, SCN–, and NO3–, K5 and K4 were (as for N3–) substantially larger than K6. Only NO2– lacked clear selectivity for the Mo(VI) state, instead showing a reverse trend with K4 < K5 < K6. This might be because the bent NO2– molecule (which is isoelectronic with CO22–) mimics an intermediate state between CO2 and formate.
Table 1. Best-Fit Valuesa and Ranges of K6, K5, and K4 for Each Inhibitor with the Corresponding ELb and Resonance Parametersc.
| inhibitor | EL(44) (V vs NHE) | R(45) | K6 | K5 | K4 |
|---|---|---|---|---|---|
| N3– | –0.3 | –0.4 | 2 μM (1.1–3.4 μM) | 1 M (>1.1 mM) | 41.7 mM (>17 μM) |
| OCN– | –0.25 | –0.12 | 51 μM (39–65 μM) | 25 mM (>14 mM) | 1.2 mM (>0.53 mM) |
| SCN– | –0.06 | –0.13 | 56 μM (43–72 μM) | 9.7 mM (>6.6 mM) | 3.5 mM (>0.65 mM) |
| NO2– | 0.02 | 0.13 | 95 μM (58–184 μM) | 1.85 μM (0.72–2.33) | 0.01 μM (>2.4 nM) |
| NO3– | –1.3 | 0.22 | 90 μM (66–122 μM) | 63 mM (>29 mM) | 16.1 mM (>2 mM) |
Best-fit parameters were obtained using eqs 1 and 2 with KMformate = 0.8 mM, KM = 2.5 mM, E1 = −0.365 V vs SHE, E2 = −0.656 V vs SHE, kcatformate/k0 = 0.5, and kcat/k0 = 5.13 and were taken from Figure S4.
More negative values correspond to greater net electron donation to the metal center from the ligand.44
More negative values indicate greater ligand π-donor character.45
To further explore the factors that influence inhibitor binding to the active site, we investigated the pH dependence of the inhibition of formate oxidation by N3–. Experiments were performed at +0.4 V overpotential, relative to the (pH-dependent) Nernst potential of the CO2/formate couple, to access the high-potential limit where eq 3 can be applied. First, KMformate was measured and found to increase from 0.18 mM at pH 5.33 to ∼1.05 mM at pH 8 (Figure 5A); its values were then used in eq 3 to determine K6 as a function of pH (Figure 5B). K6azide increased from 0.26 μM at pH 5.33 to 3 μM at pH 9. Both panels A and B of Figure 5 indicate that both formate and azide bind most strongly to the oxidized state at low pH. The data for K6 were fitted to the thermodynamic scheme shown in Figure 5C, which describes pH-dependent binding coupled to the ionization of a single group/residue with estimated pKa values of 6.5 in the absence of the inhibitor and 7.3 in its presence. These pKa values are most consistent with the protonation state of a His, or Cys/Sec residue as one of the determinants of substrate/inhibitor binding affinity.
Figure 5.
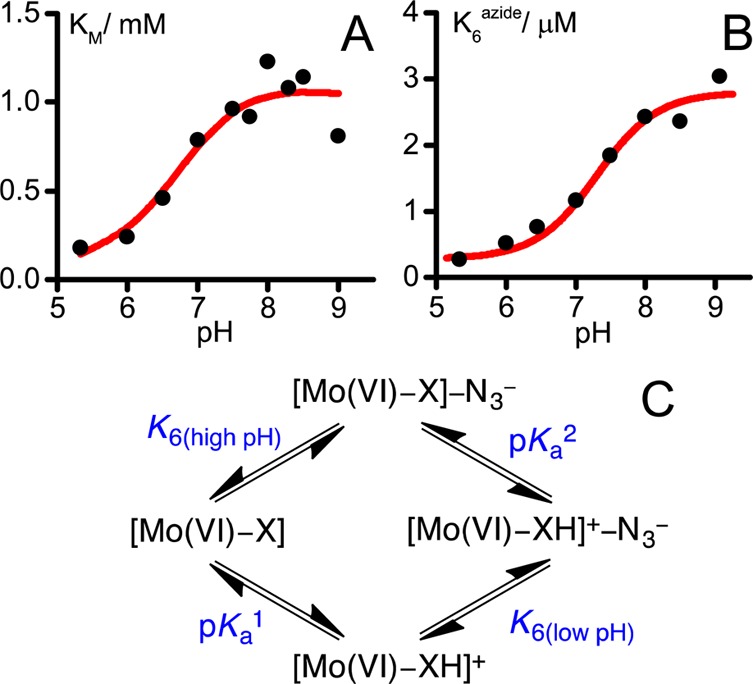
pH dependence of KMformate and K6. Data for each pH were measured at 0.4 V above the Nernst potential of the CO2/formate couple at 23.5 °C. (A) Dependence of KMformate on pH. (B) Dependence of K6 on pH. (C) Scheme showing how the protonation of a nearby base (X) influences inhibitor and proton binding. The scheme in panel C was used to fit the data in panel B, with K6(high pH) = 2.82 μM, pKa1 = 6.3 (for the inhibitor-free state), pKa = 7.3 (for the inhibitor-bound state) and thus K6(low pH)= 0.36 μM. The curve in panel A is only to guide the eye because the closed thermodynamic scheme in panel C does not apply under turnover conditions.
Discussion
A crucial feature of PFE is that experiments are conducted at precisely controlled potentials. Therefore, in contrast to standard solution kinetics experiments, PFE allows the potential and time domains to be distinguished, providing new perspectives on redox-coupled reactions. In this work, we undertook a detailed electrochemical investigation of how Mo-containing EcFDH-H is inhibited by N3– and showed that both the strong inhibition of formate oxidation and the weaker inhibition of CO2 reduction result from selective binding of N3– to the Mo(VI) state. Our model explains why N3– inhibition of formate oxidation is competitive [both formate and N3– bind to the Mo(VI) state] but inhibition of CO2 reduction is not [CO2 reacts with the Mo(IV) state]. It explains why the IC50 values observed for CO2 reduction, in particular, are potential-dependent [Mo(VI) is present at higher steady-state levels at more positive potentials] and how the unusual trend of increased inhibition with increased CO2 concentration arises [from increasing enzyme catalysis increasing the steady-state level of Mo(VI)]. The same selectivity for the Mo(VI) state was observed for several other inhibitors tested (OCN–, SCN–, and NO3–), with only NO2– displaying a different pattern of selectivity (K4 < K5 < K6), perhaps because its bent structure renders it a transition-state analogue.
The strong selectivity of the inhibitors for specific oxidation states of the Mo center places the inhibitor binding site firmly within its vicinity, and the competitive inhibition of formate oxidation suggests the formate and inhibitor binding sites overlap temporally and spatially. Together, these observations exclude inhibitor binding in a redox-independent region of the enzyme, such as in a distant substrate access channel. The simplest model for the marked oxidation-state selectivity, consistent with all proposed mechanisms of catalysis, is that substrates/inhibitors bind directly to the Mo center itself, either to a vacant coordination site on the Mo or to the Mo(VI)=S group. In addition, changes in active-site hydrophobicity have been proposed to aid formate oxidation in metal-independent formate dehydrogenase enzymes46 (because formate is charged and hydrophilic and CO2 is neutral and relatively hydrophobic) and might also contribute to binding. Redox-driven dissociation of the Sec ligand (discussed above) or reduction of the pyranopterin cofactors to their “tetrahydro” form30 could also induce conformational changes and create or destroy substrate/inhibitor binding sites. However, we consider these secondary explanations much less likely than direct interactions with the Mo center itself.
Simple charge-density considerations suggest that direct Mo-binding inhibitors are likely to bind more tightly to Mo(VI) than Mo(IV). Furthermore, Figure 6 shows that the inhibitor K6 values correlate both with the ligand electrochemical parameter (EL, which becomes more negative with increasing net ligand electron donation)44 and with the ligand resonance field donation45 (which decreases with increasing ligand π-electron-donating ability). Thus, the properties of both the Mo center and the inhibitor govern their affinity for one another, consistent with direct bonding between them. Tighter binding inhibitors are better net electron donors and better π-electron donors than more weakly binding inhibitors, indicating that the inhibitor binding site on the Mo(VI) center is an electron-acceptor site. This characteristic is more consistent with the electron-deficient Mo than the electron-rich sulfide. Furthermore, the indication that inhibitor binding to Mo(VI) is also affected by π-donation into empty Mo 4d orbitals suggests Mo(VI) might engage in π-interactions during catalysis. These observations all support substrate/inhibitor binding directly to a vacant coordination site on the Mo itself, rather than to the sulfide. Although this conclusion is challenged by reports that N3–, OCN–, SCN–, NO2–, and NO3– also competitively inhibit formate oxidation in metal-independent FDHs [such as yeast formate dehydrogenase, which catalyzes direct hydride transfer from formate to NAD(P)+],46,47 it is not suprising that two enzymes that oxidize the same substrate exhibit similar active-site specificities. In metal-independent FDHs, structural data has shown that His and Arg residues in the active site stabilize bound N3– by hydrogen bonding46 and Arg and His residues are also present in the active site of EcFDH-H. The pKa values observed for N3– binding in EcFDH-H (see Figure 5) are consistent with a His residue stabilizing the inhibitor/substrate most effectively in its protonated state.
Figure 6.
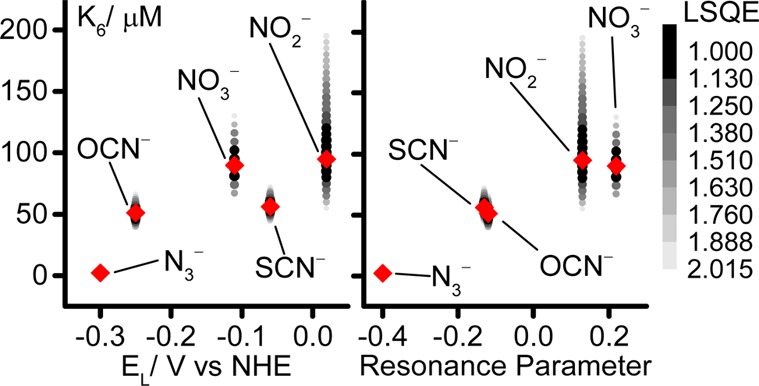
Dependence of K6 on ligand electrochemical (EL)44 and resonance parameters.45 Red diamonds, best-fit values; points, values within the acceptable error threshold (see Figures S2 and S4), shaded according to the normalized LSQE.
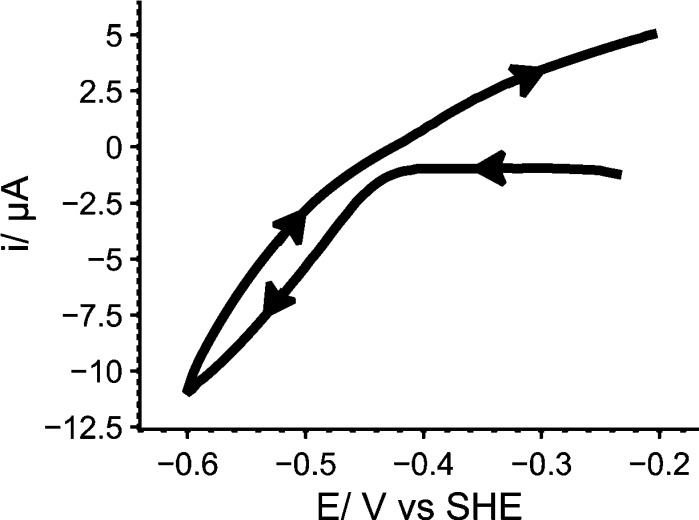
The Sec residue would have to dissociate to generate a vacant coordination site for substrates/inhibitors to bind directly to the Mo. As described above, structural and spectroscopic data on Mo coordination in the Mo(IV) state are inconclusive. However, it is only necessary for the Sec to dissociate transiently for substrates/inhibitors to bind to its coordination site. Support for a competitive binding model is provided by inactivation of Mo-containing FDHs by iodoacetamide [which reacts with nucleophilic Sec (or Cys) residues] in the presence of formate48 or NO3– (the iodoacetamide has been confirmed to derivatize the active-site Cys residue in R. capsulatus FDH).39 The Sec might thus exist in a distribution of bound and free states that favors the bound state more strongly for high-charge-density Mo(VI) than for Mo(IV), and it might be crucial for FDH catalysis simply because it stabilizes the resting enzyme. Previously, a “sulfur–selenium shift” mechanism was proposed for Sec dissociation, in which the approach of formate triggers insertion of the sulfido ligand into the Se–Mo bond,34,35 but there is little experimental support for S–Se bond formation. Finally, reductive activation of FDH catalysis, independent of formate, has been noted for D. sulfuricans FDH3 and was also observed for CO2 reduction (by reduced methyl viologen) in the W-containing FDH from S. fumaroxidans.1 A similar phenomenon was observed here in electrocatalytic experiments on EcFDH-H in the presence of CO2 and formate (see Figure 7). When the potential is swept cathodically from −0.2 to −0.6 V, catalysis is not observed until the onset of CO2 reduction, despite the driving force being sufficient for formate oxidation. When the potential returns, formate oxidation is observed where previously there was none, and subequent scans show formate oxidation currents in both scan directions. The reductive activation might represent formation of a stabilized Sec-dissociated state when the steady-state level of the Mo(IV) state increases.
Figure 7.
Reductive activation of electrocatalysis by EcFDH-H. Arrows indicate the voltammetric scan direction. Conditions: pH 7.2; 10 mM CO2; 10 mM formate; 25 mM each MES, TAPS, HEPES, and K+ acetate; 23.5 °C; 2000 rpm; scan rate 25 mV s–1.
Figure 8 shows the key intermediates formed in three proposed mechanisms for FDH catalysis. In the mechanism shown in Figure 8A, formate donates a hydride to the sulfido group of the Mo(VI)=S center.32 However, it is unclear if the S center is a sufficiently strong hydride acceptor. In model complexes, the formation of Mo—SH groups appears to be dominated by protonation reactions,49−51 and although [Cp*2Mo2S4]-type complexes containing bridging sulfides have been tuned to be thermodynamically capable hydride donors or acceptors,52 their kinetic behavior has not been investigated. The mechanism in Figure 8A is consistent with the mechanism of catalysis by metal-independent FDHs,46 which demonstrate the possibility of a Mo-independent hydride-transfer reaction. However, NAD+ is an obligatory hydride acceptor, whereas the FDH-Mo center has a stable one-electron intermediate state, Mo(V), and far more versatile chemistry. In addition, CN–-driven removal of the sulfido ligand as SCN–22,53 can occur by nucleophilic attack by CN– on the sulfido group, in analogy with the hydride attack shown in Figure 8A, but the reaction mechanism is unknown and might be initiated by CN– attack on the Mo instead. Central to the proposal in Figure 8A is the relationship between FDH and the enzyme xanthine oxidase (XO), in which the sulfido group of the Mo(VI)=S center has been discussed as a hydride acceptor.24 However, classification of the XO reaction as a direct hydride-transfer reaction that can simply be represented by the movement of electron pairs is an oversimplification of the complex molecular orbital interactions that occur during formation of the transition state, which have been elucidated by density functional theory (DFT) calculations.54,55 Furthermore, FDH and XO have different Mo coordinations and geometries. The sulfido group in XO is in an equatorial position and is able to access a low-lying dxy π* lowest unoccupied molecular orbital (LUMO), whereas the electronic structure of the Mo center in FDH is clearly different (but currently not well-defined). More importantly, for Mo-FDH to catalyze CO2 reduction effectively, the mechanism in Figure 8A would require Mo(IV)—SH to be an excellent hydride donor, capable of rapid and efficient hydride attack on the carbon atom in CO2. Future work to evaluate and compare the hydricity and acidity of the Mo(IV)—SH group might thus prove crucial in determining whether Figure 8A is relevant to the mechanism of FDH catalysis.
Figure 8.
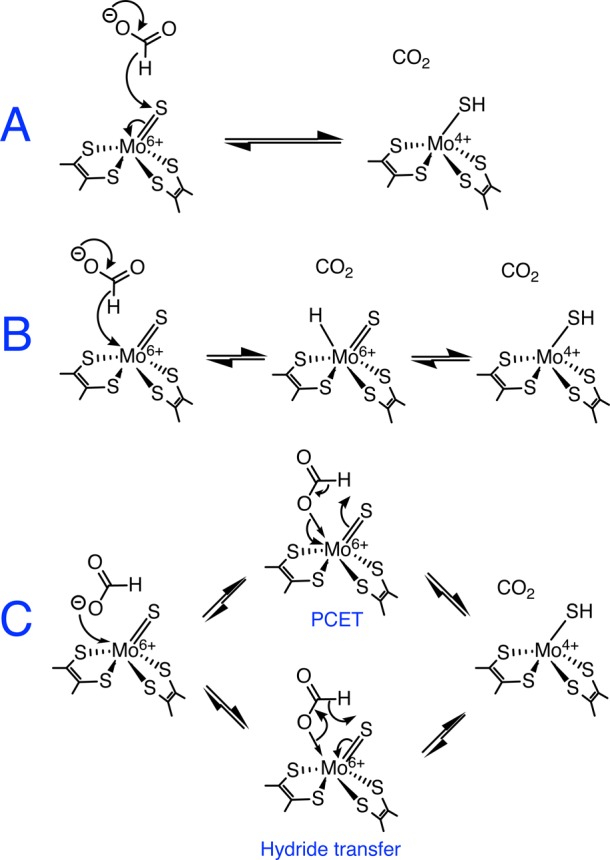
Possible mechanisms of formate oxidation by EcFDH-H that generate the Mo(IV)—SH product. (A) Hydride-transfer mechanism of Hille and co-workers.32 (B) Direct hydride transfer to Mo, followed by hydride migration to the sulfur, proposed by Zampella and co-workers.33 (C) Two alternative representations of the five-membered transition-state mechanism proposed here.
The mechanisms shown in panels B and C of Figure 8 require Sec dissociation to occur. The metal hydride formed in Figure 8B33 is attractive for CO2 activation; it represents a motif present in organometallic compounds that activate formate and CO2 (for example, the cyclopentadienyl Mo—H compounds that catalyze formate dehydrogenation56) and is consistent with formation of the Mo(V)—SH species because the hydride could migrate to the sulfido group upon oxidation to Mo(V) [to then be lost completely upon its oxidation to Mo(VI)]. This mechanism has been investigated extensively using DFT calculations on organometallic complexes, which have further suggested formation of the metal-formato complex following hydride insertion.57,58 However, the mechanism is more characteristic of electron-rich metal centers such as Ru(II) than of Mo(VI), and known high oxidation state Mo hydrides are also unstable in the presence of H+, given that they readily evolve H2.59 Furthermore, direct hydride transfer to Mo does not take advantage of donor–acceptor interactions between the Mo=S group and the C—H unit of the formate to weaken the C—H bond, as are understood to be crucial for transition-state stabilization during catalysis by XO.
In Figure 8C, we propose that formate coordinates to the Mo through its oxygen lone pairs and that formate oxidation occurs through a five-membered transition state that results directly in the Mo(IV)—SH product and that resembles the transition state formed in XO. The reaction is drawn in Figure 8C either as a proton-coupled electron-transfer (PCET) reaction or as a hydride-transfer reaction, simply by moving the arrows in opposite directions around the five-membered ring. In fact, the simple arrow representation cannot accurately reflect the complexity of the molecular orbital transitions that are probably involved. It is likely that (in analogy with XO) the reaction proceeds by intramolecular electron transfer within a transition state formed by interactions of Mo=S π and π* orbitals with C—H σ and σ* orbitals.54 The mechanism in Figure 8C avoids the formation of potentially H2-evolving Mo—H species59 and, in PCET form, is similar to that proposed by Kubiak and co-workers for a Ni-based inorganic catalyst.16,17 For CO2 reduction, the mechanism shown in Figure 8C suggests that CO2 itself does not strongly interact with the Mo, but that the Mo—O bond is formed as the reaction crosses the transition state, resulting in the coordinated formate product. In a related manner, DFT calculations have suggested that, for reduction to formate, CO2 binds end-on to the Ni(I) in nickel cyclam complexes, in a bent conformation in which the C—O bonds become elongated and poised for the subsequent reaction.60
Finally, we compare the mechanism of Mo-containing FDH with the mechanisms of two other enzymes that activate CO2. Carbonic anhydrase converts CO2 to HCO3– through attack of a Zn-activated nucleophilic OH– on the central C atom.61 Although donation of hydride by the Mo(IV)—SH in FDH resembles this mechanism, we note that the hydride has no nucleophilic lone pair and the equivalent step would require concerted cleavage of the SH bond, as shown in Figure 8C. CO dehydrogenase reduces CO2 to CO using an unusual NiFe4S4 cluster. Detailed structural and functional data support a mechanism in which the electron-rich Ni center attacks on the central C atom of CO2 and the resulting intermediate is stabilized by coordination of one of the O atoms of the CO2 to a cluster Fe center; the intermediate then proceeds to a Ni—CO species through protonation and loss of the Fe-coordinated O atom.62,63 The hydride-based mechanism shown in Figure 8C is analogous to this mechanism, with hydride attacking in the place of Ni and Mo—O bond formation in the place of Fe–O bond formation. The comparison supports the importance of Mo—O bond formation as a driving force for CO2 reduction by FDH, with the reaction then completed simply by dissociation of the nascent formate.
Conclusions
We have shown that inhibition of FDH catalysis is strongly dependent on the oxidation state of the enzyme, suggesting that inhibitors and substrates interact intimately with the Mo center in the active site. Based on the data presented, we propose a mechanism in which an open coordination site is formed on the Mo by reversible dissociation of the Sec ligand. The Sec can bind to stabilize the Mo center in the resting enzyme. We propose that CO2/formate interconversion proceeds through a five-membered transition state involving the sulfido ligand. Further testing of the mechanistic proposals discussed herein will require electrochemical, spectroscopic, computational, and structural data to be combined to probe the kinetics and thermodynamics of both CO2 reduction and formate oxidation and to define the structures of the intermediates formed.
Acknowledgments
This research was supported by BBSRC (BB/I026367/1 and BB/J000124/1), EPSRC NanoDTC Cambridge (EP/L015978/1), an ERC Consolidator Grant ‘MatEnSAP’ (682833), and The Medical Research Council (U105663141).
Supporting Information Available
The Supporting Information is available free of charge on the ACS Publications website at DOI: 10.1021/jacs.7b03958.
The authors declare no competing financial interest.
Supplementary Material
References
- Reda T.; Plugge C. M.; Abram N. J.; Hirst J. Proc. Natl. Acad. Sci. U. S. A. 2008, 105, 10654–10658. 10.1073/pnas.0801290105. [DOI] [PMC free article] [PubMed] [Google Scholar]
- Bassegoda A.; Madden C.; Wakerley D. W.; Reisner E.; Hirst J. J. Am. Chem. Soc. 2014, 136, 15473–15476. 10.1021/ja508647u. [DOI] [PubMed] [Google Scholar]
- Maia L. B.; Fonseca L.; Moura I.; Moura J. J. G. J. Am. Chem. Soc. 2016, 138, 8834–8846. 10.1021/jacs.6b03941. [DOI] [PubMed] [Google Scholar]
- Hartmann T.; Leimkühler S. FEBS J. 2013, 280, 6083–6096. 10.1111/febs.12528. [DOI] [PubMed] [Google Scholar]
- Wagner T.; Ermler U.; Shima S. Science 2016, 354, 114–117. 10.1126/science.aaf9284. [DOI] [PubMed] [Google Scholar]
- Kang P.; Cheng C.; Chen Z.; Schauer C. K.; Meyer T. J.; Brookhart M. J. Am. Chem. Soc. 2012, 134, 5500–5503. 10.1021/ja300543s. [DOI] [PubMed] [Google Scholar]
- Kang P.; Meyer T. J.; Brookhart M. Chem. Sci. 2013, 4, 3497–3502. 10.1039/c3sc51339d. [DOI] [Google Scholar]
- Kang P.; Zhang S.; Meyer T. J.; Brookhart M. Angew. Chem., Int. Ed. 2014, 53, 8709–8713. 10.1002/anie.201310722. [DOI] [PubMed] [Google Scholar]
- Machan C. W.; Sampson M. D.; Kubiak C. P. J. Am. Chem. Soc. 2015, 137, 8564–8571. 10.1021/jacs.5b03913. [DOI] [PubMed] [Google Scholar]
- Collin J. P.; Jouaiti A.; Sauvage J. P. Inorg. Chem. 1988, 27, 1986–1990. 10.1021/ic00284a030. [DOI] [Google Scholar]
- Chen L.; Guo Z.; Wei X.-G.; Gallenkamp C.; Bonin J.; Anxolabéhère-Mallart E.; Lau K.-C.; Lau T.-C.; Robert M. J. Am. Chem. Soc. 2015, 137, 10918–10921. 10.1021/jacs.5b06535. [DOI] [PubMed] [Google Scholar]
- Pun S.-N.; Chung W.-H.; Lam K.-M.; Guo P.; Chan P.-H.; Wong K.-Y.; Che C.-M.; Chen T.-Y.; Peng S.-M. J. Chem. Soc., Dalton Trans. 2002, 4, 575–583. 10.1039/b108472k. [DOI] [Google Scholar]
- Franco F.; Cometto C.; Ferrero Vallana F.; Sordello F.; Priola E.; Minero C.; Nervi C.; Gobetto R. Chem. Commun. 2014, 50, 14670–14673. 10.1039/C4CC05563B. [DOI] [PubMed] [Google Scholar]
- Taheri A.; Thompson E. J.; Fettinger J. C.; Berben L. A. ACS Catal. 2015, 5, 7140–7151. 10.1021/acscatal.5b01708. [DOI] [Google Scholar]
- Roy S.; Sharma B.; Pécaut J.; Simon P.; Fontecave M.; Tran P. D.; Derat E.; Artero V. J. Am. Chem. Soc. 2017, 139, 3685–3696. 10.1021/jacs.6b11474. [DOI] [PubMed] [Google Scholar]
- Galan B. R.; Schöffel J.; Linehan J. C.; Seu C.; Appel A. M.; Roberts J. A. S.; Helm M. L.; Kilgore U. J.; Yang J. Y.; DuBois D. L.; Kubiak C. P. J. Am. Chem. Soc. 2011, 133, 12767–12779. 10.1021/ja204489e. [DOI] [PubMed] [Google Scholar]
- Seu C. S.; Appel A. M.; Doud M. D.; DuBois D. L.; Kubiak C. P. Energy Environ. Sci. 2012, 5, 6480–6490. 10.1039/c2ee03341k. [DOI] [Google Scholar]
- Armstrong F. A.; Hirst J. Proc. Natl. Acad. Sci. U. S. A. 2011, 108, 14049–14054. 10.1073/pnas.1103697108. [DOI] [PMC free article] [PubMed] [Google Scholar]
- Boyington J. C.; Gladyshev V. N.; Khangulov S. V.; Stadtman T. C.; Sun P. D. Science 1997, 275, 1305–1308. 10.1126/science.275.5304.1305. [DOI] [PubMed] [Google Scholar]
- Raaijmakers H.; Macieira S.; Dias J. M.; Teixeira S.; Bursakov S.; Huber R.; Moura J. J. G.; Moura I.; Romão M. J. Structure 2002, 10, 1261–1272. 10.1016/S0969-2126(02)00826-2. [DOI] [PubMed] [Google Scholar]
- Jormakka M.; Törnroth J.; Byrne B.; Iwata S. Science 2002, 295, 1863–1868. 10.1126/science.1068186. [DOI] [PubMed] [Google Scholar]
- Thomé R.; Gust A.; Toci R.; Mendel R.; Bittner F.; Magalon A.; Walburger A. J. Biol. Chem. 2012, 287, 4671–4678. 10.1074/jbc.M111.327122. [DOI] [PMC free article] [PubMed] [Google Scholar]
- Schrapers P.; Hartmann T.; Kositzki R.; Dau H.; Reschke S.; Schulzke C.; Leimkühler S.; Haumann M. Inorg. Chem. 2015, 54, 3260–3271. 10.1021/ic502880y. [DOI] [PubMed] [Google Scholar]
- Hille R.; Hall J.; Basu P. Chem. Rev. 2014, 114, 3963–4038. 10.1021/cr400443z. [DOI] [PMC free article] [PubMed] [Google Scholar]
- Adamson H.; Simonov A. N.; Kierzek M.; Rothery R. A.; Weiner J. H.; Bond A. M.; Parkin A. Proc. Natl. Acad. Sci. U. S. A. 2015, 112, 14506–14511. 10.1073/pnas.1516869112. [DOI] [PMC free article] [PubMed] [Google Scholar]
- Raaijmakers H. C.; Romão M. J. J. Biol. Inorg. Chem. 2006, 11, 849–854. 10.1007/s00775-006-0129-2. [DOI] [PubMed] [Google Scholar]
- George G. N.; Colangelo C. M.; Dong J.; Scott R. A.; Khangulov S. V.; Gladyshev V. N.; Stadtman T. C. J. Am. Chem. Soc. 1998, 120, 1267–1273. 10.1021/ja973004l. [DOI] [Google Scholar]
- George G. N.; Costa C.; Moura J. G.; Moura I. J. Am. Chem. Soc. 1999, 121, 2625–2626. 10.1021/ja9841761. [DOI] [Google Scholar]
- Khangulov S. V.; Gladyshev V. N.; Dismukes G. C.; Stadtman T. C. Biochemistry 1998, 37, 3518–3528. 10.1021/bi972177k. [DOI] [PubMed] [Google Scholar]
- Gladyshev V. N.; Khangulov S. V.; Axley M. J.; Stadtman T. C. Proc. Natl. Acad. Sci. U. S. A. 1994, 91, 7708–7711. 10.1073/pnas.91.16.7708. [DOI] [PMC free article] [PubMed] [Google Scholar]
- Rivas M. G.; González P. J.; Brondino C. D.; Moura J. J. G.; Moura I. J. Inorg. Biochem. 2007, 101, 1617–1622. 10.1016/j.jinorgbio.2007.04.011. [DOI] [PubMed] [Google Scholar]
- Niks D.; Duvvuru J.; Escalona M.; Hille R. J. Biol. Chem. 2016, 291, 1162–1174. 10.1074/jbc.M115.688457. [DOI] [PMC free article] [PubMed] [Google Scholar]
- Tiberti M.; Papaleo E.; Russo N.; De Gioia L.; Zampella G. Inorg. Chem. 2012, 51, 8331–8339. 10.1021/ic300863d. [DOI] [PubMed] [Google Scholar]
- Mota C. S.; Rivas M. G.; Brondino C. D.; Moura I.; Moura J. J. G.; González P. J.; Cerqueira N. M. F. S. A. J. Biol. Inorg. Chem. 2011, 16, 1255–1268. 10.1007/s00775-011-0813-8. [DOI] [PubMed] [Google Scholar]
- Cerqueira N. M. F. S. A.; Fernandes P.; Gonzalez P. J.; Moura J. J. G.; Ramos M. J. Inorg. Chem. 2013, 52, 10766–10772. 10.1021/ic3028034. [DOI] [PubMed] [Google Scholar]
- Fourmond V.; Lautier T.; Baffert C.; Leroux F.; Liebgott P.-P.; Dementin S.; Rousset M.; Arnoux P.; Pignol D.; Meynial-Salles I.; Soucaille P.; Bertrand P.; Léger C. Anal. Chem. 2009, 81, 2962–2968. 10.1021/ac8025702. [DOI] [PubMed] [Google Scholar]
- Dixon M. Biochem. J. 1953, 55, 170–171. 10.1042/bj0550170. [DOI] [PMC free article] [PubMed] [Google Scholar]
- Axley M. J.; Grahame D. A. J. Biol. Chem. 1991, 266, 13731–13736. [PubMed] [Google Scholar]
- Hartmann T.; Schrapers P.; Utesch T.; Nimtz M.; Rippers Y.; Dau H.; Mroginski M. A.; Haumann M.; Leimkühler S. Biochemistry 2016, 55, 2381–2389. 10.1021/acs.biochem.6b00002. [DOI] [PubMed] [Google Scholar]
- Axley M. J.; Grahame D. A.; Stadtman T. C. J. Biol. Chem. 1990, 265, 18213–18218. [PubMed] [Google Scholar]
- Léger C.; Bertrand P. Chem. Rev. 2008, 108, 2379–2438. 10.1021/cr0680742. [DOI] [PubMed] [Google Scholar]
- Cheng Y.-C.; Prusoff W. H. Biochem. Pharmacol. 1973, 22, 3099–3108. 10.1016/0006-2952(73)90196-2. [DOI] [PubMed] [Google Scholar]
- Léger C.; Lederer F.; Guigliarelli B.; Bertrand P. J. Am. Chem. Soc. 2006, 128, 180–187. 10.1021/ja055275z. [DOI] [PubMed] [Google Scholar]
- Lever A. B. P. Inorg. Chem. 1990, 29, 1271–1285. 10.1021/ic00331a030. [DOI] [Google Scholar]
- Hansch C.; Leo A.; Taft R. W. Chem. Rev. 1991, 91, 165–195. 10.1021/cr00002a004. [DOI] [Google Scholar]
- Popov V.; Lamzin V. Biochem. J. 1994, 301, 625–643. 10.1042/bj3010625. [DOI] [PMC free article] [PubMed] [Google Scholar]
- Blanchard J. S.; Cleland W. W. Biochemistry 1980, 19, 3543–3550. 10.1021/bi00556a020. [DOI] [PubMed] [Google Scholar]
- Axley M. J.; Bock A.; Stadtman T. C. Proc. Natl. Acad. Sci. U. S. A. 1991, 88, 8450–8454. 10.1073/pnas.88.19.8450. [DOI] [PMC free article] [PubMed] [Google Scholar]
- Smith P. D.; Slizys D. A.; George G. N.; Young C. G. J. Am. Chem. Soc. 2000, 122, 2946–2947. 10.1021/ja9938332. [DOI] [Google Scholar]
- Smith S. J.; Whaley C. M.; Rauchfuss T. B.; Wilson S. R. Inorg. Chem. 2006, 45, 679–687. 10.1021/ic051443c. [DOI] [PubMed] [Google Scholar]
- Birnbaum J.; Godziela G.; Maciejewski M.; Tonker T. L.; Haltiwanger R. C.; Rakowski DuBois M. Organometallics 1990, 9, 394–401. 10.1021/om00116a015. [DOI] [Google Scholar]
- Appel A. M.; Lee S.; Franz J. A.; DuBois D. L.; Rakowski DuBois M. J. Am. Chem. Soc. 2009, 131, 5224–5232. 10.1021/ja8093179. [DOI] [PubMed] [Google Scholar]
- Barber M. J.; May H. D.; Ferry J. G. Biochemistry 1986, 25, 8150–8155. 10.1021/bi00373a004. [DOI] [Google Scholar]
- Sempombe J.; Stein B.; Kirk M. L. Inorg. Chem. 2011, 50, 10919–10928. 10.1021/ic201477n. [DOI] [PMC free article] [PubMed] [Google Scholar]
- Doonan C. J.; Rubie N. D.; Peariso K.; Harris H. H.; Knottenbelt S. Z.; George G. N.; Young C. G.; Kirk M. L. J. Am. Chem. Soc. 2008, 130, 55–65. 10.1021/ja068512m. [DOI] [PubMed] [Google Scholar]
- Neary M. C.; Parkin G. Chem. Sci. 2015, 6, 1859–1865. 10.1039/C4SC03128H. [DOI] [PMC free article] [PubMed] [Google Scholar]
- Kumar N.; Camaioni D. M.; Dupuis M.; Raugei S.; Appel A. M. Dalt. Trans. 2014, 43, 11803–11806. 10.1039/C4DT01551G. [DOI] [PubMed] [Google Scholar]
- Xue L.; Ahlquist M. S. G. Inorg. Chem. 2014, 53, 3281–3289. 10.1021/ic4027317. [DOI] [PubMed] [Google Scholar]
- Porcher J.-P.; Fogeron T.; Gomez-Mingot M.; Derat E.; Chamoreau L.-M.; Li Y.; Fontecave M. Angew. Chem., Int. Ed. 2015, 54, 14090–14093. 10.1002/anie.201505607. [DOI] [PubMed] [Google Scholar]
- Song J.; Klein E. L.; Neese F.; Ye S. Inorg. Chem. 2014, 53, 7500–7507. 10.1021/ic500829p. [DOI] [PubMed] [Google Scholar]
- Lindskog S. Pharmacol. Ther. 1997, 74, 1–20. 10.1016/S0163-7258(96)00198-2. [DOI] [PubMed] [Google Scholar]
- Can M.; Armstrong F. A.; Ragsdale S. W. Chem. Rev. 2014, 114, 4149–4174. 10.1021/cr400461p. [DOI] [PMC free article] [PubMed] [Google Scholar]
- Fesseler J.; Jeoung J. H.; Dobbek H. Angew. Chem., Int. Ed. 2015, 54, 8560–8564. 10.1002/anie.201501778. [DOI] [PubMed] [Google Scholar]
Associated Data
This section collects any data citations, data availability statements, or supplementary materials included in this article.


