

Abstract
We compute the autocorrelation function of the donor-acceptor tunneling matrix element 〈TDA(t)TDA(0)〉 for six Ru-azurin derivatives. Comparison of this decay time to the decay time of the time-dependent Franck-Condon factor {computed by Rossky and coworkers [Lockwood, D. M., Cheng, Y.-K. & Rossky, P. J. (2001) Chem. Phys. Lett. 345, 159-165]} reveals the extent to which non-Condon effects influence the electron-transfer rate. 〈TDA(t)TDA(0)〉 is studied as a function of donor-acceptor distance, tunneling pathway structure, tunneling energy, and temperature to explore the structural and dynamical origins of non-Condon effects. For azurin, the correlation function is remarkably insensitive to tunneling pathway structure. The decay time is only slightly shorter than it is for solvent-mediated electron transfer in small organic molecules and originates, largely, from fluctuations of valence angles rather than bond lengths.
Keywords: correlation functions, Franck-Condon breakdown, dephasing, coupling pathways, redox reactions
The interplay among nuclear motion and electronic dynamics is the subject of increasing focus in the field of electron transfer (ET) processes (1-8). Recent research has focused on the effects of bridge nuclear motion on ET, with chemical, biological, and electronic device applications (see refs. 9-11 for reviews). Early theoretical analysis indicates that tunneling matrix element modulation by bridge dynamics can alter the free energy dependence of ET reaction rates by causing the Born-Oppenheimer (12) and Franck-Condon approximations to fail (13-15). More recently, theoretical studies explored ET kinetics in systems with fluctuating donor-acceptor matrix elements (16-24). Bridge motion can cause large and rapid donor-acceptor matrix element fluctuations, affecting the tunneling pathway structure and the interferences among pathways (25-37). The coupling matrix element fluctuations may have large contributions from solvent-polarization fluctuations (23), and these fluctuations facilitate electronically forbidden and gated ET (38-47). Finally, bridge-nuclear relaxation creates in-elastic tunneling pathway channels (11, 20, 24, 47-49) that can change the mechanism of ET from superexchange to resonant tunneling to sequential hopping (11, 41-44, 50-62) and can lead to breakdown of the Born-Oppenheimer approximation (63, 64).
The goal of this work is to characterize tunneling matrix element fluctuations in azurin and, in particular, to examine their influence on the ET rate and on the validity of the Franck-Condon approximation. Franck-Condon breakdown can reduce the ET rate in the case of activationless ET reactions and enhance the rate for activated ET (18). ET in Ru-modified azurin is nearly activationless, and the protein is often approximated as being a rigid medium for tunneling because the tunneling pathways traverse a β sheet. In this work, we compute the effects of tunneling matrix element fluctuations on the rate as a function of distance, temperature, protein structural fluctuations, and intervening pathway structure. Further, we identify the types of motion that cause the coupling to fluctuate.
The general derivation of the nonadiabatic rate expression for fluctuating donor-acceptor matrix elements cannot assume the validity of the Franck-Condon separation. As explained below, the Franck-Condon approximation is only applicable when matrix element fluctuations are slower than the decay time of the thermally weighted nuclear Franck-Condon overlap factor. This decay time, τFC, measures the escape time of the system from regions of Franck-Condon allowed transitions. τFC is roughly the time it takes for two nuclear wavepackets to lose overlap when they are initially placed at the crossing point between the donor and acceptor diabatic energy surfaces and each is allowed to move on a separate surface.  , where λ is the total reorganization energy and T is the temperature (65, 66).
ET Rates and Correlation Functions
The argument above about the validity of the Franck-Condon approximation can be derived from a time-dependent formulation of the ET rate. In the vibronic state representation, the nonadiabatic rate is a thermally weighted sum of energy-conserving transitions between initial |D; v, a〉 and final |A; w, b〉 Born-Oppenheimer vibronic levels, i.e.,
 |
[1] |
(1-7, 20, 24, 67), where |D〉 and |A〉 are the donor and acceptor electronic states, and |v〉 and |w〉 are vibrational levels associated with the donor and acceptor diabatic energy surfaces. These vibrations modulate the energies of |D〉 and |A〉 but not the tunneling barrier between them. |a〉 and |b〉 are vibrational levels associated with vibrations that modulate only the tunneling barrier (dominantly orientational modes for long-distance ET). The energies of |D; v, a〉 and |A; w, b〉 are ED + εv + εa and EA + εw + εb, respectively, where ED and EA denote the minimum electronic state energies and εi denotes vibrational state energies. The thermal probability of the initial vibronic state |D; v, a〉 is taken to be the product PDvPa of the thermal probabilities of the vibrational levels |v〉 and |a〉 (consistent with the assumption that motions affecting the donor and acceptor energies are independent of those affecting the tunneling barrier). The scattering operator T̂ in Eq. 1 is given by
 |
[2] |
where V̂ is the donor-bridge/acceptor-bridge electronic coupling operator and Ĝbr is the bridge electronic/vibrational Green's function. T̂ describes tunneling transitions between the electronic |D〉 and |A〉 states that are accompanied by transitions between bridge vibrational states, i.e., 〈D; v, a|T̂|A; w, b〉 = 〈v|w〉〈a|T̂DA|b〉 where T̂DA ≡ 〈D|T̂|A〉 is an operator in the space of bridge vibrational levels. This characteristic means that the tunneling electron can interact with the bridge vibrations (e.g., refs. 14, 20, 47, and 49).
By using the Fourier representations of the δ-function in Eq. 1 (68), the nonadiabatic rate is
 |
[3] |
where
 |
[4] |
is the thermal correlation function of the tunneling operator in Eq. 2. T̂DA(0) = 〈D|T̂|A〉 and  , where
  is the bridge vibrational Hamiltonian. The term
 |
[5] |
is the thermally weighted time-dependent Franck-Condon factor ( and
and  are the vibrational Hamiltonians for the donor and acceptor energy surfaces).
Eq. 3 is a time-domain expression for the rate, equivalent to the energy-domain expression in Eq. 1 (its Fourier transform). It provides a time-dependent view of the Condon approximation breakdown. The time integral in Eq. 3 is the Fourier transform of the product of two decaying functions,  and
and  , evaluated at the D-A energy gap frequency. To recover the standard expression for the Franck-Condon rate, we replace CTDA(t) in Eq. 3 by
  and factor it out of the integral, i.e.,
 |
[6] |
A necessary condition for the validity of this approximation is that CFC(t) decays much more rapidly than CTDA(t). The time integral in Eq. 3 is equal to the convolution integral  of the Fourier transforms of CFC(t) and CTDA(t). If CFC(t) decays much faster than CTDA(t), then the width of C̃FC(ω) is much greater than the width of
  (assuming roughly Lorentzian or Gaussian envelopes for both functions). Therefore, in the frequency region around
 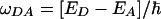 , where
 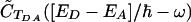 is nonzero, C̃FC(ω) is a slowly varying function. Substituting
  in the convolution integral, and keeping only C̃FC(ωDA), gives
 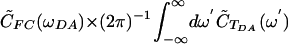 (where ω′ = ωDA - ω). This zeroth-order expression is equivalent to Eq. 6, because
  , and
, and  is the time integral of Eq. 6. Corrections to the Franck-Condon rate can be derived by retaining higher-order terms in the Taylor expansion of C̃FC(ω). Non-Condon corrections generally depend on ED - EA, in addition to the decay times of CFC(t) and CTDA(t) (17-19, 22, 24), because the energy gap determines a third time scale in Eq. 3, the oscillation period of the exponential.
The advantage of the time-domain description (Eq. 3) is that the decay times of CFC(t) and CTDA(t) can be associated readily with structural fluctuations of the molecule and its solvent, by using molecular dynamics (MD) simulations and semiclassical approximations of the correlation functions. In the classical limit for bridge motion, the T̂DA(t) matrix elements averaged over bridge vibrational states (Eq. 4) are replaced by a superexchange matrix element that is modulated by the classical bridge trajectories R(t) {i.e., TDA(t) = TDA[R(t)]}. In this case, the averages in Eqs. 4 and 5 become averages over classical trajectories.
Correlation Functions in Azurin
To our knowledge, the only computation of the short-time decay of CFC(t) for a biological ET system was carried out for azurin by Lockwood et al. (69). The decay was computed by using the frozen Gaussian approximation for the nuclear wavepackets (70, 71). The multidimensional nuclear wave functions were approximated as products of atom-centered Gaussian wavepackets of constant widths moving along classical trajectories (obtained by MD simulations). In this case, CFC(t) is the thermal average of the time-dependent overlap  between an initial nuclear wavepacket propagated with the electron in the donor state and the same wavepacket propagated with the electron in the acceptor state. The time it takes to lose overlap is τFC. In this semiclassical approach, the rate in Eq. 3 is
 |
[7] |
where TDA(t) is the superexchange matrix element evaluated along classical nuclear trajectories, and 〈 〉T denotes the classical thermal average. Lockwood et al. (69) reported τFC = 3-4 fsec with contributions from both solvent and protein matrix relaxation. Their value is consistent with the estimate  fsec, with λ ≃ 1 eV (1 eV = 1.602 × 10⁻¹⁹ J) at room temperature. Although τFC is not the only time scale associated with the thermally weighted Franck-Condon factor (65, 66), it seems that, at least in the case of azurin, it is the shortest time scale.
TDA(t) fluctuations have been studied for many ET systems using MD simulations and quantum chemical semiempirical calculations (20, 25, 27-37). In most cases, large fluctuations in TDA were observed, sometimes on time scales as short as tens of femtoseconds. A measure of the fluctuations of TDA(t) is the coherence parameter, defined as  (32). For a flexible bridge with multiple interfering tunneling pathways Rcoh approaches zero. The coherence parameter is the infinite time limit of the normalized autocorrelation function, Rcoh = limt→∞CTDA(t)/CTDA(0) (in the classical limit for the nuclear motion). The coherence parameter does not contain information about how fast coherence is lost as a result of the fluctuations in the matrix element. This information is contained in the decay time of CTDA(t), τcoh. Analysis of the spin-boson model with an exponentially decaying CTDA(t) (CTDA(t) ∝ exp[-t/τcoh]) has shown a complex dependence of the non-Condon rate on τcoh (18). Matrix element fluctuations may enhance or reduce the ET rate (with respect to its static, infinite τcoh value), depending on the relative magnitudes of the reorganization energy and the driving force (18).
Recently, a perturbative theory was developed (24) to calculate non-Condon corrections to the ET rate. The theory is based on the Taylor expansion of C̃FC(ω) described in the previous section. It is equivalent to an expansion of the rate in terms of Rcoh and τcoh, and it gives a lowest-order correction to the classical Marcus rate equal to
 |
[8] |
where k(0) is the Marcus rate, λ the reorganization energy, and ΔE0 is the driving force of the reaction. k(2) also depends on (τFC)2, as seen by substituting  in Eq. 8. Rcoh and τcoh were computed from MD/semiempirical simulations of a C-clamp donor-acceptor molecule in different solvents (37). CTDA(t) showed a decay time of τcoh ≈ 0.1 psec and a coherence parameter close to zero. These values gave a negligible non-Condon correction to the rate (0.04%) based on Eq. 8.
To our knowledge, this C-clamp molecule analysis is the only computation of CTDA(t) for an ET system. Because Franck-Condon breakdown depends on the relative decay times of CTDA(t) and CFC(t), it is important to explore CTDA(t) for a biological ET system like azurin, where there is a wealth of experimental information on the rates (72-76), as well as prior analysis of CFC(t) (69). Here, we compute CTDA(t) for the Ru-modified azurin with Protein Data Bank ID code 1BEX (77) and some of its mutants. We use MD simulations and extended-Hückel electronic structure calculations to compute CTDA(t). Given the femtosecond-time-scale decay of CFC(t) (69), we focus on the short time decay of CTDA(t) and interpret this decay in terms of protein structure and dynamics. Fig. 1 shows the structure of azurin and positions of the histidine residues linked to the Ru-bipyridine complex in the wild type (WT) and the derivatives as follows: H83G Q107H, H83G M109H, H83G K122H, H83G T124H, and H83G T126H. The donor-acceptor pairs were chosen to study CTDA(t) as a function of the following: (i) average (MD-based) donor-acceptor distance (metal-to-metal), T122H (14 Å), WT (17 Å), M109H (19 Å), T124H (22 Å), Q107H (25 Å), and T126H (25 Å); (ii) distance along the same covalent pathway, (T122H vs. T124H and T126H); and (iii) intervening medium structure (covalent, hydrogen-bonded, or mixed pathways) for approximately the same average donor-acceptor distance (Q107H and T126H). Further, for all donor-acceptor pairs, CTDA(t) is computed for a range of tunneling energies to assess the sensitivity of the correlation function to D/A energetics.
Fig. 1.

Structures of the Ru-modified WT azurin 1BEX and its mutants, H83G Q107H, H83G M109H, H83G K122H, H83G T124H, and H83G T126H, used in the calculations of the TDA correlation functions.
By choosing donor-acceptor pairs with similar immediate environments, we aim to isolate the effects of bridge structure and dynamics on CTDA(t). Further, because of the approximations contained in MD simulations and extended-Hückel calculations, we seek generic features of the correlation functions that are robust with respect to parameter choice (e.g., tunneling energy) and geometric constraints. Only the short-time dynamics of CTDA(t) are explored because the initial decay of the Franck-Condon factor is very rapid.
MD Simulations. The simulated Pseudomonas aeruginosa azurin structures were based on the Protein Data Bank structure 1BEX (77). Five other structures with different locations of the Ru-bipyridine complex were modeled by performing a H83G mutation and Q107H, M109H, K122H, T124H, or T126H mutations using the sybyl molecular modeling package (Version 6.5, Tripos Associates, St. Louis). The Ru-bipyridine complex was added to each derivative by using the program vmd (www.ks.uiuc.edu/Research/vmd) and the 1BEX structure as a template. All structures were solvated in bulk TIP3 water, and Na+ and Cl- counterions were added to an ionic strength of 200 mM. The resulting structures included 18,267-19,420 atoms and had dimensions of ≈55 × 57 × 53 Å3.
The structures underwent energy minimization for 500 steps with harmonic constraints imposed on the protein backbone and Ru-bipyridine complex, followed by equilibration for 200 psec with the same constraints and 1 nsec without constraints at 310 K. Simulations were performed on up to 300 processors at the Duke University Center for Computational Science, Engineering and Medicine cluster (www.csem.duke.edu) and on the Biophysics Cluster at the University of Cyprus, by using the programs charmm (78) and namd (www.ks.uiuc.edu/Research/namd) with the charmm force field (79), isothermal-isobaric (NpT) ensemble, periodic boundary conditions, a Langevin thermostat, and full electrostatics particle-mesh Ewald calculations (80). The force-field parameters for the copper center were taken from ref. 81, and the parameters for the Ru-bipyridine complex were taken from ref. 27. Protein conformation samples for the effective coupling calculations were obtained by performing three series of MD simulations (5,000 conformations saved every 1, 10, and 100 fsec, respectively) at 310 K for each derivative.
To explore how protein structural motion affects the correlation function decay time, additional MD simulations were performed for the WT 1BEX as follows: (i) Simulations with no constraints at 100, 30, 10, and 3 K (preceded by a 1-nsec-long equilibration at these temperatures); (ii) simulations at 310 K with SHAKE constraints on all bonds to suppress bond-length fluctuations [the program charmm (78) was used for this simulation, because implementation of the SHAKE algorithm in namd2 is limited to bonds with hydrogen atoms); and (iii) simulations at 310 K with SHAKE constraints on all bonds with hydrogen atoms and all valence angle force constants (including Urey-Bradley terms) scaled up by a factor of 1,000 to suppress fluctuations of both bond lengths and valence angles (these simulations were performed with integration time step of 0.1 fsec).
TDA Calculations. In the superexchange regime, the effective tunneling coupling is given by refs. 82 and 83
 |
[9] |
where S̃ and H̃ are the orbital overlap and Hamiltonian matrices of the donor [index (d)], bridge [index (b)], and acceptor [index (a)], respectively. The calculations were performed by using Slater-type valence orbitals and an extended-Hückel Hamiltonian. Calculations at this level are rapid and provide reasonable qualitative estimates of the effective tunneling matrix elements in proteins and small molecules (32, 35, 83-90)
The calculations were performed by using code based on the program forticon8 (91), itpack2c routines (92), and parameters for the extended-Hückel Hamiltonian and the Slater orbitals based on density functional calculations (93). To describe the extent of mixing the initial with final states onto the bridge, the effective electronic coupling was renormalized with the method described in refs. 35, 90, and 94 as follows:
 |
[10] |
Ab initio calculations of Solomon and coworkers (95, 96) indicate that the azurin donor state is dominantly composed of a dxy-orbital of copper ( ) and a py-orbital of sulfur in Cys-112 (
 ). In our calculations, the molecules were oriented so that the Cu-S metal bond is aligned along the x axis, and the nitrogens in His-46 and His-117 are positioned in the x-y plane [more precisely, close to the x-y plane, because the strongest copper ligands form a slightly nonplanar structure (95, 96)]. The donor orbital was defined as
  . Because the t2g states fluctuate in energy as the protein fluctuates, the effective electronic coupling was computed to each of the five d-orbitals of ruthenium. The values of Rcoh and τcoh were computed for each d-orbital and then averaged.
Discussion
Fig. 2 shows the autocorrelation function of TDA, normalized by its initial value, the initial ensemble average of  ,
,  . The averaging was performed over a trajectory of 5,000 × 1-fsec MD snapshots. The coherence parameter is the long time limit value of
  , and τcoh is approximately the amount of time it takes for
  to drop to 1/e of its initial value.
  in Fig. 2 is not exact; it contains both systematic and statistical error. The systematic error is related to the approximations of classical MD, time step, and extended-Hückel electronic structure analysis. The statistical error is related to the use of finite duration trajectories for the averaging. This error increases rapidly with t because fewer points are used for the computation of
  for large t. Therefore, only the short time dynamics of
  is reliable, and τcoh should be derived from these dynamics. The method used to compute τcoh and its error is described in ref. 97. Given
  for a trajectory of length N (where
  ), the coherence time (in femtosecond units) is defined as
  , where the sum is terminated when
  (97). The corresponding error is
 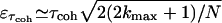 , and it reflects the statistical error for the short-time component of the autocorrelation function. An alternative definition for the coherence time is
 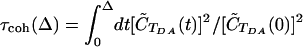 , where Δ is restricted to short times (98). In this case, τcoh can be computed by plotting τcoh(Δ) as a function of Δ until the first plateau is reached. We found that the two methods give similar results for τcoh. Because of the considerable error in the autocorrelation function for large t, the coherence parameters were not derived by taking the large t limit of normalized autocorrelation functions. Rather, they were computed directly from the averages 〈TDA〉 and
  by setting
  . Error analysis for 〈TDA〉 and
  (and thus Rcoh) is based on the block renormalization method described in ref. 99.
Fig. 2.

 for the WT computed from a trajectory of 5,000 × 1 fsec MD snapshots at 310 K. The donor is the Cu-S(Cys-112) orbital described in TDA Calculations, and the acceptor is a dx2-y2 ruthenium orbital. The tunneling energy is -10.8 eV. The coherence parameter is the long-time limit of
  , and τcoh is approximately the amount of time it takes for
  to drop to 1/e of its initial value.
Fig. 3 shows the dependence of 〈TDA〉 (Upper) and  (Lower) on the number N of MD conformations used to compute the averages (WT with acceptor on the Ru dx2-y2 orbital). All conformations were chosen from the same MD trajectory (0.5-nsec total length) at equal intervals. The first point in both graphs corresponds to averaging over 10 MD conformations separated by 50 psec, the final point to 5,000 conformations separated by 100 fsec. The averages and their errors stabilize as the number of points increases. At N = 5,000, the values are similar to those obtained from 5,000 conformations separated by 1 fsec. This result is not surprising because all of the computed coherence times are <100 fsec, i.e., a 5,000 × 1-fsec trajectory contains at least 50 independent blocks. It should be noted that this kind of error analysis is often neglected in the computation of 〈TDA〉 and
  for proteins. Rather, emphasis is usually placed on the level of electronic structure theory. Even though a high-level quantum chemical method may reduce the systematic errors of average values, improving electronic structure methods does not address statistical errors. Statistical errors can be large because of the limited number of data points used in the averaging as the computational cost of the quantum chemical calculations grows.
Fig. 3.

The dependence of 〈TDA〉 (Upper) and  (Lower) on the number (N) of MD conformations used to compute the averages. All conformations were chosen from the same MD trajectory of the WT structure (0.5-nsec total length). The temperature is 310 K, and TDA was computed with Etun =-10.8 eV. The donor and acceptor orbitals are the same as in Fig. 2. The first point N = 10 on the horizontal axis denotes 10 MD conformations separated by 50 psec, the second point is 25 conformations separated by 20 psec, and the final point is 5,000 conformations separated by 100 fsec. In all cases, the block renormalization method was used to compute the errors.
Tables 1, 2, 3 show the values of Rcoh and τcoh (and their statistical errors εRcoh and ετcoh, respectively) averaged over the five donor Ru d-orbitals. For each Ru d-orbital, both Rcoh and τcoh were computed from a 5,000-fsec trajectory (1-fsec time step) at Etun = -10.8 eV [the value used in previous studies of azurin (88, 90)]. Table 1 shows Rcoh and τcoh for the WT and the mutants at 310 K. The entry order in the table tracks donor-acceptor center-to-center distance (the last column shows the average distances for >5,000 fsec). Table 2 shows Rcoh and τcoh for the WT as a function of temperature. Table 3 shows these values for the WT at 310 K and different constraints imposed on the protein. The first row of the table reports values obtained for unconstrained MD. The second row data were computed with constraints on all bond lengths (vide supra). The third row shows the values computed with constraints on lengths of bonds with hydrogen atoms and all valence angle force constants scaled up by a factor of 1,000.
Table 1. Distance and medium dependence at T = 310 K and Etun = - 10.8 eV.
| Structure | Rcoh | εRcoh | τcoh, fs | ετcoh, fs | 〈RDA〉, Å |
|---|---|---|---|---|---|
| K122H | 0.04 | 0.06 | 26.7 | 9.7 | 13.8 |
| WT 83H | 0.12 | 0.08 | 34.9 | 15.2 | 17.3 |
| M109H | 0.03 | 0.07 | 55.9 | 32.3 | 19.1 |
| T124H | 0.11 | 0.09 | 27.5 | 10.2 | 21.9 |
| Q107H | 0.07 | 0.06 | 20.3 | 6.4 | 24.8 |
| T126H | 0.01 | 0.02 | 26.6 | 9.8 | 25.1 |
Table 2. Temperature dependence for WT at Etun = - 10.8 eV.
| Temp., K | Rcoh | εRcoh | τcoh, fs | ετcoh, fs |
|---|---|---|---|---|
| 310 | 0.12 | 0.08 | 34.9 | 15.2 |
| 100 | 0.21 | 0.12 | 52.5 | 28.8 |
| 30 | 0.60 | 0.10 | 44.1 | 25.3 |
| 10 | 0.66 | 0.12 | 43.0 | 19.8 |
| 3 | 0.86 | 0.10 | 30.8 | 14.4 |
Temp., temperature.
Table 3. Constraint dependence for WT at T = 310 K and Etun = - 10.8 eV.
| Structural constraints | Rcoh | εRcoh | τcoh, fs | ετcoh, fs |
|---|---|---|---|---|
| None | 0.12 | 0.08 | 34.9 | 15.2 |
| SHAKE (all bonds) | 0.08 | 0.11 | 39.1 | 21.1 |
| SHAKE (bonds with hydrogens) and all valence angles | 0.06 | 0.14 | 68.5 | 44.5 |
The tables are representative of the results we obtained for different 5,000-fsec trajectories. The mutants T122H, T124H, and T126H lie along the same covalent pathway, whereas Q107H and T126H have approximately the same donor-acceptor distance but different intervening pathways (Fig. 1). Table 1 shows that the decay of 〈TDA(t)TDA(0)〉 for all structures is of the order of a few tens of femtoseconds, and the coherence parameter  is of the order of 0.1 or less. Therefore, both Rcoh and τcoh are robust, changing little with donor-acceptor distance and intervening medium. Table 2 shows that Rcoh and τcoh change little with temperature. An increase in Rcoh is observed only at 30 K and lower temperatures (not probed in experiments), whereas τcoh does not depend on temperature within the statistical error.
Table 3 summarizes how constraints on protein structural flexibility influence Rcoh and τcoh. Use of different constraints, along with the temperature dependence, provides a strategy to identify specific kinds of protein motion that control these two parameters. The TDA(t) time series show the major fluctuations on the time scale of tens of femtoseconds. Much smaller amplitude fluctuations of the femtosecond time scale are superimposed on the major fluctuations. These two time scales correspond to valence angle vibrations and covalent bond vibrations, respectively. MD does not accurately describe the time dependence of bond vibrations, but it does give the correct order of magnitude for the rms deviations of bond lengths. Therefore, we expect that the magnitudes of matrix element fluctuations caused by bond vibrations, as predicted by MD, are of the right order of magnitude. The first kind of constraints used in our simulations was the SHAKE constraints on all bond lengths (including the donor and acceptor units). In the TDA(t) time dependence, these constraints eliminate the weak (femtosecond time scale) fluctuations but have a negligible effect on the strong (tens of femtoseconds) fluctuations. Accordingly, as shown in Table 3, neither Rcoh nor τcoh is significantly affected by the SHAKE constraints, indicating that these parameters are not sensitive to covalent bond vibrations. The other kind of constraints included the SHAKE constraints on lengths of all bonds with hydrogen atoms, combined with scaling up all force constants for valence angles. Suppressing both the fastest bond vibrations and all valence angle vibrations, these constraints visibly increase the time scale of the major TDA(t) fluctuations, consistently increasing τcoh by almost 80% (Table 3). Importantly, the 1,000-fold increase in the valence angle force constants has a similar effect on angle fluctuations as a 1,000-fold decrease in temperature, i.e., cooling the system down to ≈0.3 K. This result explains why no significant increase in τcoh was observed in the simulations at low temperatures: even at 3 K, angle fluctuations were large enough to cause dephasing. In addition to the direct effect on dephasing, valence angle fluctuations also drive dihedral angle fluctuations that, in turn, modulate the lengths of hydrogen bonds, thereby affecting the electronic interference among the dominant ET pathways and TDA (32). Indeed, we observed a decrease of >30% in dihedral angle fluctuations caused by imposing the above constraints. However, these constraints have no significant effect on Rcoh, suggesting that the latter is controlled not only by valence angle fluctuations but also by dihedral angle fluctuations, which dominate the slower motion of the protein structure.
Finally, we do not find a significant dependence of Rcoh and τcoh on the electron tunneling energy for relevant ET tunneling energies in azurin. A large effect of the tunneling energy on τcoh was observed only when the tunneling energy was artificially brought into resonance with bridge-centered eigenstates. In this case, τcoh dropped, and coherence was lost within 5 fsec. This situation is not expected to be relevant to the Ru-modified derivatives examined here, but recent experiments with highly oxidizing ET reagents in proteins may access this regime (100, 101). Moreover, near-resonant ET may be relevant to DNA ET (8), as well as to unsaturated organic ET systems with low donor(acceptor)-bridge energy gaps (41, 42).
Fast coherence loss in azurin arises from TDA fluctuations on the time scale of tens of femtoseconds. The time scale for coherence loss is long compared with the Franck-Condon time of 3-4 fsec for azurin computed by Lockwood et al. (69) (the latter is in agreement with the estimate  fsec for λ ≈ 1 eV at room temperature). Therefore, we expect the Franck-Condon approximation to Eq. 6 to be accurate for single-step tunneling in azurin.
Interestingly, the values of Rcoh and τcoh in azurin are not very different from those computed (37) for ET in a much smaller C-clamp-shaped donor-acceptor molecule. In the C-clamps, fluctuations in the superexchange interaction through solvent presumably lead to the decoherence. The time scale of this decoherence is within an order of magnitude of the electronic decoherence time computed here for the Ru-modified azurins. By using Eq. 8 for azurin with an average τcoh ≃ 30 fsec, λ ≃ 1 eV, and Δ E0 ≃ -λ, gives a correction of 0.8% of the Marcus rate. As in the case of ET in C-clamped molecules, for ET in azurin non-Condon effects are not significant.
The type of non-Condon effects considered here are relevant to ET reactions through avoided crossings. If ET involves an electronic transition at a conical intersection (102) (as may be the case in excited-state ET), non-Condon effects are significant. In this situation, the Born-Oppenheimer approximation is not valid at the avoided crossing, and corrections to the superexchange expression for the tunneling matrix element must be considered (63).
Conclusions
Simulations of the tunneling matrix element autocorrelation function for Ru-modified WT azurin and several of its mutants show that the decay of 〈TDA(t)TDA(0)〉 is rapid, with a time constant of a few tens of femtoseconds. The coherence parameter 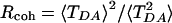 is of the order of 0.1 or less. This finding means that azurin is a fluctuating medium for tunneling with multiple interfering tunneling pathways. Within the statistical errors of our analysis, we cannot ascertain any significant dependence of Rcoh and τcoh on the donor-acceptor distance or intervening medium structure or any sensitivity to the presence or absence of chemical bond vibrations. Importantly, decoherence occurs on the time scale of valence angle fluctuations, indicating the central role of valence angle fluctuations in TDA dephasing. All computed τcoh values are an order of magnitude longer than the decay time of the thermally weighted Franck-Condon factor τFC, computed by Lockwood et al. (69) to be 3-4 fsec. Therefore, non-Condon effects are insignificant for the case of azurin in the deep tunneling regime. As tunneling energies approach the charge injection limit, the Condon approximation will likely fail.
The methodology described in this work is suited for the study of dynamics-function relationships for ET reactions. An interesting question that should be addressed, by using this methodology, is whether non-Condon effects and dephasing characteristics of proteins vary with their secondary (and tertiary) structures.
Acknowledgments
S.S.S. was supported by University of Cyprus Research Grant “Repair of UV-damaged DNA by DNA Photolyase: Insights from Molecular Dynamics and Electron Transfer Calculations.” D.N.B. was supported by National Institutes of Health Grant GM-048043 and by the Duke Center for Computational Science, Engineering and Medicine.
Author contributions: S.S.S., I.A.B., T.K., and D.N.B. designed research; S.S.S., I.A.B., T.K., and D.N.B. performed research; S.S.S., I.A.B., T.K., and D.N.B. analyzed data; and S.S.S., I.A.B., T.K., and D.N.B. wrote the paper.
This paper was submitted directly (Track II) to the PNAS office.
Abbreviations: ET, electron transfer; MD, molecular dynamics.
References
- 1.Marcus, R. A. & Sutin, N. (1985) Biochim. Biophys. Acta 811, 265-322. [Google Scholar]
- 2.Kuznetsov, A. M. (1995) Charge Transfer in Physics, Chemistry and Biology (Gordon & Breach, Amsterdam).
- 3.Jortner, J. & Ratner, M., eds. (1997) Molecular Electronics (Blackwell Scientific, Oxford).
- 4.Kuznetsov, A. M. & Ulstrup, J. (1999) Electron Transfer in Chemistry and Biology (Wiley, Chichester, U.K.).
- 5.Jortner, J. & Bixon, M., eds. (1999) Electron Transfer: From Isolated Molecules to Biomolecules, Advances in Chemical Physics (Wiley, New York), Vols. 106-107.
- 6.May, V. & Kühn, O. (2000) Charge and Energy Transfer Dynamics in Molecular Systems (Wiley-VCH, Berlin).
- 7.Balzani, V., Piotrowiak, P., Rodgers, M. A. J., Mattay, J., Astruc, D., Gray, H. B., Fukuzumi, S., Mallouk, T. E., Haas, Y., de Silva, A. P. & Gould, I. R., eds. (2001) Electron Transfer in Chemistry (Wiley-VCH, Weinheim, Germany), Vols. I-V.
- 8.Schuster, G. B., ed. (2004) Topics in Current Chemistry: Long-Range Charge Transfer in DNA (Springer, Berlin), Vols. 236-237.
- 9.Newton, M. D. (2001) in Electron Transfer in Chemistry, ed. Balzani, V. (Wiley-VCH, Weinheim, Germany), Vol. 1, pp. 3-63. [Google Scholar]
- 10.Skourtis, S. S. & Beratan, D. N. (2001) in Electron Transfer in Chemistry, ed. Balzani, V. (Wiley-VCH, Weinheim, Germany), Vol. I, pp. 109-125. [Google Scholar]
- 11.Nitzan, A. (2001) Annu. Rev. Phys. Chem. 52, 681-750. [DOI] [PubMed] [Google Scholar]
- 12.Beratan, D. N. & Hopfield, J. J. (1984) J. Chem. Phys. 81, 5753-5759. [Google Scholar]
- 13.Onuchic, J. N., Beratan, D. N. & Hopfield, J. J. (1986) J. Phys. Chem. 90, 3707-3721. [Google Scholar]
- 14.Onuchic, J. N. & Da Gama, A. A. S. (1986) Theor. Chim. Acta 69, 89-100. [Google Scholar]
- 15.Mikkelsen, K. V., Ulstrup, J. & Zakaraya, M. G. (1989) J. Am. Chem. Soc. 111, 1315-1319. [Google Scholar]
- 16.Kuznetsov, A. M., Vigdorovich, M. D. & Ulstrup, J. (1993) Chem. Phys. 176, 539-554. [Google Scholar]
- 17.Goldstein, R.F., Franzen, S. & Bialek, W. (1993) J. Phys. Chem. 97, 11168-11174. [Google Scholar]
- 18.Tang, J. (1993) J. Chem. Phys. 98, 6263-6266. [Google Scholar]
- 19.Goychuk, I. A., Petrov, E. G. & May, V. (1995) J. Chem. Phys. 103, 4937-4944. [Google Scholar]
- 20.Medvedev, E. S. & Stuchebrukhov, A. A. (1997) J. Chem. Phys. 107, 3821-3831. [Google Scholar]
- 21.Liao, J. L. & Voth, G. A. (2002) J. Chem. Phys. 116, 9174-9187. [Google Scholar]
- 22.Bixon, M. & Jortner, J. (2003) Russian J. Electrochem. 39, 5-10. [Google Scholar]
- 23.Milischuk, A. & Matyushov, D. (2003) J. Chem. Phys. 118, 5596-5606. [Google Scholar]
- 24.Troisi, A., Nitzan, A. & Ratner, M. A. (2003) J. Chem. Phys. 119, 5782-5788. [Google Scholar]
- 25.Wolfgang, J., Risser, S. M., Priyadarshy, S. & Beratan, D. N. (1997) J. Phys. Chem. B 101, 2986-2991. [Google Scholar]
- 26.Daizadeh, I., Medvedev, E. S. & Stuchebrukhov, A. A. (1997) Proc. Natl. Acad. Sci. USA 94, 3703-3708. [DOI] [PMC free article] [PubMed] [Google Scholar]
- 27.Ungar, L. W., Newton, M. D. & Voth, G. A. (1999) J. Phys. Chem. B 103, 7367-7382. [Google Scholar]
- 28.Miller, N. E., Wander, M. C. & Cave, R. J. (1999) J. Phys. Chem. A 103, 1084-1093. [Google Scholar]
- 29.Castner, E. W., Kennedy, D. & Cave, R. J. (2000) J. Phys. Chem. A 104, 2869-2885. [Google Scholar]
- 30.Xie, Q., Archontis, G. & Skourtis, S. S. (1999) Chem. Phys. Lett. 312, 237-246. [Google Scholar]
- 31.Skourtis, S. S., Xie, Q. & Archontis, G. (2001) J. Chem. Phys. 115, 9444-9462. [Google Scholar]
- 32.Balabin, I. A. & Onuchic, J. N. (2000) Science 290, 114-117. [DOI] [PubMed] [Google Scholar]
- 33.Newton, M. D. (2000) Int. J. Quantum Chem. 77, 255-263. [Google Scholar]
- 34.Troisi, A. & Orlandi, G. (2002) J. Phys. Chem. B 106, 2093-2101. [Google Scholar]
- 35.Kawatsu, T., Kakitani, T. & Yamato, T. (2002) J. Phys. Chem. B 106, 11356-11366. [Google Scholar]
- 36.Zimmt, M. B. & Waldeck, D. H. (2003) J. Phys. Chem. A 107, 3580-3597. [Google Scholar]
- 37.Troisi, A., Ratner, M. A. & Zimmt, M. B. (2004) J. Am. Chem. Soc. 126, 2215-2224. [DOI] [PubMed] [Google Scholar]
- 38.Reimers, J. R., Hush, N. S., Sammeth, D. M. & Callis, P. R. (1990) Chem. Phys. Lett. 169, 622-626. [Google Scholar]
- 39.Reimers, J. R. & Hush, N. S. (1990) Chem. Phys. 146, 105-114. [Google Scholar]
- 40.Yip, W. T., Levy, D. H., Kobetic, R. & Piotrowiak, P. (1999) J. Phys. Chem. A 103, 10-20. [Google Scholar]
- 41.Davis, W. B., Svec, W. A., Ratner, M. A. & Wasielewski, M. R. (1998) Nature 396, 60-63. [Google Scholar]
- 42.Davis, W. B., Ratner, M. A. & Wasielewski, M. R. (2001) J. Am. Chem. Soc. 123, 7877-7886. [DOI] [PubMed] [Google Scholar]
- 43.Schlag, E. W., Sheu, S.-Y., Yang, D.-Y., Selzle, H. L. & Lin, S. H. (2000) Proc. Natl. Acad. Sci. USA 97, 1068-1072. [DOI] [PMC free article] [PubMed] [Google Scholar]
- 44.Schlag, E. W., Yang, D.-Y., Sheu, S.-Y., Selzle, H. L., Lin, S. H. & Rentzepis, P. M. (2000) Proc. Natl. Acad. Sci. USA 97, 9849-9854. [DOI] [PMC free article] [PubMed] [Google Scholar]
- 45.Jones, G. A., Paddon-Row, M. N., Carpenter, B. K. & Piotrowiak, P. (2002) J. Phys. Chem. A 106, 5011-5021. [Google Scholar]
- 46.Troisi, A. Ratner, M. A. & Nitzan, A. (2003) J. Chem. Phys. 118, 6072-6082. [Google Scholar]
- 47.Skourtis, S. S., Waldeck, D. H. & Beratan, D. N. (2004) J. Phys. Chem. B 108, 15511-15518. [Google Scholar]
- 48.Nitzan, A., Jortner, J., Wilkie, J., Burin, A. L. & Ratner, M. A. (2000) J. Phys. Chem. B 104, 5661-5665. [Google Scholar]
- 49.Galperin, M., Nitzan, A. & Benjamin, I. (2002) J. Phys. Chem. A 106, 10790-10796. [Google Scholar]
- 50.Friis, E. P., Kharkats, Y. I., Kuznetsov, A. M. & Ulstrup, J. (1998) J. Phys. Chem. A 102, 7851-7859. [Google Scholar]
- 51.Kuznetsov, A. M. & Ulstrup, J. (2002) J. Chem. Phys. 116, 2149-2165. [Google Scholar]
- 52.Davis, W. B., Wasielewski, M. R., Ratner, M. A., Mujica, V. & Nitzan, A. (1997) J. Phys. Chem. A 101, 6158-6164. [Google Scholar]
- 53.Hu, Y. & Mukamel, S. (1989) J. Chem. Phys. 91, 6973-6988. [Google Scholar]
- 54.Skourtis, S. S. & Mukamel, S. (1995) Chem. Phys. 197, 367-388. [Google Scholar]
- 55.Kühn, I., Rupasov, V. & Mukamel, S. (1996) J. Chem. Phys. 104, 5821-5833. [Google Scholar]
- 56.Okada, A., Chernyak, V. & Mukamel, S. (1998) J. Phys. Chem. A 102, 1241-1251. [Google Scholar]
- 57.Kimura, A. & Kakitani, T. (1998) Chem. Phys. Lett. 298, 241-249. [Google Scholar]
- 58.Sumi, H. & Kakitani, T. (2001) J. Phys. Chem. B 105, 9603-9622. [Google Scholar]
- 59.Berlin, Y. A., Burin, A. L. & Ratner, M. A. (2000) J. Phys. Chem. A 104, 443-445. [Google Scholar]
- 60.Petrov, E. G., Shevchenko, Y. V., Teslenko, V. I. & May, V. (2001) J. Chem. Phys. 115, 7107-7122. [Google Scholar]
- 61.Bixon, M. & Jortner, J. (2002) Chem. Phys. 281, 393-408. [Google Scholar]
- 62.Renger, T. & Marcus, R. A. (2003) J. Phys. Chem A 107, 8404-8419. [Google Scholar]
- 63.Skourtis, S. S. (2003) Chem. Phys. Lett. 372, 224-231. [Google Scholar]
- 64.Medvedev, E. S. & Stuchebrukhov, A. A. (2004) Chem. Phys. 296, 181-192. [Google Scholar]
- 65.Onuchic, J. N. & Wolynes, P. G. (1988) J. Phys. Chem. 92, 6495-6503. [Google Scholar]
- 66.Bialek, W., Bruno, W. J., Joseph, J. & Onuchic, J. N. (1989) Photosynth. Res. 22, 15-27. [DOI] [PubMed] [Google Scholar]
- 67.Levich, V. G. & Dogonadze, R. R. (1959) Dokl. Acad. Nauk SSSR 124, 123-126. [Google Scholar]
- 68.Lax, M. (1952) J. Chem. Phys. 20, 1752-1760. [Google Scholar]
- 69.Lockwood, D. M., Cheng, Y.-K. & Rossky, P. J. (2001) Chem. Phys. Lett. 345, 159-165. [Google Scholar]
- 70.Neria, E. & Nitzan, A. (1993) J. Chem. Phys. 99, 1109-1123. [Google Scholar]
- 71.Prezhdo, O. V. & Rossky, P. J. (1997) J. Chem. Phys. 107, 5863-5878. [Google Scholar]
- 72.Gray, H. B. & Winkler, J. R. (2003) Q. Rev. Biophys. 36, 341-372. [DOI] [PubMed] [Google Scholar]
- 73.Gray, H. B. & Winkler, J. R. (1996) Annu. Rev. Biochem. 65, 537-561. [DOI] [PubMed] [Google Scholar]
- 74.Langen, R., Chang, I.-J., Germanas, J. P., Richards, J. H., Winkler, J. R. & Gray, H. B. (1995) Science 268, 1733-1735. [DOI] [PubMed] [Google Scholar]
- 75.Onuchic, J. N., Beratan, D. N., Winkler, J. R. & Gray, H. B. (1992) Annu. Rev. Biophys. Biomol. Struct. 21, 249-377. [DOI] [PubMed] [Google Scholar]
- 76.Regan, J. J., Di Bilio, A. J., Langen, R., Skov, L. K., Winkler, J. R., Gray, H. B. & Onuchic, J. N. (1995) Chem. Biol. 2, 489-496. [DOI] [PubMed] [Google Scholar]
- 77.Faham, S., Day, M. W., Connick, W. B., Crane, B. R., Di Bilio, A. J., Schaefer, W. P., Rees, D. C. & Gray, H. B. (1999) Acta Crystallogr. D 55, 379-385. [DOI] [PubMed] [Google Scholar]
- 78.Brooks, B., Bruccoleri, R., Olafson, B., States, D., Swaminathan, S. & Karplus, M. (1983) J. Comput. Chem. 4, 187-217. [Google Scholar]
- 79.Mackerell, A., Bashford, D., Bellott, M., Dunbrack, R., Evanseck, J., Field, M., Fischer, S., Gao, J., Guo, H., Ha, S., et al. (1998) J. Phys. Chem. B 102, 3586-3616. [DOI] [PubMed] [Google Scholar]
- 80.Darden, T., York, D. & Pedersen, L. (1997) J. Chem. Phys. 98, 10089-10092. [Google Scholar]
- 81.Ungar, L. W., Scherer, N. F. & Voth, G. A. (1997) Biophys. J. 72, 5-17. [DOI] [PMC free article] [PubMed] [Google Scholar]
- 82.Priyadarshy, S., Skourtis, S. S., Risser, S. M. & Beratan, D. N. (1996) J. Chem. Phys. 104, 9473-9481. [Google Scholar]
- 83.Balabin, I. A. & Onuchic, J. N. (1998) J. Phys. Chem. 102, 7497-7505. [Google Scholar]
- 84.Siddarth, P. & Marcus, R. A. (1990) J. Phys. Chem. 94, 8430-8434. [Google Scholar]
- 85.Siddarth, P. & Marcus, R. A. (1993) J. Phys. Chem. 97, 13078-13082. [Google Scholar]
- 86.Tan, M. L., Balabin, I. A. & Onuchic, J. N. (2003) Biophys. J. 86, 1813-1819. [DOI] [PMC free article] [PubMed] [Google Scholar]
- 87.Balabin, I. A. & Onuchic, J. N. (1996) J. Phys. Chem. 100, 11573-11580. [Google Scholar]
- 88.Daizadeh, I., Gehlen, J. N. & Stuchebrukhov, A. A. (1997) J. Chem. Phys. 106, 5658-5666. [Google Scholar]
- 89.Kawatsu, T., Kakitani, T. & Yamato, T. (2000) Inorg. Chim. Acta 300-302, 862-868. [Google Scholar]
- 90.Kawatsu, T., Kakitani, T. & Yamato, T. (2002) J. Phys. Chem. B. 106, 5068-5074. [Google Scholar]
- 91.Howell, J., Rossi, A., Wallace, D., Haraki, K. & Hoffmann, R. (1977) forticon 8 (Extended-Hückel Program) (Quantum Chemistry Program Exchange, Indiana Univ., Bloomington, IN), QCPE 11, No. 344.
- 92.Kincaid, D. R., Respess, J. R., Young, D. M. & Grimes, R.G. (1999) itpack 2c: A Fortran Package for Solving Large Sparse Linear Systems by Adaptive Accelerated Iterative Methods (Univ. of Texas, Austin, TX).
- 93.Vela, A. & Gázquez, J. L. (1988) J. Phys. Chem. 92, 5688-5693. [Google Scholar]
- 94.Katz, D. J. & Stuchebrukhov, A. A. (1998) J. Chem. Phys. 109, 4960-4970. [Google Scholar]
- 95.Penfield, K., Gerwith, A. & Solomon, E. I. (1985) J. Am. Chem. Soc. 107, 4519-4529. [Google Scholar]
- 96.Gerwith, A. & Solomon, E. I. (1988) J. Am. Chem. Soc. 107, 3811-3819. [Google Scholar]
- 97.Janke, W. (2002) in Quantum Simulations of Complex Many-Body Systems: From Theory to Algorithms, Lecture Notes, John von Neumann Institute for Computing Series, eds. Grotendorst, J., Marx, D. & Muramatsu, A. (John von Neumann Institute for Computing, Jülich, Germany), Vol. 10, pp. 423-445. [Google Scholar]
- 98.Frenkel, D. & Smit, B. (2002) Understanding Molecular Simulation: From Algorithms to Applications (Academic, San Diego).
- 99.Flyvbjerg, H. & Petersen, H. G. (1989) J. Chem. Phys. 91, 461-466. [Google Scholar]
- 100.Miller, J. E., Di Bilio, A. J., Wehbi, W. A., Green, M. T., Museth, A. K., Richards, J. H., Winkler, J. R. & Gray, H. B. (2004) Biochim. Biophys. Acta 1655, 59-63. [DOI] [PubMed] [Google Scholar]
- 101.Di Bilio, A. J., Crane, B. R., Wehbi, W. A., Kiser, C. N., Abu-Omar, M. M., Carlos, R. M., Richards, J. H., Winkler, J. R. & Gray, H. B. (2001) J. Am. Chem. Soc. 123, 3181-3182. [DOI] [PubMed] [Google Scholar]
- 102.Klessinger, M. & Michl, J. (1995) Excited States and Photo-Chemistry of Organic Molecules (Wiley, New York).