Abstract
Cells experience forces if subjected to laminar flow. These forces, mostly of shear force character, are strongly dependent not only on the applied flow field itself but also on hydrodynamic effects originating from neighboring cells. This particularly becomes important for the interpretation of data from in vitro experiments in flow chambers without confluent cell layers. By employing numerical Finite Element Method simulations of such assemblies of deformable objects under shear flow, we investigate the occurring stress within elastic adherent cells and the influence of neighboring cells on these quantities. For this, we simulate single and multiple adherent cells of different shapes fixed on a solid substrate under laminar flow parallel to the substrate for different velocities. We determine the local stress within the cells close to the cell-substrate-interface and the overall stress of the cells by surface integration over the cell surface. Comparing each measurand in the case of a multiple cell situation with the corresponding one of single cells under identical conditions, we introduce a dimensionless influence factor. The systematic variation of the distance and angle between cells, where the latter is with respect to the flow direction, flow velocity, Young's modulus, cell shape, and cell number, enables us to describe the actual influence on a cell. Overall, we here demonstrate that the cell density is a crucial parameter for all studies on flow induced experiments on adherent cells in vitro.
INTRODUCTION
Studying cells and evaluating their properties in vitro have always been crucial as model systems for a better understanding of biological processes. Cell adhesion is amongst others important for processes such as wound healing, cell growth, and immune response. During the immune response, blood-borne cells attach to the endothelial lining of blood vessels.1 Studying cell adhesion subjected to laminar flow is equally important as it can mimic the effects on cells attached to the endothelium in veins, vessels, and capillaries. Previous studies have revealed different approaches to determine cell adhesion forces. For example, Weiss2 reported on a method using a rotating disk above a stationary one. Cells are grown on the lower of the two disks, which each can consist of different materials. Shear and adhesion forces can be controlled via the rotation speed of the spinning top disk. Furthermore, static adhesion forces of cells can be determined by means of atomic force microscopy.3 In general, adherent cells on substrates exhibit a thin shape4 and appear stiffer5 than they are. Gavara and Chadwick6 introduced the “Bottom Effect Cone Correction” in order to correct the alleged stiffness and the widely used Sneddon model which is used to measure the Young' modulus. To study cell adhesion under flow conditions, several groups7–9 have used side-view flow chambers and microchannels using, e.g., syringe pumps. This allows, for instance, to examine cell deformation, the cell-substrate contact length and cell rolling velocities, whereas the cell-substrate contact length is nearly twice as large under higher shear stresses as under lower shear stresses.8 A similar study7 using a flow chamber demonstrates a cell shape dependency for the force exerted by the fluid on the cells. Another, more recent, possibility to create flow in μl volumes is employing the acoustic streaming effect, occurring in fluids due to the excitement of surface acoustic waves (SAW).10 This effect has been used to maintain a steady flow in closed chambers.11–14 For example, as published before,13 a small-sized experimental setup can be used to study cell adhesion under physiological conditions. The cells are grown on different inorganic substrates exposed to a SAW-driven acoustic streaming in a closed polydimethylsiloxane chamber mimicking medical implants in human bodies. Here, the cell layer is not confluent, and thus, the experienced shear forces depend on the effective surrounding of a cell. Often, insight gained from a situation with non-confluent cell layers is thought to be transferred to physiological situations. Therefore, it is important to study such non-confluent cell layers and especially the influence on neighboring adherent cells where hydrodynamically induced shielding effects and “lee-sides” are crucial. Previous publications7,15–20 on modelling cells under flow have shown various results: adhesion strength increases with the contact area.7 The deformation of leukocytes depends on the initial contact angle, the capillary number, and the Reynolds number, but it strongly depends on the cell shape.17 Cell rolling can be described as a continuous failure of bonds and continuous creation of new receptor-ligand connections, considering the van-der-Waals force and the electrostatic force as the only attractive and repulsive adhesive force, respectively.20 Chang et al.18 presented a state diagram for cell adhesion under flow, showing a distinction between firm, transient, fast, and no adhesion states whereas the unstressed dissociation rate and the bond interaction length are the major parameters. Whereas a high cell density was used in the mentioned experiments, only single cells were studied in the mentioned models and simulations. This leads to the central question whether and how neighboring cells, and by this the cell density, should be considered in studies on flow induced effects, like, e.g., detachment of adherent cells.
To answer this question, we investigated the stress within elastic, homogeneous, adherent cells under laminar flow and the influence of neighboring cells on these quantities. Two and three dimensional simulations were performed in which single or multiple adherent cells of different shapes are placed on a solid substrate with laminar flow parallel to the substrate for different velocities. The local stress close to the cell-substrate-interface within the cell as well as the overall stress acting on a cell by surface integration over its surface is determined.
The structure of this paper is as follows. First, as we find the maximal reduction of stress at the apical adhesion point of the cell (AP), we use the stress at the AP as a single number value to characterize the effects. Second, as a figure of merit we introduce a dimensionless factor, the so-called ‘influence factor'. This influence factor compares each measurand in the case of multiple cells with the corresponding one of single cells under identical conditions. Third, we systematically vary the distance and the angle between cells, where the latter is with respect to the flow direction, the cell shape, and elasticity. This allows us to classify the surrounding regions on the substrate as relevant or not as a function of the cell shape. The elasticity of the cells turned out to be of minor importance. Thus, we keep the distance and the elasticity constant and then exemplarily define relevant sectors on the substrate as a function of flow velocity. Finally, we treat the question whether these results from two-cell-situations can be used to describe multi-cell-situations.
METHODS
Geometry, assumptions, and boundary conditions
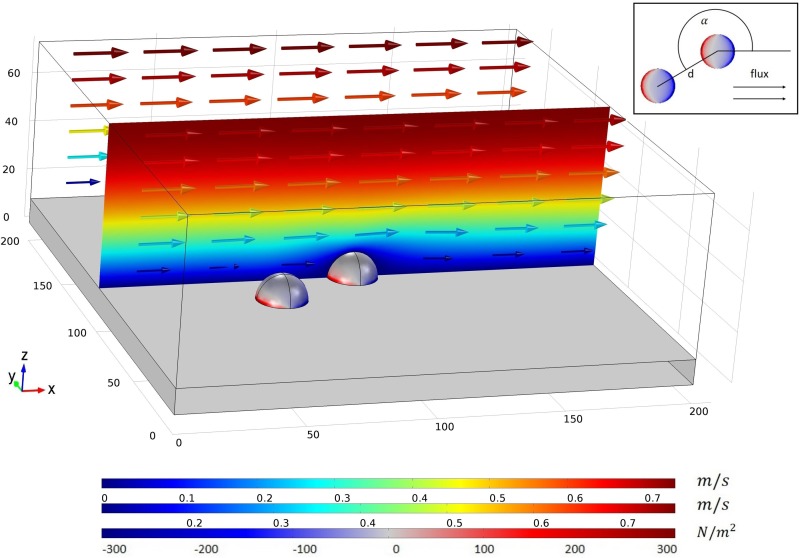
We performed numerical simulations to obtain the velocity field, the stress components, and deformations of the cells within the setup. Therefore, we carried out two- and three-dimensional simulations using the finite element modelling software COMSOL Multiphysics® v5.0. Specifically, we used the fluid-structure interaction (FSI) module. Figure 1 depicts a typical example of a three-dimensional simulation. It shows a large and small cuboid and two hemispheres representing, respectively, the fluid, the substrate, and two adherent cells. The length and the width of both the cuboids were in each case 200 μm. The heights are 75 μm and 10 μm, respectively. To mimic different adhesion stages, four different cell shapes were used: a sphere barely touching the substrate, a hemisphere, and two ellipsoids, whereas the volume is conserved for all shapes. The cells were fully attached to the substrate which was under a fixed constraint. We used water as an incompressible Newtonian fluid at 37 °C. We assumed the cells to be a hyperelastic Neo-Hookean, homogenous material with the Young's modulus varying between 625 Pa and 40 000 Pa. In accordance with previous studies,21–23 we chose the cells to be hyperelastic, homogenous and quasi-incompressible. An alternative approach to model a cell is to define a nucleus and membrane compartments in an incompressible cytoplasm surrounded by a membrane. We prefer the former one as the latter requires more assumptions compared to the homogenous hyperelastic model. To ensure that the simpler model is legitimate, we compared the volume change of our homogenous cells for different Young's moduli before and after being subjected to shear flow. The maximal volume change even for the softest cells (E = 625 Pa) is less than 1.2% and decreases rapidly with increasing Young's modulus tending to 0% change. Hence, the homogenous material for the cells is sufficient and legitimate. The arrows in Figure 1 represent the velocity magnitude and the direction of the flow. We applied a laminar inflow to the left-hand boundary with average velocities varying between 0.001 m/s and 0.2 m/s and a zero pressure condition to the right-hand boundary. The walls apart from the substrate had a slip condition ensuring no zero velocity conditions. We determined the velocity field and the shear stress using the Navier-Stokes equation. We applied a fluid-solid interface condition to the cell-substrate surface describing the fluid load on the cells and the effect of their structural displacements on the fluid's velocity. The elastic deformations and the influences on the fluid's velocity were calculated by an Arbitrary Lagrangian-Eulerian (ALE) method. We used a free tetrahedral mesh for the simulations with the finest mesh on the cells and the surrounding. The two-dimensional setup represents the projection of the three-dimensional one along the y-axis. Our convergence criterion is 1 × 10⁻⁵.
FIG. 1.
Image of the setup of a three-dimensional simulation: elastic cells are attached to the substrate and subjected to laminar flow. The flux direction and the velocity magnitude are indicated by coloured arrows. For a better resolution, the velocity magnitude is depicted in the x-z-cross-sectional plane using the same scale and colour range as the latter. The stress component with respect to the z-direction on both the cells and the substrate can be directly obtained from the simulations. The red and the blue colour represent the positive upward and negative downward stress within the cells, respectively. An aerial perspective of the setup is depicted in the top right corner showing the characteristic parameters and , where is the distance between two cell centres and is the angle between two neighboring cells with respect to the flow direction.
Mathematical framework
The FSI module that we have used for all simulations has a multiphysics problem coupling the structural and fluid mechanics. It can model physical phenomena of fluids and deformable objects affecting each other.24 The fluid velocity field is computed by employing both the time-independent Navier-Stokes equation for incompressible fluids
| (1) |
and the continuity equation
| (2) |
representing the conservation of momentum and mass, respectively. and are, respectively, the fluid's density and dynamic viscosity, is the pressure, is the identity matrix, and is the external force applied to the fluid, in our case .
We applied at the left hand boundary (Fig. 1), an inlet
| (3) |
where is the normal inflow velocity which we varied depending on the desired case (see the previous subsection “Geometry, Assumptions, and Boundary Conditions”) and is the outward normal to the boundary. At the right hand boundary, we applied an outlet
| (4) |
whereas in our case, the pressure at the boundary vanishes.
The walls apart from the actual substrate had a slip condition ensuring no zero velocity conditions. The slip condition assumes that there are no viscous effects at the slip wall, and hence, no boundary layer develops.24 Mathematically speaking, the condition is described as
| (5) |
We applied a fixed constraint condition on the substrate, where the cells are attached to, such that structural deformation vanishes
| (6) |
The FSI module provides a fluid-solid interface boundary condition describing the fluid load on the cells and the effect of their structural displacements on the fluid's velocity, which we applied on the cell-substrate surface. The computations are performed as follows:24
| (7) |
| (8) |
| (9) |
where is the Cauchy stress tensor and is the displacement of the cell. Equation (8) describes the rate of change for the displacement of the cell, which acts as a moving wall for the fluid domain. The fluid-solid interface condition couples the individually performed calculations of the fluid and solid mechanics modules using the Arbitrary Lagrangian-Eulerian method. The Navier-Stokes equations for the fluid are solved in the spatial frame (Eulerian description), and the solid mechanics interfaces are defined in the material frame (Lagrangian description).24
Evaluation
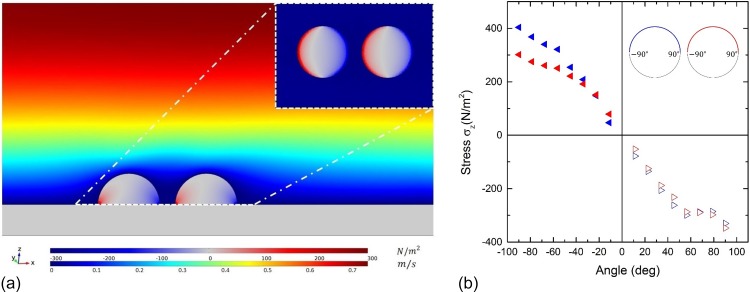
The following parameters were varied: fluid velocity at the inlet side, cell shape, number of cells, distance between cells, angle between adjacent cells with respect to the flow direction, and Young's modulus of the cells. The inset in Figure 1 shows a schematic illustration of the mentioned distance and angle between cells from the aerial perspective. The distance is the distance between the centres of two neighboring cells. The angle is measured counterclockwise, respectively, to the flow direction. The values for the velocity magnitude of the fluid and the stress in the z-direction of the cells can be directly obtained (color code of the cells in Fig. 1). Figure 2 shows a plane-cut in the xz-plane of the setup where the cells are aligned parallel to the flow. We evaluated the stress locally at distinct points, for an area within a plane-cut on the surface of the cell. The inset in the top right corner of Figure 2 shows the stress component in the xy-plane 1 nm above the substrate. Integration of the von-Mises stress over the cell surface delivers an equivalent value of the overall acting force.
FIG. 2.
(a) Exemplary three-dimensional simulation of two cells aligned with respect to the flow direction: both the stress component with respect to the z-direction and the velocity magnitude of the central x-z-cross-sectional plane are depicted. The inlet provides the stress component in the x-y-cross-sectional plane 1 nm above the substrate. (b) The graph shows the stress component plotted versus the angle along the circumference of the cells in the x-y-plane from the inlet in Fig. 2(a).
RESULTS AND DISCUSSION
Maximal reduction of local stress due to shielding effects
To determine the points of the maximal stress reduction by neighboring cells, we used a three-dimensional simulation of two hemispherical shaped cells (radius 10 μm) in a mid to mid distance of 25 μm, aligned parallel to the flow direction and for a fluid velocity of approximately 0.2 m/s at z = 10 μm. As Figure 2(a) demonstrates, the stress component in the z-direction reaches a maximum close to the cell-substrate-interface. Figure 2(b) shows evaluated along the cells' circumferences in a horizontal plane 1 nm above the substrate. Due to symmetry reasons, we merely considered half of the circumferences (indicated schematically in Figure 2(b)) starting with −90° at the very left to 90° at the very right point of each cell. As expected, the stress is positive near the cell front and decreases to zero in the middle, before it becomes negative near the cell rear. While the absolute value of within the rear cell is reduced in the sector between −90° and −60°, it is comparable in the remaining parts. This is in accordance with the reduced velocity magnitude between the cells.
As the maxima of the absolute stress within both the cells are in their very left and right points, in the following analysis, we study these significant points, denominated as the “apical point” (AP) and the “basal point” (BP) of the corresponding cell. Considering the anterior cell, the | at the AP is approximately 21% higher compared to the BP, whereas, due to its position in the lee-side, the stress profile of the rear cell is quite symmetrical. These observations also apply to different distances, velocities, and cell shapes. Qualitatively speaking, the courses of the graphs are the same, whereas the graphs are compressed with respect to the stress values. As intuitively expected, it holds that the compression of the graphs decreases with decreasing velocity, increasing distance, and decreasing cell height (data not shown). In a previous motility study,25 a asymmetric behavior similar to the asymmetry of the course of the graph of the anterior cell was described. Therein, Dictyostelium discoideum cells showed a higher mobility on the front part than on the rear part of the cell if subjected to shear flow. The hydrodynamic shear stress triggers a cellular response leading to the membrane peeling at the front part of the cell and periodic cell contact extension at the rear part.25 Of course, here we study dead, elastic, and adhering hemispheres, and no living objects. However, these results contribute to a deeper understanding of the driving physics supporting the biochemical response of cells subjected to shear flow.
Variation of the distance between cells
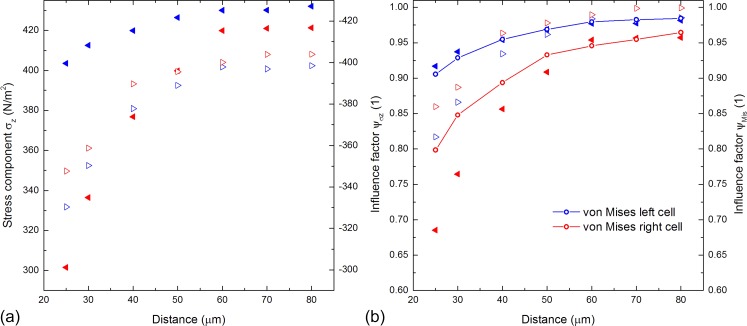
Obviously, the distance d between the cell centres is crucial for these effects. Figure 3(a) shows the stress using the same parameters as used in the three-dimensional setup above. The stress at the AP and the BP of both the front and the rear cell decrease with decreasing distance. However, this effect is much more significant for the rear cell. The stress of the rear cell and the stress of the BP of the front cell increase rapidly with increasing distance over 6 cell radii, whereas it increases slightly over 3 cell radii for the AP of the front cell as the velocity magnitude decreases significantly in the area between the cells. The stress converges to a constant value in all the cases, whereas the absolute stress of the AP of both the cells is approximately 8.4% and 4.3% higher than that for the respective BP. The comparison of the absolute stress difference to the difference of 21% at suggests a decreasing difference with increasing distance tending to 0%. These results show that the stress on the posterior cell, particularly on the AP (e.g., ∼301 N/m2 at 25 μm and ∼421 N/m2 at 80 μm), is strongly dependent on the distance . Initially unexpected, the anterior cell's stress at the AP and the BP is also a function of the distance. However, there are only minor changes of about 6%.
FIG. 3.
Vertical stress and influence factor for two aligned hemispherical cells. (a) The vertical stress component is plotted as a function of . We determined the stress at the front and the BP of both the cells indicated by blue and red triangles. The stress increases with increasing distance in all the cases. (b) The left vertical axis shows the values of the influence factor of the cell's AP and BP plotted versus the distance represented by triangles. The right vertical axis presents the calculated influence factor of the cell surfaces represented by lines and circles.
Influence factor
The previous paragraphs showed that cells subjected to laminar flow are influenced by neighboring cells hydrodynamically. Therefore, we introduce a dimensionless influence factor describing the influence of neighboring cells. It is always referred to a measurand, e.g., vertical stress. The influence factor is the quotient of the stress of a cell surrounded by neighbors and the stress of the same cell under identical conditions but isolated
| (10) |
where and represent the vertical stress component within the observed and reference cell, respectively. According to this definition, for ≈ 1, the influence of neighboring cells is negligible while the effect increases with decreasing .
Besides local stress within cells, we also evaluate the acting forces on the cell surface by means of surface integration to care for the different physical properties of stress propagation within an extremely inhomogeneous living cell and the homogeneous material studied here. For this, we integrate the von-Mises stress. Unlike , von-Mises stress is always positive. In analogy to , the influence factor is defined as
| (11) |
where is the von-Mises stress and and are the surface of the observed cell surrounded by neighbors and the surface of the same cell under identical conditions but isolated, respectively.
Using the introduced influence factor Figure 3(b) shows the stress-distance dependency for maximal and integrated values evaluated with and , respectively. We determined the influence on the AP and the BP of each cell (as defined above) by the use of and determined the influence on the cell surface by employing . The von-Mises influence factors for the front and rear cell surfaces are represented by the blue and red scatter lines. The values of are provided by the right axis. Obviously, Figure 3(b) shows similar trends to Figure 3(a) for both the maximal local stress and the integrated von-Mises stress. The overall influence on the posterior cell influenced by the anterior cell is high (indicated by small values of ). For example, the stress on the AP of the rear cell at a distance of 25 μm is reduced by 32% compared to an isolated cell. Generally speaking, the influence on the cells increases with shorter distances. Moreover, the data show that there is an influence on the front cell influenced by the presence of the rear one that might not be expected at first glance. However, this influence is only about 50% of the corresponding one on the posterior cell.
In order to account for the overall influence of the front cell on the rear cell, both graphs are shown in Figure 3(b). Even though the extremal values are slightly less pronounced, the distance dependency of is reflected by very well. This difference between the maximal local influence and the corresponding integrated values is caused by the averaging due to integration. The advantages of are on the one hand the consideration of the entire cell surface and the condensed information of the effects of the whole cell. On the other hand, the influence factor allows setting a threshold and thus the determination of a critical distance for neighboring cells above which the influence is negligible. For this, we suggest a threshold of . For this particular case, the critical distances for the front and the rear cell are approximately 3–4 cell radii and 6–8 cell radii, respectively. These results demonstrate that both the cells influence each other, whereas the influence on the posterior cell is significantly higher.
Variation of the angle between cells and main flow
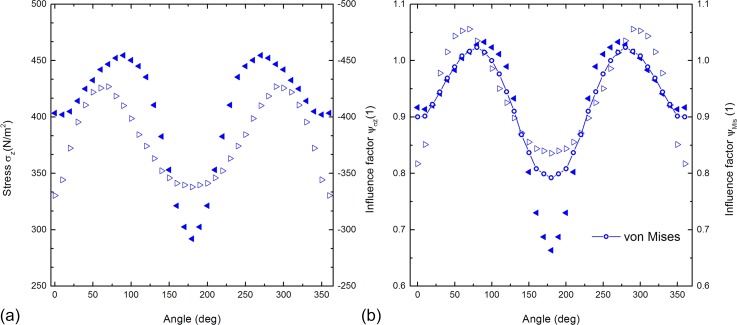
So far, we considered cells aligned with the flow direction. Obviously, it is necessary to study not only the distance between neighboring cells but also the role of the angle between these cells and the flow direction. As indicated in Figure 1, we used three-dimensional simulations of two adherent cells with a mid-to-mid distance of 25 μm and varying angles. Figure 4(a) shows the values of for the AP and the BP of the stationary cell plotted versus the angle . In accordance with symmetry arguments, both the graphs are axisymmetric with respect to , are 2π-periodic, and have two maxima and one minimum. The stress difference between the AP and the BP depends on the angle being especially high at and . These two angles represent the rotating cell located behind and in front of the stationary cell, respectively. These values are in agreement with the results for shown in Figure 3. Considering the AP, the two maxima are located at and and the minimum at representing, respectively, the position of the rotating cell next to the stationary cell and in front of it as in the latter, the cell experiences the most cover as it is located in the lee-side.
FIG. 4.
Both the figures are based on simulations of a cell rotating around a stationary cell at a constant distance (Figure 1). (a) The stress component in the z-direction is plotted versus the rotating angle . We determined the stress of the AP and the BP of the stationary cell represented by solid and non-filled triangles, respectively. (b) The values represented by the triangles show the influence factor of the AP and the BP of the stationary cells plotted against the rotating angle (left vertical axis). The calculated influence factor of the cell surface is represented by the line and circles (right vertical axis).
In analogy to the stress-distance dependency, Figure 4(b) shows the stress-angle dependency for maximal and integrated values evaluated with and , respectively. The courses of the graphs are 2π-periodic and axisymmetric with respect to the vertical segment line . The course of the graph is in between the courses of the graphs. All graphs have two maxima and a minimum. The minima of all graphs are also located at . The maxima of the AP are located at and , and the ones of the BP are at 70° and 290°. The maxima of are located between the maxima of the AP and the BP at . The influence on the stationary cell's AP is significantly high at around 180° with a value of , representing the rotating cell being in front of the stationary cell. The difference in the influence factor between the AP and the BP is more significant between 150° and 210° with a maximal difference of Δ.
Analogous to the previous paragraph, we define a critical sector describing when the stationary cell can be considered as an isolated cell uninfluenced by neighboring cells. For this case () setting the threshold for implies a critical sector . This sector in front of the observed stationary cell, where the rotating cell is located, has a width of 100 degrees. Qualitatively speaking, the courses of angle dependency graphs for different velocities, distances, and cell shapes are similar to the observations described above. The graphs seem to be scaled down according to
| (12) |
where is the von-Mises factor of the introduced shapes (Fig. 7) and is the corresponding cell height. We used the sphere as the norm shape. The scaling factor increases with decreasing velocities, increasing distances, and decreasing cell heights.
FIG. 7.
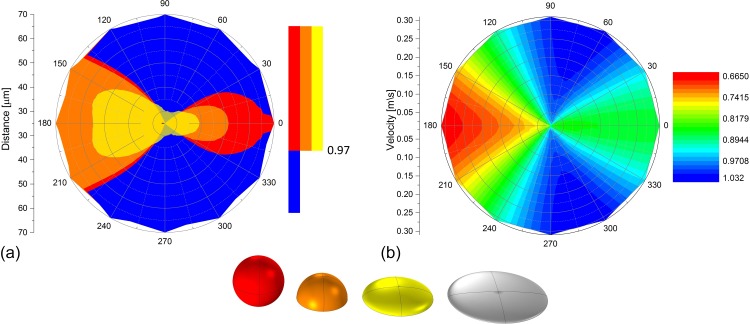
(a) State diagram for the classifications of “isolated” and “influenced” by using a threshold of the influence factor (here: ) as a function of angle, cell distance, and cell shape. The flat ellipsoid can be considered as isolated for all the angles and distances. All other cell shapes have regions influenced by the rotating cell. (b) shows the influence factor depending on the rotating angle and the flow velocity . The stationary cell is more influenced if located both anteriorly and posteriorly of the rotating cell, whereas the latter is more dominant. Additionally, in the latter case, the influence on the stationary cell increases with increasing velocity ().
Variation of the cell shape
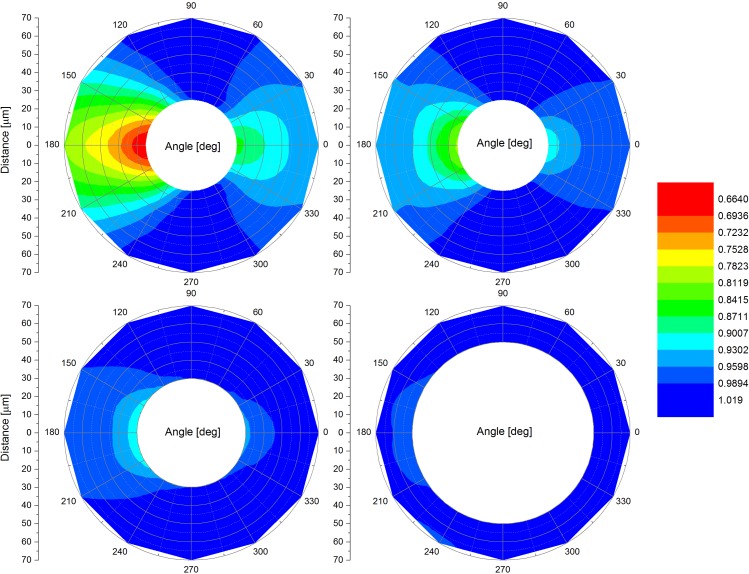
As mentioned before, the cell height affects the influence factor. Figure 5 shows both the stress-angle and stress-distance dependencies for all the four cell heights: sphere barely touching the substrate (top left), hemisphere (top right), high ellipsoid (bottom left), and flat ellipsoid (bottom right). The polar diagrams provide the von-Mises influence factor for all angle and all cell-to-cell distances whereas the latter domain is limited by the cell radius. The influence on the stationary cell decreases with decreasing cell height in accordance with Equation (12), and it is caused by the lee-side of the cell. The lower the cell height is, the smaller is the effective lee-side and thus the lower is the influence. Notably, in the case of the sphere and the hemisphere, a remarkable influence is observable if the stationary cell is located anteriorly to the rotating cell (). The flat ellipsoid can be considered as isolated for all the angles and the distances.
FIG. 5.
Influence factor of a stationary cell due to the presence of another cell as a function of the rotation angle and the cell distance. Each polar diagram represents a different cell shape (Fig. 7). Top left: sphere barely touching the substrate (h = 18 m). Top right: hemisphere (h = 10 m). Bottom left: high ellipsoid (h = 5 m). Bottom right: flat ellipsoid (h = 2.5 m). The influence on the stationary cell decreases with decreasing cell height.
Variation of cell elasticity
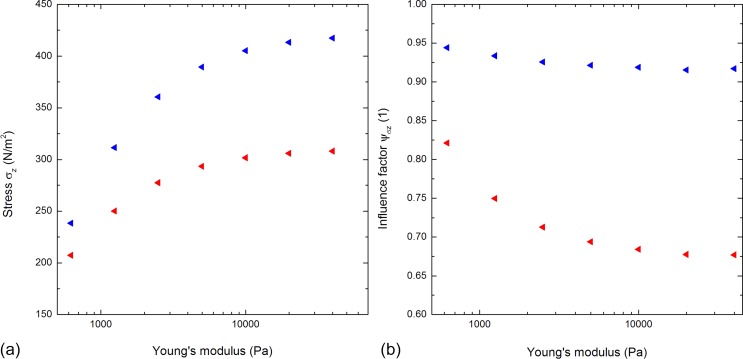
We studied the appearing stress as a function of the Young's modulus in three-dimensional simulations. For and = 25 μm, we varied the Young's modulus E of both the cells between 625 Pa and 40 000 Pa. Figure 6(a) shows the stress component of the AP of each cell as a function of E. The stress increases with increasing Young's modulus for both the cells. This is consistent with a previous study26 showing this both in experiments and simulations on human osteosarcoma cells subjected to shear flow. Considering the rear cell, the overall stress is always lower compared to the overall stress of the front cell. Notably, the stress difference between the two cells increases with increasing Young's modulus. For instance, the rear cell's stress is approximately 15% lower at 625 Pa, 33% lower at 5000 Pa, and 35% lower at 40,000 Pa.
FIG. 6.
Both the figures are based on simulations of two aligned cells with respect to the flow direction at a constant distance . (a) The stress component in the z-direction is plotted versus the logarithmically scaled Young's modulus. The blue and red triangles represent the AP of the anterior and posterior cell, respectively. The stress increases with increasing Young's modulus. (b) The influence factor is plotted against the logarithmically scaled Young's modulus. The influence on the posterior cell is higher.
We attribute this trend to the correlation of the stiffness of the cells and the material displacement. A higher Young's modulus leads to a higher stiffness, which in turn leads to a lower material displacement. Hence, the lee-side region is larger and the acting stress of the posterior cell is lower implicating a higher stress difference. Along the same lines as for the variation of the distance, angle, etc. Figure 6(b) shows the influence factor plotted versus the Young's modulus for the AP of each cell. Generally speaking, and similar to the other cases, the influence on the posterior cell is higher. The influence on both the cells increases with increasing Young's modulus. The graphs in both the figures show a converging trend. This trend is in agreement with the assumption of a firm hemisphere subjected to shear flow providing a constant cover for posterior objects located in the lee-side.
According to studies on cell elasticity,27–30 the Young's modulus of various cells has been reported. For instance, Leukocytes (HL60) have Young's moduli ranging from 200 Pa to 1400 Pa,27 endothelial cells (Human Umbilical Vein Endothelial Cell) from 10 000 to 11 000 Pa,28 Osteoblasts from 300 to 20 000 Pa (Ref. 29), and Erythrocytes from 19 000 to 33 000 Pa (Ref. 30). As we used for the other simulations and see that above about , the influence factor converges as a function of E to a constant value of , we expect our simulations to be representative regarding cell elasticity.
Area for neighboring cells with relevant influence
In order to assess the influence of neighboring cells, we combine the information shown above and introduce two possible states where a cell is either considered as “isolated” or “influenced.” According to our definition, a cell is in the isolated state if it exceeds both the critical distance and critical sector which can be easily determined by setting a threshold to the von-Mises influence factor . Regarding the situation given in Figure 5, an example is shown in Figure 7(a) with a threshold of . The colour blue represents all the values beyond the threshold (>0.97) and thus indicates the sector on the substrate where the cell can be considered as isolated. Regarding the other colors, each color represents a different cell shape and indicates the area where neighboring cells lead to a significant influence on the observed cell in the middle. Figure 7(a) shows a state diagram for the classifications of an isolated and influenced cell. For this, we chose a threshold of . The flat ellipsoid can be assumed as isolated for all the angles and distances due to its small cell height. In accordance with previous results, the influenced state predominantly is present in situations where the stationary cell is located both anteriorly and posteriorly to the rotating cell, whereas the latter is more pronounced. The size of the sectors of the influenced state increase with increasing cell height.
Variation of flow velocity
Exemplarily, Figure 7(b) shows the von-Mises influence factor depending on the rotating angle and the flux velocity at the inlet in the height of the highest point of the cell. The results are based on simulations with a hemispherical cell rotating around a stationary with cell-to-cell distance . The stationary cell is more influenced if located both anteriorly and posteriorly of the rotating cell whereas the latter is more dominant and has a notable velocity gradient. Predominantly in that area, the influence increases with increasing velocity, which is due to the increase of the lee-side.
Influence of multiple neighboring cells
The previous paragraphs provided a thorough evaluation for the simplest case of two aligned cells. Here, we used two-dimensional simulations of three and four hemispherical shaped cells aligned with respect to the flow direction and determined the von-Mises influence factor of each cell. In order to present the results, we show the full denotation of the von-Mises influence factor for cells
| (13) |
where is the cell number, the index describes the used cell shape, the index describes the observed cell and its relation to the neighbors and and are the angles and distances of pairwise neighbored cells, respectively. For instance, is the influence factor of cell due to the influence of the neighbors and , where three aligned hemispherical shaped cells denoted as , , and with respect to the flow direction are subjected to a certain flux velocity and have distances and between and and and , respectively. Table I shows the influence factors and for different distances obtained from the simple case of two aligned cells. is the influence factor of the anterior cell due to the influence of the posterior and vice versa.
TABLE I.
Influence factor for a two-cell-setup.
| Distance [μm] | ||
|---|---|---|
| 25 | 0.9118 | 0.5911 |
| 50 | 0.9585 | 0.7838 |
| 75 | 0.9755 | 0.8781 |
We used the influence factors of a two-cell setup, e.g., the setup given in Table I with the distance d between two hemispherical cells, in order to predict the influence factors of three- and four-cell setups. We changed systematically the flux velocities and the distances between the cells, and thus, we are able to observe a systematic correlation of the influence factors of multiple neighboring cells and corresponding sets of pairs of cells. We tested two quantitative formulas to approximate the influence factor of multiple cells by combinations of pairs, the entitled “product rule” and the “neighborhood rule.” The latter is a special case of the product rule (PR). These rules are a first order approximation of the influence factors of multiple neighboring cells based on the superposition of the influence factors of two-cell cases.
Product rule
Let be a set of the same shaped, aligned cells with pairwise distances subjected to a shear flow. The influence factor of the j-th cell can be approximated by the product rule
| (14) |
where , , and .
Neighborhood rule
Imagine the same situation as described before for the product rule upon the condition that merely the nearest neighbors of the observed cell are located within its critical distance . The influence factor of the j-th cell can be approximated by the neighborhood rule (NR)
| (15) |
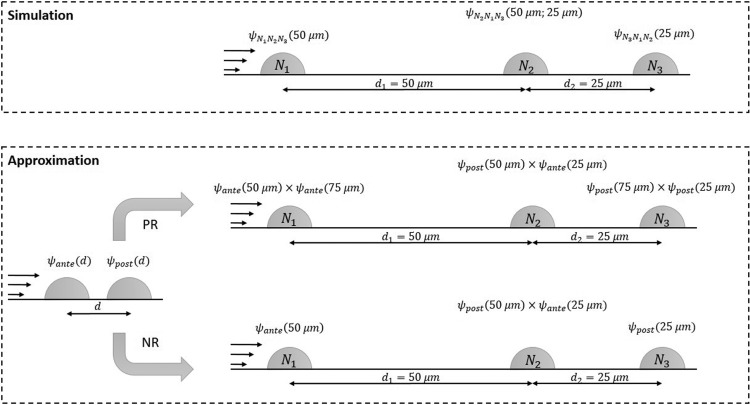
Table II in combination with Fig. 8 exemplarily shows a demonstration of both the rules applied to three aligned cells denoted , , and with distances and . Comparison of the calculations with the results of the simulations confirms that both the product and neighborhood rule are good first order approximations. We were able to predict the influence factors of a three-cell-setup by the use of the influence factors of a simple two-cell-setup (Table I). Generally speaking, the error decreases with decreasing flux velocity and never occurred to be higher than 9%. If applied to cell populations under flow, we thus recommend to use the neighborhood rule rather than the product rule to simplify the evaluations. However, only neighbors within the critical distance have to be taken into account.
TABLE II.
Comparison between Product and Neighborhood rule for a three-cell-setup.
| Simulation | Delta [%] | Delta [%] | Delta [%] | |||
| 0.9551 | 0 | 0.7116 | 0 | 0.5630 | 0 | |
| Product rule | ||||||
| 0.93504 | 2.14 | 0.71467 | 0.43 | 0.519057 | 8.47 | |
| Neighborhood rule | ||||||
| 0.9585 | 0.36 | 0.71467 | 0.43 | 0.5911 | 5.00 |
FIG. 8.
Schematic representation of the discussed approximations “product rule” (PR) and “neighborhood rule” (NR). The influence on a cell in a situation of multiple neighboring cells is reduced to a product of all included two cell situations (PR) or the product of the influence factors of two-cell-situations with the nearest neighbor(s) of the studied cell.
Application to cell density
Previously, the results of both two-cell and multi-cell ensembles were presented thoroughly. Here, we apply these results on modelled sparsely and densely distributed cell monolayers subjected to flow in order to investigate the relationship between the influence factor and the cell density.
Modelling cell monolayers
The inset of Figure 9 shows a schematic image of an exemplarily modelled cell monolayer. For simplicity, the model assumes that the quantity of cells is a square number. Therefore, the cells can be evenly distributed on a chess-like field on an area of 1 mm2. Consequently, the parameter “cell density ” has the unit cells/mm2. The lateral cell-to-cell distances are defined as and the diagonal distances are . The following formulae are derived by means of fundamental Euclidian geometry
-
•
-
•
-
•
-
•
-
•
where and provide the abundance of lateral and diagonal distances, respectively, and is the average distance between the cells in the monolayer determined by a weighted arithmetic mean. In this model, the average cell distance depends merely on the cell density . This model does not necessarily mimic a real situation but it is a reasonable approximation. Additionally, allowing to approach small values models indeed a confluent monolayer.
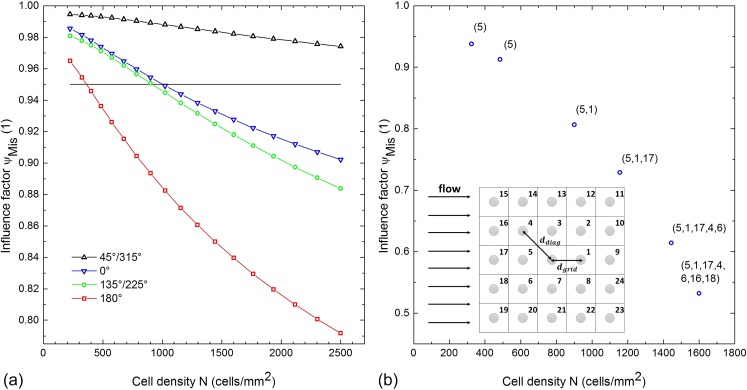
FIG. 9.
(a) Influence factor is plotted as a function of the cell density for various angles . The influence on cells due to their neighborhood increases with increasing cell density. In this example, 2500 cells/mm2 represents a “confluent” monolayer while the cell shape remained constant. (b) Influence factor of an arbitrary cell within an evenly distributed monolayer is plotted as a function of the cell density. The neighboring cells are labelled with a number as depicted in the inset. The numbers in parentheses next to the values indicate the influencing neighbors which contribute to the influence factor of the arbitrary cell determined by the neighborhood rule. Both the quantity and the influence on the arbitrary cell increase with increasing cell density.
Variation of cell density
Figure 9(a) shows the von-Mises influence factor plotted as a function of the cell density for different angles . The cells are hemispherical shaped and are distributed according to the model. We obtained the influence factor for each cell density by evaluating the corresponding average distance in the two-cell ensemble data, which provides information about distance dependencies (e.g., Figs. 3(b) or 5). The results clearly show that the influence of neighboring cells increases with increasing density for all the angles. The influence is more pronounced for . The cell density 2500 cells/mm2 represents the “confluent case” where the cells are barely touching each other but still retaining their shape. The horizontal line sets an arbitrary threshold (here ), indicating the cell densities at which the cell neighborhood can be considered as relevant. In this example, the case is not shown as the influence factor equals 1 for all cell densities .
Figure 9(b) shows the influence factor of an arbitrary cell located in a monolayer of various cell densities. As previously, the cells are again hemispherical shaped and distributed according to the model. All the neighbors in the vicinity of the arbitrary cell are labelled with numbers (s. inset). We determined the influence factors in the following way: similar to Fig. 9(a), we set the (arbitrary) threshold to . Then, we determined the critical area which depends on the critical distance which in turn depends on the angle (Fig. 7(a)). After this, we checked which neighboring cells are located within the critical area of the observed cell. The numbers given in parentheses next to the value describe the neighboring cells located in the critical area, thus influencing the observed cell. Finally, we obtained the influence factors by employing the neighborhood rule meaning that we multiplied the individual influence factors of all influencing neighbors given in parentheses. The data of the individual influence factors, which depend on the distance and angle with respect to the observed cell, are also obtained from the two-cell ensemble simulations. The graph clearly shows that both the quantity of influencing neighbors and the influence on the observed cell increase with increasing cell density. Also with increasing cell density, as expected, the area formed by the influencing neighbors approaches the critical area similar to Figure 7(a). The presented model and the neighborhood rule have the power to predict both the influence factor of an arbitrary cell and the quantity and the location of the influencing neighbors. To conclude, the results show that the influence on a cell by its neighborhood drastically increases with increasing cell density. Hence, the cell density is a crucial parameter which needs to be taken into account for cell deadhesion studies as the likelihood of deadhesion, amongst others, depends on flow induced shear stress which in turn depends on the neighborhood of a cell.
CONCLUSION
Our results show that cells within a neighborhood of a cell influence the forces, stresses, and deformations of all the involved cells. For example, in the simplest case of two cells aligned behind each other parallel to the flow direction within a distance of one cell radius, the maximal vertical stress within the posterior cell is reduced up to 35% compared to a single cell in the same flow field. With increasing distance, the influence on the posterior cell decreases strongly over a distance of eight cell radii, while the influence on the anterior one is already negligible for a distance of four cell radii. The angle dependency of the influence factor for maximal vertical stress shows a symmetric periodical trend varying between 0.65 and 1.05 for a distance of 2.5 radii and a velocity of 0.2 m/s at the inlet at the height of the highest point of the cell. The case of multiple neighboring cells in a first order approximation can be reduced to a superposition of two-cell-situations, where only the nearest neighbors within the critical distance have to be taken into account. As a function of the cells' elasticity, the impact factor as a function of Young's modulus of the cells decreases exponentially with a decay modulus of about 1.7 kPa. Moreover, we showed that the overall stress acting on a cell shows qualitatively very similar dependencies on geometry and flow conditions as the local extremal values. As the main effect is caused by hydrodynamic shielding, our results are quite universal and widely independent of the material properties. The influence of neighboring cells in an evenly distributed monolayer increases significantly with increasing cell density. Therefore, the cell density is an important parameter that needs to be considered in terms of flow induced cell deadhesion. Additionally, the location and the number of influencing neighbors as well as the influence factor of an arbitrary cell within a monolayer can be predicted using the results presented here.
Summing up, here we have demonstrated that the cell density in all studies on flow induced detachment of adherent cells is a crucial parameter, which should be taken into account for the interpretation of in vitro flow chamber experiments as particularly the force on bonds in the adhesive belt of a cell can be reduced significantly by up to 50% due to the presence of neighboring cells. Employing the results presented here allows us to estimate the relevant neighborhood of each cell and calculate the effective acting shear forces in various types of studies on cell populations under flow. Future studies on experimental setups could include the biological response of the cells and could allow us to determine their ability to adapt to shear forces under physiological conditions and beyond.
ACKNOWLEDGMENTS
The authors would like to acknowledge funding by Nanosystems Initiative Munich (NIM) and the Center for NanoScience (CeNS) for financial support for this project. The authors thank Professor Malte Peter for fruitful discussions and Alexander Hupfer for technical support.
References
- 1. Zhu C., J. Biomech. 33, 23 (2000). 10.1016/S0021-9290(99)00163-3 [DOI] [PubMed] [Google Scholar]
- 2. Weiss L., Exp. Cell Res. 8, 141 (1961). 10.1016/0014-4827(61)90345-7 [DOI] [PubMed] [Google Scholar]
- 3. Benoit M. and Gaub H. E., Cells Tissues Organs 172, 174 (2002). 10.1159/000066964 [DOI] [PubMed] [Google Scholar]
- 4. Lekka M. and Laidler P., Nat. Nanotechnol. 4, 72 (2009). 10.1038/nnano.2009.004 [DOI] [PubMed] [Google Scholar]
- 5. Dimitriadis E. K., Horkay F., Maresca J., Kachar B., and Chadwick R. S., Biophys. J. 82, 2798 (2002). 10.1016/S0006-3495(02)75620-8 [DOI] [PMC free article] [PubMed] [Google Scholar]
- 6. Gavara N. and Chadwick R. S., Nat. Nanotechnol. 7, 733 (2012). 10.1038/nnano.2012.163 [DOI] [PMC free article] [PubMed] [Google Scholar]
- 7. Olivier L. A. and Truskey G. A., Biotechnol. Bioeng. 42, 963 (1993). 10.1002/bit.260420807 [DOI] [PubMed] [Google Scholar]
- 8. Dong C. and Lei X. X., J. Biomech. 33, 35 (2000). 10.1016/S0021-9290(99)00174-8 [DOI] [PubMed] [Google Scholar]
- 9. Lu H., Koo L. Y., Wang W. M., Lauffenburger D. A., Griffith L. G., and Jensen K. F., Anal. Chem. 76, 5257 (2004). 10.1021/ac049837t [DOI] [PubMed] [Google Scholar]
- 10. Uchida T., Suzuki T., and Shiokawa S., in Proceedings of the IEEE International Ultrasonics Symposium (1995), p. 2. [Google Scholar]
- 11. Fillafer C., Ratzinger G., Neumann J., Guttenberg Z., Dissauer S., Lichtscheidl I. K., Wirth M., Gabor F., and Schneider M. F., Lab Chip 9, 2782 (2009). 10.1039/b906006e [DOI] [PubMed] [Google Scholar]
- 12. Schmid L., Wixforth A., Weitz D. A., and Franke T., Microfluid. Nanofluid. 12, 229 (2012). 10.1007/s10404-011-0867-5 [DOI] [Google Scholar]
- 13. Hartmann A., Stamp M., Kmeth R., Buchegger S., Stritzker B., Saldamli B., Burgkart R., Schneider M. F., and Wixforth A., Lab Chip 14, 542 (2014). 10.1039/C3LC50916H [DOI] [PubMed] [Google Scholar]
- 14. Stamp M. E. M., Jötten A. M., Kudella P. W., Breyer D., Strobl F. G., Geislinger T. M., Wixforth A., and Westerhausen C., Diagnostics 6(4), 38 (2016). 10.3390/diagnostics6040038 [DOI] [PMC free article] [PubMed] [Google Scholar]
- 15. Reboux S., Richardson G., and Jensen O., Proc. R. Soc. London, Ser. A 464, 447 (2008). 10.1098/rspa.2007.0210 [DOI] [Google Scholar]
- 16. Hodges S. R. and Jensen O. E., J. Fluid Mech. 460, 381 (2002). 10.1017/S0022112002008340 [DOI] [Google Scholar]
- 17. Liu X. H. and Wang X., J. Biomech. 37, 1079 (2004). 10.1016/j.jbiomech.2003.11.015 [DOI] [PubMed] [Google Scholar]
- 18. Chang K.-C., Tees D. F. J., and Hammer D. A., Proc. Natl. Acad. Sci. 97, 11262 (2000). 10.1073/pnas.200240897 [DOI] [PMC free article] [PubMed] [Google Scholar]
- 19. Megali G., Pellicanò D., Cacciola M., Calarco F., De Carlo D., Laganà F., and Morabito F. C., in Proceedings of the COMSOL Conference 2009, Milan (2009). [Google Scholar]
- 20. Mefti N., Haussy B., and Ganghoffer J. F., Int. J. Solids Struct. 43, 7378 (2006). 10.1016/j.ijsolstr.2006.05.006 [DOI] [Google Scholar]
- 21. Kamgoué A., Ohayon J., and Tracqui P., J. Biomech. Eng. 129, 523 (2007). 10.1115/1.2746374 [DOI] [PubMed] [Google Scholar]
- 22. Ohayon J. and Tracqui P., Ann. Biomed. Eng. 33, 131 (2005). 10.1007/s10439-005-8972-9 [DOI] [PubMed] [Google Scholar]
- 23. Caille N., Thoumine O., Tardy Y., and Meister J. J., J. Biomech. 35, 177 (2002). 10.1016/S0021-9290(01)00201-9 [DOI] [PubMed] [Google Scholar]
- 24.COMSOL Multiphysics, Comsol Multiphysics GmbH, 2013.
- 25. Décave E., Rieu D., Dalous J., Fache S., Brechet Y., Fourcade B., Satre M., and Bruckert F., J. Cell Sci. 116, 4331 (2003). 10.1242/jcs.00726 [DOI] [PubMed] [Google Scholar]
- 26. Cao Y. F., Bly R., Moore W., Gao Z., Cuitino A. M., and Soboyejo W., J. Mater. Sci. Med. 18, 103 (2007). 10.1007/s10856-006-0667-8 [DOI] [PubMed] [Google Scholar]
- 27. Rosenbluth M. J., Lam W. A., and Fletcher D. A., Biophys. J. 90, 2994 (2006). 10.1529/biophysj.105.067496 [DOI] [PMC free article] [PubMed] [Google Scholar]
- 28. Sato H., Kataoka N., Kajiya F., Katano M., Takigawa T., and Masuda T., Colloids Surf., B 34, 141 (2004). 10.1016/j.colsurfb.2003.12.013 [DOI] [PubMed] [Google Scholar]
- 29. Simon A., Cohen-Bouhacina T., Porté M. C., Aimé J. P., Amédée J., Bareille R., and Baquey C., Cytometry, A 54, 36 (2003). 10.1002/cyto.a.10052 [DOI] [PubMed] [Google Scholar]
- 30. Dulińska I., Targosz M., Strojny W., Lekka M., Czuba P., Balwierz W., and Szymoński M., J. Biochem. Biophys. Methods 66, 1 (2006). 10.1016/j.jbbm.2005.11.003 [DOI] [PubMed] [Google Scholar]


